
Abstract
In this research work, a new multilayer fuzzy inference system is proposed for diagnosis of renal cancer. This proposed automated diagnosis of renal cancer using multilayer Mamdani fuzzy inference system can help to classify the different stages of renal cancer such as no cancer, stage 1, stage 2, stage 3 or stage 4 cancer. This expert system has four input variables at layer 1 and similarly seven input variables at layer 2. At layer 1, the input variables are smoking, dialysis, occupational exposure and genetic or hereditary that recognize the output conditions of renal or kidney to be normal or to have renal cancer. The further input variables for layer 2 are haematuria (blood in urine), red blood cell count, flank pain, tumor size, Von Hippel-Lindau gene, high blood pressure and trichloroethylene exposure that reveal the output condition of kidney such as stage 1 cancer, stage 2 cancer, stage 3 cancer or stage 4 cancer. The novelty in this research work is development of multilayer fuzzy inference system that deals with fuzzy values, uncertain and ambiguous data to detect the stage of renal cancer by using two layers. This paper presents an analysis of results accurately using the proposed expert system to model the renal cancer process with medical expert advice. The confidence indicator for this proposed expert system is 95%.
Introduction
The analysis of disease is very essential in the domain of healthcare and medicine. Also, the detection of disease at an early stage needs more attention and undoubtedly it becomes important [1, 2]. Similarly, the detection of renal or kidney cancer at an early stage is also important so that it can help patients to get the right cure and care at the right time which will lead to better health. Otherwise, it will affect the paired organs [3].
As the kidney helps to maintain the homeostatic balance of fluids and solute in the body of human beings, also it helps to remove the waste products from the blood and to control blood pressure in the human body. These main tasks make kidneys the most essential and vital organs of the human body [4]. There are certain questions like What are the major biomarkers for renal cancer and the risk factors of kidney cancer? How the identification and verifications of these biomarkers can be done? What are the main causes of renal cancer? To answer these types of questions, it needs much knowledge about renal or kidney cancer and also the past report or history of an individual patient. Hence, it is very crucial to detect and analyze renal cancer at the right time and to identify those conditions that cause renal cancer [5].
Renal cancer originates from the lining in the small tubes of kidneys which transport the urine. The cells of the kidney become cancerous and it grows out of control with time and age. These cancerous cells are then formed into the tumor or lump if the unwanted growth of kidney cells is not controlled at a proper time. This type of renal cancer is known as renal cell carcinoma (RCC). Renal cell carcinoma often stays in the kidney, bit if the growth will not be terminated at the time, it can spread to bones, brains and other organs of the body that are near to the kidneys.
In worldwide, kidney cancer has the 10th position among all the cancers in men as well as in women. The main cause of kidney cancer is smoking which concludes that men have a higher risk of being suffering from this disease than women. The other symptoms can be obesity, excessive alcohol consumption, hypertension, and low physical activity [6]. The kidney failure can be caused due to hypertension and high blood pressure and these symptoms are also known as ‘silent killer’ [7]. Additionally, the renal tumor is one of the main causes of renal cell carcinoma (RCC) [8]. Renal cell carcinoma is a category of renal cancer and out of 10, 9 are those cases in which the type of kidney cancer is renal cell carcinoma (RCC) [9]. Kidney cancer can be caused due to genetic or hereditary genes. There are 3% to 5% cases, where kidney cancer is caused due to hereditary genes. The result of identification is that there are 12 different types of the gene that cause kidney cancer and this number increases with time[10, 11]. Re-occurrence of renal cancer is also possible after a couple of years have been passed after diagnosis. Hence, it is necessary to monitor the health of patient with regular check-ups [12].
To diagnose renal cancer, many techniques have been developed by researchers. The technique which is frequently used for the detection of renal cancer is by using concept of image processing, In which the magnetic resonance image or computed tomography images were acquired and after using various image processing techniques such as segmentation, edge detection, fusion, visualization, etc the identification of renal cancer has been done [13–15]. The image features can be seized by using a histogram. After capturing features of images, the classification is done by using data mining technique[16, 17]. There are computer-assisted clinical tools, which were used to assess and classify the tumors in renal with captured computed tomography images [18]. The age and birth also affect the renal and leads to renal cancer as well as pancreatic cancer [19]. The monitoring of tumor growth in kidney or renal is mandatory. Tumor tissues are responsible for the growth of renal tumors [20]. The behavior of tumor in the kidney is also detected by Particle Automata Model. This model allows the identification and detection of tumor growth factors and this model also helps in monitoring the expansion of renal cancer [21, 22]. The Adaptive Neuro-Fuzzy Inference System is also used to predict kidney movement from skin markers having more than 94% accuracy [23].
Artificial intelligence is basically the power of the computer program to act, think and learn like a human being. It is a domain that tries to make computers “smart” so that computers or machines can also do various complex tasks without any command. It is a wide-ranging branch of computer science that makes smart machines which are capable of performing various operations that are complex and requires human intelligence to solve. It is also used to diagnose numerous types of medical problems in these days[24, 25]. Medical issues can be fixed by using intelligent systems [26]. To predict the problem and provide their solution, a fuzzy inference system is a powerful tool and an effective method to diagnose the disease [27]. At present, it is used in every domain either it is a medical domain or automatic robotics or industry [28]. The fuzzy set theory deals with the uncertainty or ambiguity in the gathered data and in the measurements of errors, hence fuzzy set theory is a powerful and effective tool to solve these types of problems [29, 30]. The ambiguity can arise during the process of gathering data and implementation. The fuzzy differential equations are also used to deal with this type of data [31, 32]. Fuzzy logic is many-valued logic, addressing the ambiguity phenomenon and modeling of developing tool is done by truth values captured from an ordered scale [33]. The knowledge of an expert is moved from an expert to an expert system. After that, this knowledge is used to conclude the solution to a particular problem. 70% problems of the medical domain are resolved by using an expert system at the present time [34].
The fuzzy logic-based systems have four main parts. These blocks of fuzzy logic-based system or fuzzy inference system are discussed below:
The research work explained above gave effective and profitable knowledge about diagnosis of renal or kidney cancer. The main intention of this research paper is to develop an automatic diagnostic system for renal cancer by adopting a multilayer Mamdani fuzzy inference system.
Method
The proposed automated diagnosis of renal cancer using a multi-layered Mamdani fuzzy inference system is elaborated in this section. Figure 1 presents the methodology for the proposed expert system.

Methodology of proposed expert system.
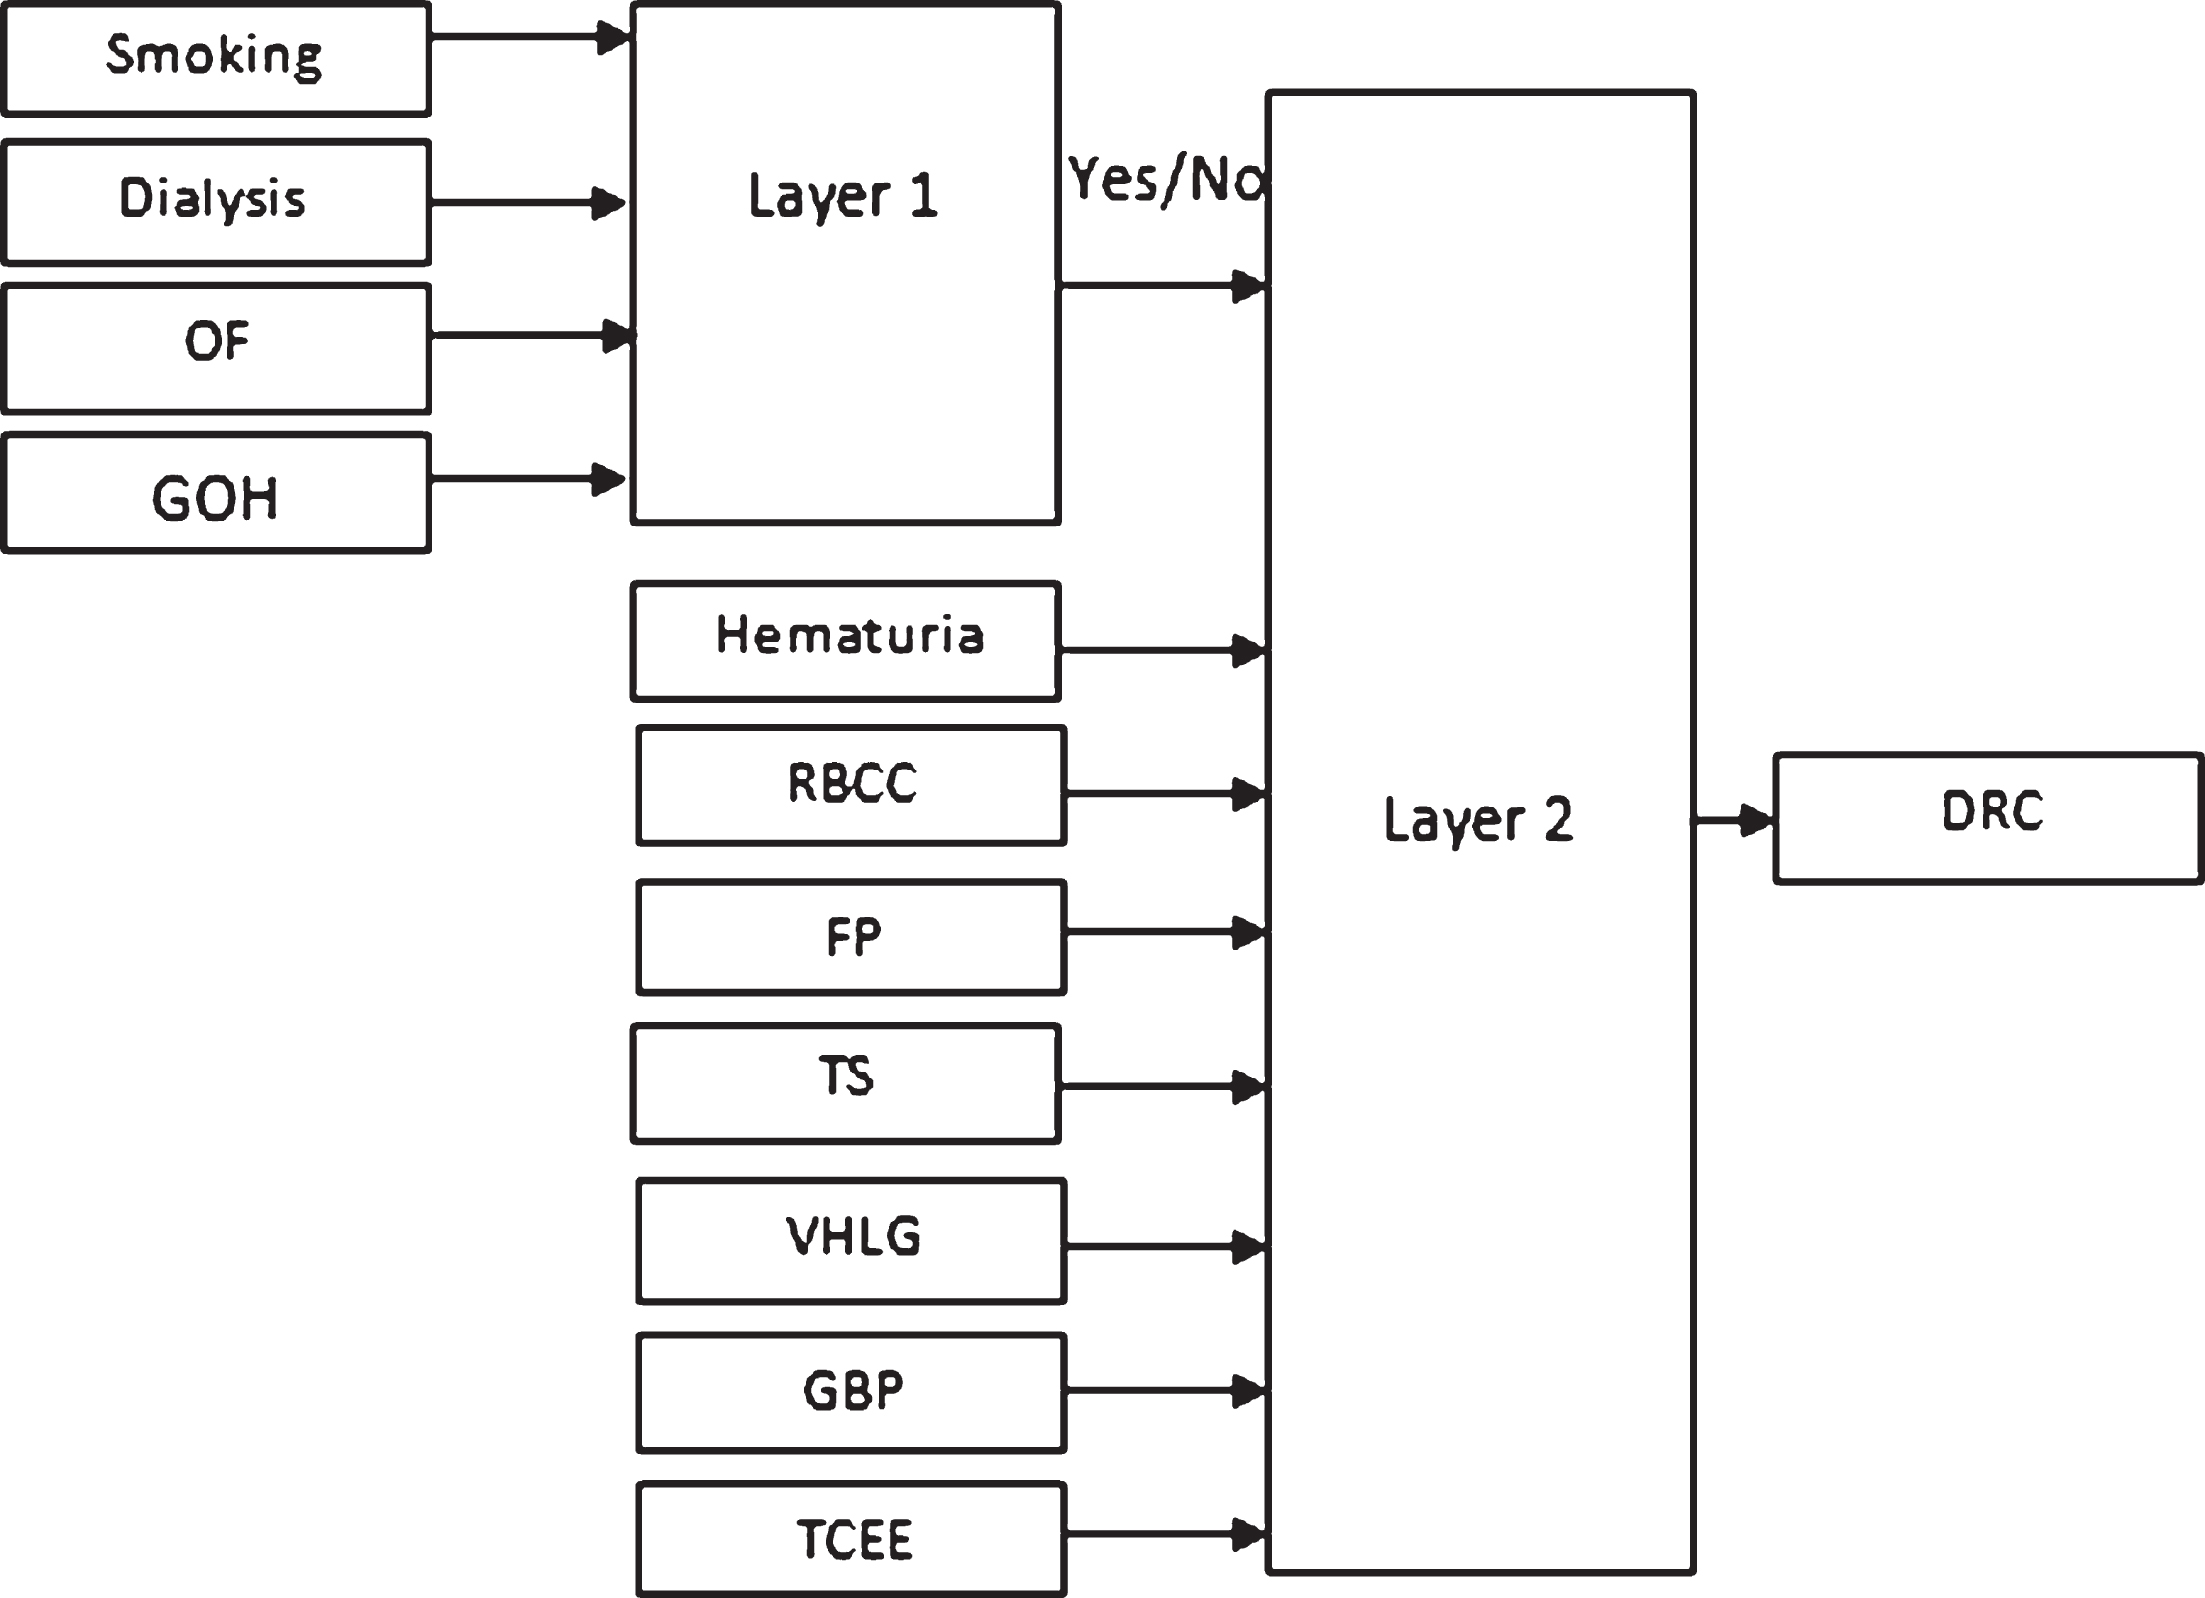
The expert system has two layers as shown in Fig. 2. In layer 1, renal cancer is identified using four input variables (smoking, dialysis, occupational exposure, genetic or hereditary) and the output of this layer will depict either there is cancer in renal or not.
Developed an ADHB-ML-MFIS expert system.
The values of these input variables are also used in Table 8 to determine the condition of renal of patients. If layer 1 of the developed expert system gives the output as there is cancer in renal only then layer 2 will be activated. Layer 2 detects the stage of renal cancer or kidney cancer on the seven input variables as shown in Fig. 2. The input and output variables of Layer 2 are shown in Table 7. The algorithm designed for the proposed work is stated below:
Define the linguistic terms and variables used in the developed model. Construct the membership functions for all variables. Create a knowledge base in which all the rules are stored. Transform the crisp data (inputs at layer 1) into the fuzzy data by using membership functions. Map the given inputs with the rules in the rule base or knowledge base. Combine the final output from each rule. Transform the calculated output from fuzzy to crisp values. Use the output of layer 1 as the input of layer 2 with the rest of the decided inputs. Convert all the inputs from crisp values to fuzzy values in the Fuzzification module. Evaluate the rules stored in the knowledge base. Merge all the results observed from each rule and calculate the final output. Convert the final output given by layer 2 from fuzzy value to non-fuzzy value.
Mathematically, the layer 1 of the proposed expert system is explained as
and similarly, the layer 2 of ADRC-ML-MFIS (automated diagnosis of renal cancer using multilayer Mamdani fuzzy inference system) expert system can be written as follows
As it is difficult to study the entire population. Therefore, the tests are applied on a sample of 30 patients out of the total population to gain some useful and fruitful information from the data. Figure 3–5 show the normality test applied by using the software MINITAB 19. The normality test used for this analysis is Anderson Darling and Ryan-Joiner’s normality test.
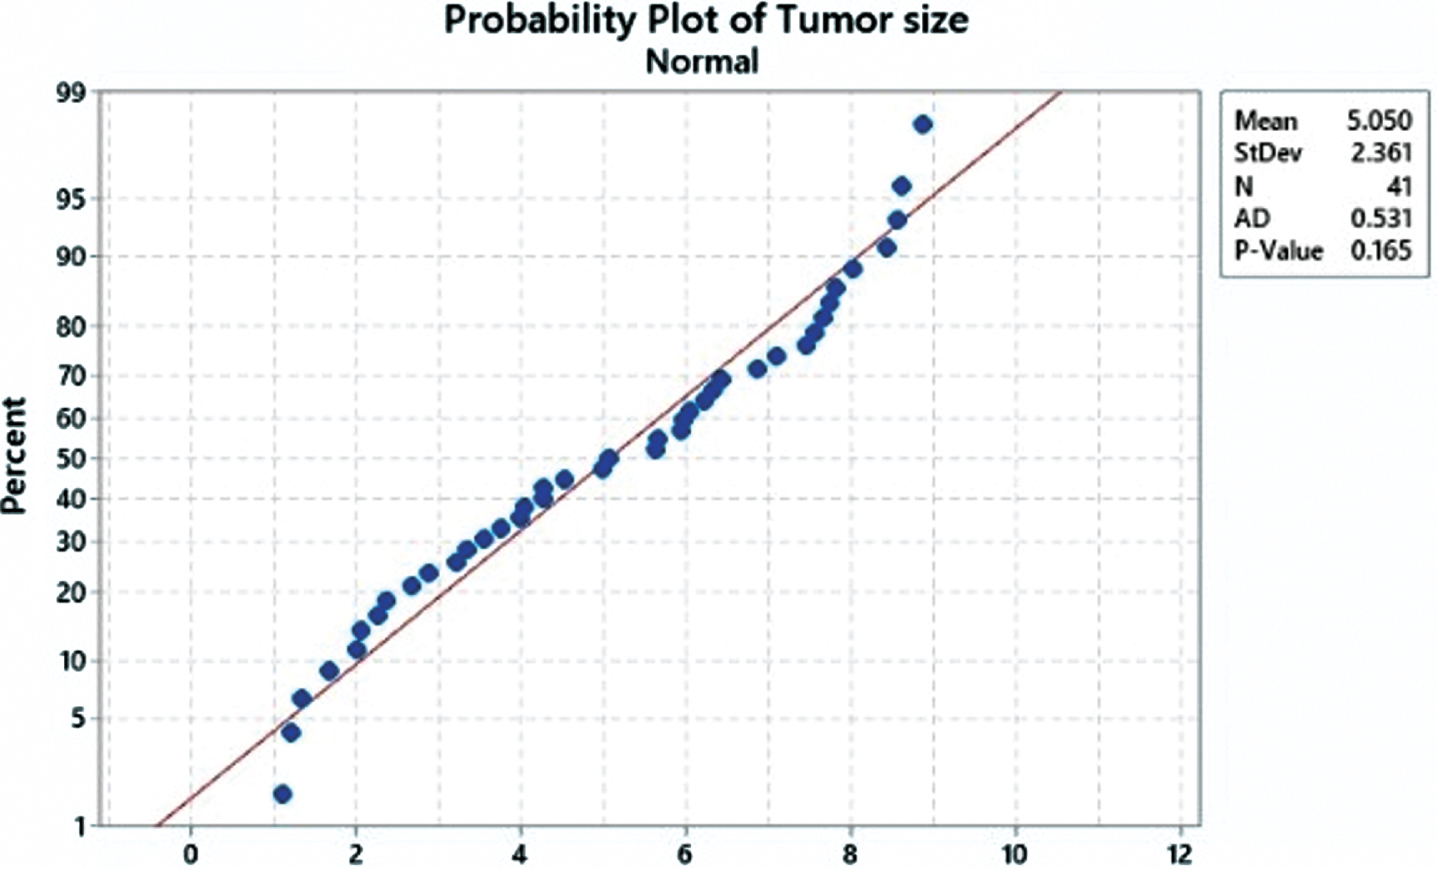
Normality test for input variable “Tumor size”.
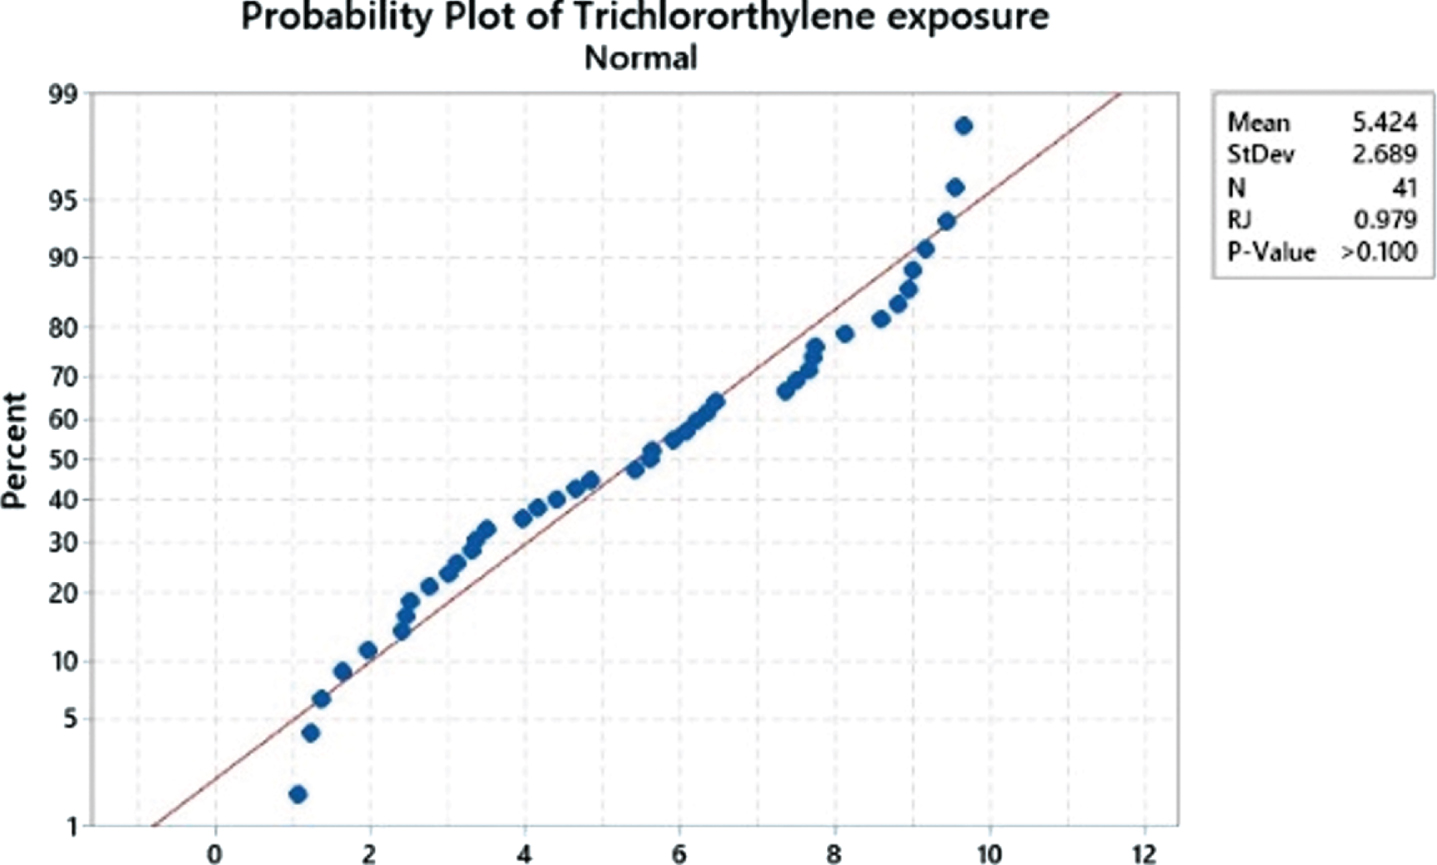
Normality test for input variable “Trichloroethylene Exposure”.
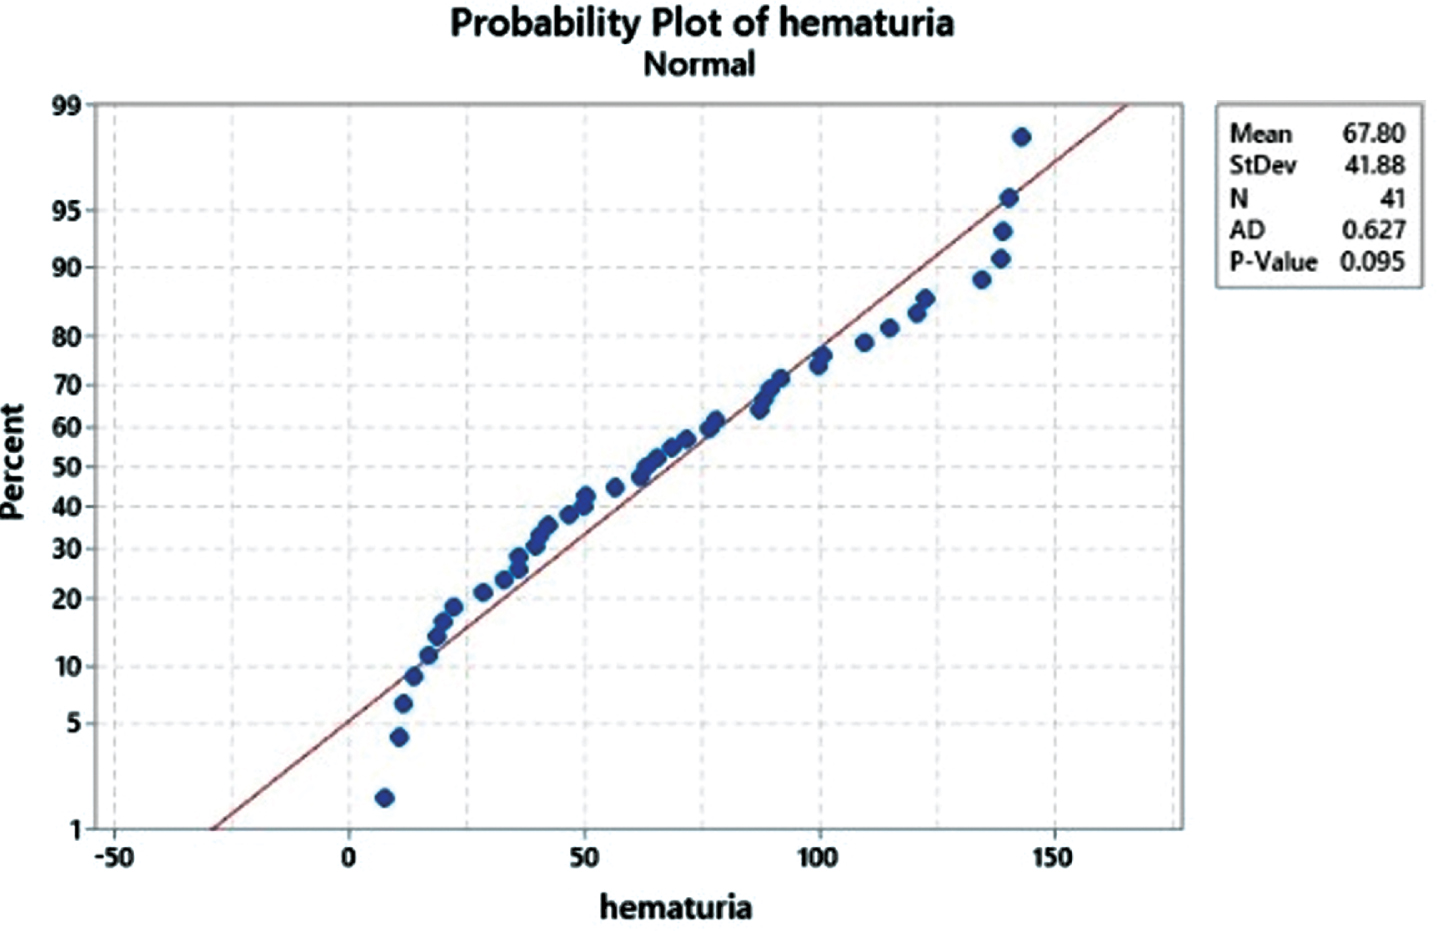
Normality test for input variable “Hematuria”.
Where n = sample size, F(X) = Cumulative distribution function for the specified distribution and i = the ith sample when the data is sorted in ascending order.
Where Y i = ordered observation, b i = normal scores of ordered data and s2 = sample variance.
Table 1 shows the required p-values using normality tests and Table 2 shows the obtained p-values by applying the normality tests. In Table 3, the various parameters for Tumor size are mentioned
Required p-values in the normality tests
Obtained p-values by applying the normality tests
Parameters for tumor size
Abbreviations of Table 1: n - Sample size; LL - Lower limit; ULL - Unilateral lower limit; UUL - Unilateral upper limit; UL -Upper limit.
Input variables are fuzzy statistical values that are used to diagnose renal cancer. In this research, there are total of eleven different kinds of input variables that are used in the detection of kidney or renal cancer on both layers. Out of these eleven input variables, four variables are used in layer 1 and the rest of the seven input variables are used in layer 2. The proper detail of these input variables with their ranges is described in Tables 4 and 5.
Input variables of layer 1 of the proposed expert system
Input variables of layer 1 of the proposed expert system
LT = less than; GT = greater than; B/W = between.
Input variables of layer 2 of the proposed expert system
LT = Less than; GT = Greater than; B/W = between.
As the proposed system is based on multi-layered architecture, therefore, Number of outputs is two. The layer 1 will give output as yes or no. If the output of layer 1 is yes, then layer 2 will be activated. The output of layer 2 will be the stage of renal cancer. The output variables of layer1 and layer 2 are described in Table 6.
Output variables of Layer 1 and Layer 2
Output variables of Layer 1 and Layer 2
The statistical values of input and output variables of both layers are provided by mathematical functions. Table 7 represents the graphical and analytical views of membership functions of input and output variables of both layers.
Input and output variables membership function used in the proposed expert system
Input and output variables membership function used in the proposed expert system
The lookup table for the proposed expert system contains the total number of 96 input-output combinations at both layers. Some of the input-output rules are shown in Table 8. This table is constructed with the help of advice from medical experts or doctors from the field of renal cancer.
Lookup table for the proposed expert system
Lookup table for the proposed expert system
The input-output rules play a vital role in development of fuzzy inference system (FIS). The performance of every expert system depends on I/O rules. A sample of I/O rules used in the developed expert system are shown in Table 8. Figure 6 and 7 also describe the I/O rules for the proposed multi-layer fuzzy expert system.
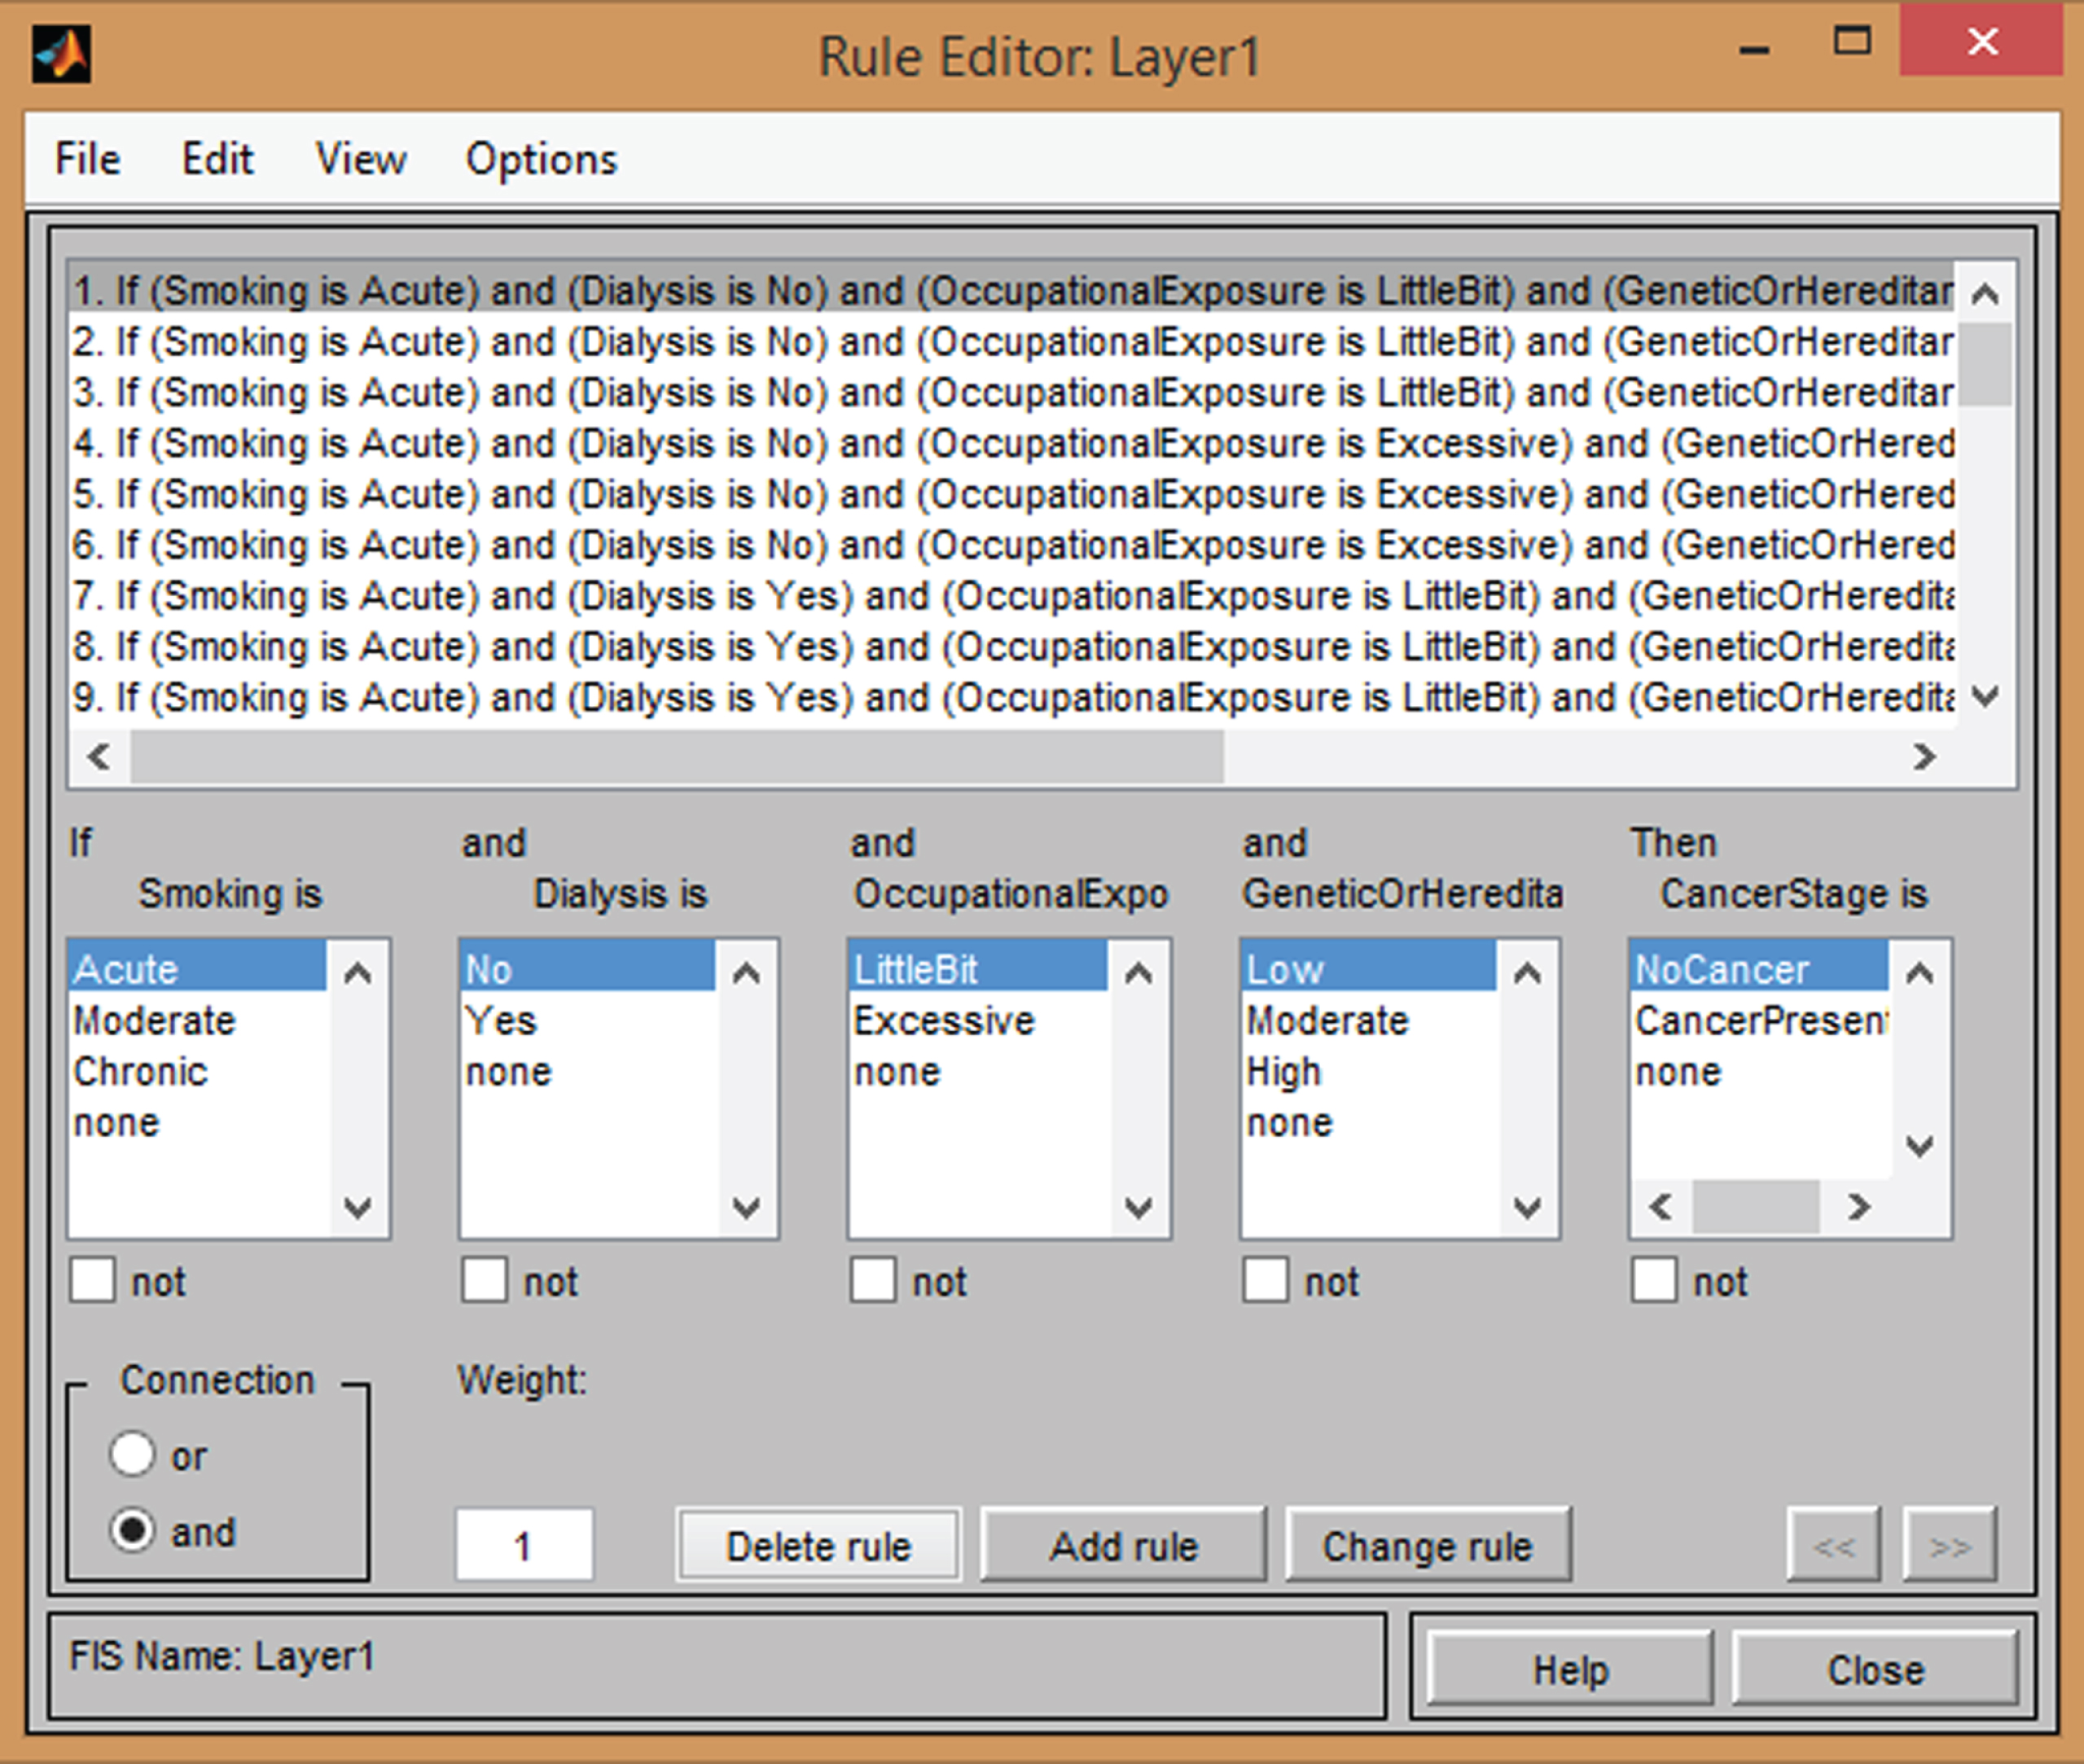
I/O rules for layer 1 of an expert system.
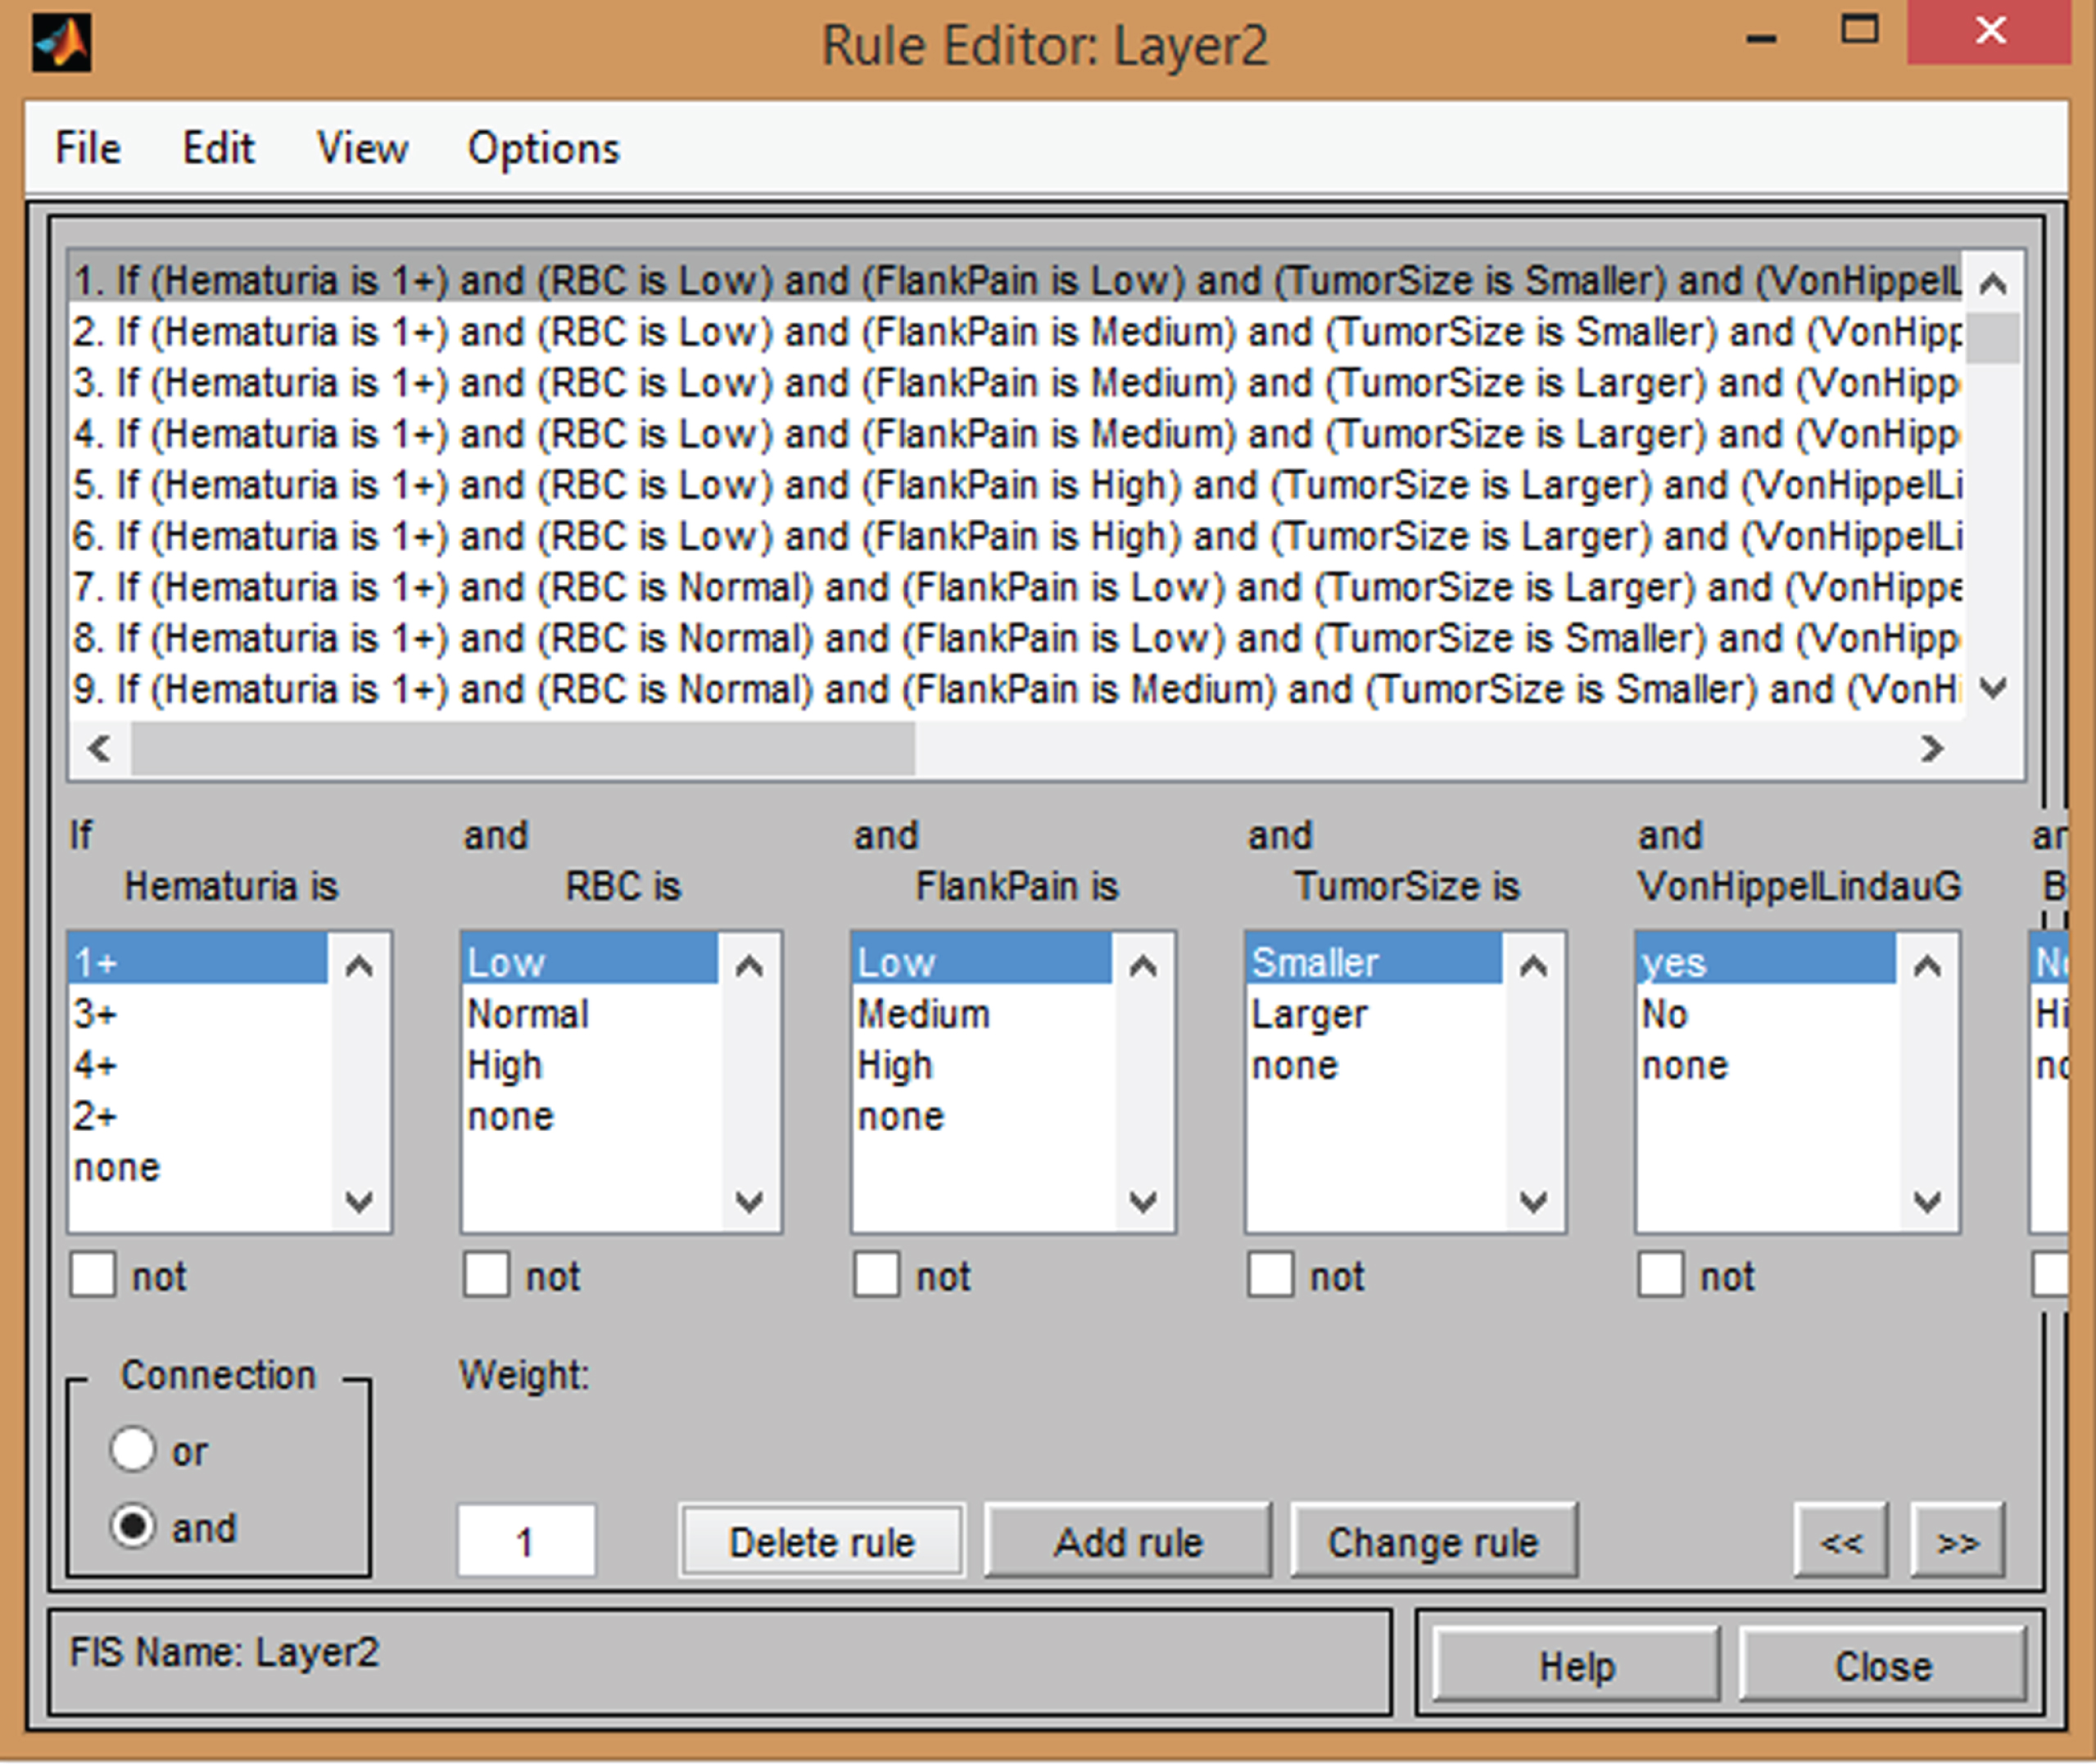
I/O rules for layer 2 of an expert system.
As the inference engine is the core part of every expert system. Hence, in this developed system, the Mamdani inference engine is used at layer 1 and layer 2.
Defuzzifier
Defuzzifier is also a crucial part of an expert system. There are different types of defuzzifiers used to develop various expert systems. In this research work, the defuzzifer used is the centroid method. Figure 8 shows the graphical view of defuzzifier of layer 1 and in Fig. 9(a)-9(c), the defuzzifier graphical representation of layer 2 expert system is shown.
Figure 8 represents the surface area of rules between two input variables used in layer 1. These two variables are smoking and genetic or hereditary. If the value of smoking is less than the value of another input variable then the result is no cancer. Hence, it is observed that if the value of smoking is less than the probability of having cancer to a patient is also less in that case. Similarly, if the value of the input variable ‘smoking’ is more than the probability of having cancer automatically increases.
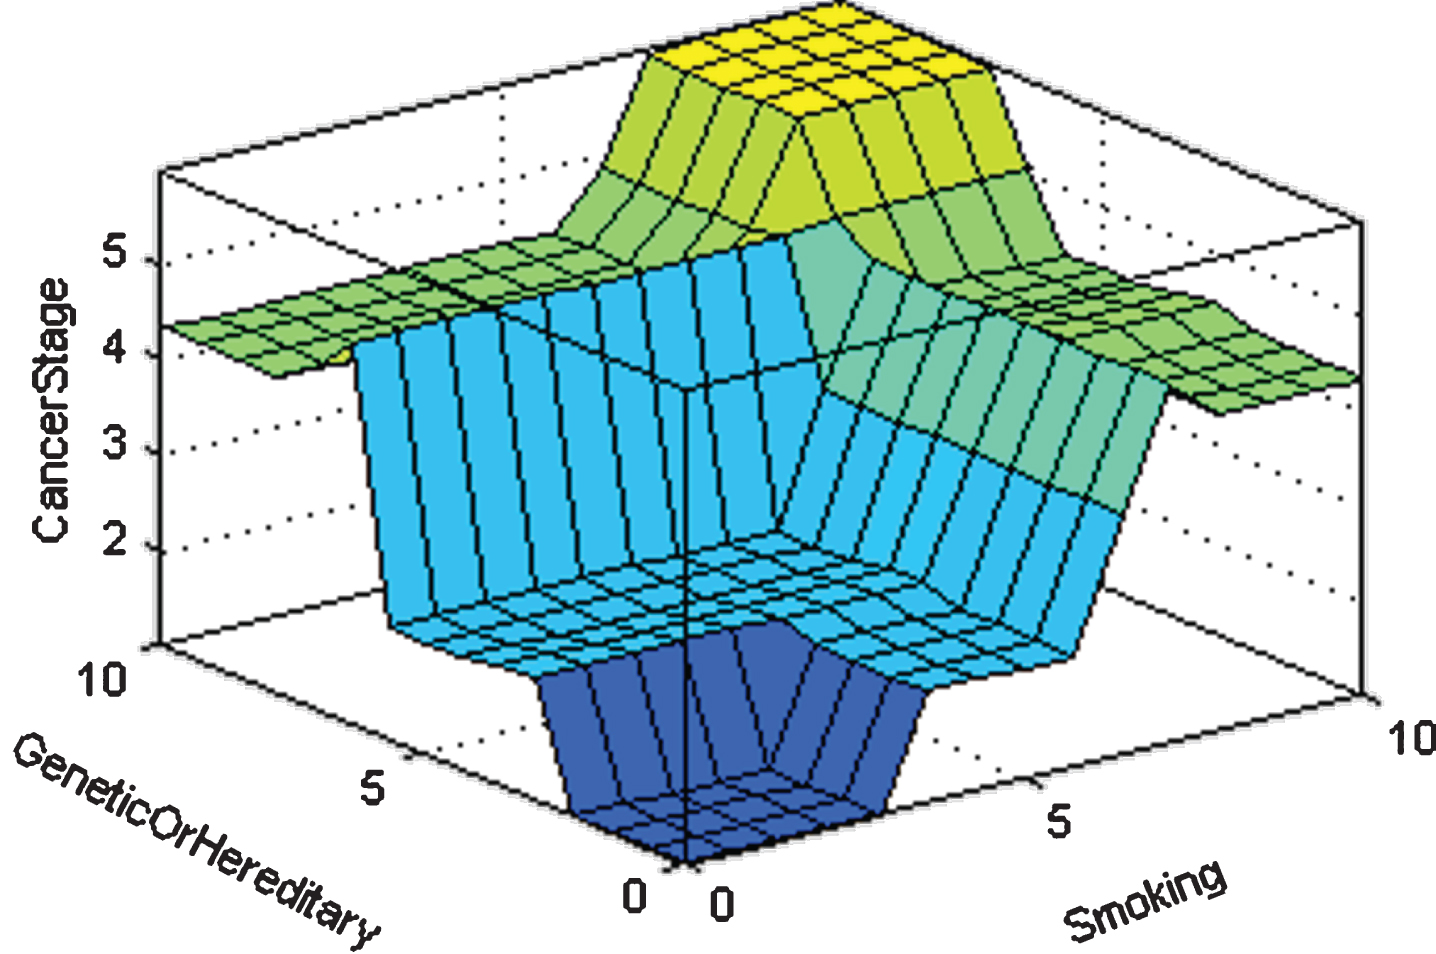
Layer 1 surface area of smoking with the genetic or hereditary symptom.
Figure 9(a) shows the cancer stage based on hematuria and tumor size. It is a three-dimensional rule surface. Two axes of this surface are representing the inputs given to the model and the third one represents the output given by the system corresponding to given inputs. There are a number of colors in the surface region which are representing the stages of renal cancer. It is observed that if the value of tumor size (y-axis) is more than the probability of renal cancer increases with an increase in the size of a tumor.
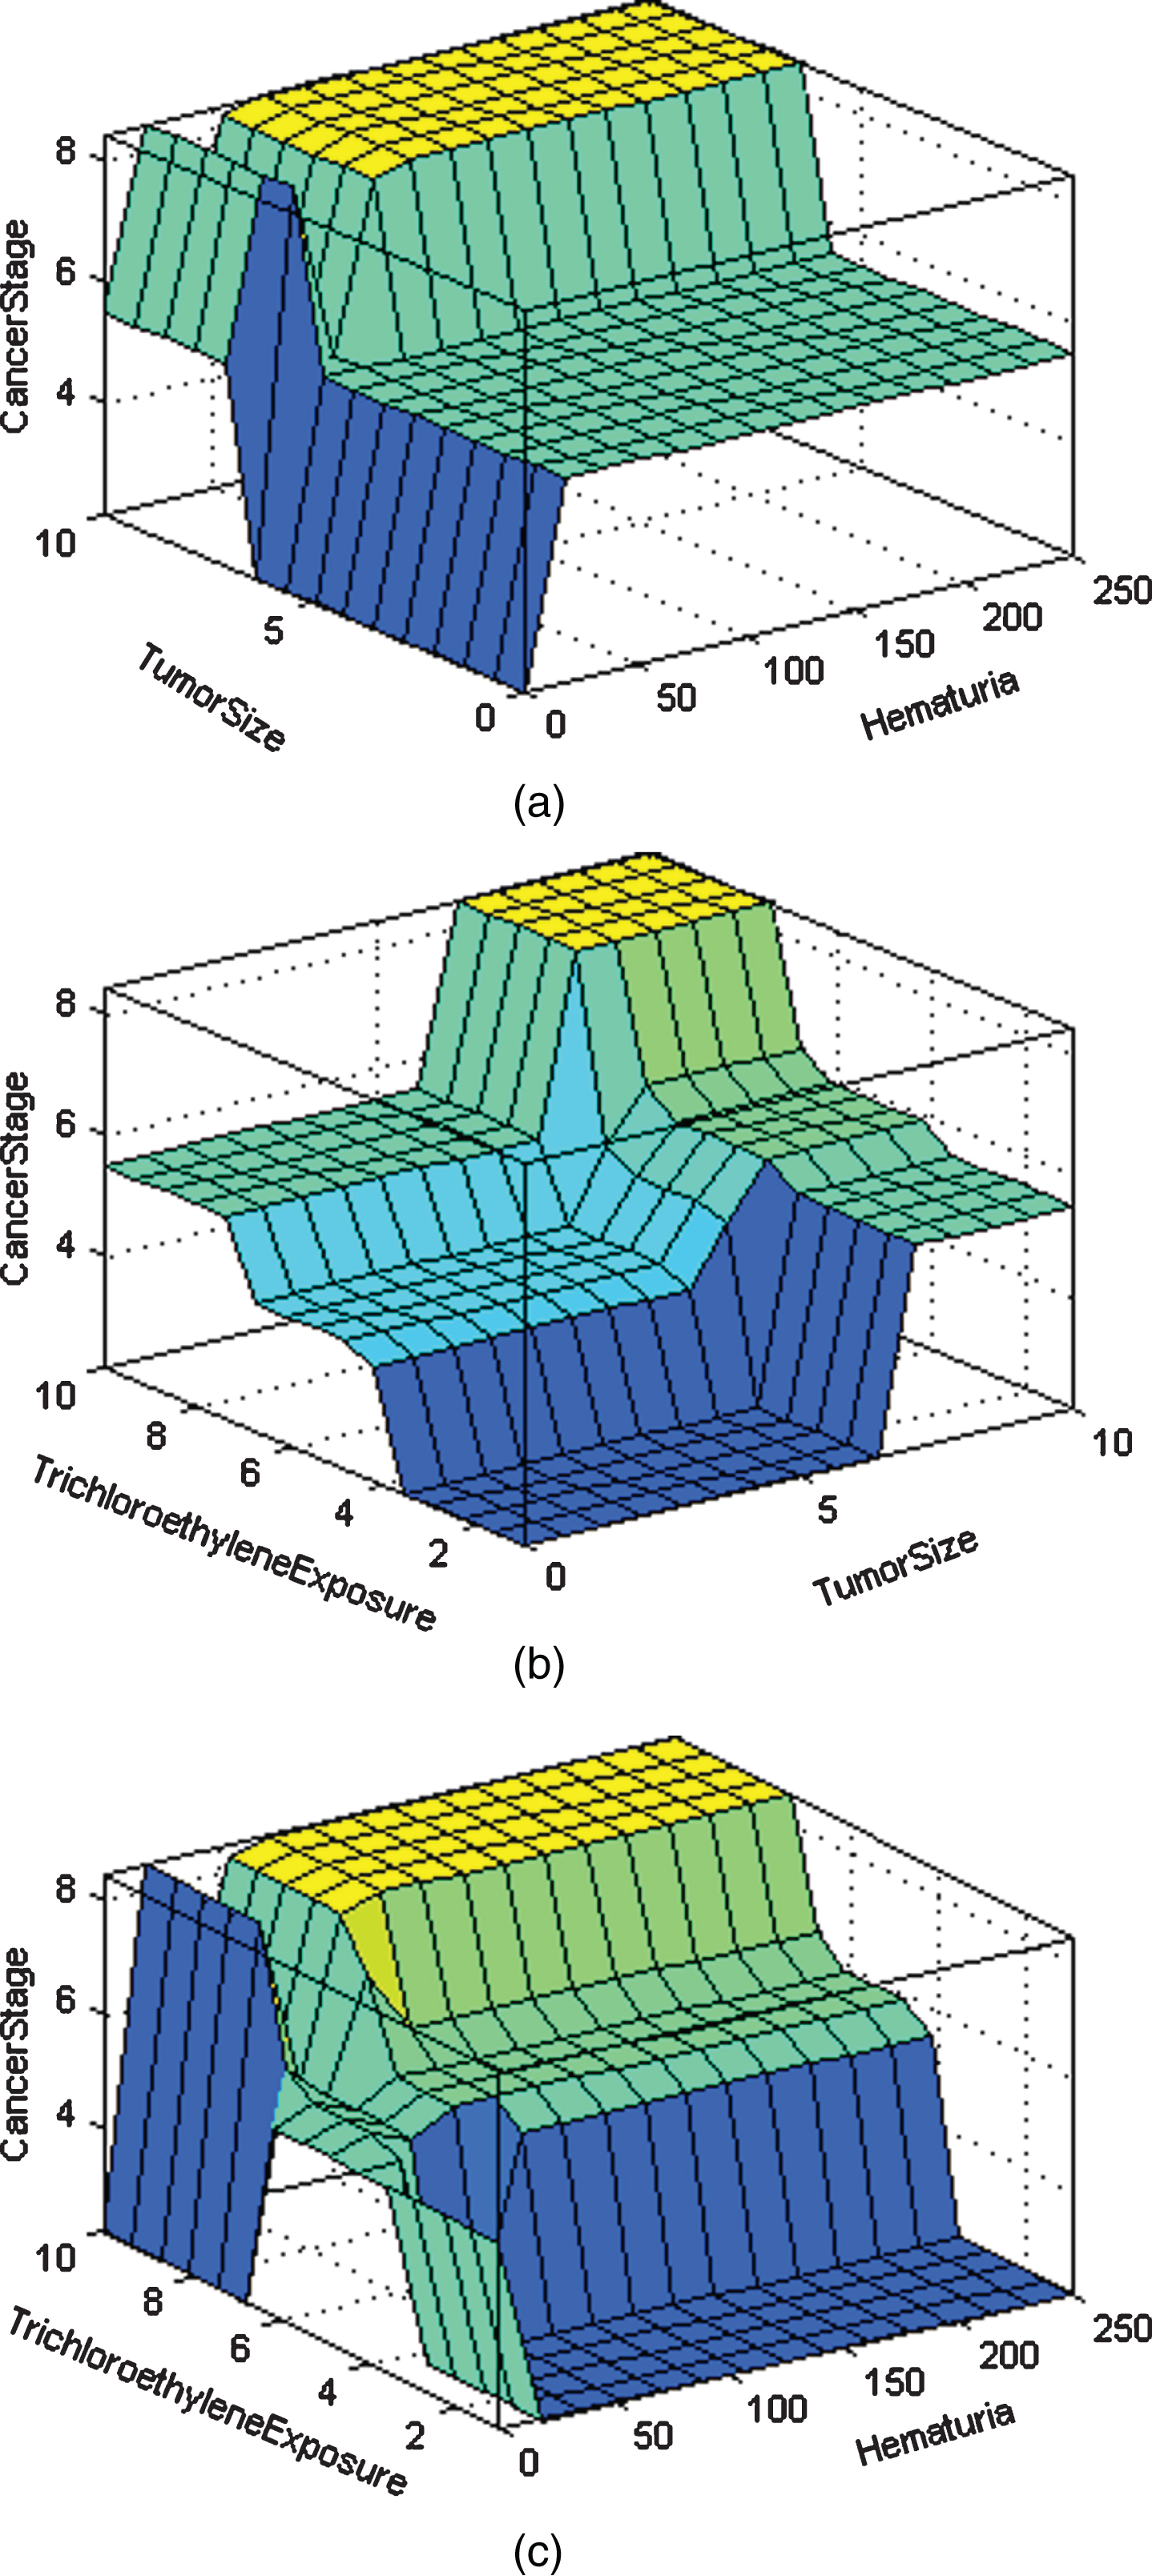
Rule surface for (a) Tumor size and Hematuria (b) Tumor size and Trichloroethylene exposure (c) Trichloroethylene exposure and Hematuria.
Similarly, Figs. 9(b) and 9(c) show the surface region of the renal cancer stage based on input variables such as tumor size with trichloroethylene exposure and hematuria with trichloroethylene exposure. As there are four colors in Fig. 9(b), these colors represent the stages of renal cancer. If the tumor size is low and also the inhalation of trichloroethylene is low then there is a blue color which means at stage 1. If the amount of the inhalation of trichloroethylene and the size of the tumor is slightly more then there is a cyan color that depicts the stage 2 of renal cancer. Similarly, the light cyan color and yellow color depicts the stage 3 and stage 4 of renal cancer respectively. Similarly, in Fig. 9(c), there is a 3-dimensional curve that presents the mapping from trichloroethylene exposure and haematuria to the output of the system i.e. stage of renal cancer. Two axes of this curve speak for the inputs and another one is for the stage of renal cancer. These surface regions represent the chance of occurrence by using two input variables from given seven input variables used in layer 2. Hence, the result of stages of renal cancer is based on the combination of basically three input variables.
MATLAB R2014a tool is used for this simulation. This tool is basically used for many domains such as the development of algorithms, prototyping and many others. It is also a very powerful tool for programming, visualization, and analysis of data. In this research work, Layer 1 shows the result that either the patient is suffering from cancer or not, and Layer2 shows stage of cancer such as stage 1, stage 2, stage 3 or stage 4. This research work is not only for the detection of renal cancer, but the proposed expert system can also depict different stages of renal cancer.
Eighty tests are captured to scrutinize renal cancer using a multilayer fuzzy inference system. The observed results from the proposed system are compared with the result given by experts or specialists. From this comparison, it was observed that out of 160 tests, 152 tests are correctly classified into the correct class by the developed inference system.
The confusion matrix is shown in Table 9. 160 different cases of renal cancer have been carried out for these tests. In the first column, 40 cases of stage 1 of renal cancer are considered and all of them are correctly classified i.e. stage 1. In the second column, the data of 40 patients of stage 2 of renal cancer is considered, out of which 37 are classified into stage 2 and the rest of 3 are classified into incorrect class i.e. stage 3 of renal cancer. Similarly, in the third column, 40 cases of stage 3 are considered and from these 40 cases, 36 are classified correctly in the class of stage 3 but 4 are classified into the class of stage 4 of renal cancer which is wrong. Likewise, fourth column shows that there are 40 cases of stage 4 of renal cancer, but out of 40, 1 is misclassified and 39 are classified into the correct and exact class of stage 4 of renal cancer.
Performance analysis of the proposed expert system
Performance analysis of the proposed expert system
Where:
Number of successes = 152
Total number of tests = 160
Hence, The confidence indicator for the proposed expert system is 95%.
Now, the first two stages (stage 1 and stage 2) are taken as ‘No’. Similarly, the rest of the two stages are considered as ‘Yes’. Hence, the dimensionality of confusion matrix is reduced and this reduced 2*2 matrix in shown in Table 10.
Matrix with reduced dimensionality
The performance of a multilayered fuzzy inference system for diagnosis of renal cancer is calculated by considering various parameters like accuracy, precision, specificity, and sensitivity.
From Table 11,
Confusion matrix for renal cancer
TP: True Positive is 79
FN: False Negative is 01
FP: False positive is 03
TN: True Negative is 77
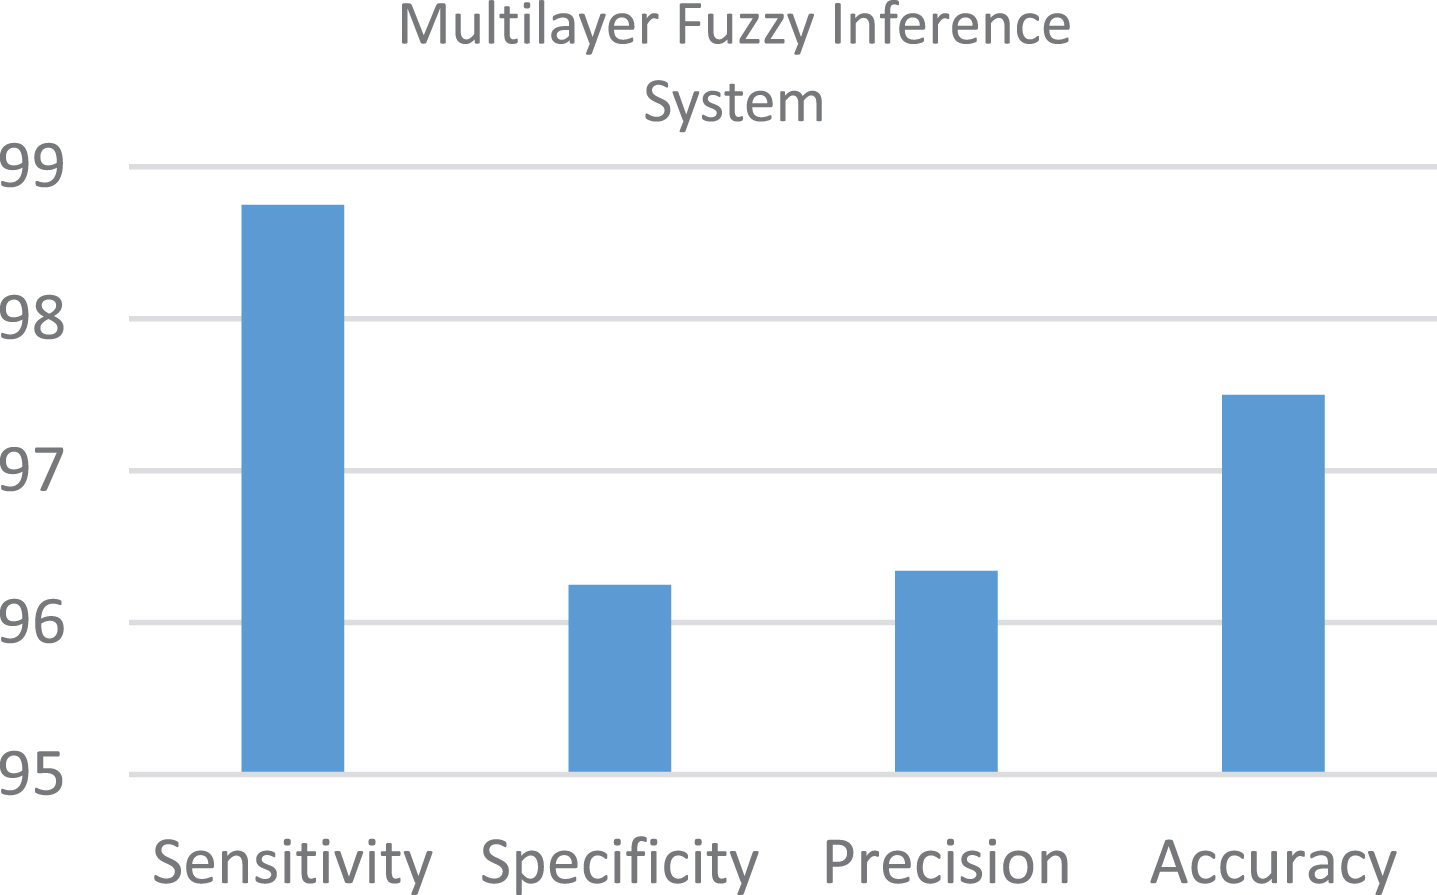
Performance parameters of proposed system.
Figure 11(a) and 11(b) show the sample of output obtained from developed expert system for renal or kidney cancer.
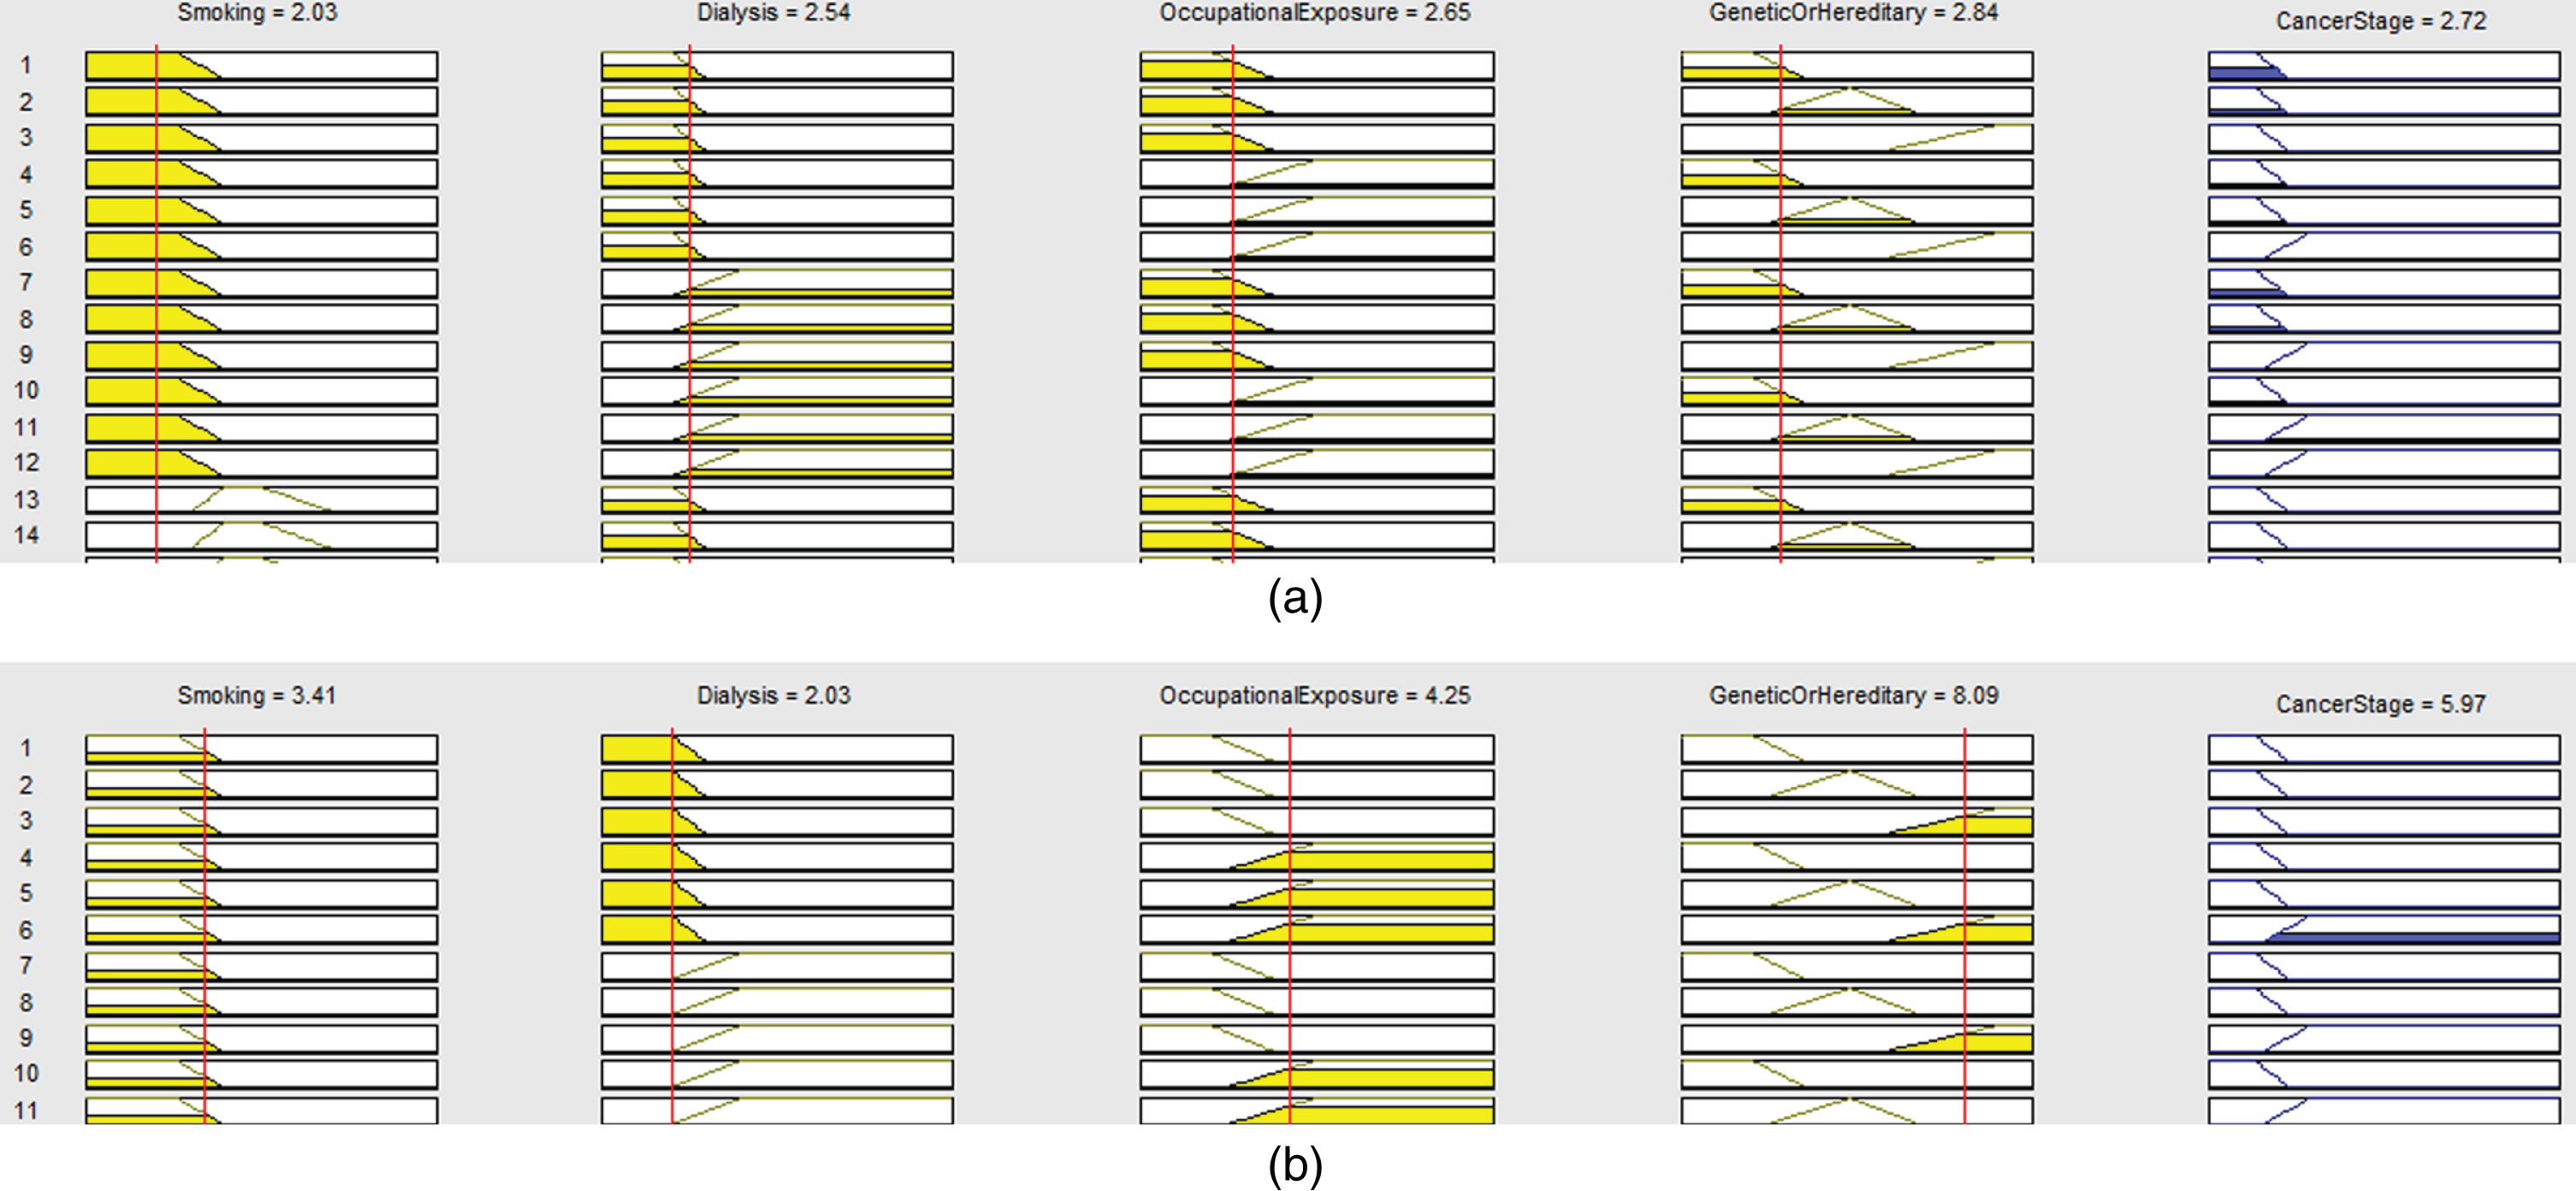
Layer 1 lookup diagram for (a) no cancer (b) presence of renal cancer.
Figure 11(a) shows that if all the input variables have normal range, then there is no renal cancer. Figure 11(b) shows if the range of input variables is more then normal then there are chances of occurrence of cancer in renal due to smoking, dialysis and other input variables used in layer 1.
The main aim of this research is to develop an expert system that can be able to diagnose renal cancer. The proposed expert system fulfills the primary objective and also this expert system is easy to use for medical and other professionals. An unexperienced person can also use this expert system to detect the stage of renal cancer by giving the required inputs. The confidence indicator achieved from this expert system is 95%.
The main limitation of this developed model is that the updation or change in rules is very difficult. The system is not able to learn by its experience and it is also not able to adapt itself according to the environment.
Therefore, in the future, performance and productivity can be improved by using other techniques like neural network and neuro-fuzzy expert system. This research can also be continued by adding more risk factors or input variables and can be used in those areas where there is a lack of resources.