
Abstract
Many recent applications such as sensor networks generate continuous and time varying data streams that are often gathered from multiple data sources with some incompleteness and high dimensionality. Clustering such incomplete high dimensional streaming data faces four constraints which are 1) data incompleteness, 2) high dimensionality of data, 3) data distribution, 4) data streams’ continuous nature. Thus, in this paper, we propose the Subspace clustering for Incomplete High dimensional Data streams (SIHD) framework that overcomes the above clustering issues. The proposed SIHD provides continuous missing values imputation for incomplete streams based on the corresponding nearest-neighbors’ intervals. An adaptive subspace clustering mechanism is proposed to deal with such incomplete high dimensional data streams. Our experimental results using two different data sets prove the efficiency of the proposed SIHD framework in clustering such incomplete high dimensional data streams in terms of accuracy, precision, sensitivity, specificity, and F-score compared to five algorithms GFCM, GBDC-P2P, DS, Ensemble, and DMSC. The proposed SIHD improved:
Introduction
Clustering is the process of categorizing a set of objects, where elements that are closer to each other according to the distance measure are placed in the same cluster, but elements that are further from each other are placed in different clusters [1, 2]. Many applications generate incomplete data. The recent incomplete data clustering approaches are divided into two categories: 1) ignorance-based that ignores the missing values in the clustering process and depends on complete values, 2) imputation-based that estimates the missing values and applies the clustering approach to the complete version of the data. Adopting the first strategy with high missing rates decreases the clustering performance.
In many applications, objects are described by many dimensions. Applying traditional (full dimensional space) clustering over such data objects will lead to useless clustering results. Therefore, subspace clustering of such high dimensional data improves the clustering performance [3].
Most of the recent approaches deeply studied the incompleteness and high dimensionality problems of static data using different strategies, but there are some limitations of these approaches. Recently, many applications such as sensor applications generate continuous, dynamic, rapid and time varying data streams [4–6].
In practice, data streams suffer from the incompleteness and high dimensionality problems. Data stream processing presents new issues that are not addressed by traditional data management techniques. When applying clustering on data streams with such nature, some challenges are appearing. Unlike static data, the continuous and time varying data streams require continuous clustering over time. So, the clustering algorithm is needed to be applied continuously to the most recent data elements. The clustering results are updated with the continuous arrival of data streams over time.
In this paper, we propose the Subspace clustering for Incomplete High dimensional Data streams (SIHD) framework to overcome the above clustering challenges that face incomplete high dimensional data streams that gathered from multiple sources.
Firstly, the proposed SIHD produces the subspaces of the dimensions of data elements per data source for efficiently dealing with high dimensional data. Each subspace involves a subset of the total dimensions of that source. Then, per data source, the incomplete elements are processed. For each incomplete element per data source, SIHD determines the subspaces that contain missed values. Then, the k-nearest neighbors of each incomplete element per data source are determined over the subspaces of the missing values. The missing values of incomplete elements are imputed based on these k-nearest neighbors. Then, all data elements are clustered over the subspaces per data source. Finally, local results over all data sources are combined to produce the final clustering results.
The main contributions of this paper are summarized as follows. 1) An improved missing values’ imputation strategy is introduced for accurately imputation even with the data high dimensionality constraint, 2) An adaptive subspace clustering mechanism is proposed to efficiently process incomplete high dimensional data streams.
The rest of this paper is organized as follows. In Section 2: The related works to the proposed framework are introduced. In Section 3: The problem formulation is illustrated. In Section‘4: The proposed SIH framework is explained. In Section 5: The proposed algorithm is introduced. In Section 6: The experimental evaluation is presented. In Section 7: The results and analysis are discussed. In Section 8: The work of the paper is concluded.
Related work
In this section, we present the related works of our solution from three areas: 1) incomplete data processing, 2) high dimensional data clustering, 3) data streams processing and clustering.
Incomplete data processing
The multiple imputation of discrete combinations (MIDC) in [7] introduced missing values random imputations for incomplete data. The Grey based Fuzzy c-Means (GFCM) algorithm in [8] provided missing values imputation and fuzzy-based data clustering. The Model based Missing value Imputation using Correlation (MMIC) method in [9] recovered the missing values based on the average K-nearest neighbors’ values.
Algorithms in [10, 11] estimated missing values using the nearest neighbors’ intervals. A Dominance-based algorithm that proposed in [12] addressed incomplete interval-valued data. In [13] a model was proposed to impute incomplete data over limited data environments. An incomplete data imputation algorithm was proposed in [14] based on neural networks. The fuzzy-based algorithm that proposed in [15] addressed incomplete data and uncertain linguistic preference relations.
The above algorithms handled the incompleteness problem with static data based on different methods. However, there are some limitations of these algorithms. Recently, many applications have produced continuous data streams that require continuous processing. Also, most of recent applications generate high dimensional data. The above algorithms processed data over the full dimensional space. The incomplete high dimensional data stream processing was not considered using the above algorithms.
High dimensional data clustering
The proposed algorithm in [16] handled high dimensional data based on feature selection. The Information Gain based Semi-supervised subspace Clustering (IGSC) algorithm in [17] provided Semi-supervised learning of high dimensional data based on subspace Clustering. In [18] the SUBSCALE algorithm introduced subspace clustering by assigning signatures to the first dimensional clusters that help identifying the maximal space clusters.
The ensemble approach in [19] handled high dimensional incomplete data by providing features partitioning and missing values imputations. In [20] the discriminative multi-view subspace clustering (DMSC) introduced subspace clustering and distributed learning for distributed high dimensional data. The Dense Segments (DS) algorithm in [21] provided subspace clustering based on dense regions over the lower subspaces. In [22] the Classification based Text-Frequent-Pattern-tree (CTFP) method was proposed for dealing with high-dimensional data in text classification.
The above algorithms were dealt with static data. The high dimensional data stream processing was not concentrated enough using the above algorithms.
Data streams processing
The gossip-based distributed clustering for P2P networks (GBDC-P2P) algorithm in [23] proposed a distributed learning of data streams that were gathered from distributed and dynamic data sources. The fuzzy-based clustering algorithm in [24] handled multi-sensor probabilistic data. The online batch-based active learning algorithm (OBAL) in [25] was proposed for addressing social media streaming data learning.
The stream-based active learning algorithm (SAL) [26] considered both concept drift and concept evolution by adapting the classifier based on continuous variations of streaming data over time. In [27] the distributed stream processing was addressed in different cluster platform engines (SPEs) such as Storm, Spark Streaming, Google Dataflow, and Azure Stream Analytics.
The incompleteness and high dimensionality problems were deeply studied in most of the above algorithms in section 2. But, most of these algorithms were applied to static data. Practically, recent applications generate continuous and time varying data streams that gathered from multiple sources. Data streams are often suffering from incompleteness and high dimensionality. Additional constraints are appearing when dealing with such incomplete high dimensional distributed data streams. In contrast to static data, data streams require continuous processing of the most recent elements that are generated over time. Also, data stream distribution should be considered.
Therefore, in this paper, we propose the Subspace clustering for Incomplete High dimensional Data streams (SIHD) framework to solve the above issues. The main objective of the proposed SIHD is the clustering of data streams in the presence of the incompleteness problem, the dimensionality increase, the data continuity, and the data distribution issue.
Efficient clustering of such data requires an integrative and adaptive process that covers the following questions: How to process the high dimensional data? What is the strategy to produce the subspaces (subsets of dimensions)? How to efficiently impute the missing values over the high dimensional data? How to deal with the distribution of data? How to address the changeable nature of data streams?
So, SIHD introduces an adaptive subspace clustering that is applicable with incomplete high dimensional data streams that are gathered from multiple sources.
Problem formulation
Given a high dimensional incomplete streaming data of n elements
Incomplete data processing
Assuming a m-dimensional incomplete data set of n objects
Most of the recent imputation-based algorithms solve data incompleteness by estimating the missing values based on the nearest-neighbor rule. Firstly, the partial distance of each incomplete object is calculated with all other complete elements. The partial distance computes the similarity between the incomplete object
Where
Then, the k nearest-neighbors of the incomplete objects can be gotten. Because of the uncertainty of missing values, an interval of a missing dimension value is gotten based on the nearest-neighbors. This interval takes full advantage of the attribute distribution information. The interval of a missing value of an incomplete object can be determined by the minimum and the maximum values of the nearest neighbors’ dimension values [10]. For an incomplete object
Traditional clustering algorithms generate clusters in the full-dimensional space based on the similarity between the data points using all dimensions of the data set. But with the increase of data dimensionality, some of the dimensions become irrelevant to some of the clusters. Therefore, these full space (full dimensional) clustering algorithms are not effective to produce meaningful clusters for the high-dimensional data. Alternatively, it becomes imperative to get clusters over the relevant subspaces (subsets) of dimensions of the data. The subspace clustering is the process of generating clusters in the subspaces of the data set [18].
For a high dimensional data set E = {E1, E2, ⋯ , Ea, ⋯ , En} of n elements, each point is a m-dimensional vector as Ea = {E1a, E2a, ⋯ , Ema}. A subspace S is a subset of the original dimension set D = d1, d2, ... ,dm and is represented as S = d1, d2, ... , dk where, di ∈ D and 1≤k≤m.
Based on the traditional bottom up subspace clustering algorithms, dense (very close) points in the one-dimensional subspaces (subspaces of all single dimensions ({d1}, {d2}, ... ,{dm}) are combined to compute the two-dimensional clusters which are then combined to compute three dimensional clusters and so on. Each one-dimensional subspace includes clusters of points in a dimension from the original dimension set of the data set. A point is dense in a subspace if it has at least τ neighbors within £ distance. These traditional algorithms generate all possible clusters in all subspaces, but they fail to scale with the dimensions increase. If a cluster c does not exist in any of the higher subspaces of (d + 1) - dimensions, then it is called a maximal subspace cluster. The non-maximal clusters should not be generated because they are trivial, but most of the current subspace clustering algorithms implicitly or explicitly find such redundant and trivial clusters.
In Fig. 1, an example shows how the bottom up subspace clustering works. The example presents only the first two attributes (dimensions) d1, d2 from a data set of 10 points. Firstly, for each dimension, the points are clustered as in Fig. 1. (a). We observe in Fig. 1. (b) that c1 in the two-dimensional space is the intersection of points in d1 [c1] (first cluster in the first dimension) and d2 [c2] (second cluster in the second dimension). Also, c2 in the two-dimensional space is the intersection of points in d1 [c2] and d2 [c3]. In addition, we can note the absence of two-dimensional clusters containing points p1, p3, p5 in the 2-D space d1, d2.
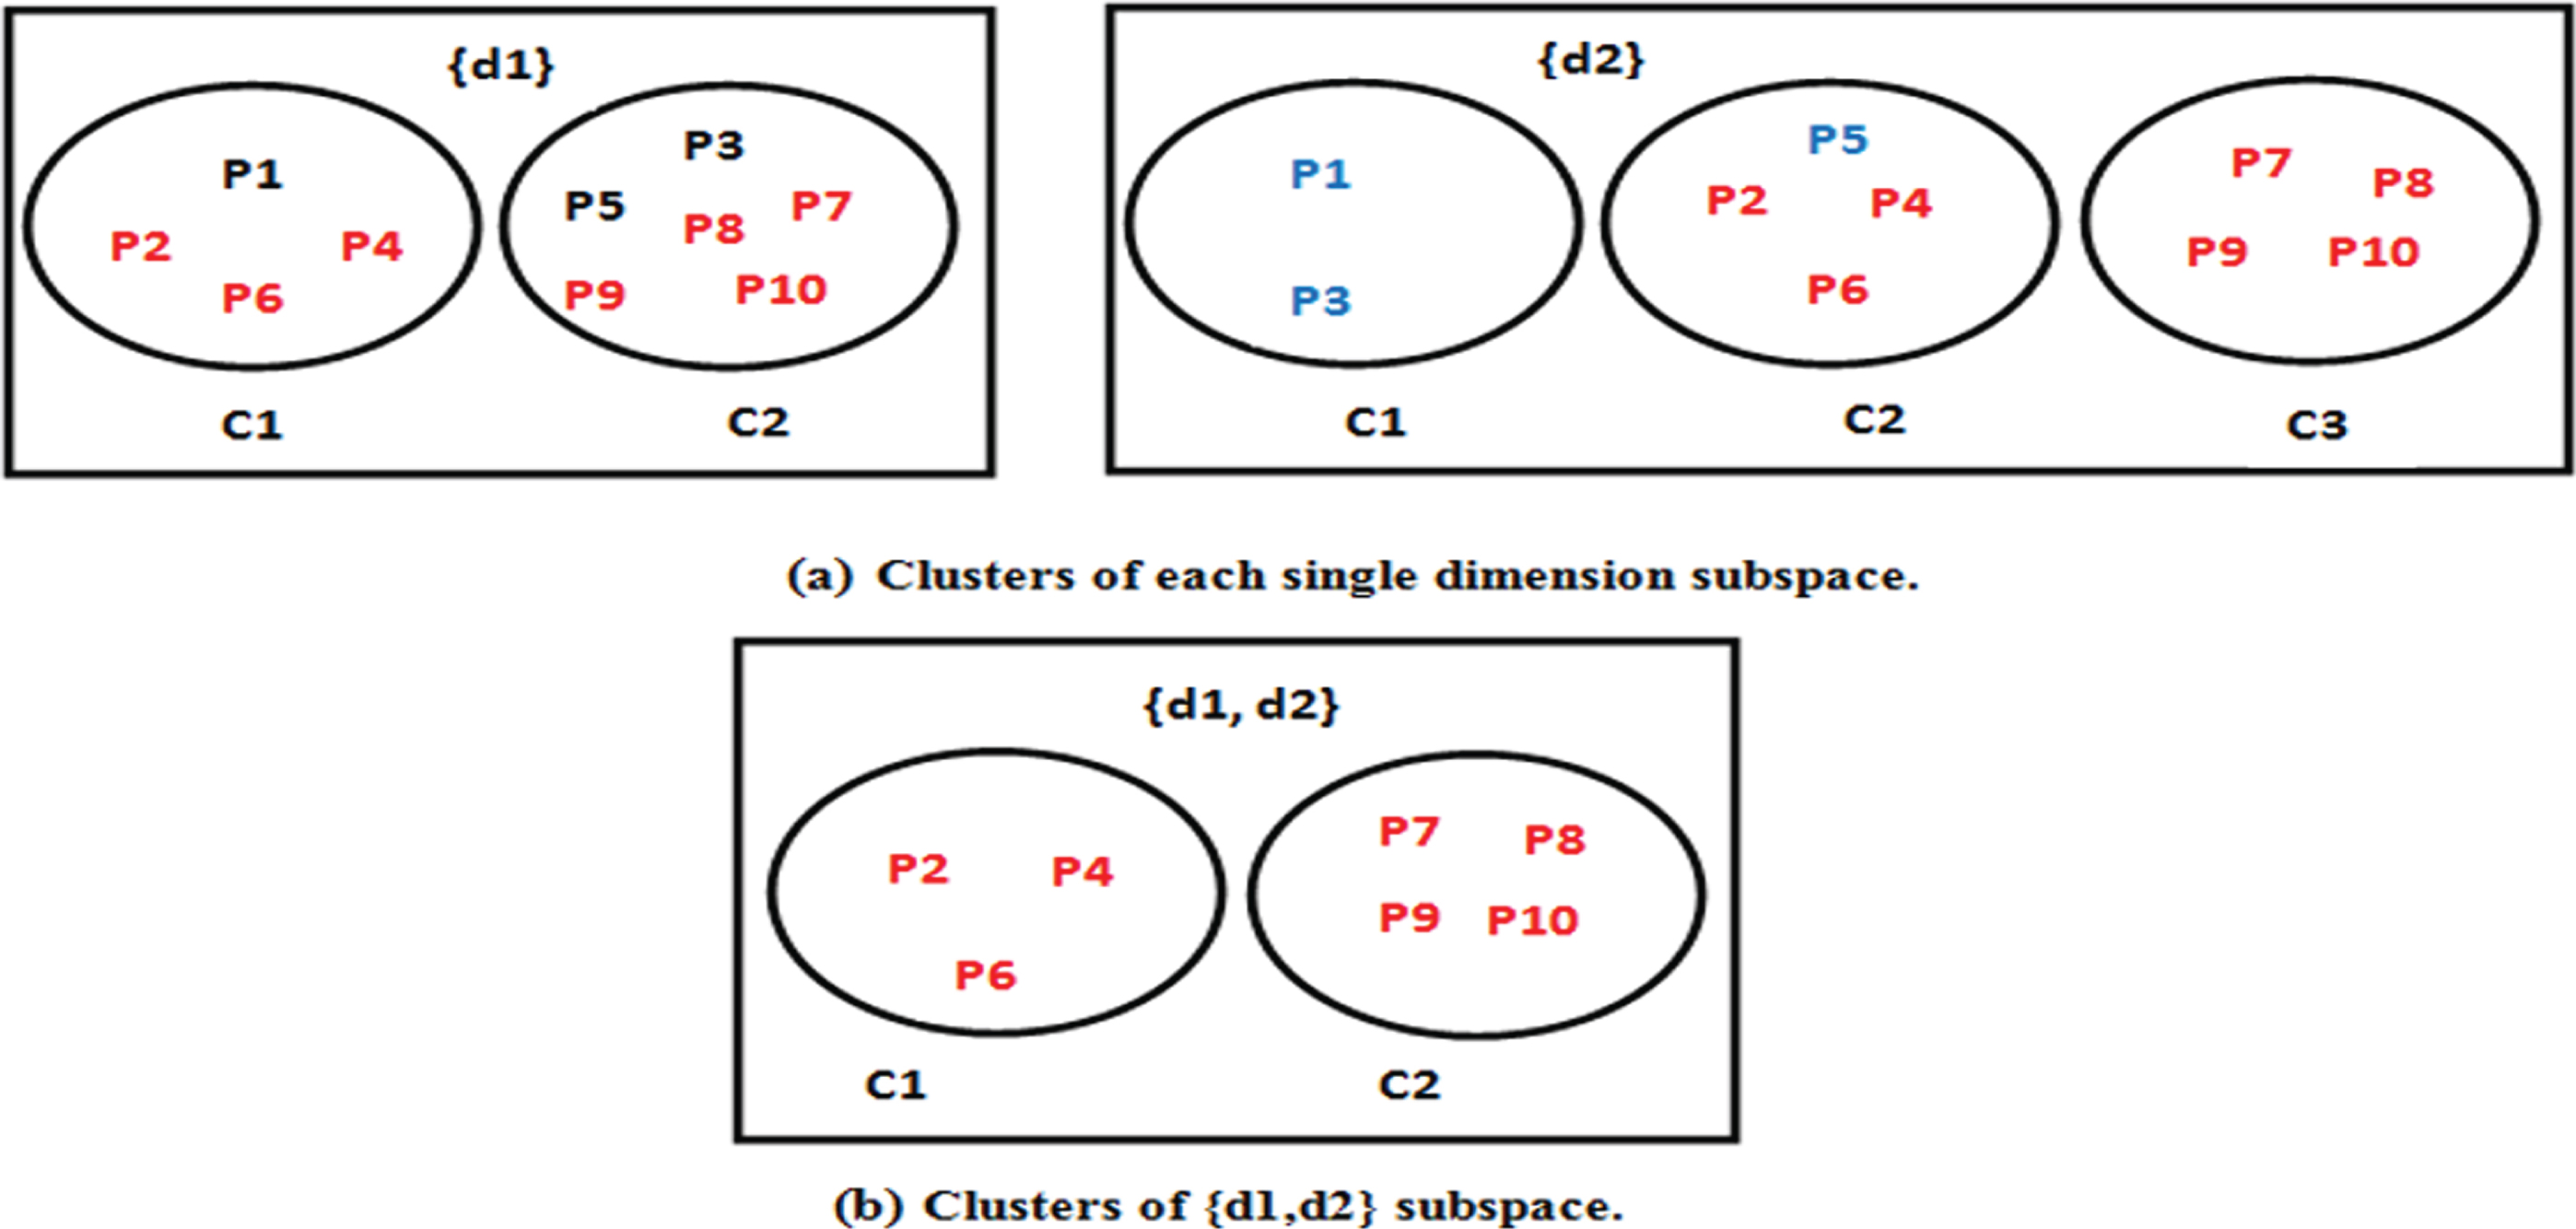
Example for the second-dimensional (2-D) space production from the first-dimensional (1-D) space.
The traditional clustering that finds clusters over the whole data set of a fixed size is not suitable to the continuous nature of streaming data, so the continuous clustering is appeared. The clustering process is applied continuously over time with the continuous arrival of streaming data. For each time interval, the most recent stream elements are clustered, and the results are updated continuously over time [28].
The proposed framework
The proposed Subspace clustering for Incomplete High dimensional Data streams (SIHD) framework is presented in Fig. 2. SIHD introduces a continuous subspace clustering of incomplete high dimensional data streams.
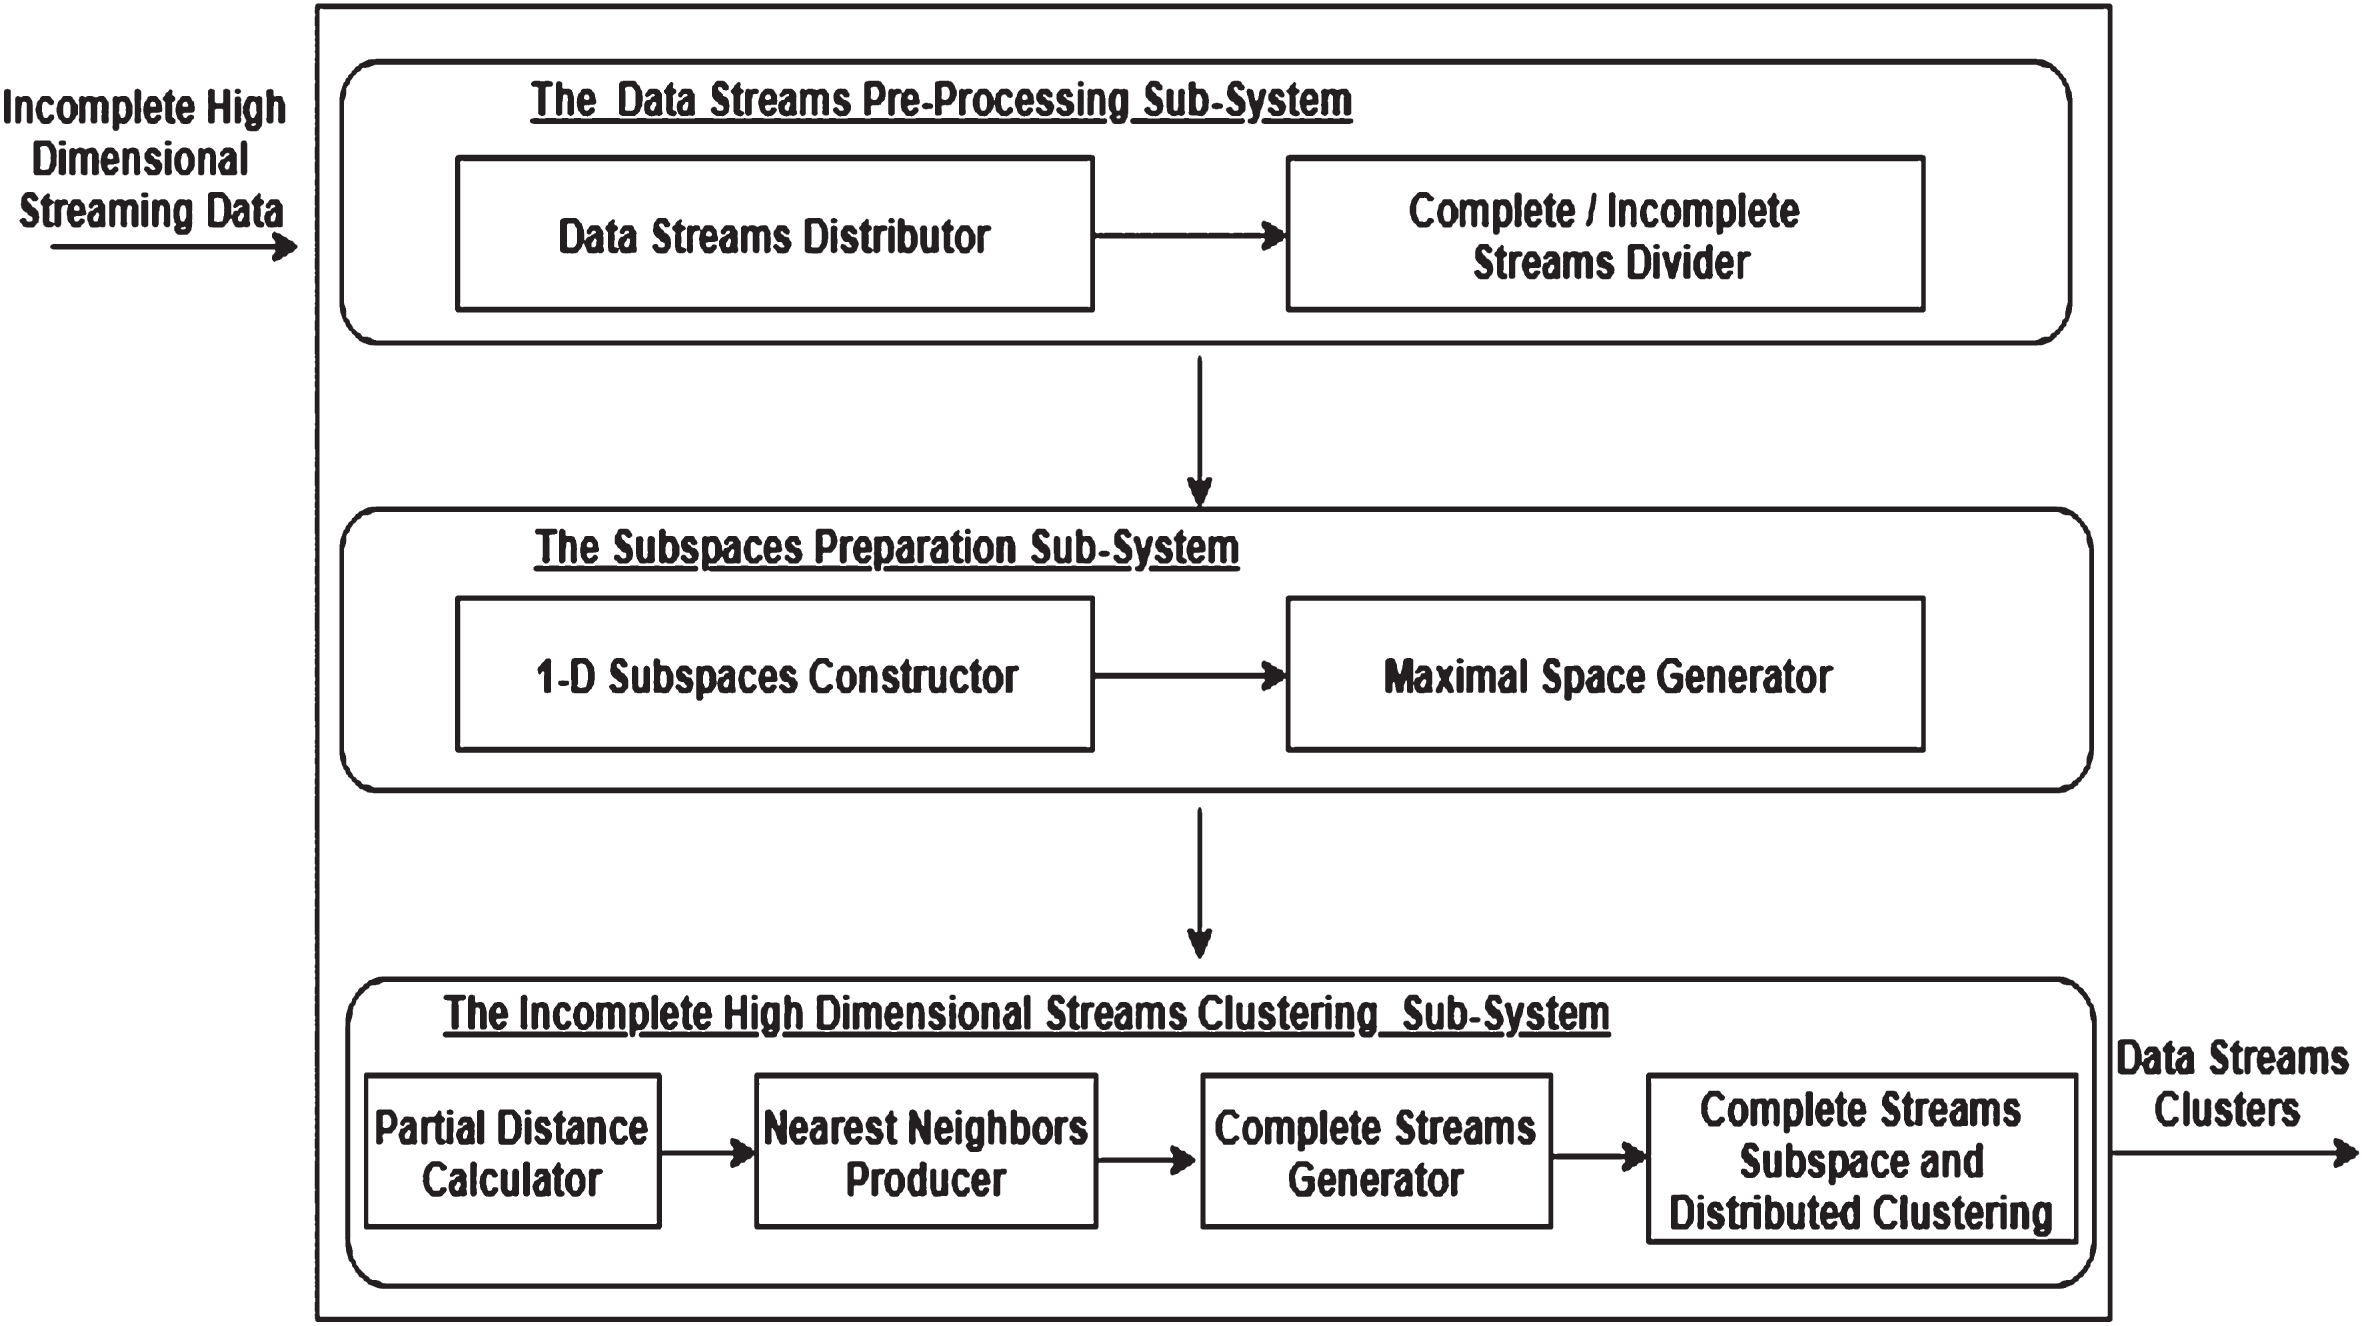
The proposed SIHD framework.
This sub-system includes two blocks, the data streams distributor and the complete / incomplete streams divider.
Data streams distributor
For each time interval, this block divides the most recent data streams into multiple sub-sets based on their sources.
Complete/incomplete streams divider
This block separates data streams per each data source to complete and incomplete elements.
The subspaces preparation sub-system
This sub-system generates the subspaces of the input data streams with high dimensionality. It consists of two main blocks: the 1-D subspaces constructor and the maximal space generator.
1-D subspaces constructor
For each data source, the complete stream objects are clustered per each dimension. This block outputs the first dimensional (1-D) subspaces’ clusters per each data source. A 1-D subspace cluster consists of a set of dense points (very close points). A dense point in a subspace is a point that has at least τ neighbors within £ distance.
Maximal space generator
This sub-system is responsible for producing the maximal space based on the 1-D subspaces’ clusters. A maximal subspace cluster is the cluster that does not exist in any of the higher subspaces of (d + 1)-dimensions.
The incomplete high dimensional streams clustering sub-system
The incomplete high dimensional streams per data subset are clustered in this sub-system. This sub-system consists of four main blocks, the partial distance calculator, the nearest neighbors’ producer, the complete streams generator, and the complete streams subspace and distributed clustering.
Partial distance calculator
For each incomplete stream object per data source, this block determines in which subspaces (from the maximal space) the missing values of the object are found. Then, the partial distance is calculated between the incomplete object and all complete objects over the subspaces of missing values.
Nearest neighbors producer
This block finds the k-nearest neighbors for each incomplete object per data source over the subspaces of missing values. The nearest neighbors of an object are gotten depending on the calculated partial distances.
Complete streams generator
The missing values are imputed per data source in this block. The missing values of an incomplete object are estimated based on the nearest neighbors of the object. This block forms a complete version of the input data.
Complete streams subspace and distributed clustering
This block is responsible for clustering the generated complete data streams (after missing values imputation). The continuous subspace clustering is applied to cluster such high dimensional streams that gathered from multiple data sources. The final clusters are produced based on the sub-results of all sources.
The proposed algorithm
The traditional clustering is mainly applied to complete non-continuous data, and also generates clusters in the full-dimensional space. However, most recent applications produce continuous data streams that suffer from high dimensionality and incompleteness. Thus, an adaptive subspace clustering algorithm is proposed to overcome these clustering problems.
Given incomplete high dimensional streaming data of n elements, each incomplete stream element
Firstly, the proposed SIHD divides the stream elements into multiple sub-sets based on their data sources DS. Per each data source in DS, SIHD splits elements into incomplete and complete elements. Then, per each data source, we generate the subspaces of data. A subspace S over a data source dsj is a subset of the total dimensions Dj = d1, d2, ... ,dm of the sub-set of data in dsj, and represented as S = d1, d2, ... , di, ... ,dk where, di ∈ Dj and 1≤k≤m [18].
There are shortcomings of the bottom up subspace clustering that negatively affect its performance. The bottom up strategy produces intermediate redundant and trivial clusters before reaching the maximal space. A cluster C is called a maximal subspace cluster, if it does not exist in any of the higher subspaces of (d + 1) – dimensions. There is no need to produce the intermediate non-maximal clusters. Also, the bottom up strategy requires an excessive number of database scans during the process of combining lower dimensional candidate clusters. To overcome the expensive steps of the traditional bottom up subspace clustering, we follow the signature strategy that was introduced in [18].
Initially for the complete elements per each data source, SIHD generates the clusters over the first dimensional (1-D) subspaces (subspaces of all single dimensions). Then, SIHD produced the maximal space per data source based on the clusters of 1-D subspaces.
If an element Ej is neighboring to a dense element Ei then, Ej is called directly density-reachable from Ei. The direct density reachability is not symmetric if the two elements are not dense. Two elements Ei, Ej are called density-reachable from each other, if there is a chain of directly density-reachable elements between them, i.e., ∀ Er, Ed ∈ {Ei, E1, . . . , Em, Ej}, Ed is directly density reachable from Er.
Two points Ei, Ej are called density-connected with each other, if there is an element Er such that both Ei and Ej are density-reachable from Er. Both density reachability and connectivity is defined based on ɛ and τ parameters.
1-D subspaces generation
SIHD generates the 1-D subspaces’ clusters for complete elements per each data source. A 1-D subspace cluster includes a group of dense (very close) points over the dimension of this subspace. According to DBSCAN algorithm [18], a point which has at least τ neighbors within ɛ distance is called a dense point. The data was normalized to the interval [0, 1] before measuring the distance. L1 metric was used as the distance measure. Each generated 1-D subspace cluster includes the smallest possible number of dense points and called a dense unit.
Therefore, each 1-D subspace consists of a group of dense units (clusters). The size of a dense unit is fixed in all dimensions (1-D subspaces). For easily referring to points, each point is assigned a unique large positive integer and is represented as its label instead of its set of dimensions. For example, an element Ea of a data source dsj is represented as Ea = l instead of {E1a, E2a, ⋯ , Ema}, where l is a very large positive integer. A well tested label size is 12 digits [18]. A dense unit (cluster) of 1-D subspace is assigned a signature (Sig) which is the sum of the labels of the points in that dense unit. If two dense units U1 and U2 have the same signature (very large positive integer), then U1, U2 will contain the same points with very high probability.
If L≥1 is a positive integer, then a set {l1, l2,..., l
δ
} is called its partition, such that
Let K be a set of random large integers, δ < < |K| < <p δ (L). Let U1and U2 are two sets of integers from K s.t. |U1| = |U2| =δ, and δ= o (L1/3). The sums of the integers in these two sets are sum (U1) and sum (U2). If sum (U1) = sum (U2) = L, then U1 and U2 are same with an extremely high probability, if L is very large.
Proof:
Based on Equation 2, for a very large positive integer L, if relatively very small partition size δ is used, then the number of unique fixed-sized partitions will be astronomically large. The probability of getting a particular partition set of size δ is:
This means the probability of randomly choosing the same partition again is extremely low. Also, this probability can be made very small by choosing a large value of L and relatively very small δ. Since L is the sum of the labels of δ points in a dense unit U, L can be made very large if we choose very large integers as the individual labels. Therefore, with δ=τ+ 1, the two dense units U1 and U2 will contain the same points with very high probability, if sum (U1) = sum (U2), provided this sum is very large.
A subspace cluster, C = (E, S) is a set of dense elements E in a subspace S, such that ∀Ei, Ej ∈ E, Ei and Ej are density connected with each other in S based on ɛ and τ, and there is no other elements Er ∈ E, such that Er is density-reachable from some Eq ∉ E in the subspace S. A cluster CM = (E, S) is called a maximal subspace cluster if there is no other cluster Cj = (E, S∖) such that S∖ ⊃ S.
If at least τ + 1 density-connected elements from a dimension di also exist as density-connected elements in the 1-D dimensions (single dimensions) dj,..., dr, then these elements will produce a group of dense elements in the maximal subspace, SM = di, dj,... dr.
SIHD compares all the signatures over all 1-D subspaces (all single dimensions). Thus, the common dense units over 1-D subspaces can be gotten. Based on these common dense units, the SIHD can determine the higher level of subspaces (maximal space). If dense units do not exist in any of the higher subspaces of (d + 1) - dimensions, then the maximal space is reached.
Incomplete stream elements imputation
After generating the highest level of subspaces based on the complete stream elements, the proposed SIHD handles the incomplete elements. For each incomplete stream element per data source, the SIHD determines the subspaces (from the maximal space) that contain the missing values of that incomplete element. Then, SIHD computes the partial distances between that incomplete element and all complete elements over the subspaces of missing values using formula (1). Then, for each incomplete element per data source, the SIHD generates the q nearest neighbors (from complete elements) over the subspaces of missing values.
Then, the intervals of the missing values of the incomplete elements are gained depending on the nearest neighbors over subspaces of missing values. For a missing value of attribute b of element
Where r is a random number uniformly distributed between 0 and 1.
After imputing the missing values of incomplete objects, we have a complete version of streaming data. Finally, the generated complete data streams are clustered. The proposed SIHD applies subspace clustering on the generated complete data streams. The clusters of complete data streams over the highest level of subspaces (maximal space) are generated per each data source. We used the DBSCAN algorithm [18] to generate clusters per each subspace in the highest level of subspaces (maximal space). According to DBSCAN, a cluster is defined as a set of dense points. By combining the local results over all data sources, the final clusters are produced. The following pseudo code illustrates the proposed algorithm.
Experimental evaluation
Our experiments test the performance of the proposed SIHD algorithm using two high dimensional data sets of predefined data clusters that contain distributed sensors’ streaming data, namely Smartphone-Based Recognition of Human Activities and Postural Transitions data set [29, 30], and Epileptic Seizure Recognition data set [31, 32]. Table 1 presents the description of the data sets. For simplicity, we mention them as data set1 and data set 2. Data streams were processed over a tumbling window that divided data into non-overlapping consecutive windows. Therefore, a streaming data element was processed only one time. We used 3000 elements from data set1 and 1500 elements from data set2 of three consecutive time intervals each with a size of 1000 elements for data set1 and 500 elements for data set 2.
Data sets description
Data sets description
The experiments were running three independent times. Each run was performed on objects over a time interval. The results are averaged over the three time intervals in each data set. From the above complete data sets, we produced the incomplete data with missing data rates of 5%, 10%, 15% and 20%. The missing values were generated uniformly (in a random manner) over the two data sets, and non-uniform missing values’ distribution was applied only on data set1. For generating non-uniform missing values’ distribution, missing values were concentrated in fewer columns instead of producing completely randomly missing values. An incomplete element must have at least one missed attribute value. The XLSTAT sampling tool was used to sample our data from the data sets [30].
The performance of the proposed SIHD algorithm is compared with five algorithms, which are 1) GFCM [8] which imputed the missing values of incomplete elements, 2) GBDC-P2P [23] that introduced a distributed clustering of data streams which were captured from distributed and dynamic data sources, 3) DS [21] that provided subspace clustering for high dimensional data, 4) Ensemble [19] that addressed the incomplete high dimensional data clustering, 5) DMSC [20] that provided features partitioning and distributed clustering of high dimensional distributed data. Missing data rates were taken as 0% (complete data), 5%, 10%, 15% and 20%. The nearest neighbor size that was used in the experiments is 6, τ = 3, and ɛ = 0.001. The values of these parameters have been proposed and chosen in [10, 18] as these values are more suitable and give more accurate results.
The measurements of our experiments are: 1) The misclassification, 2) The accuracy, 3) The precision, 4) The sensitivity, 5) The specificity, 6) The F-score. The misclassification measure represents the number of objects that were incorrectly classified. The accuracy represents the number of correct predictions from all predictions made. The precision was represented by the number of true positive predictions divided by the total number of all positive values predicted. The sensitivity is the proportion of positives that are correctly identified. The specificity is the proportion of negatives that are correctly identified. The F-score measures the harmonic mean of precision and sensitivity. The best results over all experiments are marked in bold and the next best results are underlined. Also, two statistical tests of hypotheses were applied to show the significance of the results which are ANOVA and Friedman tests.
The misclassification results
The average misclassifications were calculated over the proposed SIHD algorithm and the compared algorithms GFCM, GBDC-P2P, DS, Ensemble, and DMSC using: 1) Data set1 and data set 2 with uniform missing data rates of 0% (complete data), 5%, 10%, 15% and 20%, 2) Data set1 with non-uniform missing data rate of 20%. Also, we calculated the average misclassifications based on the proposed SIHD algorithm over data set1 using two different distributions of data (2, 3 subsets) in each time interval. Elements of data set1 [generated from three distributed sources] were divided into two / three distributed portions (sub-sets) to show the effect of distributed clustering.
The ANOVA and Friedman tests were applied on the misclassification results over the subsets of data over the three time intervals using: 1) Data set1 and data set 2 with uniform missing data rates of 0% (complete data), 5%, 10%, 15% and 20%, 2) Data set1 with non-uniform missing data rate of 20%. The ANOVA and Friedman tests were performed with the help of the Social Science Statistics [35].
The misclassification results over uniform missing values distribution
The average misclassifications and the standard deviation of the misclassifications of the proposed SIHD algorithm and the compared methods (GFCM, GBDC-P2P, DS, Ensemble, and DMSC) over data set1 and data set2 with uniform missing values’ distribution of 0%, 5%, 10%, 15% and 20% are shown in Tables 2 and 3.
Average misclassifications and standard deviation of the misclassifications over data set1 (uniform)
Average misclassifications and standard deviation of the misclassifications over data set1 (uniform)
Average misclassifications and standard deviation of the misclassifications over data set2 (uniform)
The proposed SIHD has better results than those of the compared algorithms using the data set1 and data set 2. The results of SIHD ensure the effectiveness based on three parameters: 1) Missing values imputation rather than ignoring them, 2) Distributed processing of streaming data that are gathered from multiple distributed sources, 3) Subspace Clustering of high dimensional data.
SIHD separately processed data elements per data source, but GFCM, DS, and Ensemble algorithms did apply distributed clustering, and ignored the different characteristics of data over the multiple distributed source. Also, SIHD efficiently produced the subspaces of the high dimensional data. Data elements were processed over these subspaces using SIHD which affects the clustering results of SIHD. However, GFCM and GBDC-P2P algorithms clustered the data elements over the full dimensional space without partitioning, which decreased the performance of their clustering results, because with the dimensionality increase, some of the dimensions become irrelevant to some of the clusters. In addition, missing values using SIHD were imputed based on the nearest neighbors over the subspaces of missed data only. So, these neighbors were accurately produced, and missed values were replaced by accurate values. Efficient missing values’ estimation supported the clustering process of SIHD. No dimensions were ignored in the clustering process of SIHD, but GBDC-P2P, DS, and DMSC algorithms ignored the dimensions included missing values. Only dimensions that contain values over all data elements were involved in the clustering methodology of GBDC-P2P, DS, and DMSC algorithms which decreased their performance. Even depending on the full dimensional space in GFCM algorithm to produce nearest neighbors of incomplete elements for missing values imputation, led to non-efficient clusters.
The standard deviations’ results refer to the worst results (over the three runs) of the proposed SIHD are better than the best results (over the three runs) of the rest algorithms over data set1, data set2. For example, the worst misclassification of SIHD over missing rate 5% of data set1 in Table 2 is 73.3 + 1.2, which is less than the best misclassification of DMSC 90.7–1.7.
The ANOVA and Friedman statistical tests were performed on the misclassification results over data set1, 2 with uniform missing data rates. The results of the ANOVA and Friedman tests on data set1, 2 are shown in Tables 4 and 5. The obtained statistical results provide evidence for our results are significant at significance level of 0.05. The p-value over the two tests is less than 0.05 which indicates to the null hypothesis is false or should be rejected.
Statistical test of hypotheses of misclassification results over data set1 (uniform)
Statistical test of hypotheses of misclassification results over data set2 (uniform)
Table 6 presents the average misclassifications and the standard deviation of the misclassifications of the proposed SIHD and the comparing algorithms using data set1 with 20% non-uniform missing values’ distribution. For generating non-uniform missing values’ distribution, missing values were concentrated in fewer columns instead of producing completely randomly missing values. The results reveal that the worst misclassifications of the proposed SIHD are better than the best misclassifications of all compared algorithms. Results from Tables 2 and 6 of data set1 ensure the effectiveness of the proposed SIHD over other compared algorithms using uniform/non-uniform missing values’ distributions. This is because the SIHD applied missing values imputation and subspace clustering of the incomplete high dimensional streaming data that gathered from multiple sources.
Average misclassifications and standard deviation of the misclassifications over data set1 (non-uniform)
Average misclassifications and standard deviation of the misclassifications over data set1 (non-uniform)
Table 7 shows the results of the ANOVA and Friedman tests on misclassification results over data set1 with 20% non-uniform missing values’ distribution. Table 7 results provide evidence for the significance of misclassification results at significance level of 0.05.
Statistical test of hypotheses of misclassification results over data set1 (non-uniform)
We divided data set1 elements [that gathered from three distributed sources] in each time interval into two and three distributed portions (sub-sets). The average misclassifications and the standard deviation of the misclassifications over data set1 with uniform missing rate of 5% are shown in Table 8. The SIHD algorithm was applied on each data distribution of (2, 3) sub-sets. The misclassifications results of the SIHD over three data sub-sets outperform the results of two data sub-sets. Based on the standard deviation results, the worst misclassifications when dividing data into three sub-sets are better than the best misclassifications over two data sub-sets which indicate the effect of distributed clustering introduced by the proposed SIHD algorithm.
Average misclassifications and standard deviation of the misclassifications of SIHD over data set1 using different distributions
Average misclassifications and standard deviation of the misclassifications of SIHD over data set1 using different distributions
The clustering performance was measured using the confusion matrix measurements [34] which are accuracy, precision, sensitivity (Recall), specificity, and F-score for: 1) the proposed SIHD and the compared algorithms on data set1 and data set2 over uniform missing data rates of 0%, 5%, 10%, 15% and 20%, 2) the proposed SIHD and the compared algorithms on data set1 over non-uniform missing data rate of 20%, 3) the proposed SIHD on data set1 with two and three distributed portions (sub-sets) in each time interval to illustrate the impact of distributed clustering.
The ANOVA and Friedman tests were applied on the confusion matrix results over data set1 with uniform / non-uniform missing data rates and data set2 with uniform missing data rates.
The confusion matrix measurements over uniform missing values rate
The accuracy, precision, sensitivity, specificity, and F-score of the proposed SIHD and the compared algorithms over data set1 and data set2 with uniform missing rates are shown in Tables 9 and 10. The proposed SIHD outperforms all comparing algorithms due to efficiently providing missing values imputation and subspace clustering of incomplete high dimensional data streams.
Average confusion matrix measurements over data set1 (uniform)
Average confusion matrix measurements over data set1 (uniform)
Average confusion matrix measurements over data set2 (uniform)
The ANOVA and Friedman statistical tests were performed on the confusion matrix results over data set1, 2 with uniform missing data rates and shown in Tables 11 and 12. The statistical results at significance level of 0.05 indicates strong evidence against the null hypothesis, as there is less than a 5% probability the null is correct (and the results are random). Therefore, we reject the null hypothesis, and accept the alternative hypothesis.
Statistical test of hypotheses of confusion matrix results over data set1 (uniform)
Statistical test of hypotheses of confusion matrix results over data set2 (uniform)
The confusion matrix measurements of the proposed SIHD and the compared algorithms over data set1 with non-uniform missing values’ distribution of 20% are shown in Table 13. For generating non-uniform missing values’ distribution, missing values were concentrated in fewer columns. We can observe that the proposed SIHD results are better than other algorithms. The reason behind SIHD results is applying three improvements which are missing values imputation, distributed and subspace clustering instead of ignoring the missing values and applying non distributed full dimensional space clustering as in the compared algorithms. The clustering results of Tables 9 and 13 of data set1 ensure the effectiveness of SIHD over uniform / non-uniform missing values distributions.
Average confusion matrix measurements over data set1 (non-uniform)
Average confusion matrix measurements over data set1 (non-uniform)
Table 14 presents the results of the ANOVA and Friedman tests on confusion matrix results over data set1 with 20% non-uniform missing values’ distribution. The results of table 14 provide evidence for the confusion matrix results are significant at significance level of 0.05.
Statistical test of hypotheses of confusion matrix results over data set1 (non-uniform)
The confusion matrix measurements were calculated for the proposed SIHD algorithm on data set1 elements [gathered from three distributed sources]. The elements in each time interval were divided into two and three distributed sub-sets. The SIHD algorithm was applied to each data division of (2, 3) sub-sets. Table 15 presents the confusion matrix measurements over data set1 with uniform missing values’ distribution of 5%. The results using data division of three sub-sets outperform the results of two data sub-sets which indicate the importance of distributed strategy introduced by the proposed SIHD on the clustering performance.
Average confusion matrix measurements over data set1 using different data distribution
Average confusion matrix measurements over data set1 using different data distribution
Data Streams that are generated from many modern applications such as sensor networks have a continuous nature and are often generated from multiple data sources with some incompleteness and high dimensionality. Recent studies deeply addressed the incompleteness and high dimensionality problems with static data using different methodologies. But there are additional constraints when handling incomplete high dimensional data streams. Unlike static data, data streams require continuous processing of the most recent elements over time.
To address these constraints, we propose the Subspace clustering for Incomplete High dimensional Data streams (SIHD) framework. In order to match the continuous variations of data streams over time, the proposed SIHD is working in a continuous manner. SIHD adaptively imputes the missing values of incomplete data that suffers from high dimensionality. An improved clustering strategy is proposed to accurately process such data. The experimental results proved the efficiency of the proposed SIHD over five comparing algorithms using two different data sets in terms of accuracy, precision, sensitivity, specificity, and F-score. The SIHD finds better clustering results of incomplete high dimensional data streams than the comparing algorithms over uniform and non-uniform missing values distributions. In future work, it would be interesting to deal with mixed-type and interval-valued data. We also are interested in working with incomplete big text data. Also, we will consider the query processing of such incomplete high dimensional data streams.