
Abstract
Images of green infrastructure (gardens, green corridor, green roofs and grasslands) large area can be captured and processed to provide spatial and temporal variation in colours of plant leaves. This may indicate average variation in plant growth over large urban landscape (community gardens, green corridor etc). Towards this direction, this short technical note explores development of a simple automated machine learning program that can accurately segregate colors from plant leaves. In this newly developed program, a machine learning algorithm has been modified and adapted to give the proportion of different colors present in a leaf. Python script is developed for an image processing. For validation, experiments are conducted in green house to grow Axonopus compressus. Script first extracts different RGB (Red Green and Blue) colors present in the leaf using the K-means clustering algorithm. Appropriate centroids required for the clusters of leaf colors are formed by the K-means algorithm. The new program provides saves computation time and gives output in form of different colors proportion as a CSV (Comma-Separated Values) file. This study is the first step towards the demonstration of using automated programs for the segregation of colors from the leaf in order to access the growth of the plant in an urban landscape.
Introduction
Assessment of plant growth is important for indication of serviceability of green urban infrastructure such as green roofs, gardens, lawns and green corridor [1]. In large developing world, there is an urgent need for development of green infrastructure. Though, it is well known that plant growth depends on soil and climatic parameters. It may not be economically feasible for authorities in developing world to install sophisticated monitoring systems for measuring soil, plant and atmospheric parameters for assessment of plant growth. One of easier way could be to evaluate change in leaf colour. Leaf color plays an important role in the growth and health of plants, which is mainly related to the chlorophyll content in leaves [2, 3]. Chlorophyll plays an indispensable role in the photosynthesis reaction and provides the necessary pathways of metabolism and energy transfer for plant growth. Chlorophyll synthesis and degradation are controlled by plant genes, and gene mutations can cause color changes in plant leaves, reduce photosynthetic response efficiency, and even cause plant death [4]. In addition, plant diseases caused by viruses, bacteria, and fungus can also cause changes in the color of plant leaves, which eventually lead to leaf loss and plant death [5, 6]. Long-term drought conditions also lead to leaves fall off to avoid evapotranspiration loss in order to adapt to the climate [7]. In agriculture, it is of great significance and feasibility to identify the health status of plants by color separation of leaves.
In recent years, plant phenotyping instruments such as leaf scanners have been used to analyze chlorophyll content in leaves and, hence monitor conditions of plant health [3]. However, these instruments, such as the Soil Plant Analysis Development (SPAD), are expensive and limited by specific operating conditions. Remote sensing technology has been applied to agriculture [8, 9] and ecology [7] in order to obtain vegetation growth development status in a timely, accurate and efficient manner. In addition, the development of Unmanned Aerial Vehicles (UAV) has made significant technological advances, leading to the widespread use of remote sensing [5, 10]. A large number of plant leaves images can be collected and analyzed by remote sensing to monitor plant growth and development, which overcomes the limitations of traditional on-site monitoring. These technical improvements have facilitated the application of image analysis in many areas, such as plant diseases detection [5, 6], biomass and leaf area [8], segregation of diseased and healthy leaves [11], ecological monitoring [7].
Color of digital images plays an important role in image analysis; how to separate the color is an important issue to be solved. In recent years, researchers have applied machine learning to detect plant disease [5, 12] and segregate leaf rust infection levels [6]. A study by [11] developed K-Nearest Neighbor (KNN), Support Vector Machine (SVM) and Naive Bayes classifier algorithms to segregate diseased and healthy leaves base on combinations of color, texture and shape features. However, the existing algorithm is only used to identify the color of the leaves and determine its growth state, lacking specific analysis on the color distribution of the leaves (i.e. color classification and proportion in the leaves). It is worth noting that the other algorithm (K- Cluster algorithm) is worth developing as an advanced algorithm for image color analysis due to its high precision and the ability to form similar clustering and calculate proportions.
The general k-means algorithm inability to initialize number of clusters and initial centroids make this algorithm unstable. Hence, a method that is similar to the grid search by dividing the data points in a grid was adopted. The method involves assigning data points to all the grids and then finding the centroids by taking the centers of the grids. These grid centers are used as input centroids, which can be used to identify k-value [13]. However, using the grid method, it is expected that most dominating colors will take over. This is because grid method is based on initializing the centroids by taking the centers of the grid containing most of the data points. Clustering algorithms are used to address the problem of segmenting images, when specific colors are not known in advance. Fuzzy C-means algorithm is one of the commonly adopted clustering algorithms. In the Fuzzy C-means algorithm, each data point in the space is assigned a membership grade indicating its degree of membership for a cluster rather than fully assign data point to one cluster [13]. FCM algorithm maintains proximity vector and performing multiplications for each data point, dimension and number of clusters. It becomes computationally expensive to perform Fuzzy C-means on a large set of the data points as compared to the K-means algorithm [13].
Cluster analysis is a technique of grouping similar data and feature vectors based on similar characteristics [14]. The objective of cluster analysis is that the objects in the same group are similar and the objects in different groups are different. K-means clustering algorithm is a clustering algorithm that takes distance as the similarity evaluation [13]. Therefore, the k-means clustering algorithm has more intuitive geometric interpretations. In the past decade, due to the extensive application of machine learning in various fields, the k-means algorithm has been widely used in various fields, such as text recognition [15], disease predictions [16], hydrological analysis [17], analysis of air pollution [18]. K-means algorithm has a wide application prospect in various fields because of its simplicity and speed.
The current objective of this technical note is to explore and develop the newly adapted K-means clustering algorithm in automatically segregating color from plant leaves. A Python script is developed using the unsupervised K-means algorithm. In this manuscript, experiments followed by followed by framework for developing program for colour segregation of plant leaves were described. This is followed by results, which shows validation of colour segregation of leaves using a newly developed program with that from experiment. The new program results were compared with that of the general K-means algorithm.
Methods
Experimental plan for obtaining images of plant leaf
Axonopus compressus was selected as plant species for investigation in this study. These species are commonly used as pasture grass for cattle rearing and eco-engineered slopes in many parts of Asia such as India, China, Malaysia, Singapore and Thailand. Further, the species is drought tolerance and is often used in ecological restoration [19].
Species were grown in a soil compacted at density of 1.7 g/cc in a 1-D column (300 mm diameter and 250 mm height). In total, 10 vegetated columns were grown under controlled humidity (50±4%) and temperature (30±3°C) in a greenhouse. Number of columns was selected so as to produce sufficient images (in total 150 expected) under given humidity and temperature conditions [20]. Several studies [21–24] have adopted 1-D column of similar dimensions for analyzing growth of vegetation and water flow in compacted soil. Both Bordoloi et al. [22, 23] and Gadi et al. [21] analysed leaf area index by carrying out image processing using public domain program, ImageJ. In their study, vegetation (i.e., cowpea) was grown in a 1-D column and subjected to several drying-wetting cycles. Images were captured for image processing. Leaf area in a 2-D plane view was calculated using Image J program. However, in their study, whole leaf area, consisting of both green and non-green colours were adopted for interpretation instead of segregation. For indication of growth of plant, it is important to segregate colours of leaf. In this study, vegetation was allowed to grow for 60 days during which images were captured for obtaining leaves of varying colours and sizes. In total, 150 images were captured for training, testing and validation of program in this study. It should be noted that the experiments were conducted in controlled conditions so as to minimize any fluctuations in leaves caused by changes in environment.
New Methodology to segregate colors from plant leaves using the Adapted K-means clustering algorithm
Figure 1 illustrates the steps taken for color segregation. Python script developed in this study allows automated color segregation using the Unsupervised K-means algorithm while imposed with different layers for accurate results. The sample images for color segregation and colors to be segregated are shown in Fig. 2. The stepwise breakdown of some of the parts of the Python script along with data analysis and visualization is shown in Fig. 3. While the colors to be segregated are user-defined and can be different with respect to the colors used in this Python script.
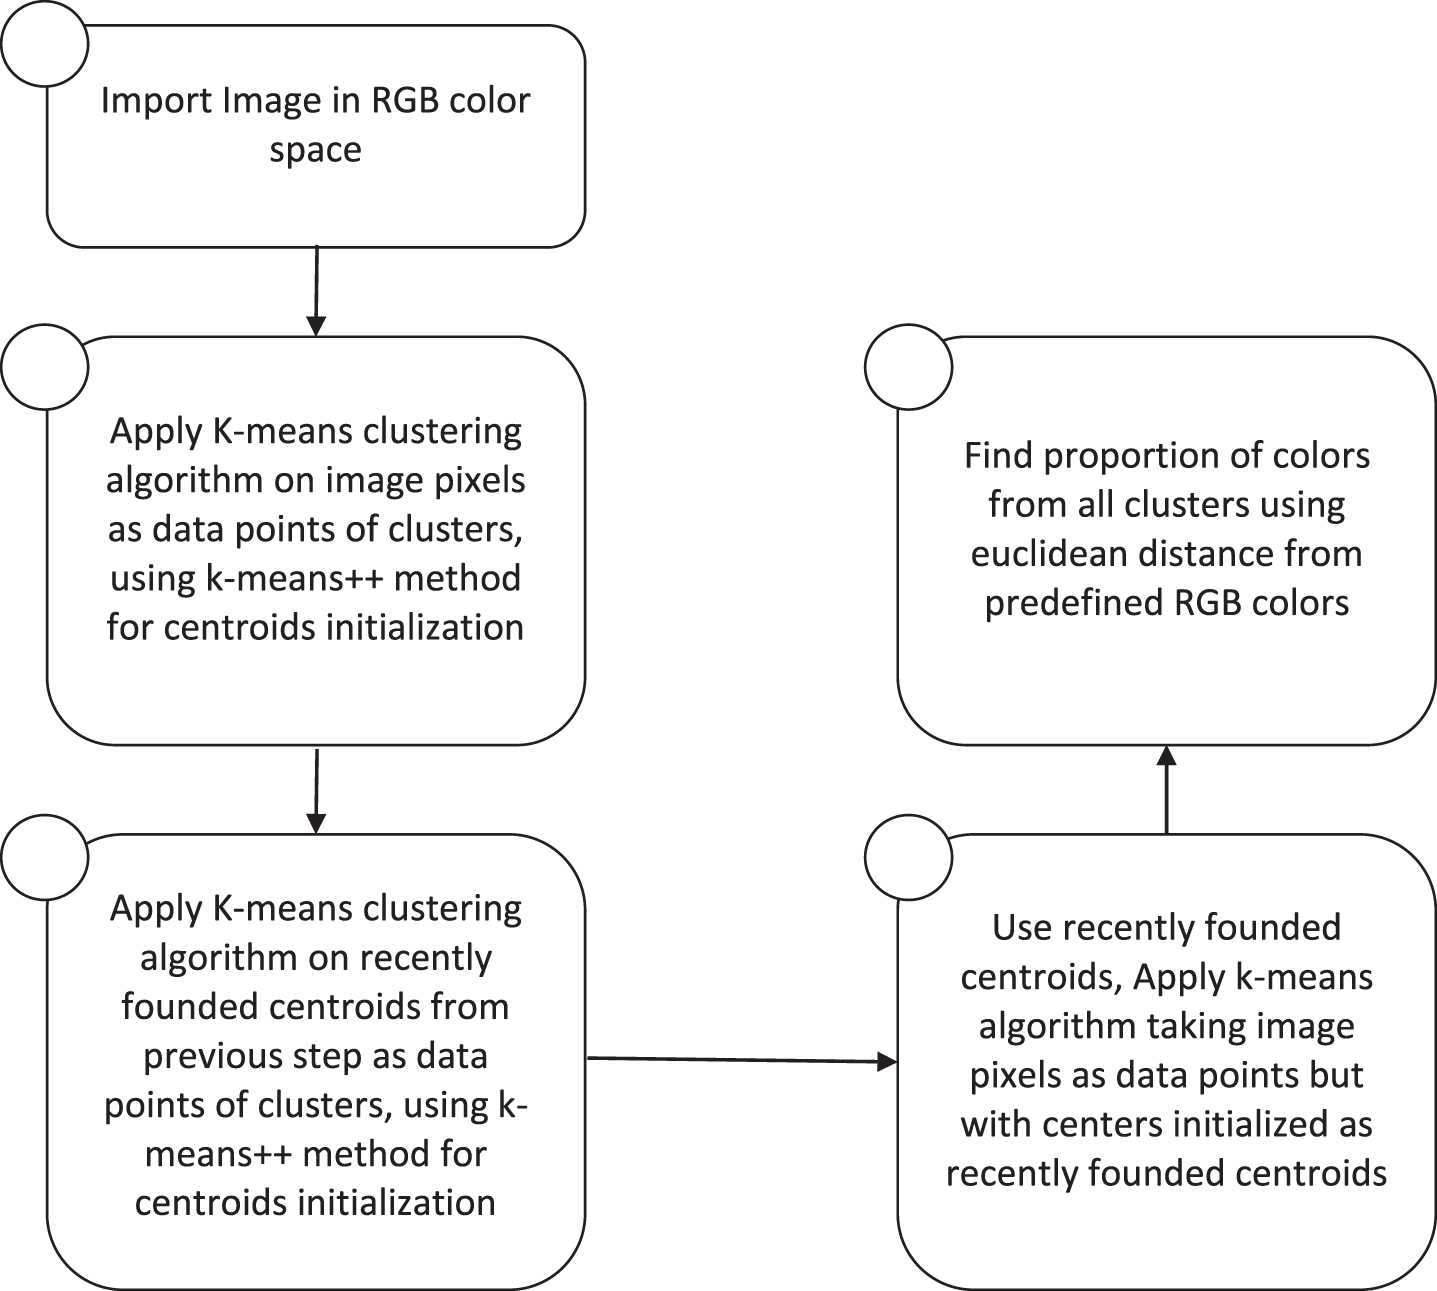
Steps taken to segregate colors from the leaf images.
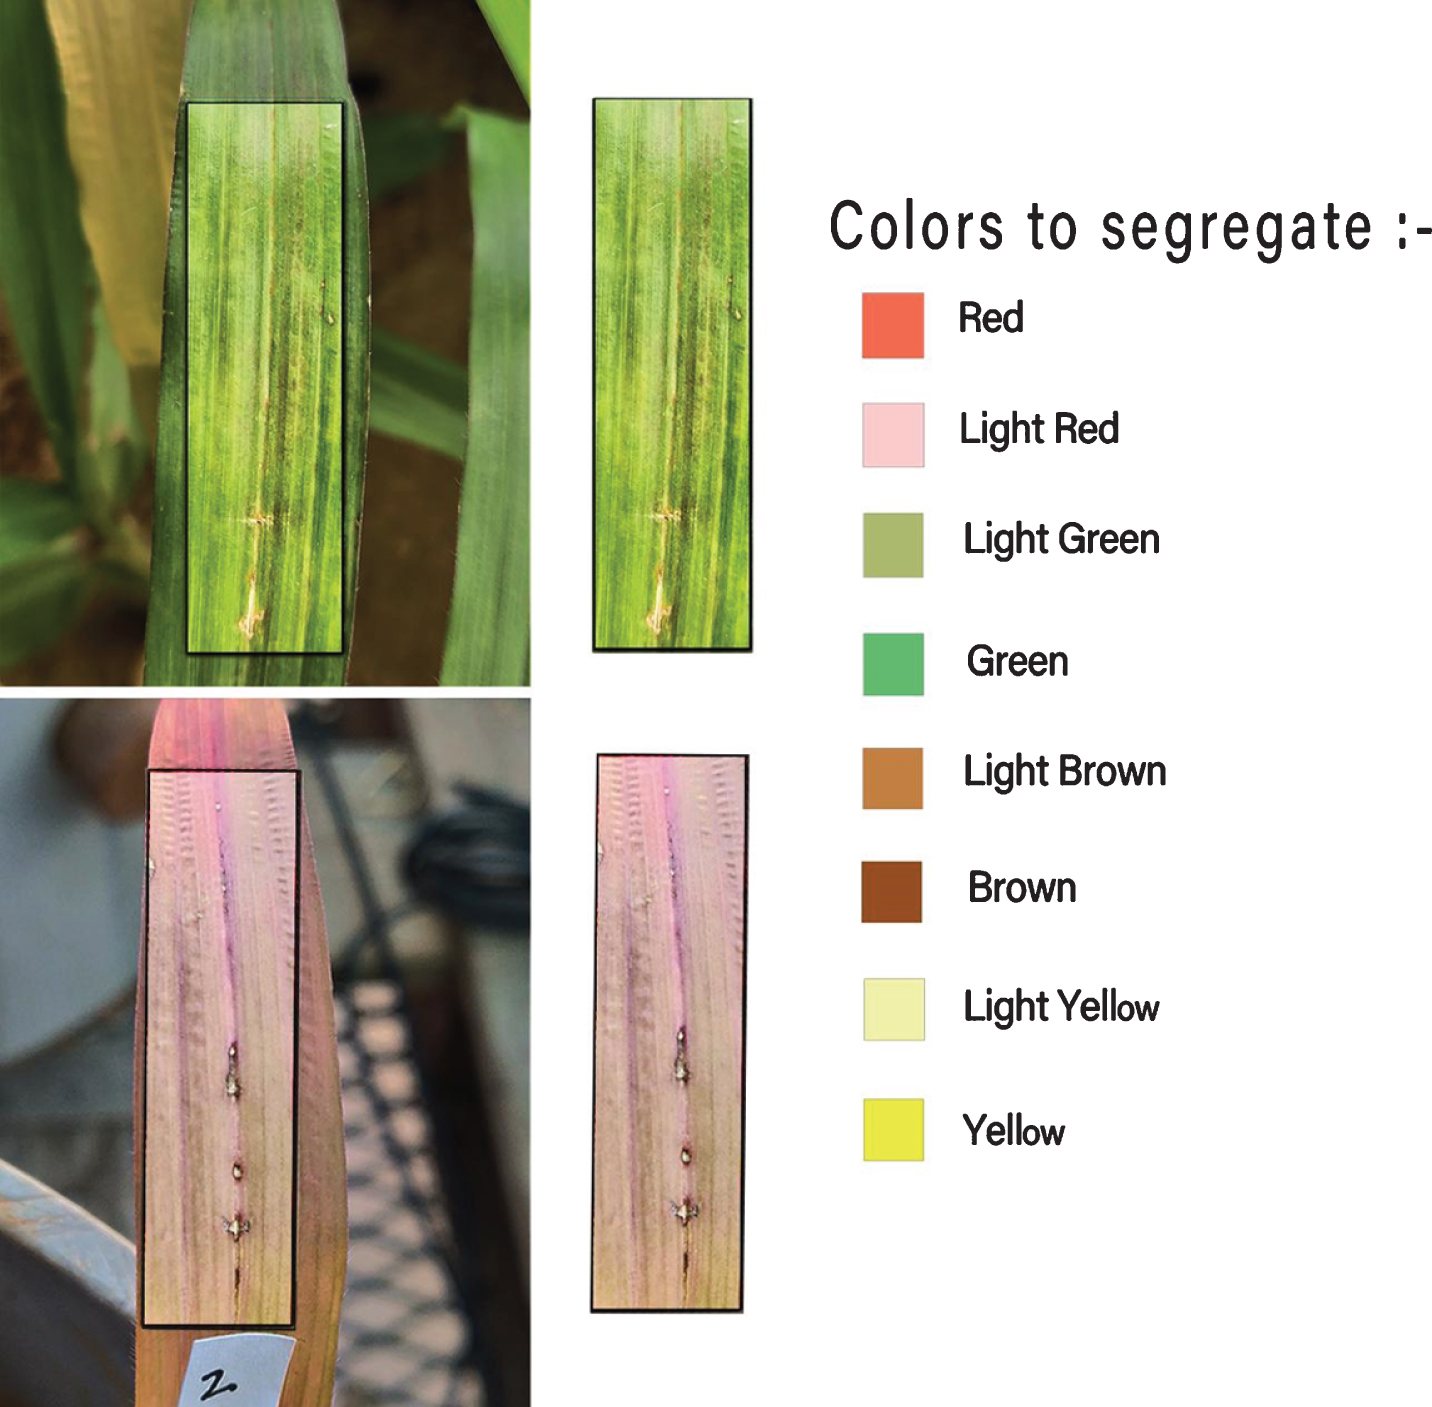
Image of the leaf and colors to be segregated.
Unsupervised K-means algorithm is generally used to form the different clusters of data points with each cluster holding similar data points. Each cluster is being initialized with a centroid and the number of clusters is user specific. From each data point, euclidean distance to all initialized centroids is calculated and assigned to that cluster, the centroid of which is at the minimum distance from the datapoint. The centroid of the cluster is updated by taking the average of all data points belonging to that cluster. Thus, in the end, the algorithm returns all the centroids of different clusters with each cluster holding similar data points. The efficiency of the unsupervised K-means algorithm will depend on the initialization of centroids for the clusters. This Python script gives and implements an architecture to segregate colors from a plant leaf with an optimized centroids initialization in the Unsupervised K-means algorithm by imposing different layers.
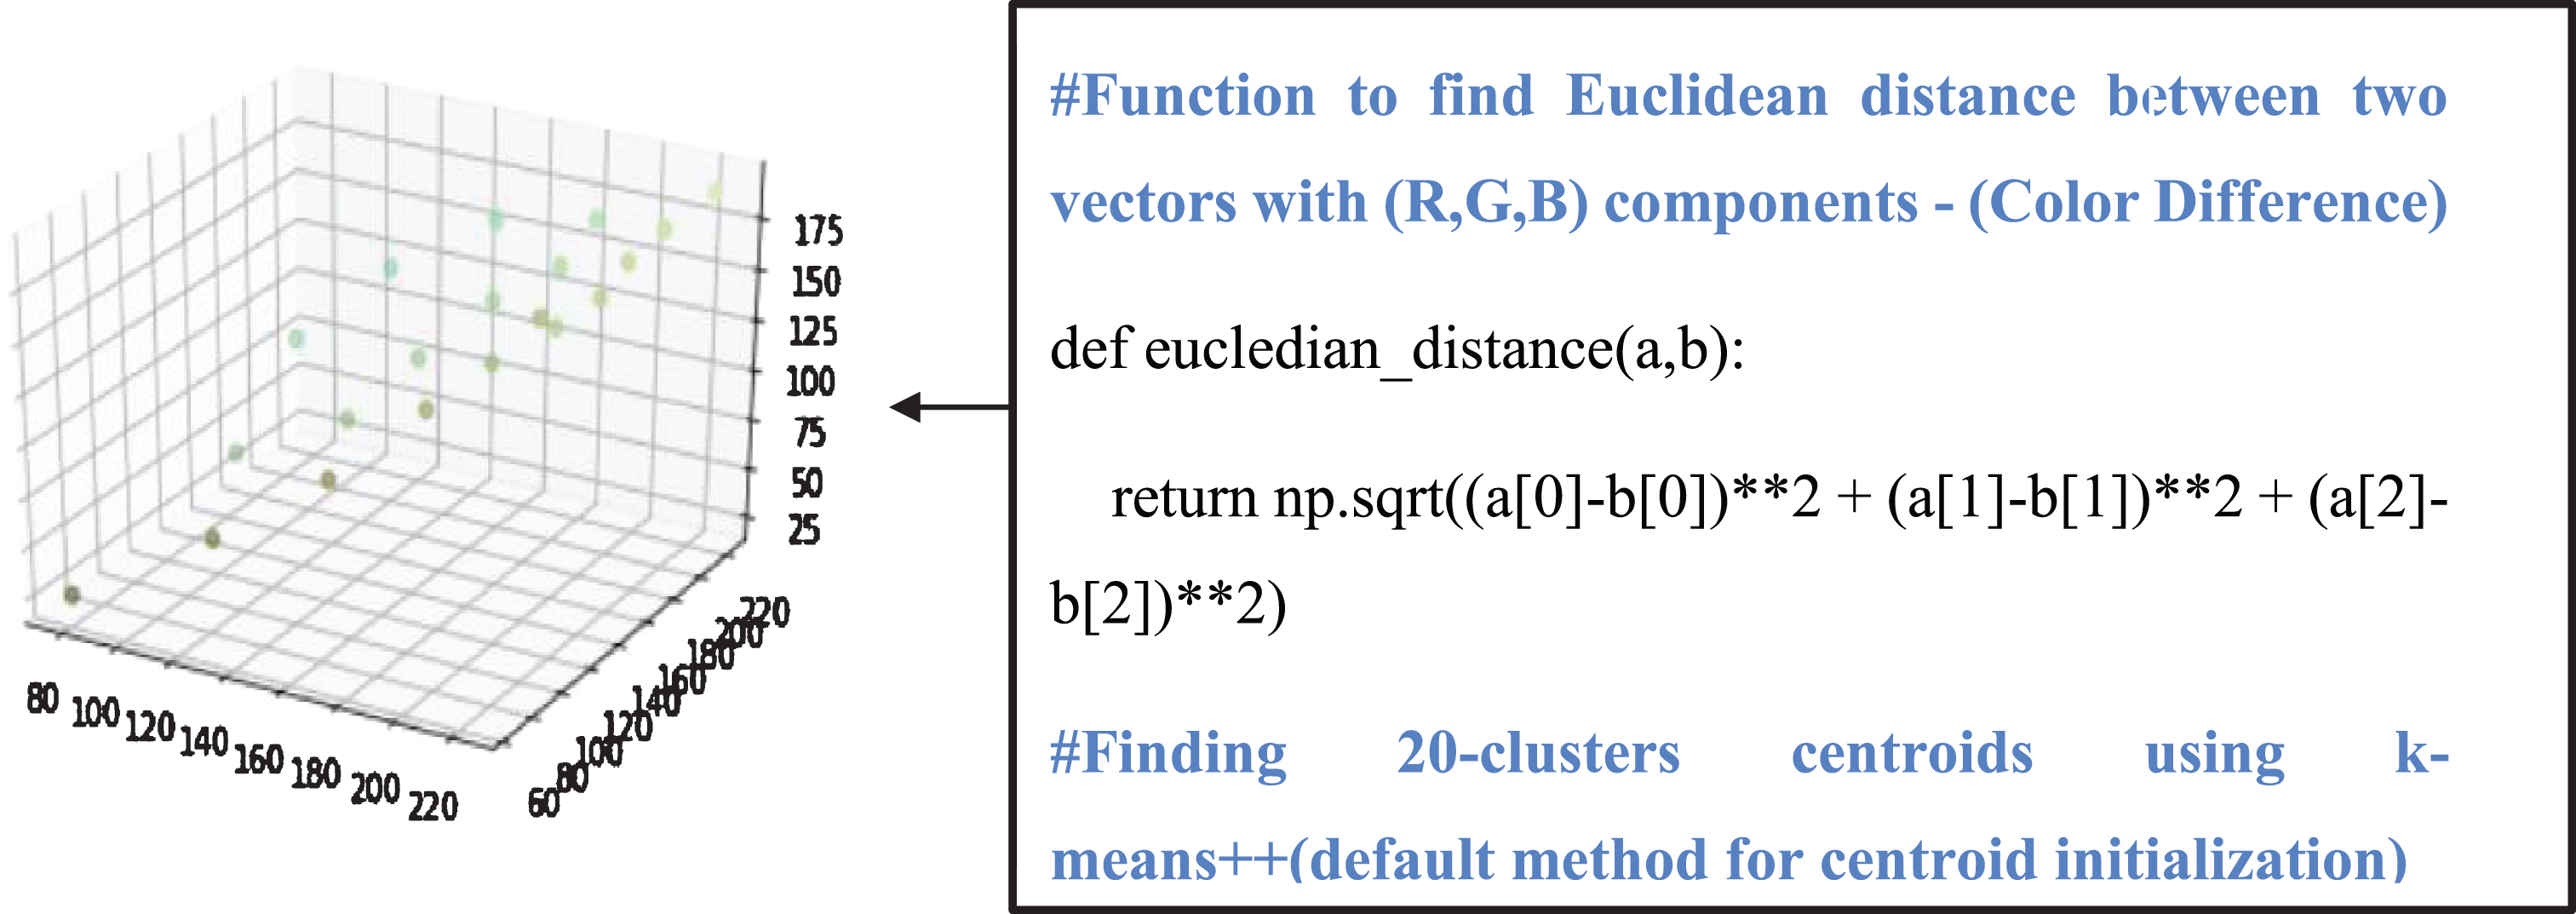
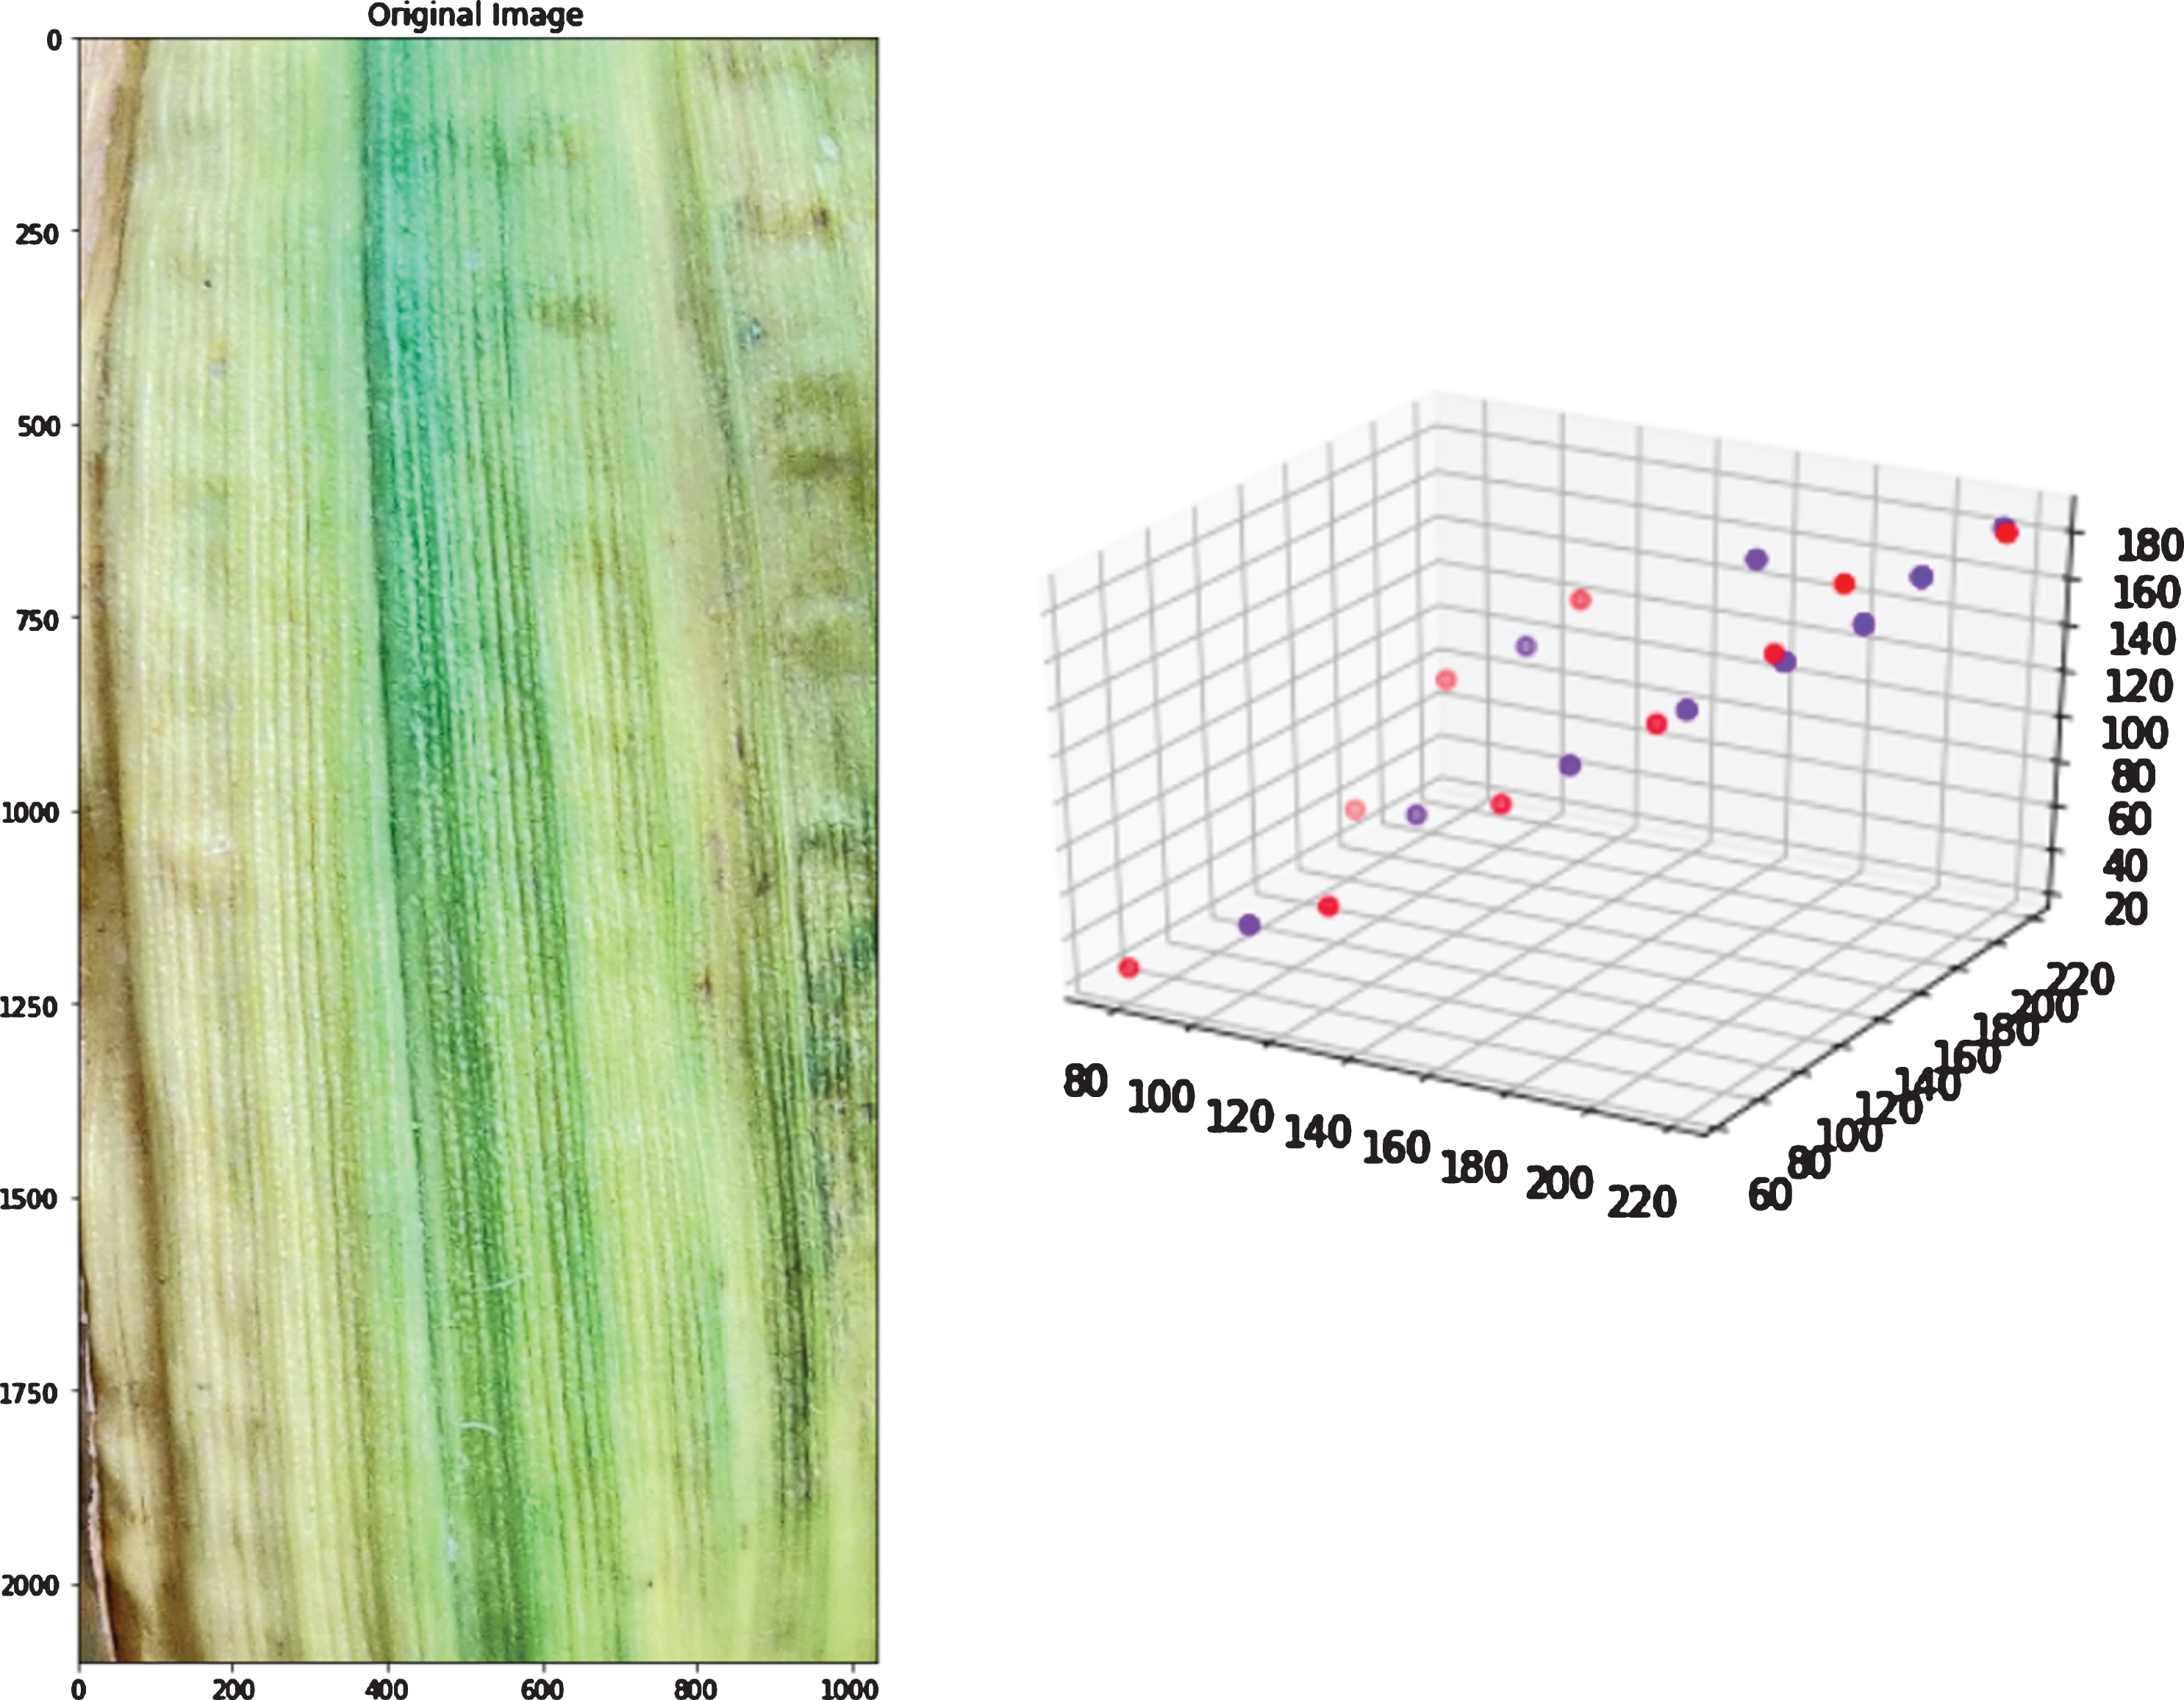
The image of the leaf is captured through a digital camera. The image is imported in RGB color space in the Python script. 8 bits (values ranging from 0–255) are assigned to each color component red(R), green(G) and blue(B). The sample image and colors to be segregated are shown in Fig. 2. Image pixels that are taken as data points are plotted in 3D (3-dimension) space using x, y, z axes as red, green, and blue components of RGB for each individual pixel (Fig. 3a). Clusters that are to be formed by the Adapted K-means algorithm are the clusters of these data points (Image Pixels). Similar data points belong to the same cluster and different data points belong to different clusters. Similar and different data points are characterized by small and large relative color differences. Color difference is defined as the euclidean distance between two data points that are encoded as (R, G, B) in the 3D color space.

a. Image Pixels as data points in RGB 3D space.
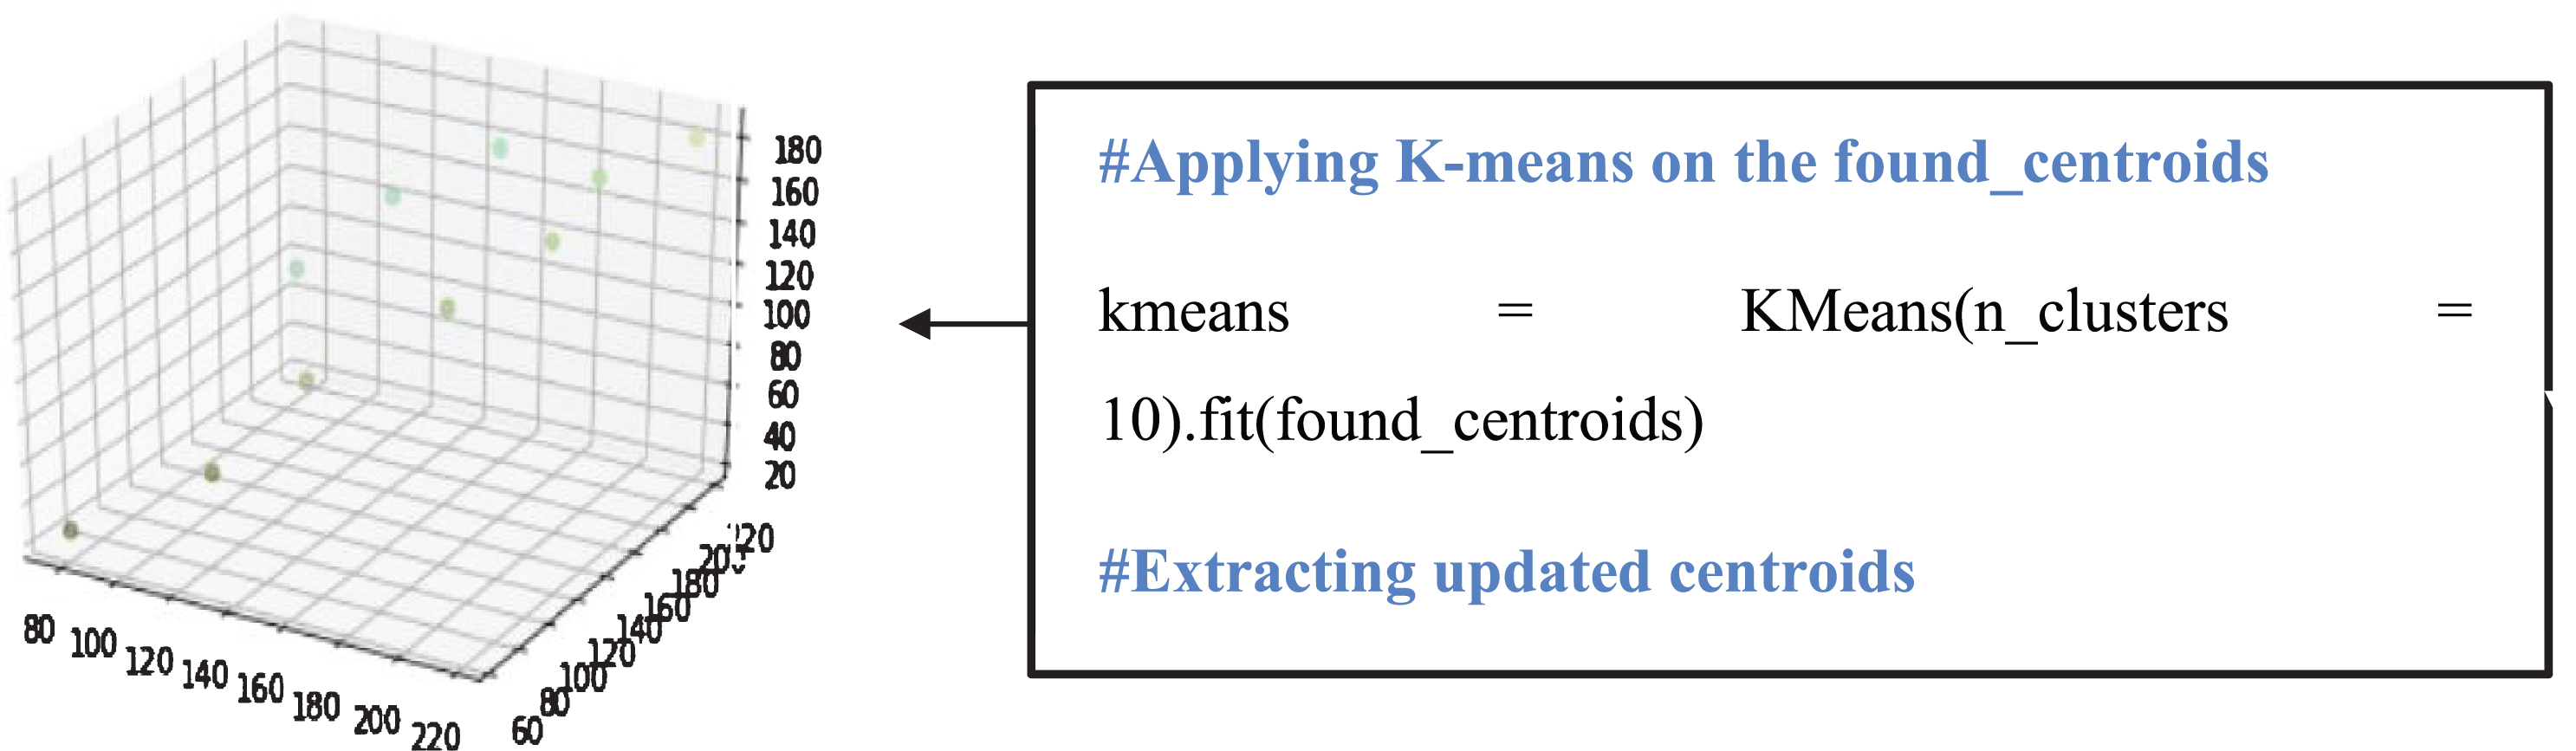
Color segregation is equivalent to form clusters of similar color shades. Hence, an unsupervised K-means algorithm is applied to the image pixels that are taken as data points in 3D space (Fig. 3a). The number of clusters that are chosen for the algorithm is high (20–25) to attain maximum information of RGB colors from the image. This is done to form accurate clusters. The centroids for each cluster are initialized using k-means++ method (python sklearn-library inbuilt method). After the complete run of this step, the centroids that are formed by the algorithm are shown in Fig. 3b. However, this strategy segregates color shades or equivalently formed clusters with small color differences. The original image, segregated image, and color shades are shown in Fig. 3d. Hence, different color shades obtained needs to have significant color differences.
b. Clusters centroids with the small color difference.
c. Clusters centroids with the significant color difference.

d. Colors segregated using the K-means algorithm.
Since, there are multiple shades of color with small color differences (Fig. 3d). Color shades with a small color difference are produced by the clusters, the centroids of which are similar or with the small color differences. And to obtain color shades with a significant color difference, clusters need to acquire a slightly large amount of data points. Equivalently, cluster number needs to be reduced, that is selected by the user (here 10 reduced clusters are used), to enlarge the size of the clusters along with finding accurate clusters centroids. This is done by applying the k-means algorithm on the recently founded centroids (Fig. 3b) of the clusters taken as data points in 3D space for new clusters. After a complete run of the algorithm on recently founded centroids, the centroids having small color differences are combined in a cluster. Equivalently, new centroids with significant color differences are formed. Note that, for enhancing the accuracy of results, the number of clusters should not be less than the number of colors to be segregated, while selecting the reduced number of clusters.
Applying Unsupervised K-means algorithm on image pixels using optimized centroids
In order to segregate colors from the image with colors having significant color differences, optimized centroids are used in the K-means clustering algorithm. K-means clustering algorithm is applied to the image pixels taken as data points in 3D space (Fig. 3a) using optimized or recently founded centroids rather than initializing random centroids using k-means++ method. After the complete run of the algorithm, clusters containing data points with a significant color difference are obtained.
Calculating the color proportion in the image
For the calculation of the color proportion present in the image of the leaf, a user-defined list of colors (Fig. 3g) with each element of the list representing RGB value is used. Color segregation is also dependent on the colors given by the user. To find the proportion of colors present, each cluster’s centroid is taken and compared with each color present in the user-defined list. The color from which cluster’s centroid is at a minimum Euclidean distance is assigned to all the data points present in that specific cluster. Therefore, the proportion of that color present in the image is calculated by dividing the number of data points present in that cluster with the total number of datapoints or image pixels present.

e. Colors segregated using adapted K-means algorithm.
f. Colors segregated using general K-means algorithm.
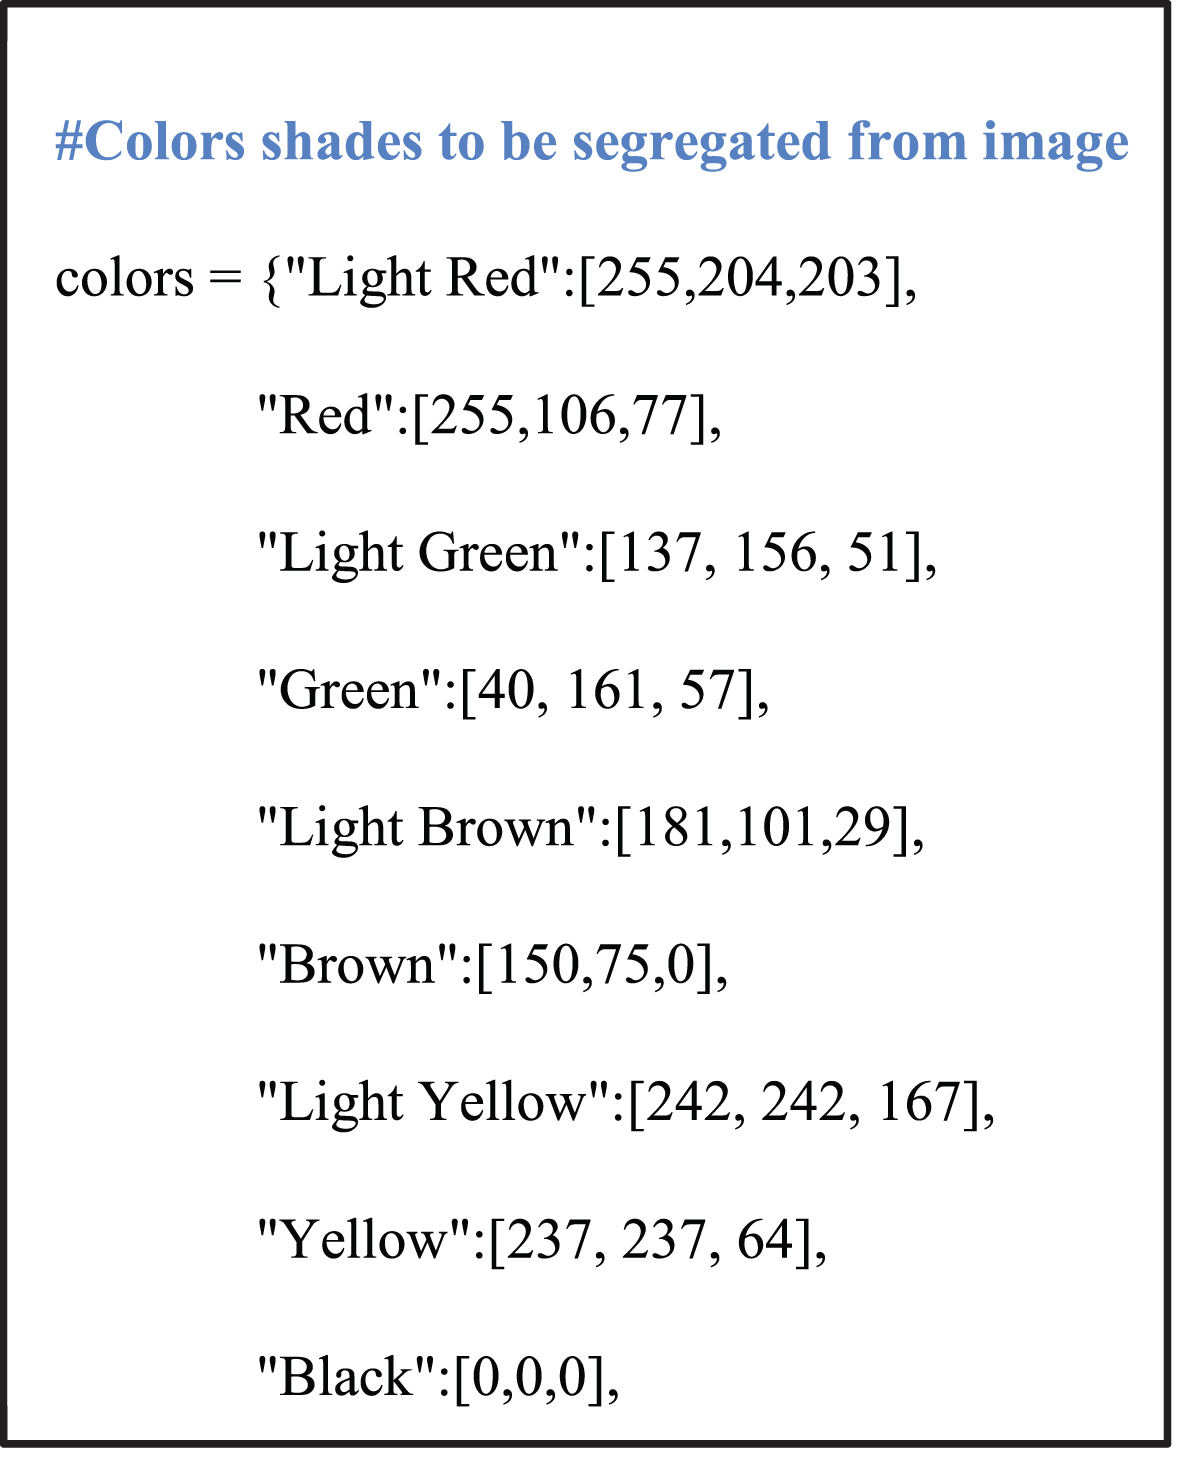
g. User-defined python colors dictionary. Using K-means algorithm to segregate color.
Validation of newly developed novel python script using experiments
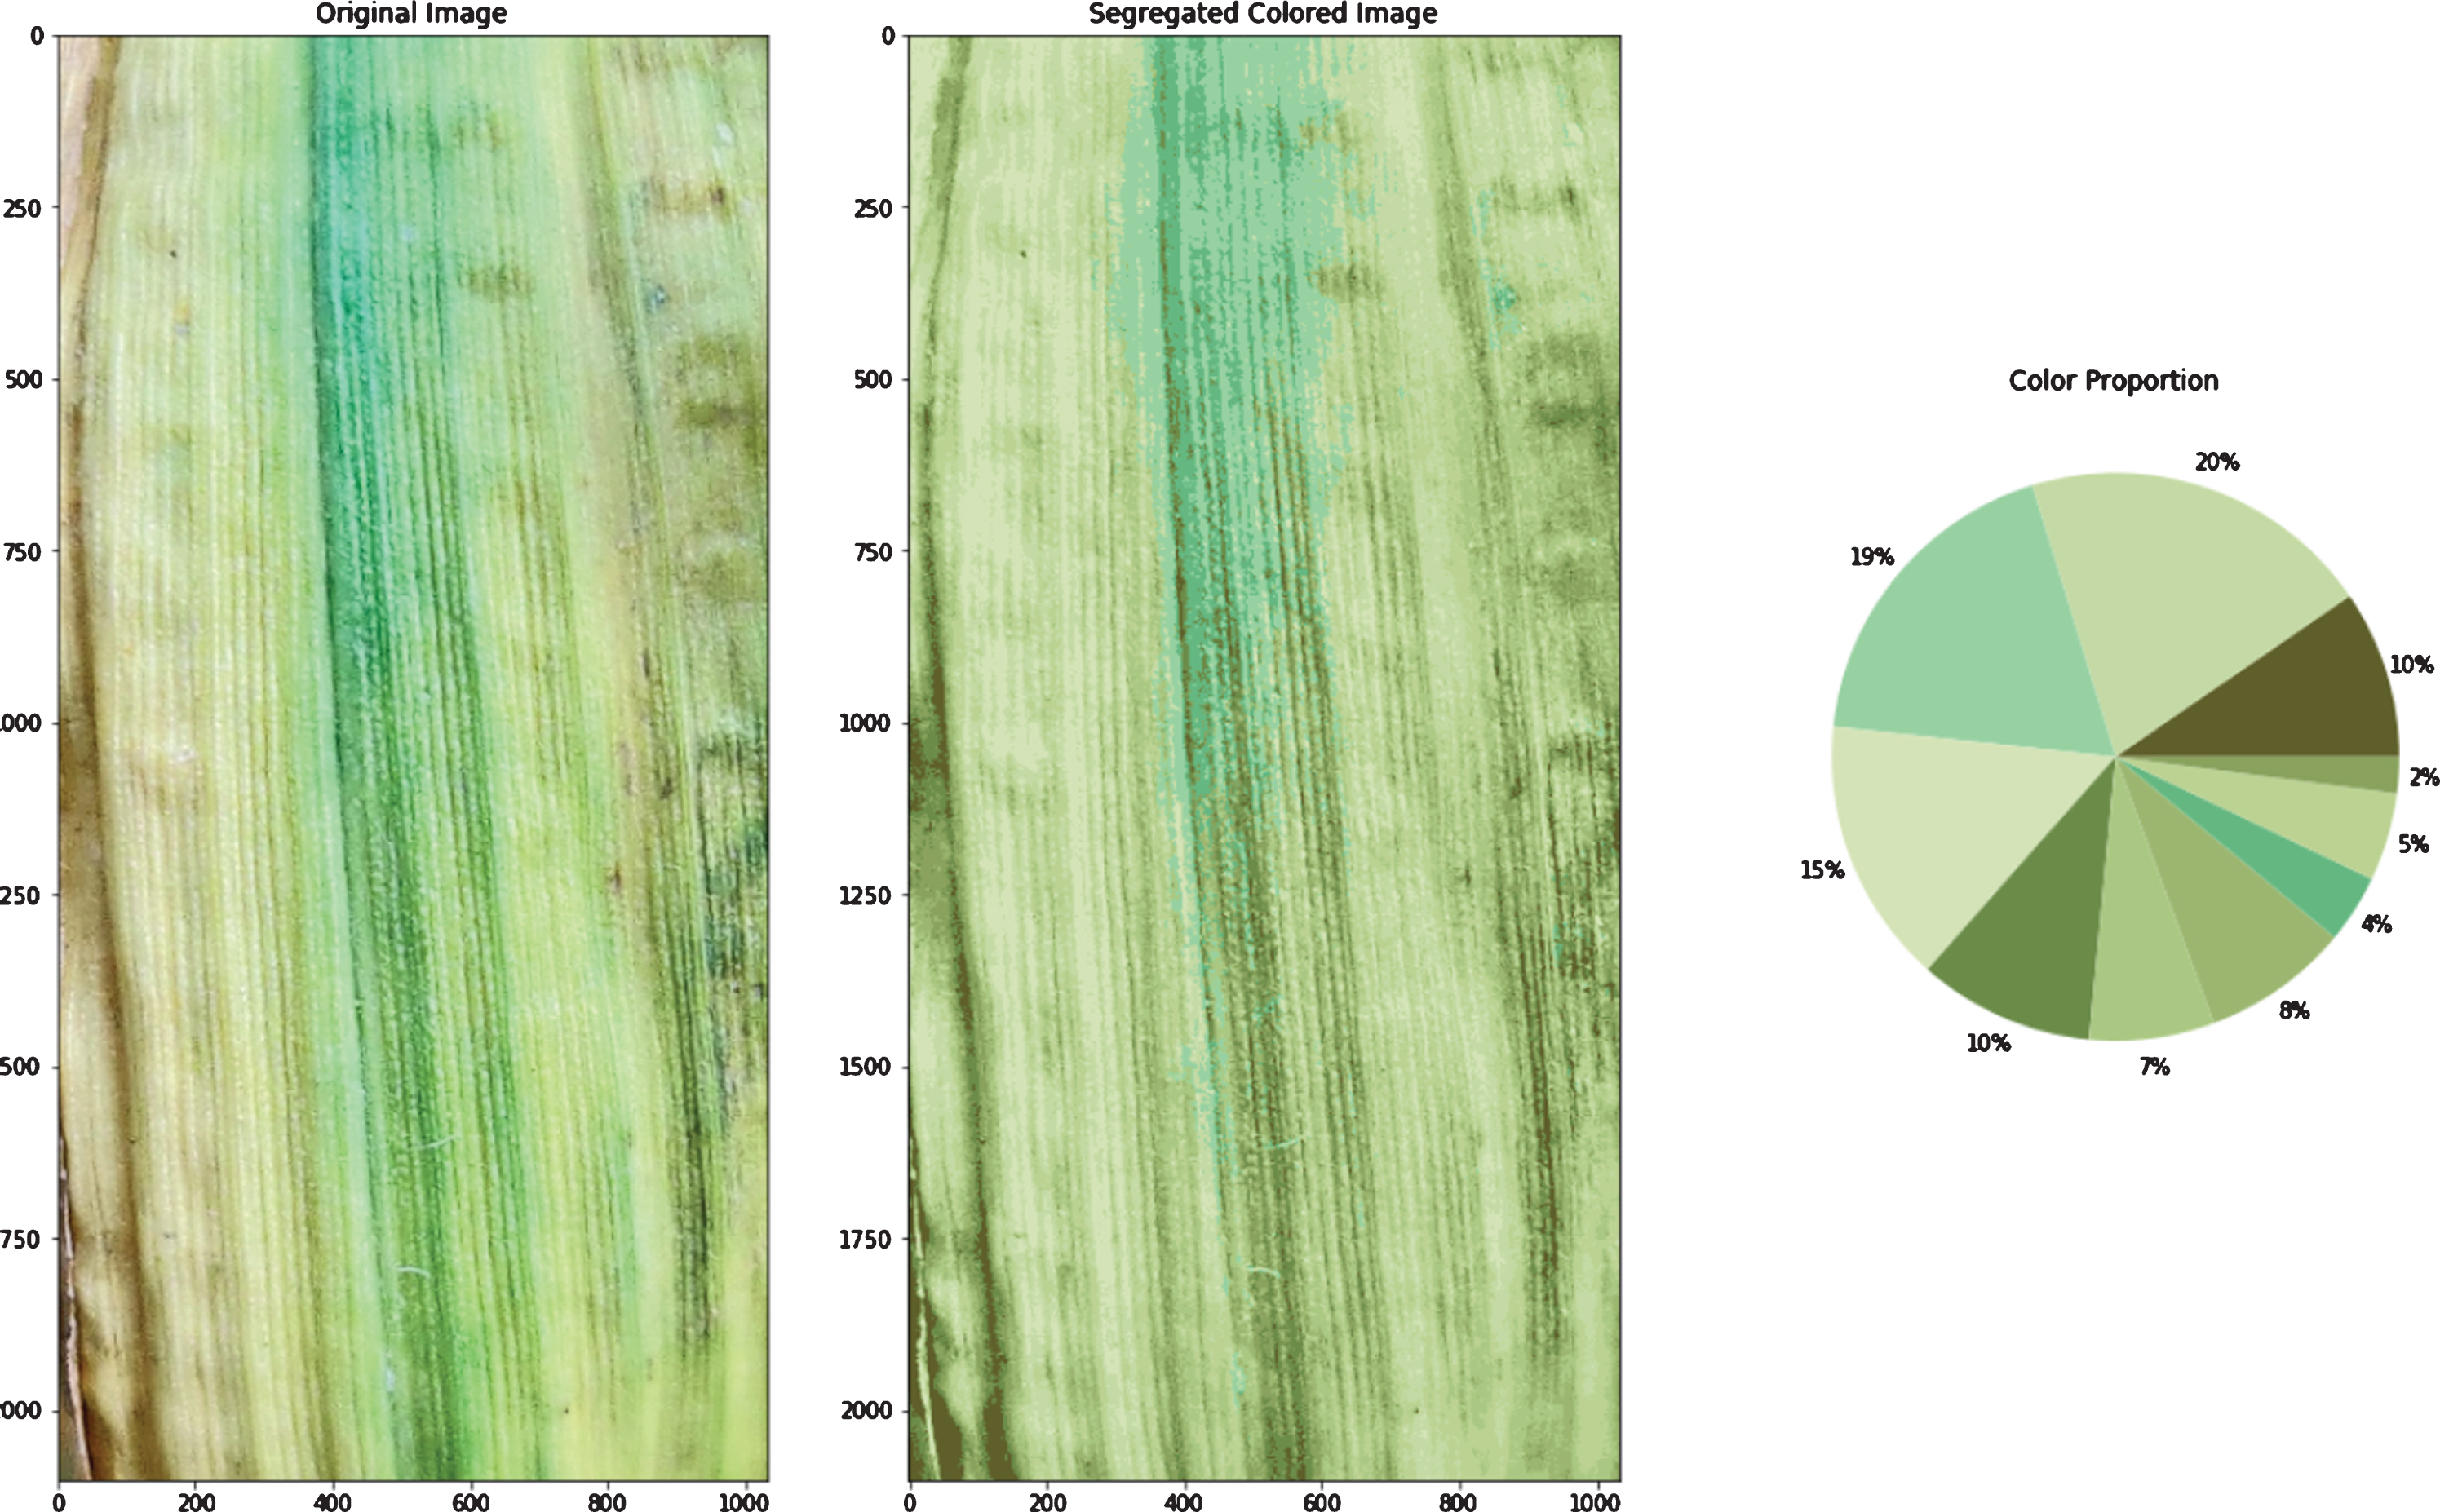
General K-means algorithm application on Image pixels taken as data points in 3D space (Fig. 3a) results in clusters formation with centroids (as shown in Fig. 3b). Optimized centroids that are used by the Adapted K-means algorithm are shown in Fig. 3c. Centroids shifted from the positions produced by the general k-means algorithm to new positions produced by the adapted k-means algorithm, in the 3D space are shown in Fig. 5. Optimized centroids are founded after applying some layers of the general K-means algorithm. The original image, color segregated image, and color proportion present in the leaf image that is the result of the general K-means algorithm (refer to Fig. 3f). The original image, color segregated image, and color proportion as the result of the Adapted K-means algorithm is shown in Fig. 3e. The results produced by the Adapted K-means algorithm on different images are shown in Fig. 4 (Figs. 4a-4f).
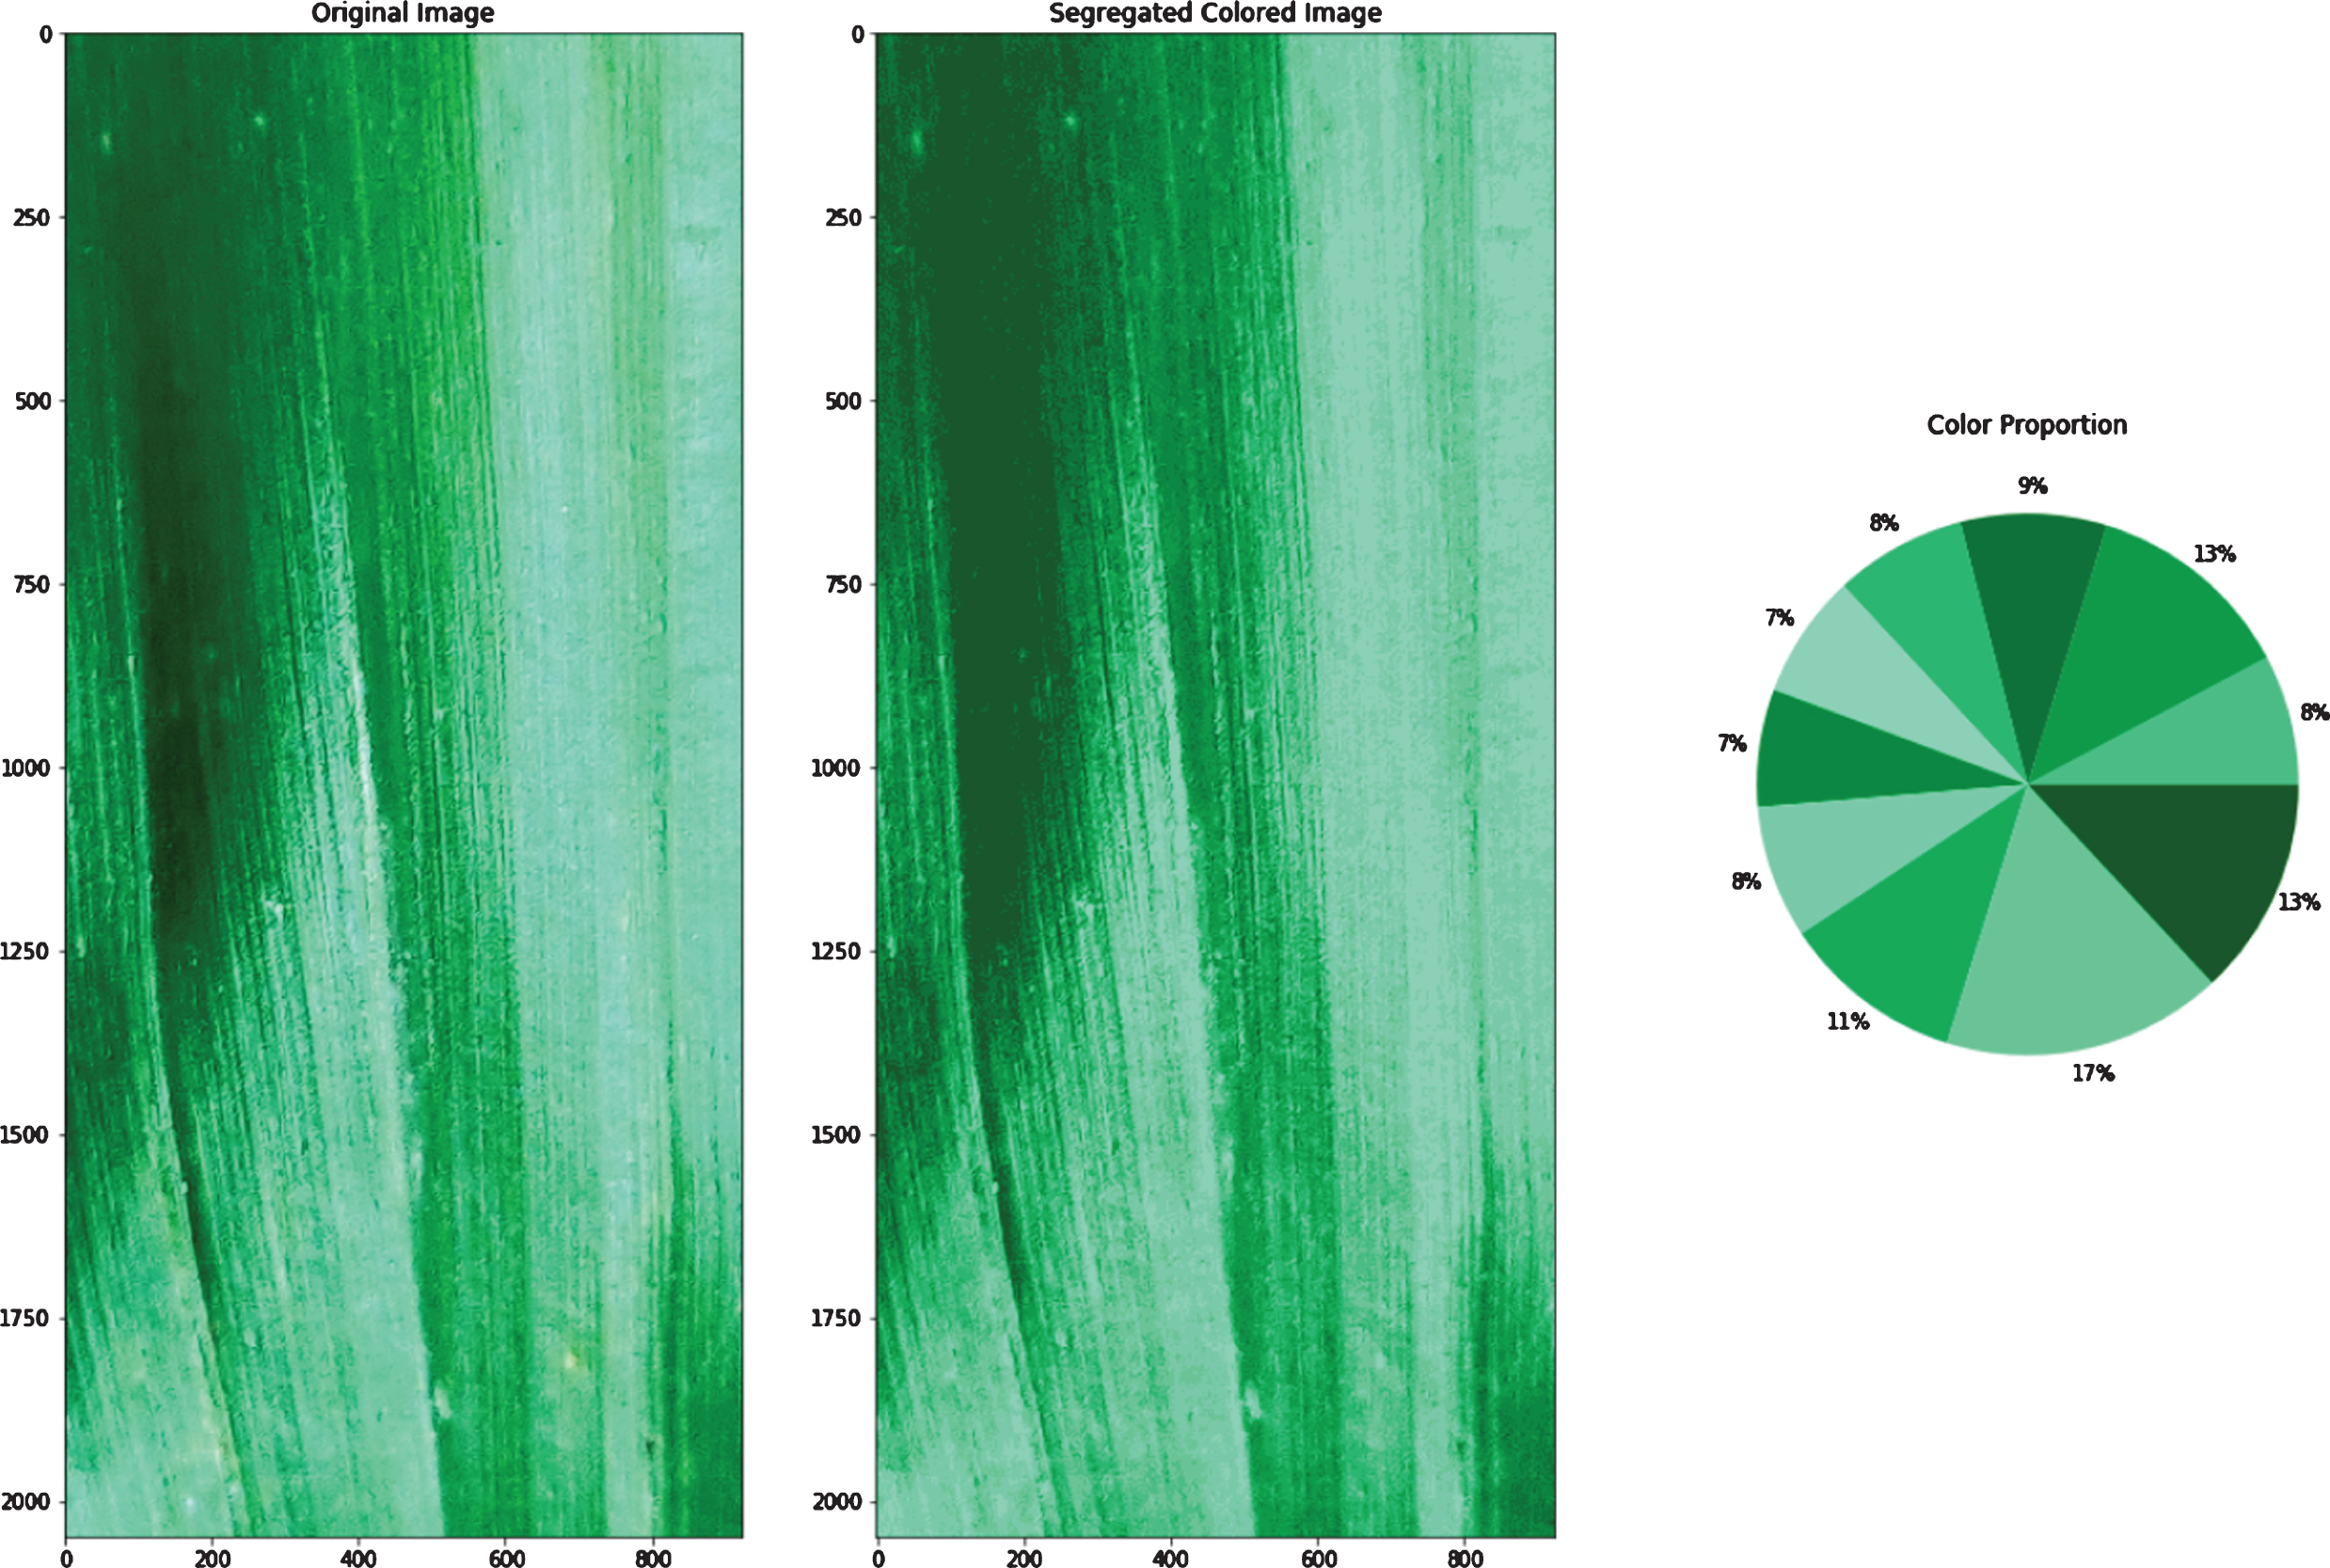
a. Colors segregated using adapted K-means algorithm.
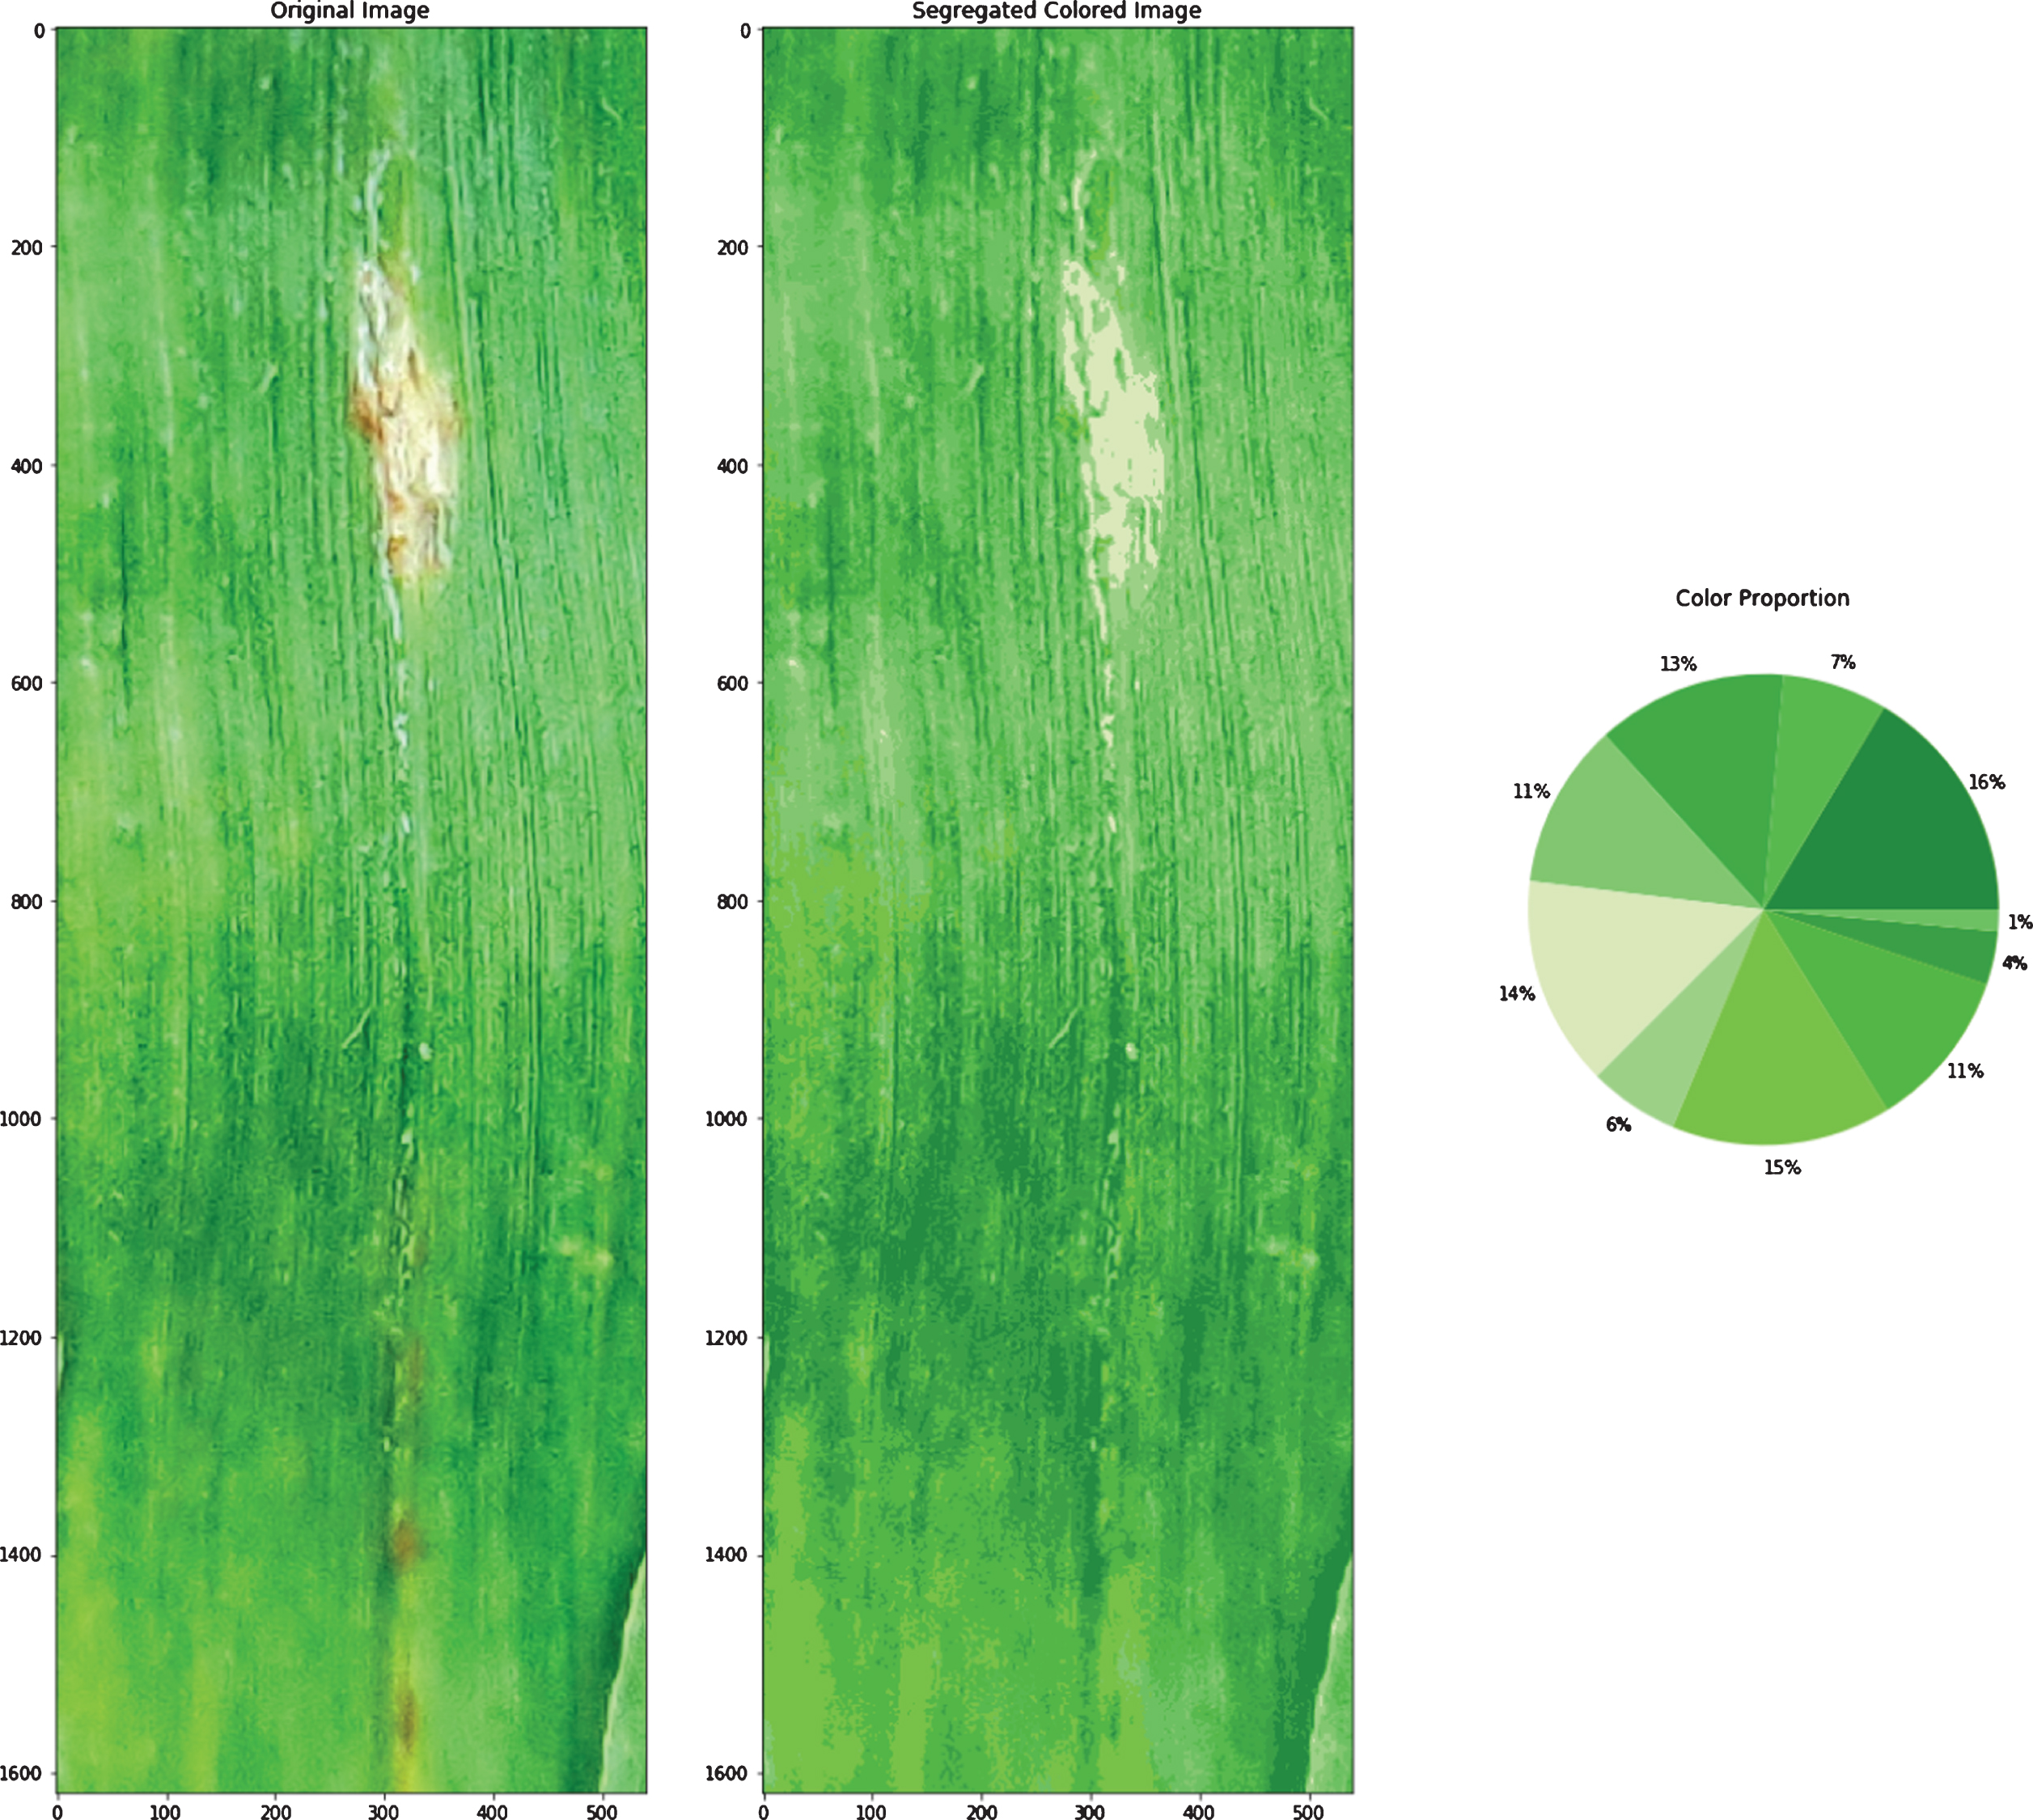
b Colors segregated using adapted K-means algorithm.
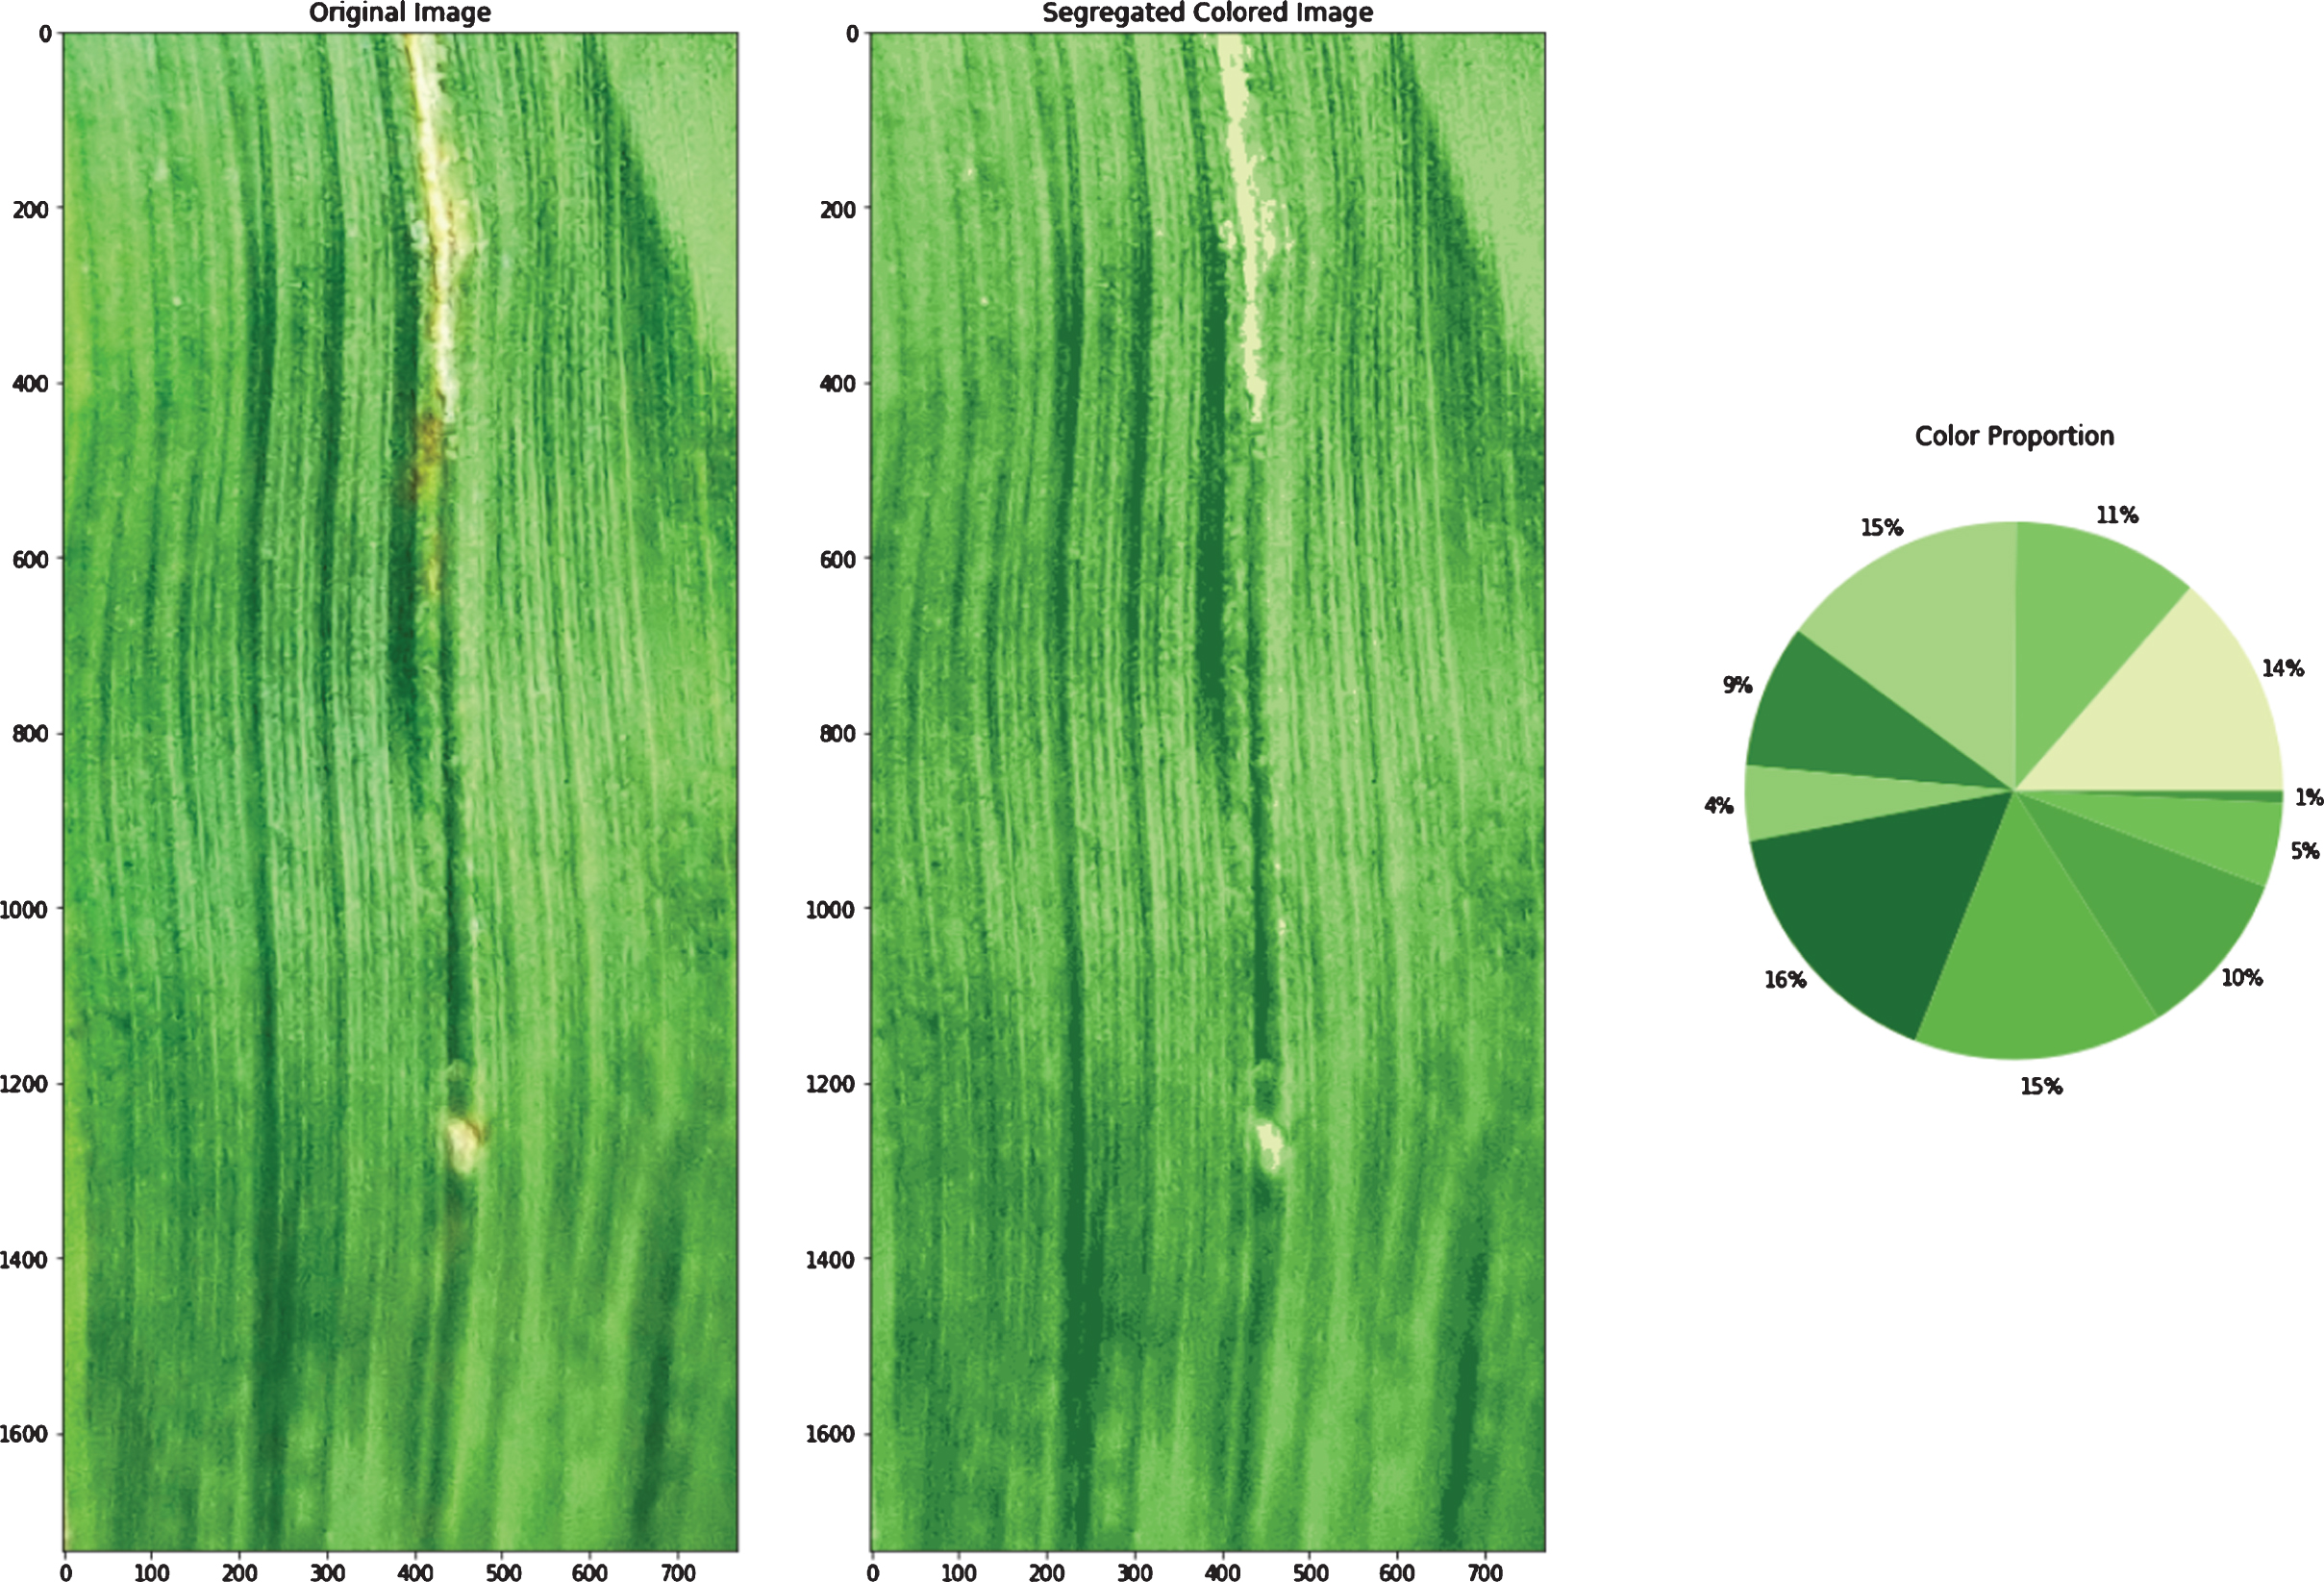
c. Colors segregated using adapted K-means algorithm.
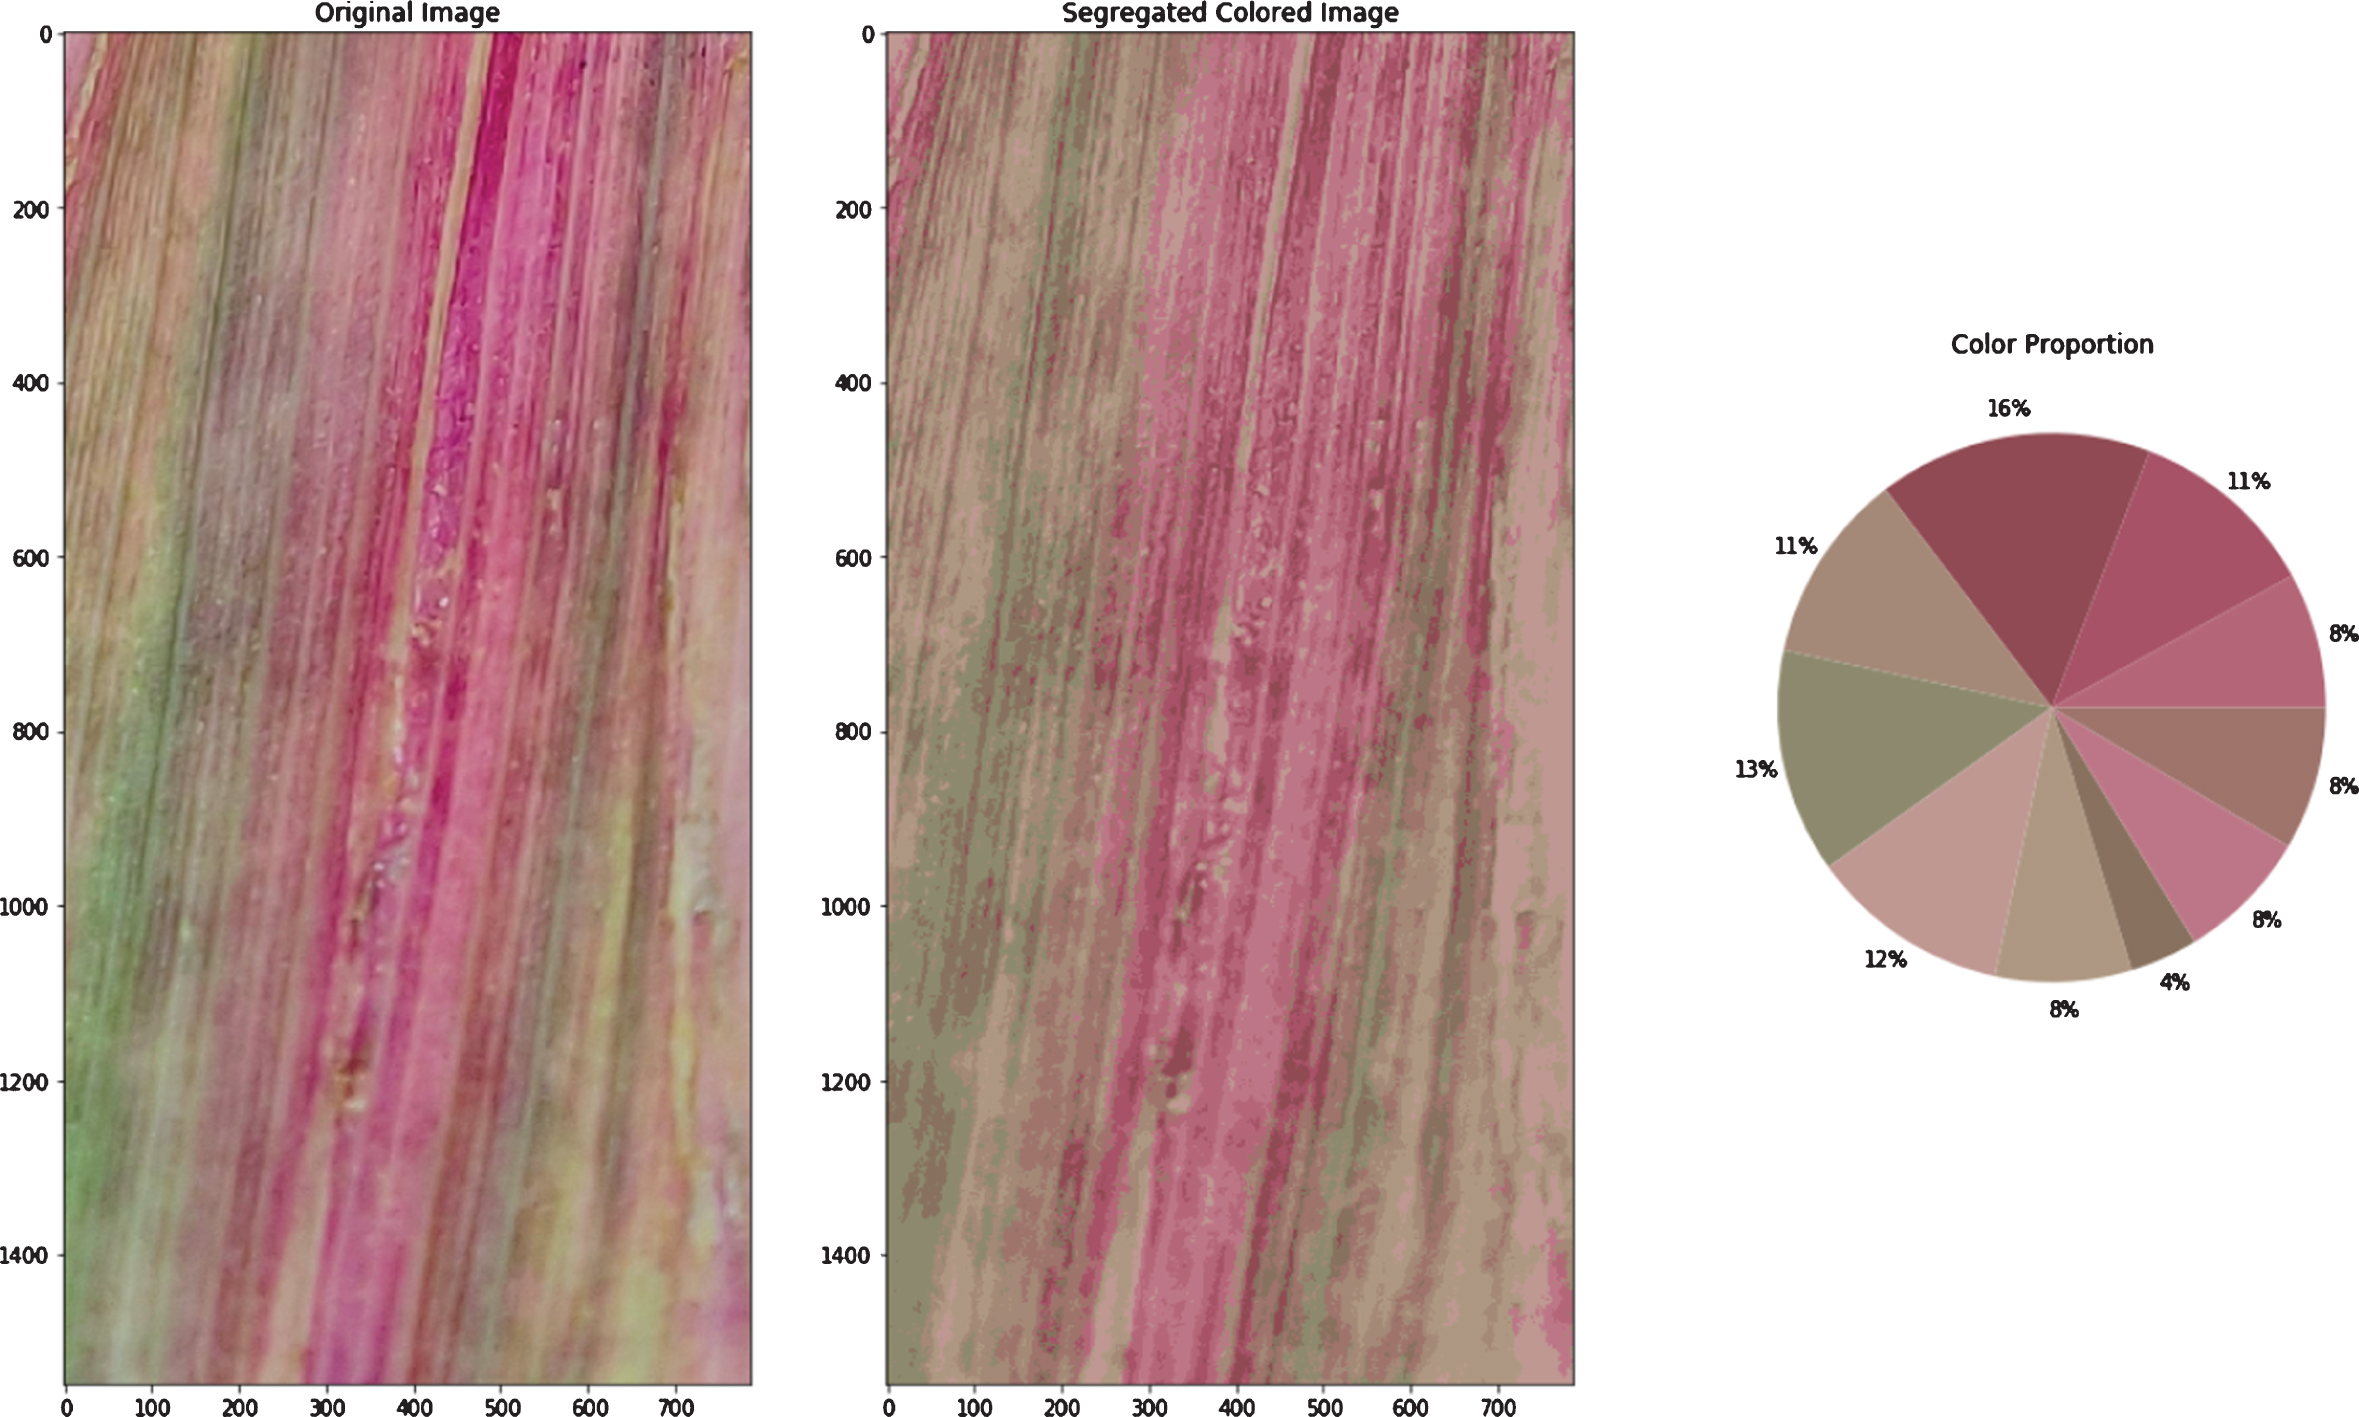
d. Colors segregated using adapted K-means algorithm.
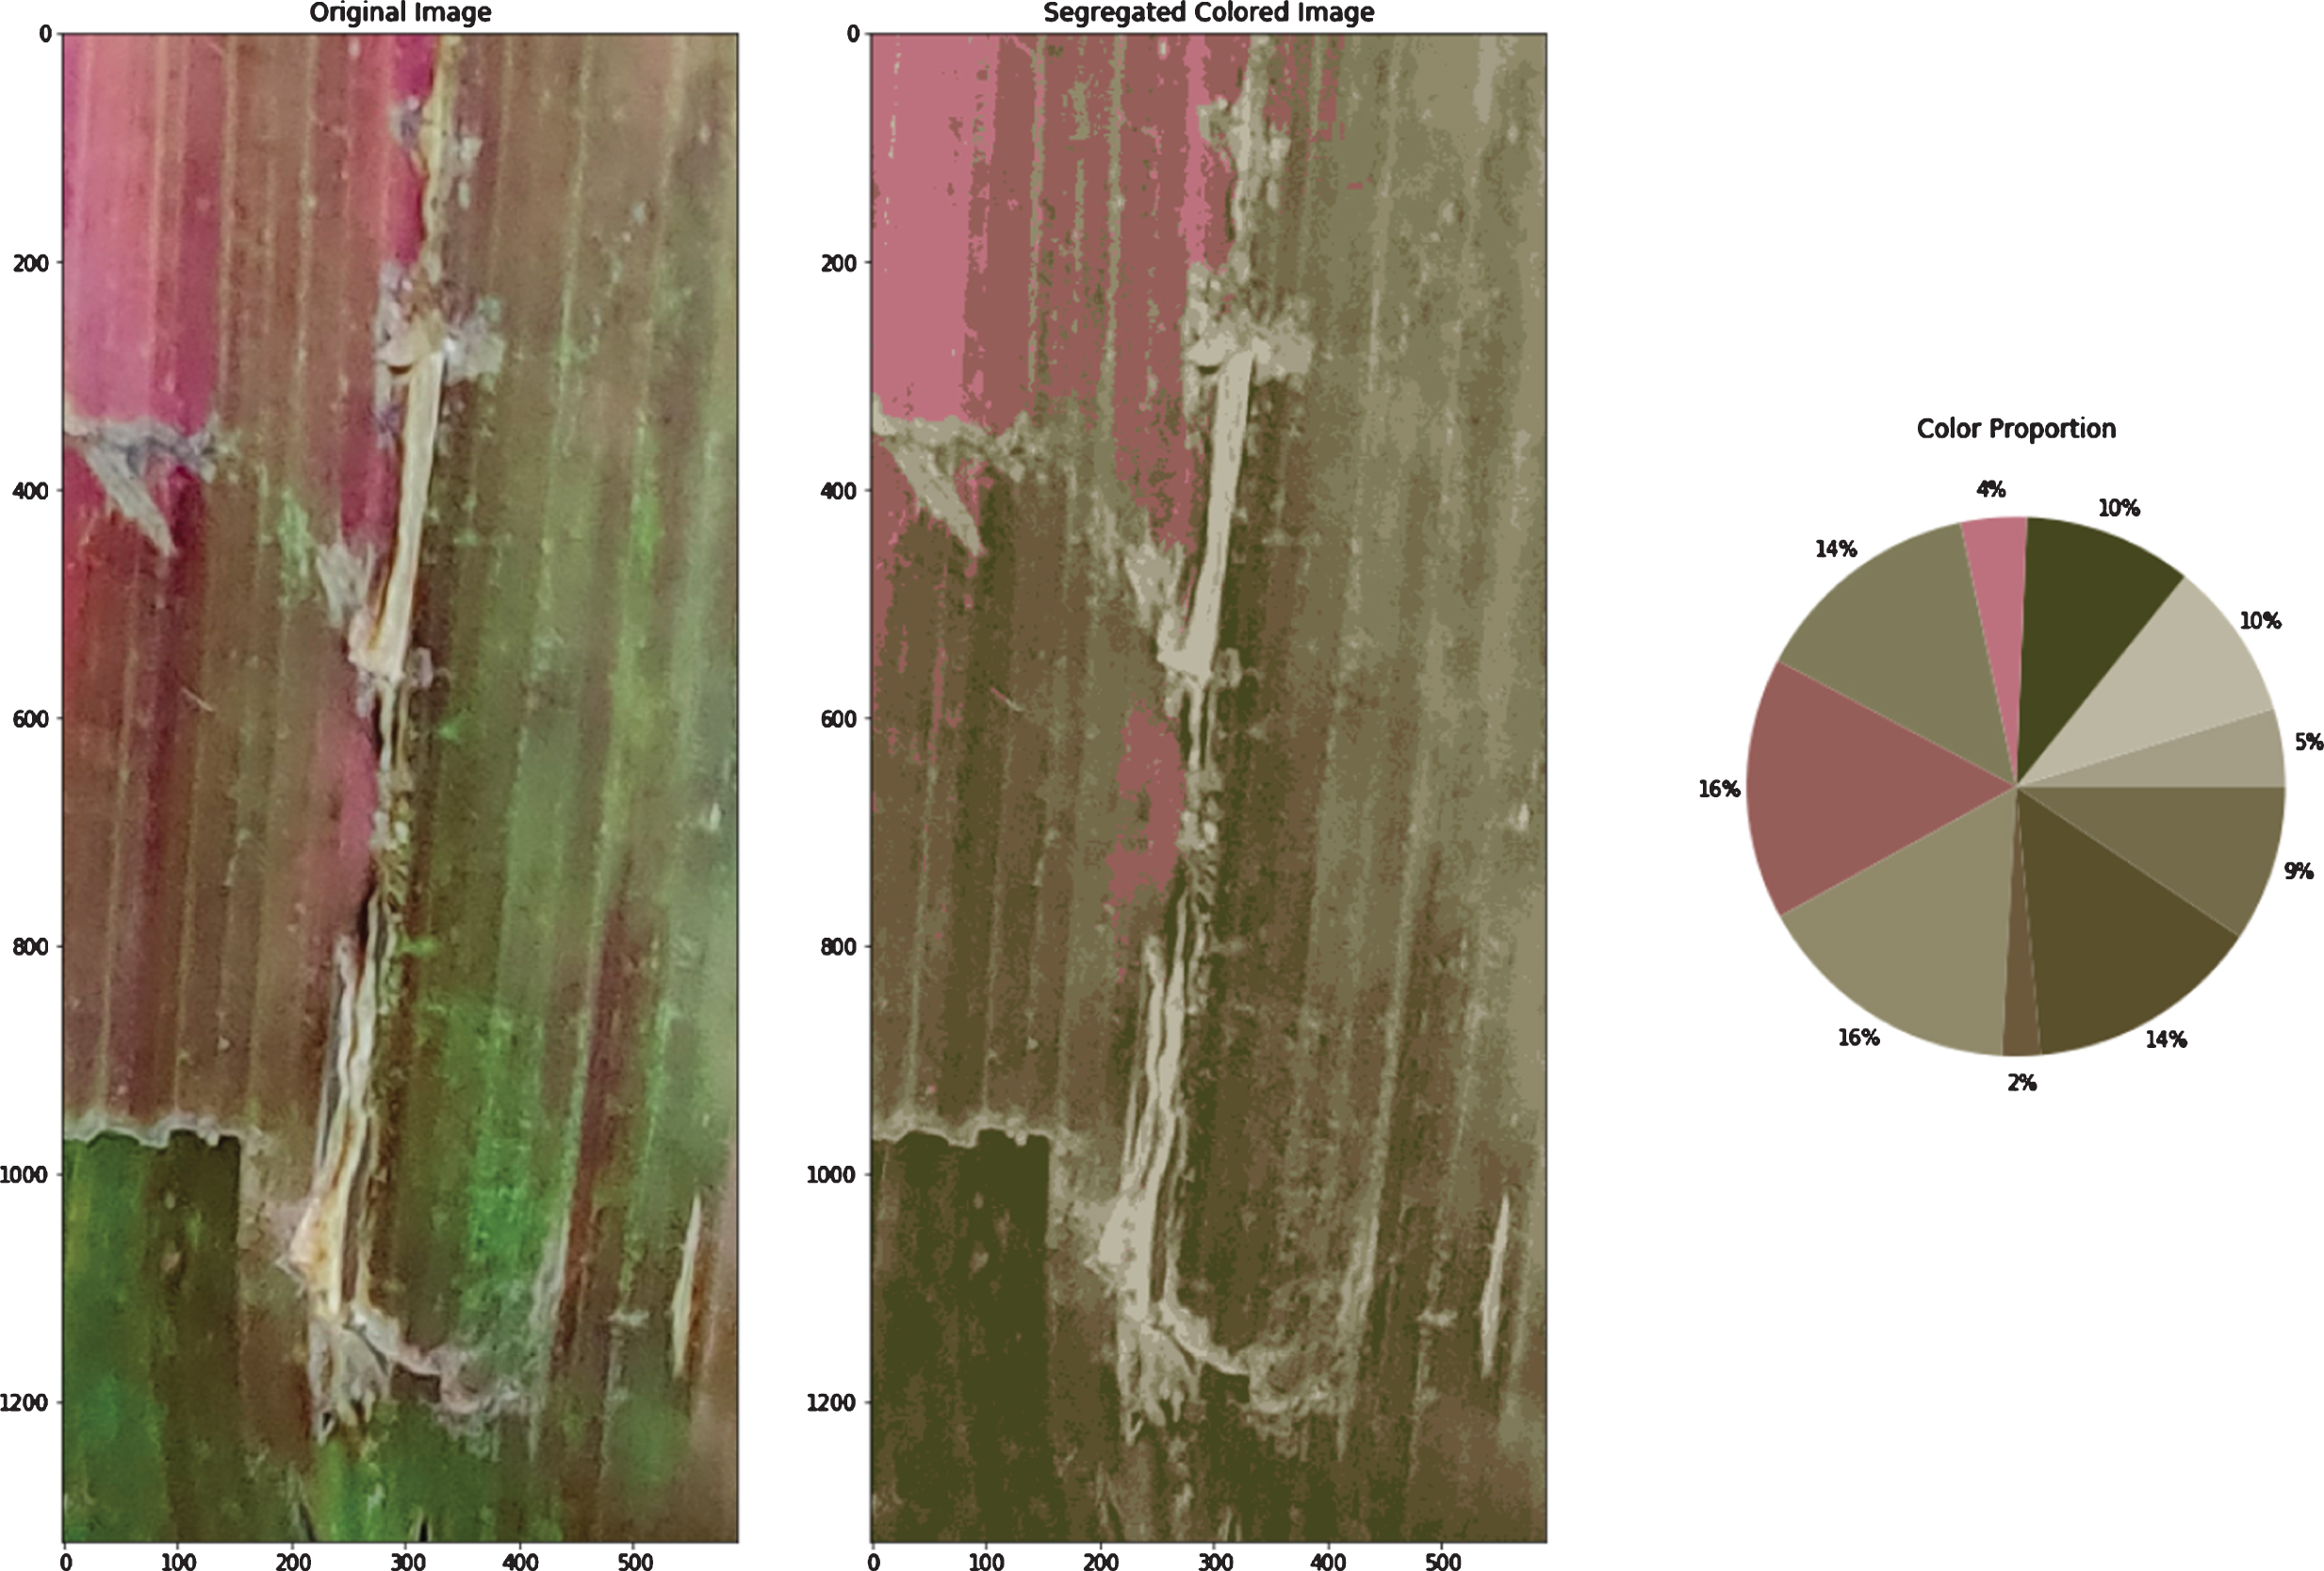
e Colors segregated using adapted K-means algorithm.
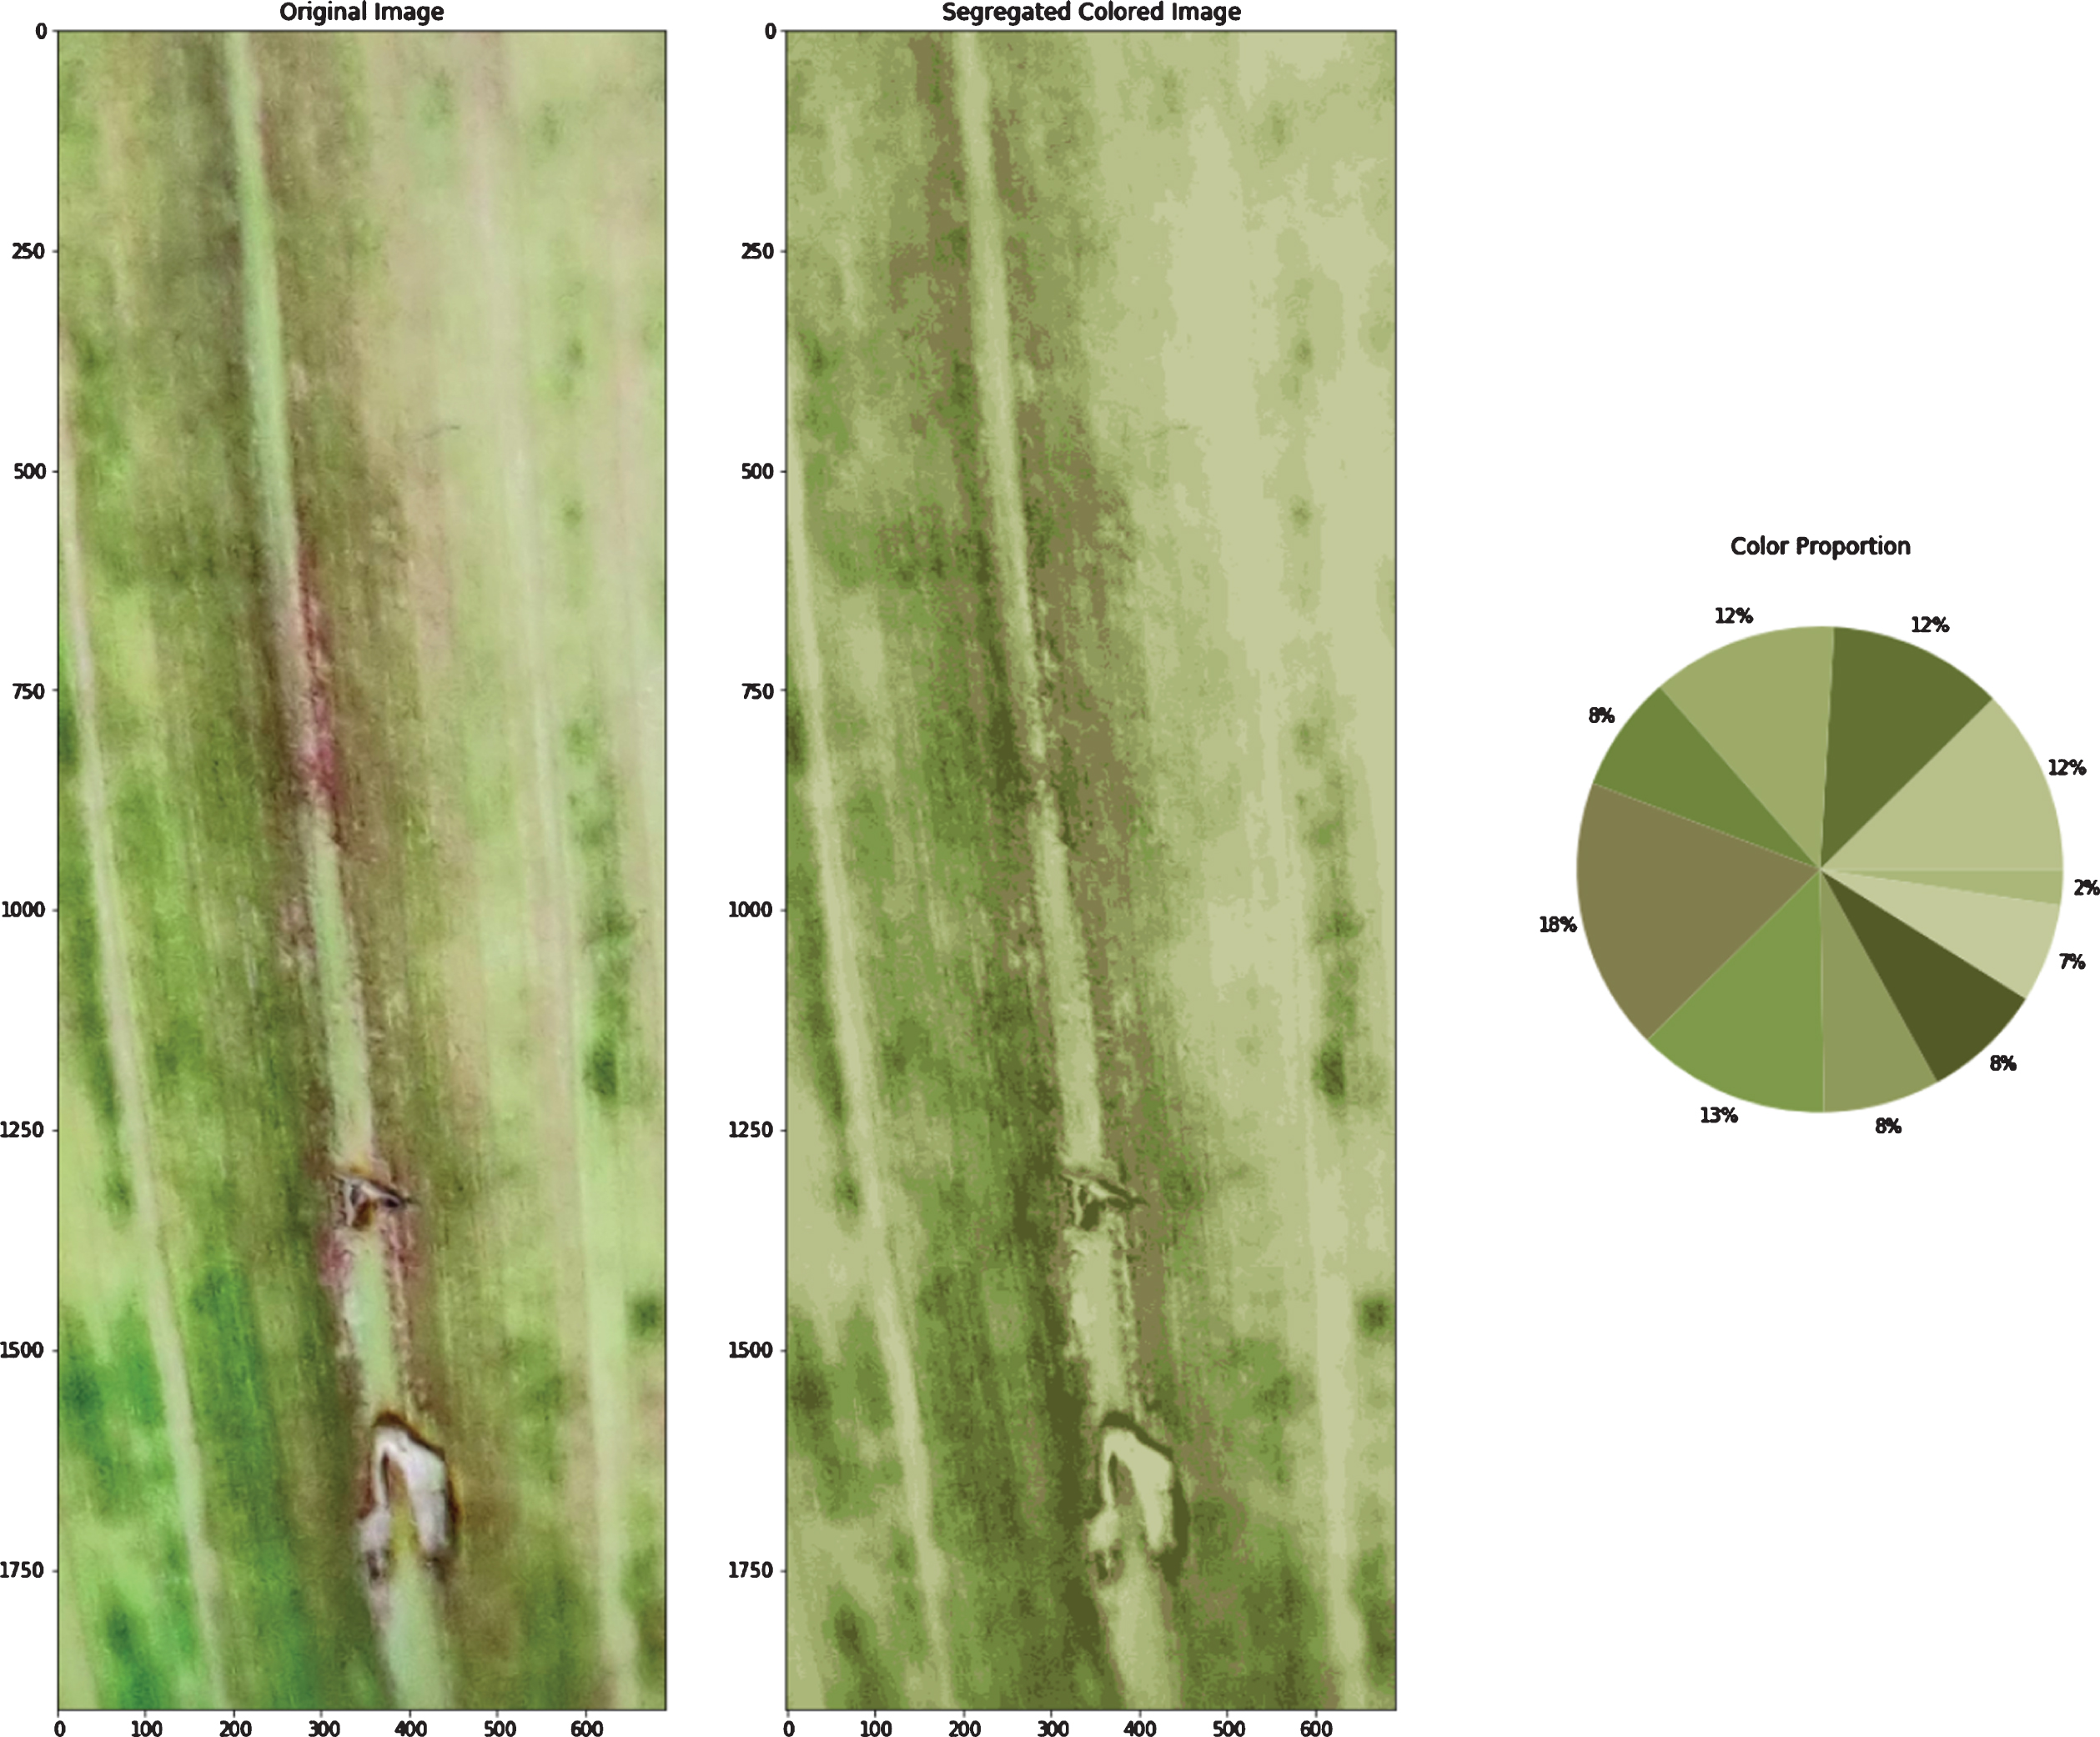
f. Colors segregated using adapted K-means algorithm. Results obtained from the Adapted K-means algorithm.
Centroids found using K-means (blue) and Adapted K-means (red) using image (left).
Since, the Adapted K-means algorithm’s first step involves the implementation of general K-means itself. The results produced by the general K-means algorithm are then enhanced by using optimized layers. Hence, the results are more accurate in the Adapted K-means algorithm and are comparable with Fig. 3e and Fig. 3f. This implies that the proportion of the colors segregated by the two algorithms differ. To make this analysis and comparison more robust, further study is carried out. The images produced by the general k-means and the adapted k-means algorithm are taken and similarity is calculated between the images. The color segregated image produced by the k-means and the adapted k-means, the difference between two images in grayscale, masked difference image, and the final image with the dark green area of difference are shown in Figs. 6a-6g. To indicate the areas that contain the difference in the colors presented in the color segregated image produced by the k-means and the adapted k-means algorithm, different indications on the image are used. Counters are drawn on the color segregated images (produced by the k-means and adapted k-means algorithms) to indicate the regions, where there is a difference in color segregation. Then, a grayscale image is produced indicating the white areas as the areas containing almost no difference in color segregation (produced by the k-means and adapted k-means algorithms). Then, for more clarity, the difference is indicated by using a masked image that shows the green areas as the difference and finally green darken areas are plotted on the image indicating the difference. Table 1 shows the similarity between the images produced by the k-means and the adapted k-means algorithm. It can be seen that there is almost no image with similarity > 95%. Therefore, the results produced by the k-means and the adapted k-means algorithm differ with significant value. Table 2 summarizes recent image processing techniques used for analyzing soil and plant parameters. It can be observed that there is an increasing trend towards automation in estimating certain soil parameters such as crack and moisture in geotechnical engineering. Studies [21, 25–27] have attempted to automate soil crack quantification using image or video processing recently. While, studies [28, 29] have identified novel optical fiber technology for determining soil moisture and temperature in large scale applications. Nevertheless, the robustness of above methodologies needs to be compared and discussed with respect to present machine learning approach.
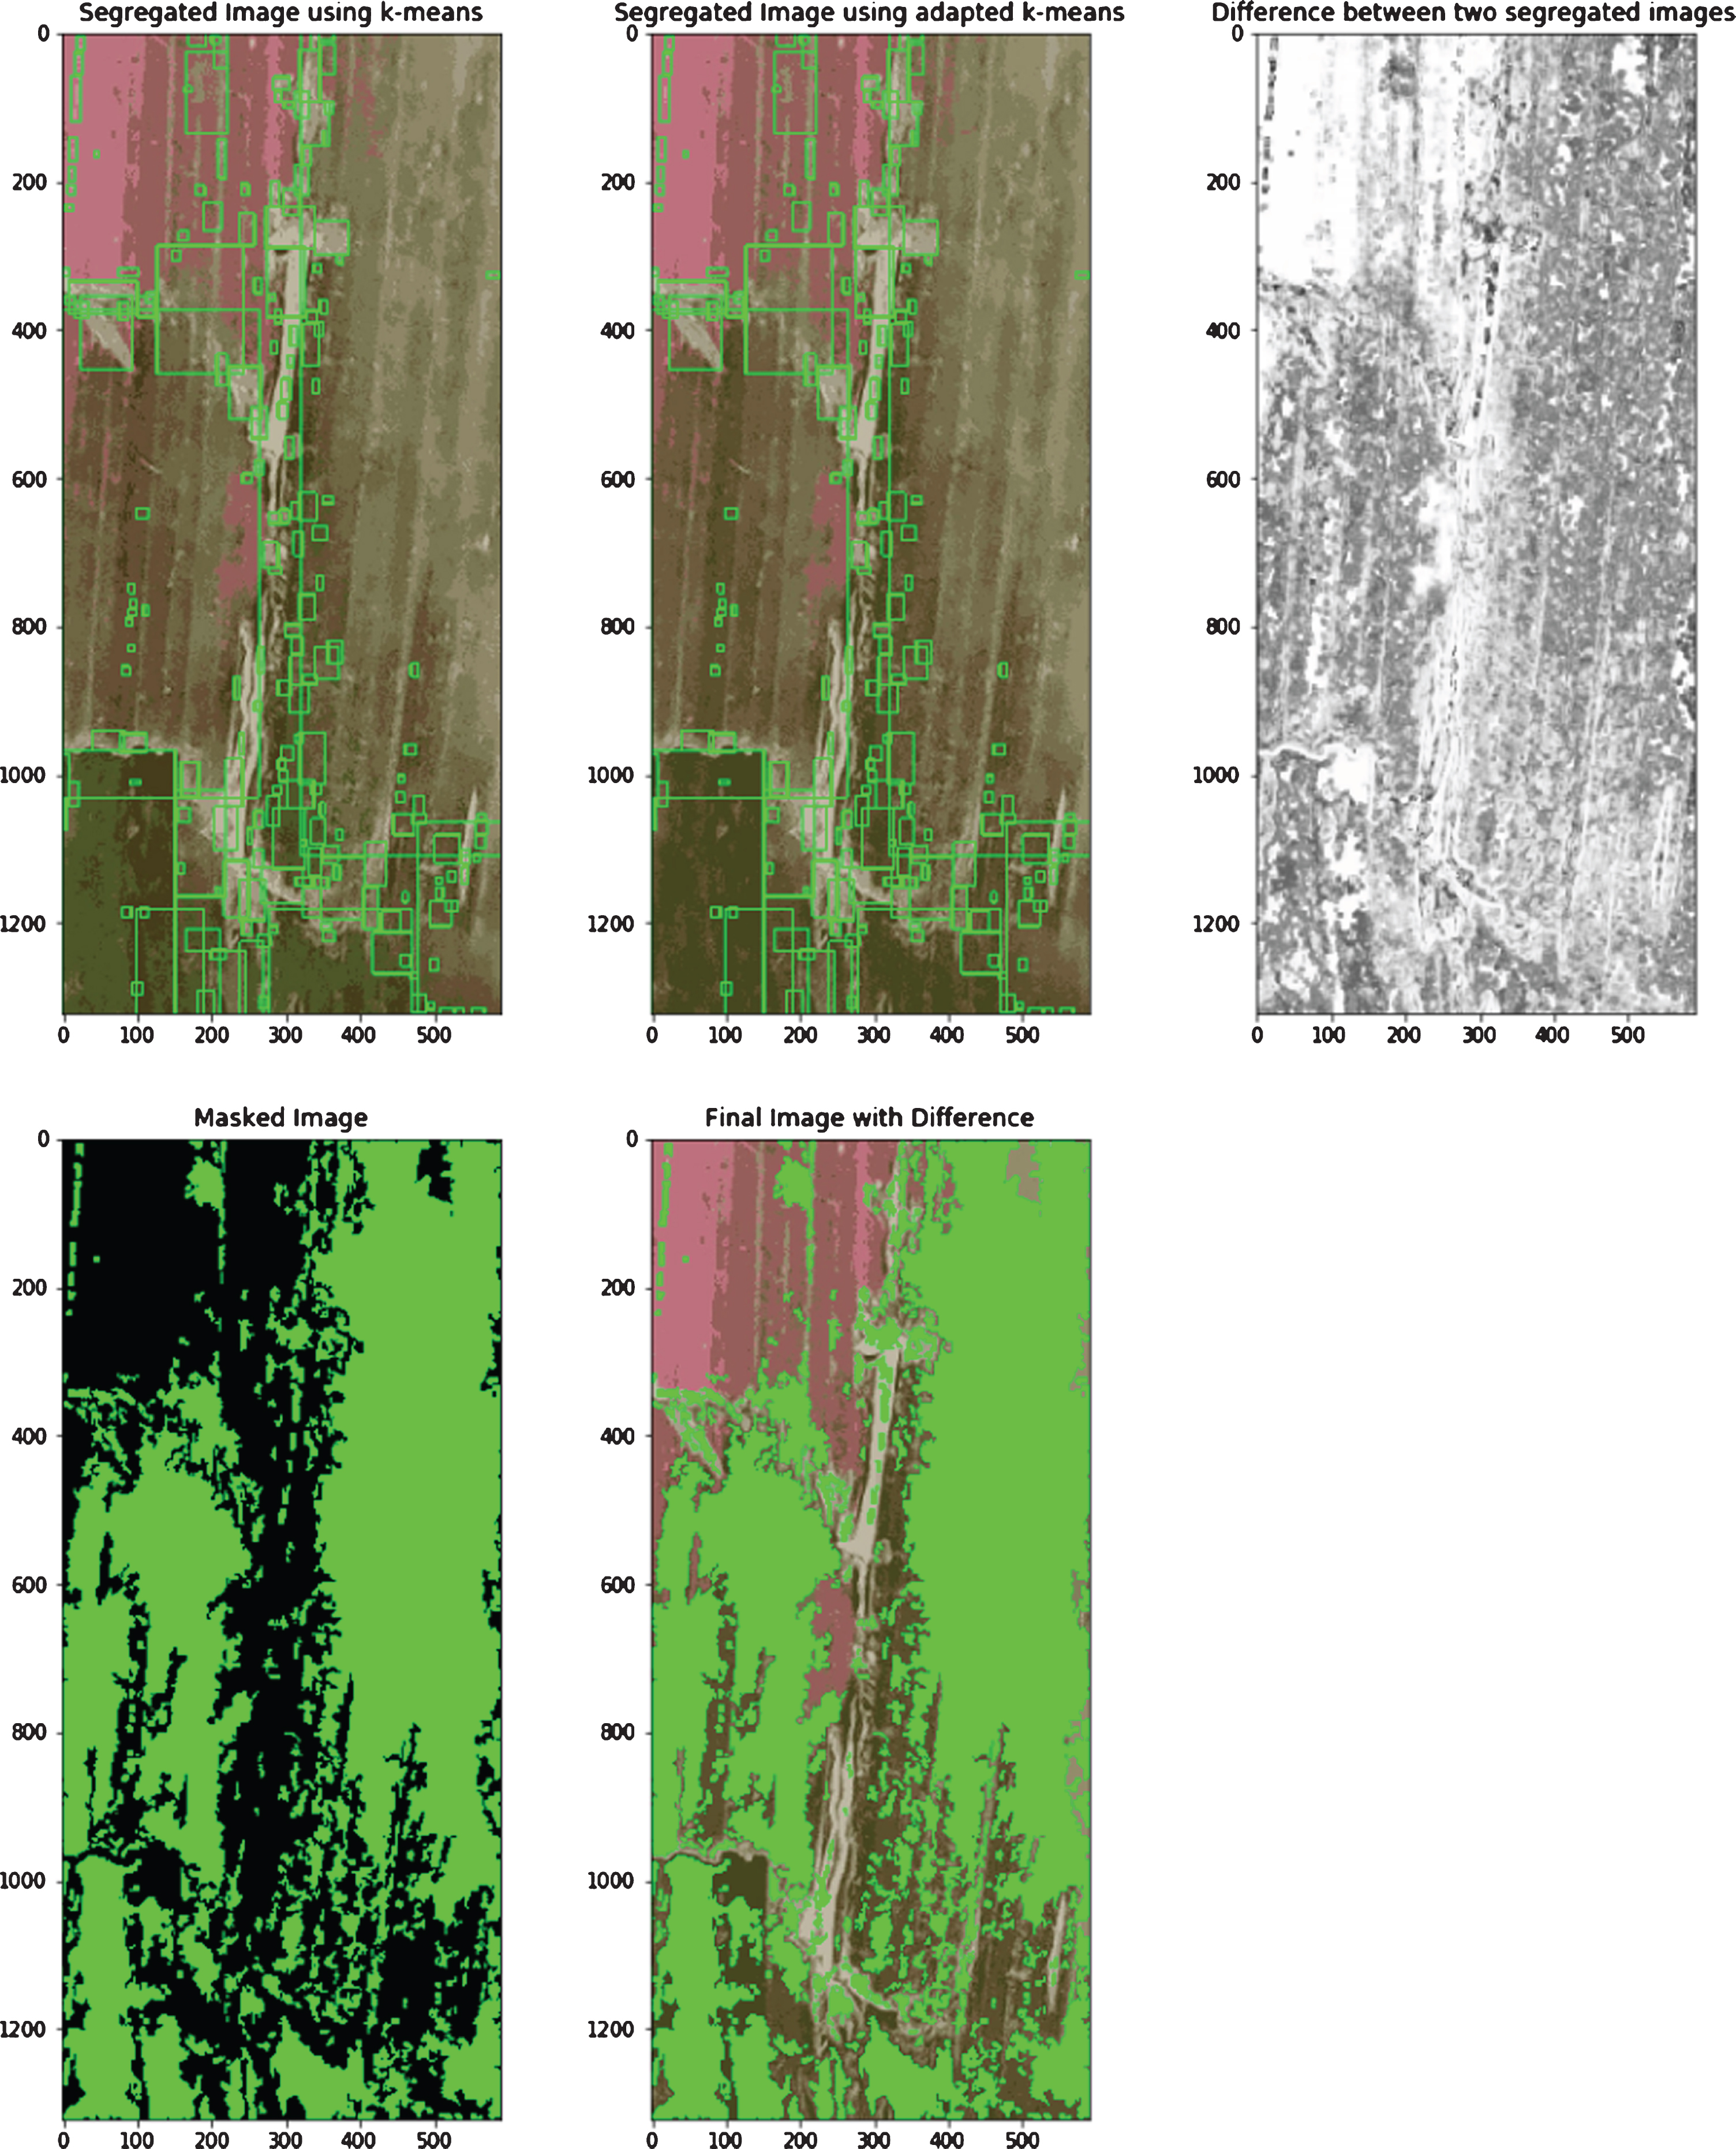
a. Comparison of color segregation using K-means and Adapted K-means algorithm.
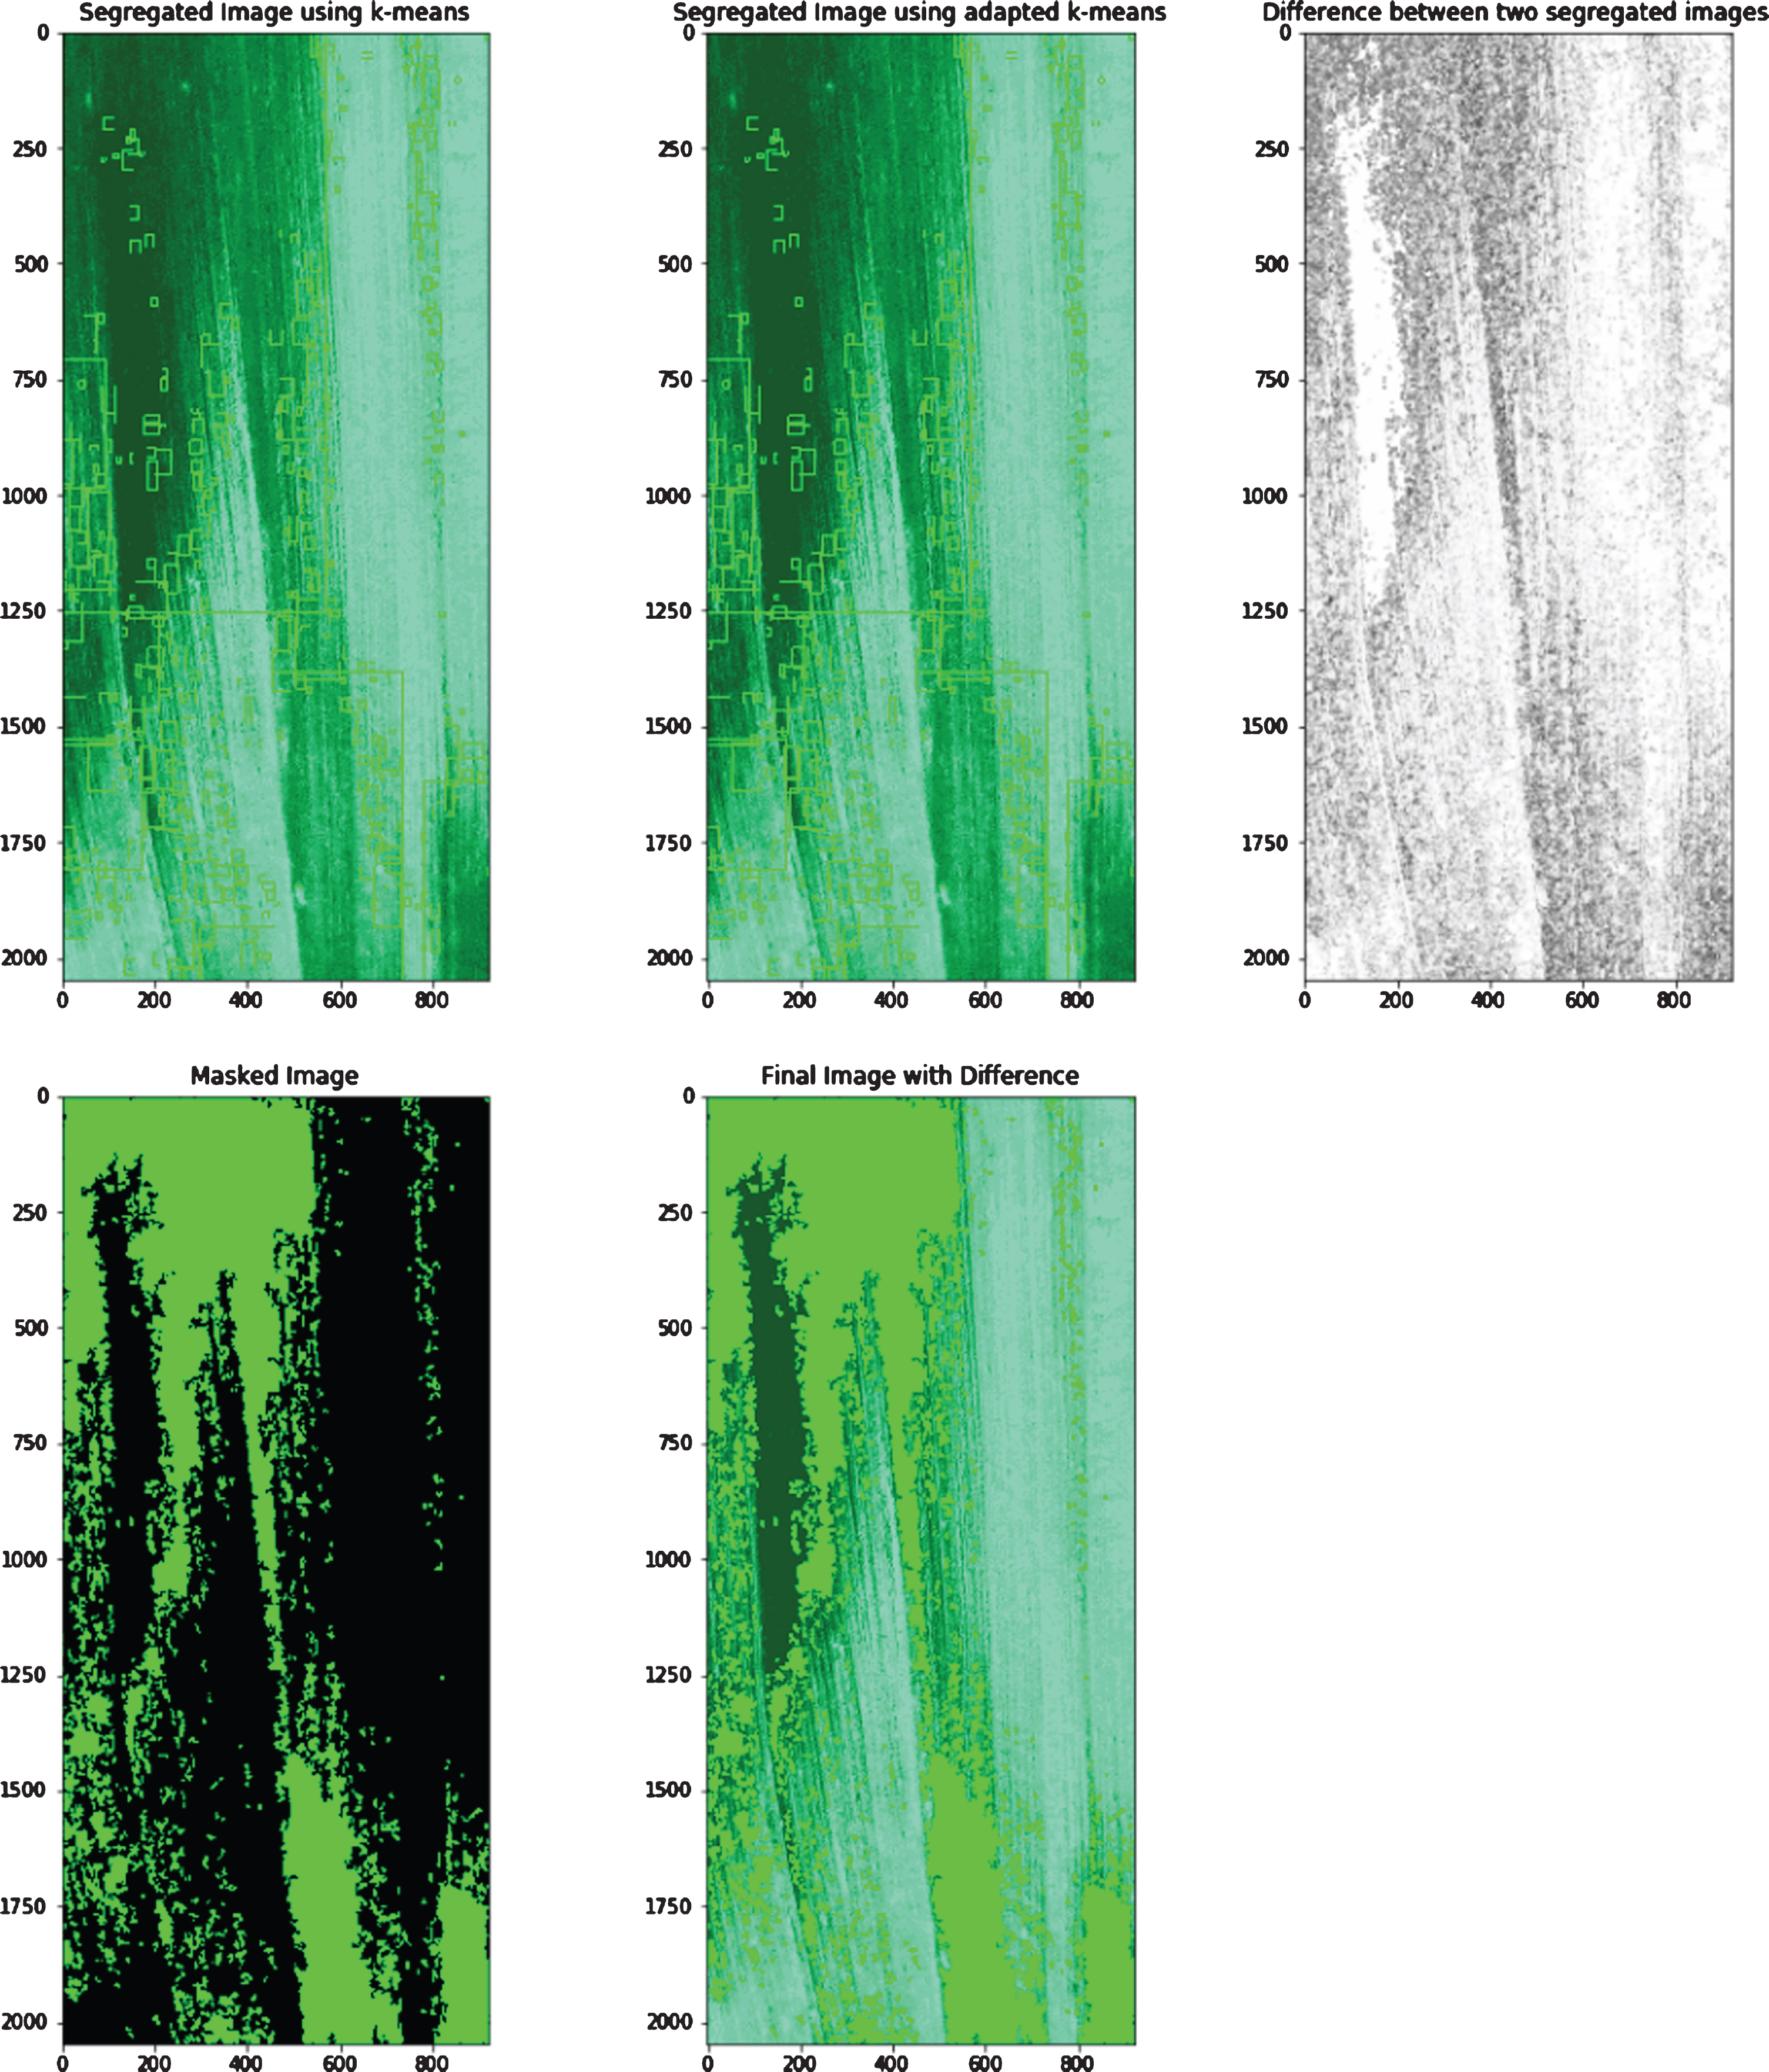
b. Comparison of color segregation using K-means and Adapted K-means algorithm.
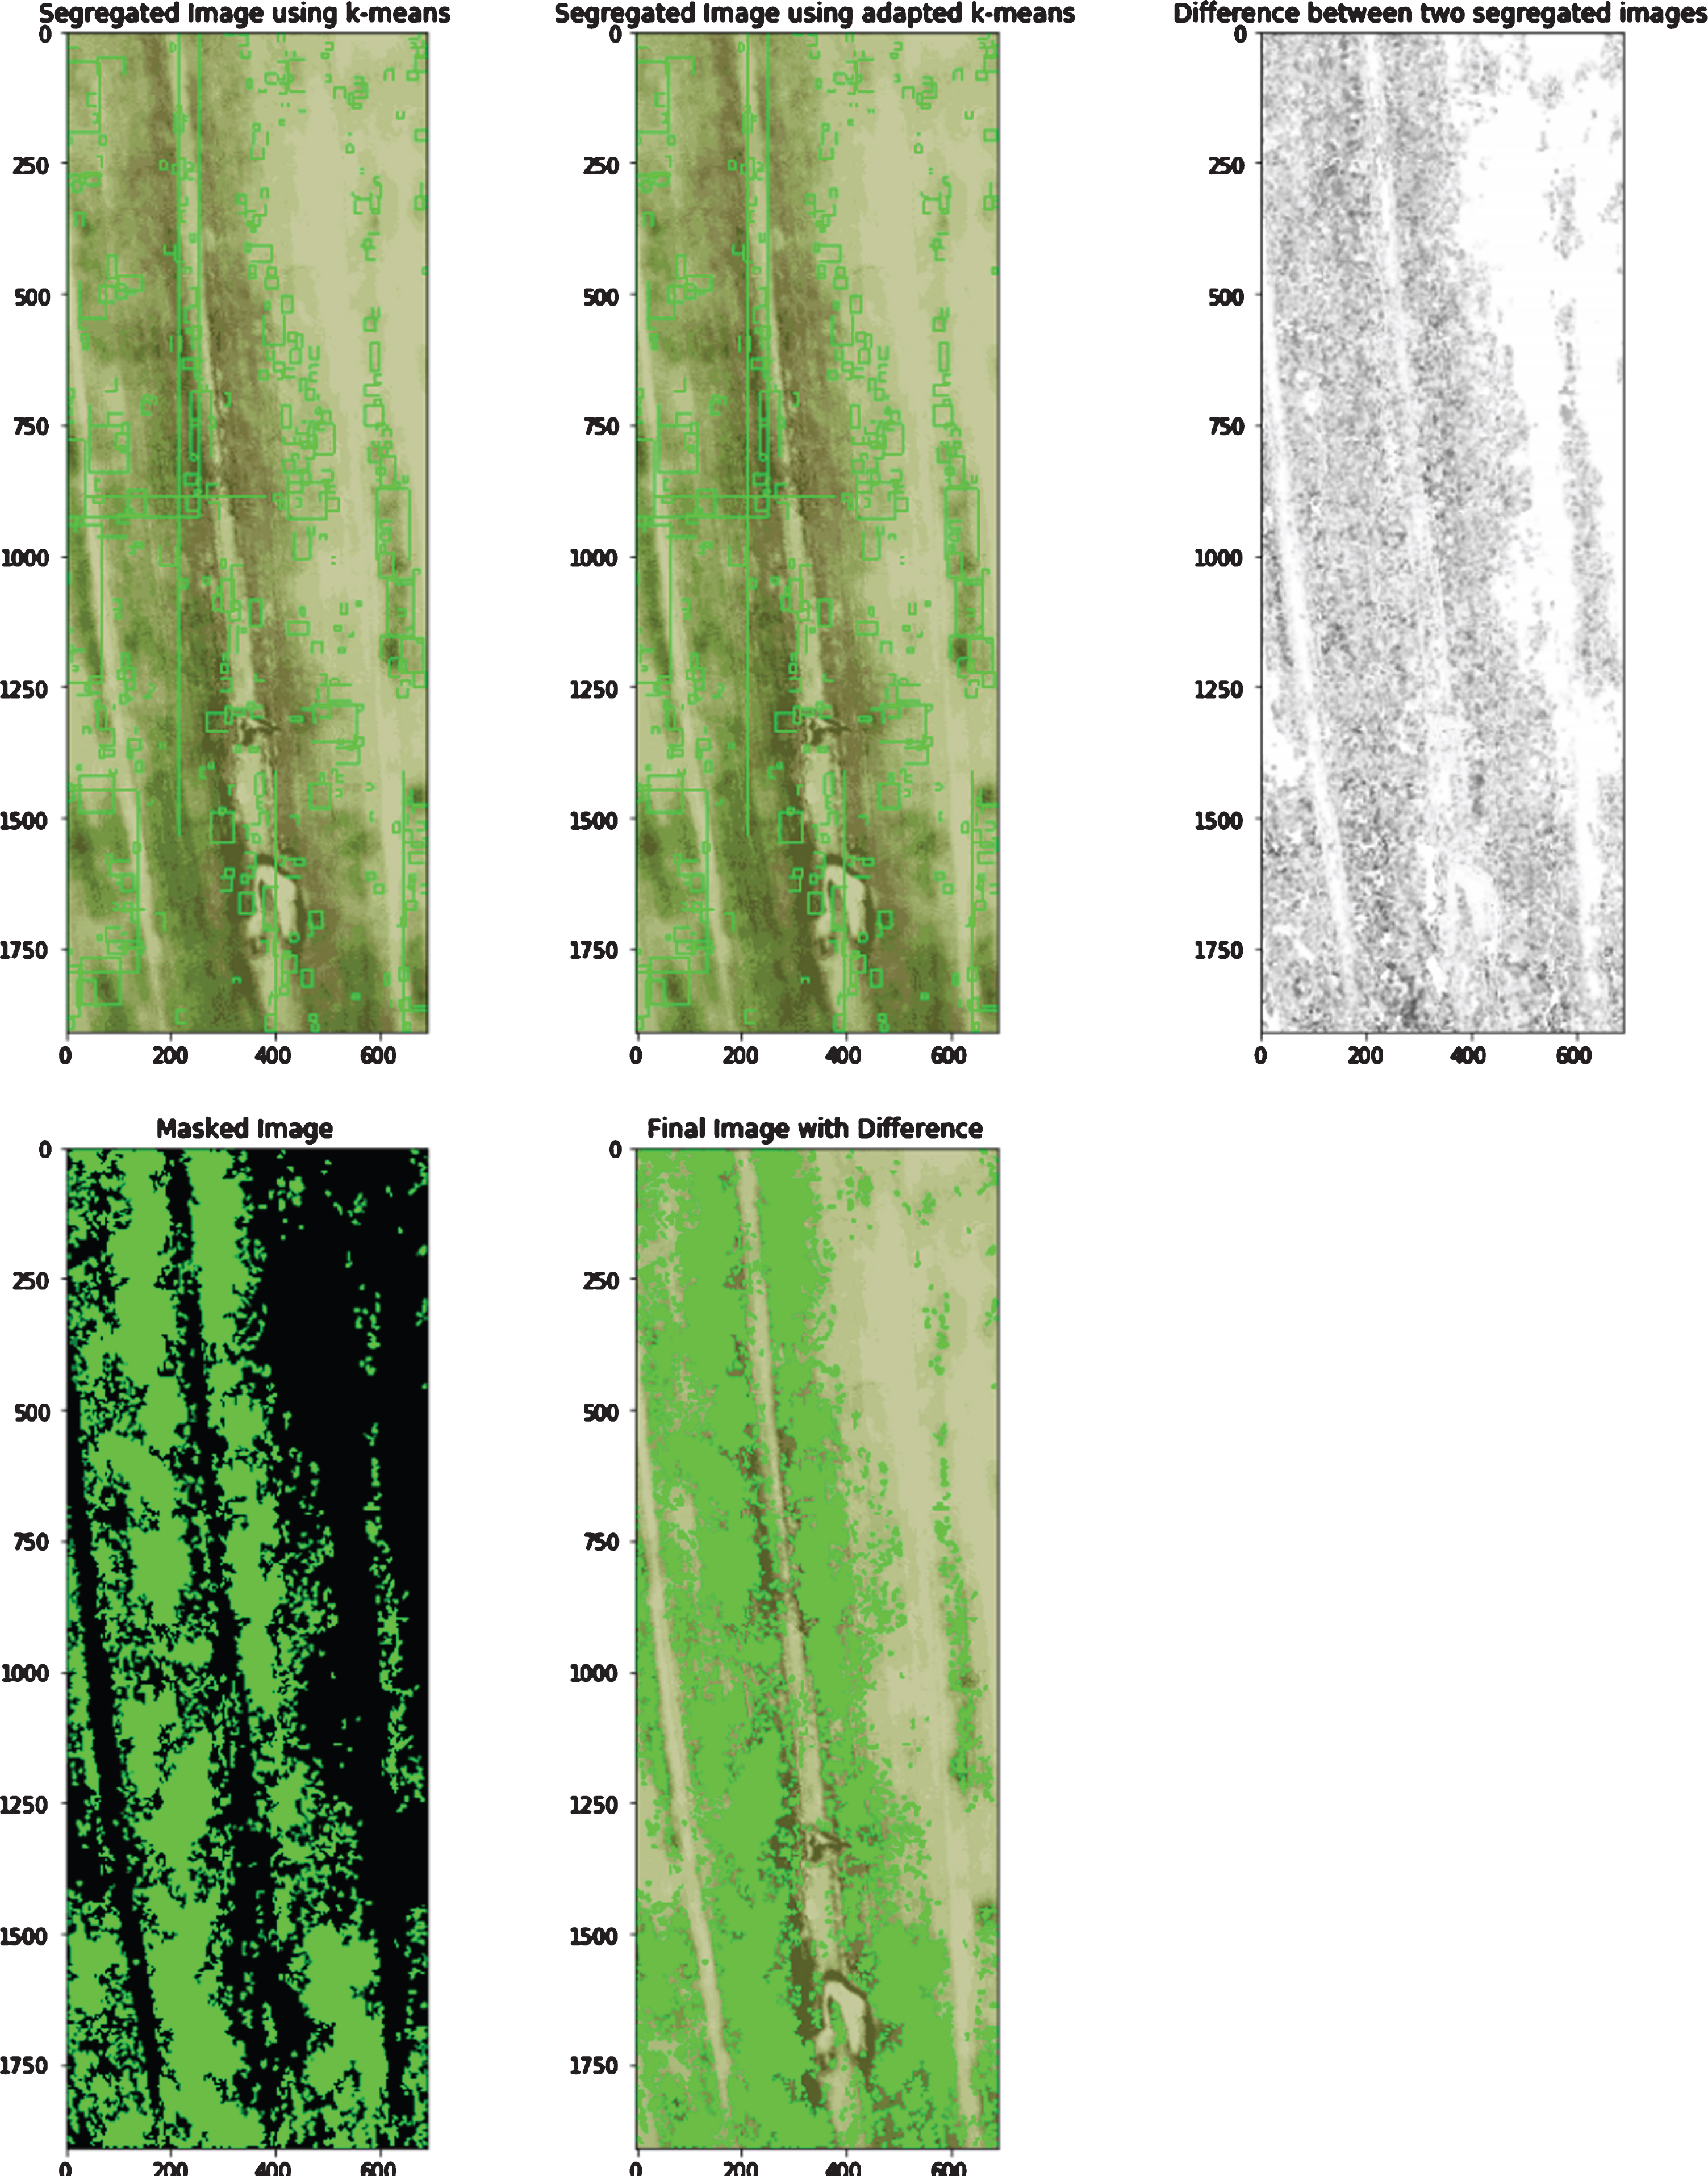
c. Comparison of color segregation using K-means and Adapted K-means algorithm.

d. Comparison of color segregation using K-means and Adapted K-means algorithm.
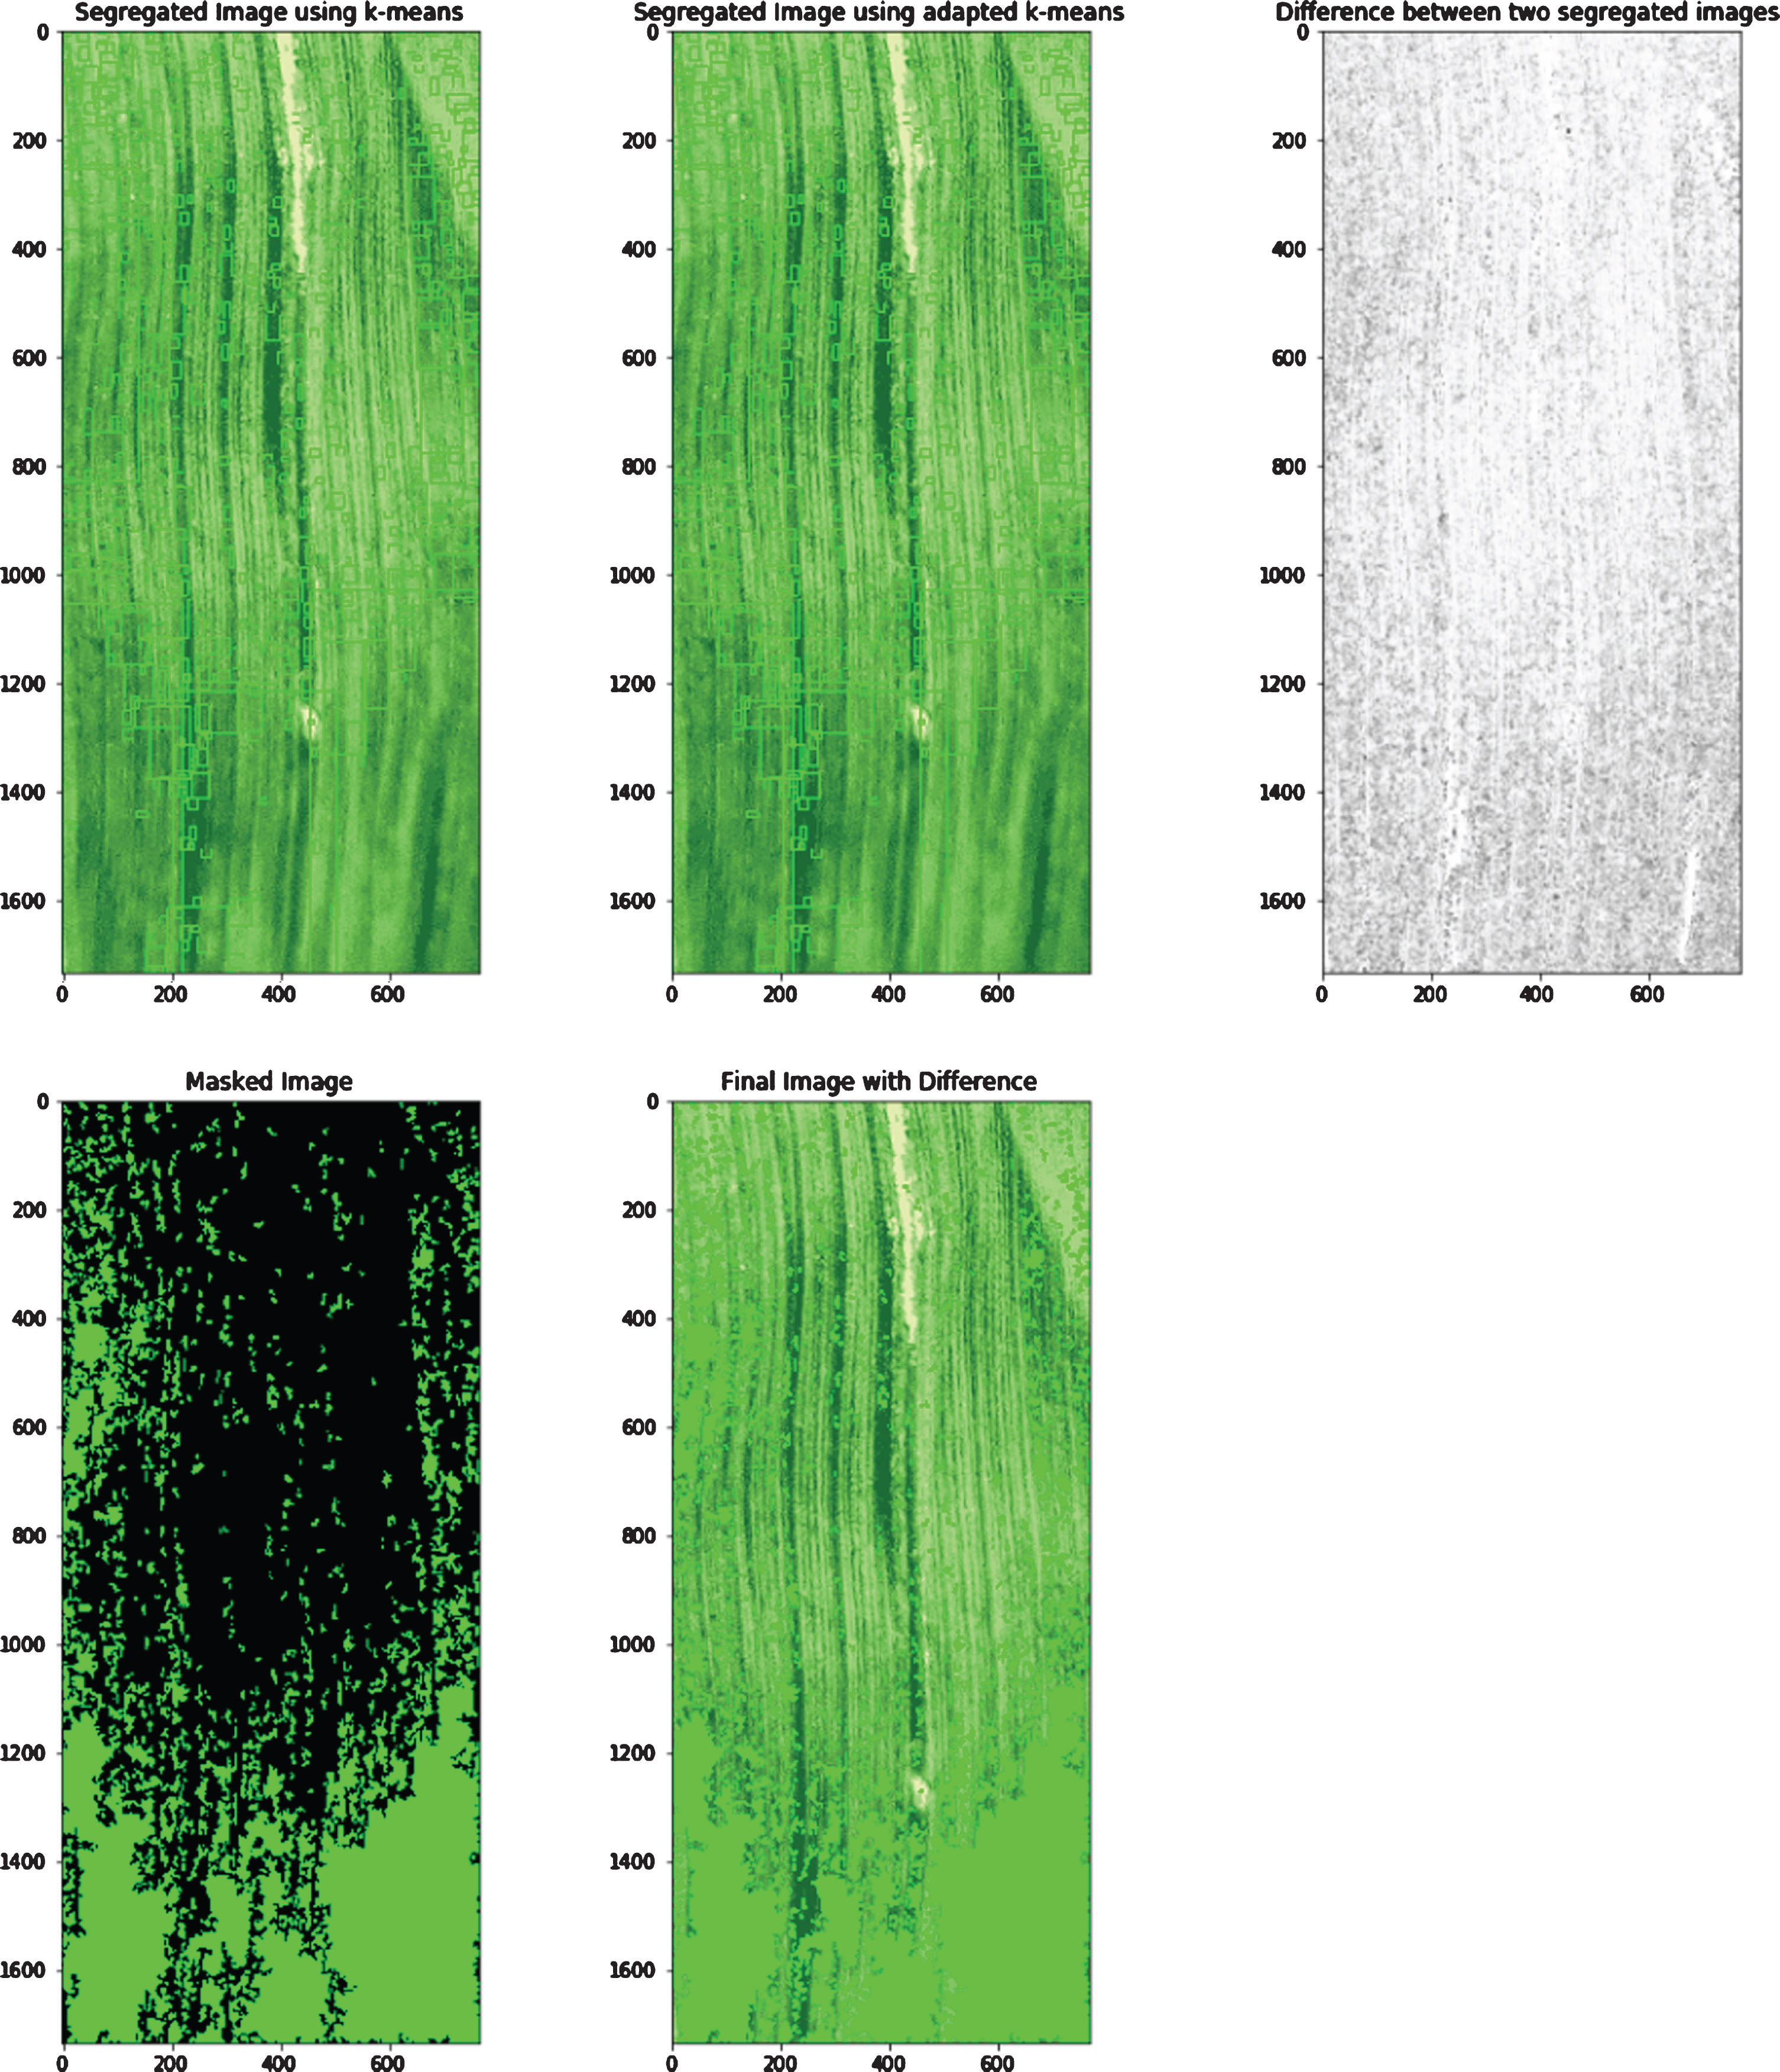
e. Comparison of color segregation using K-means and Adapted K-means algorithm.
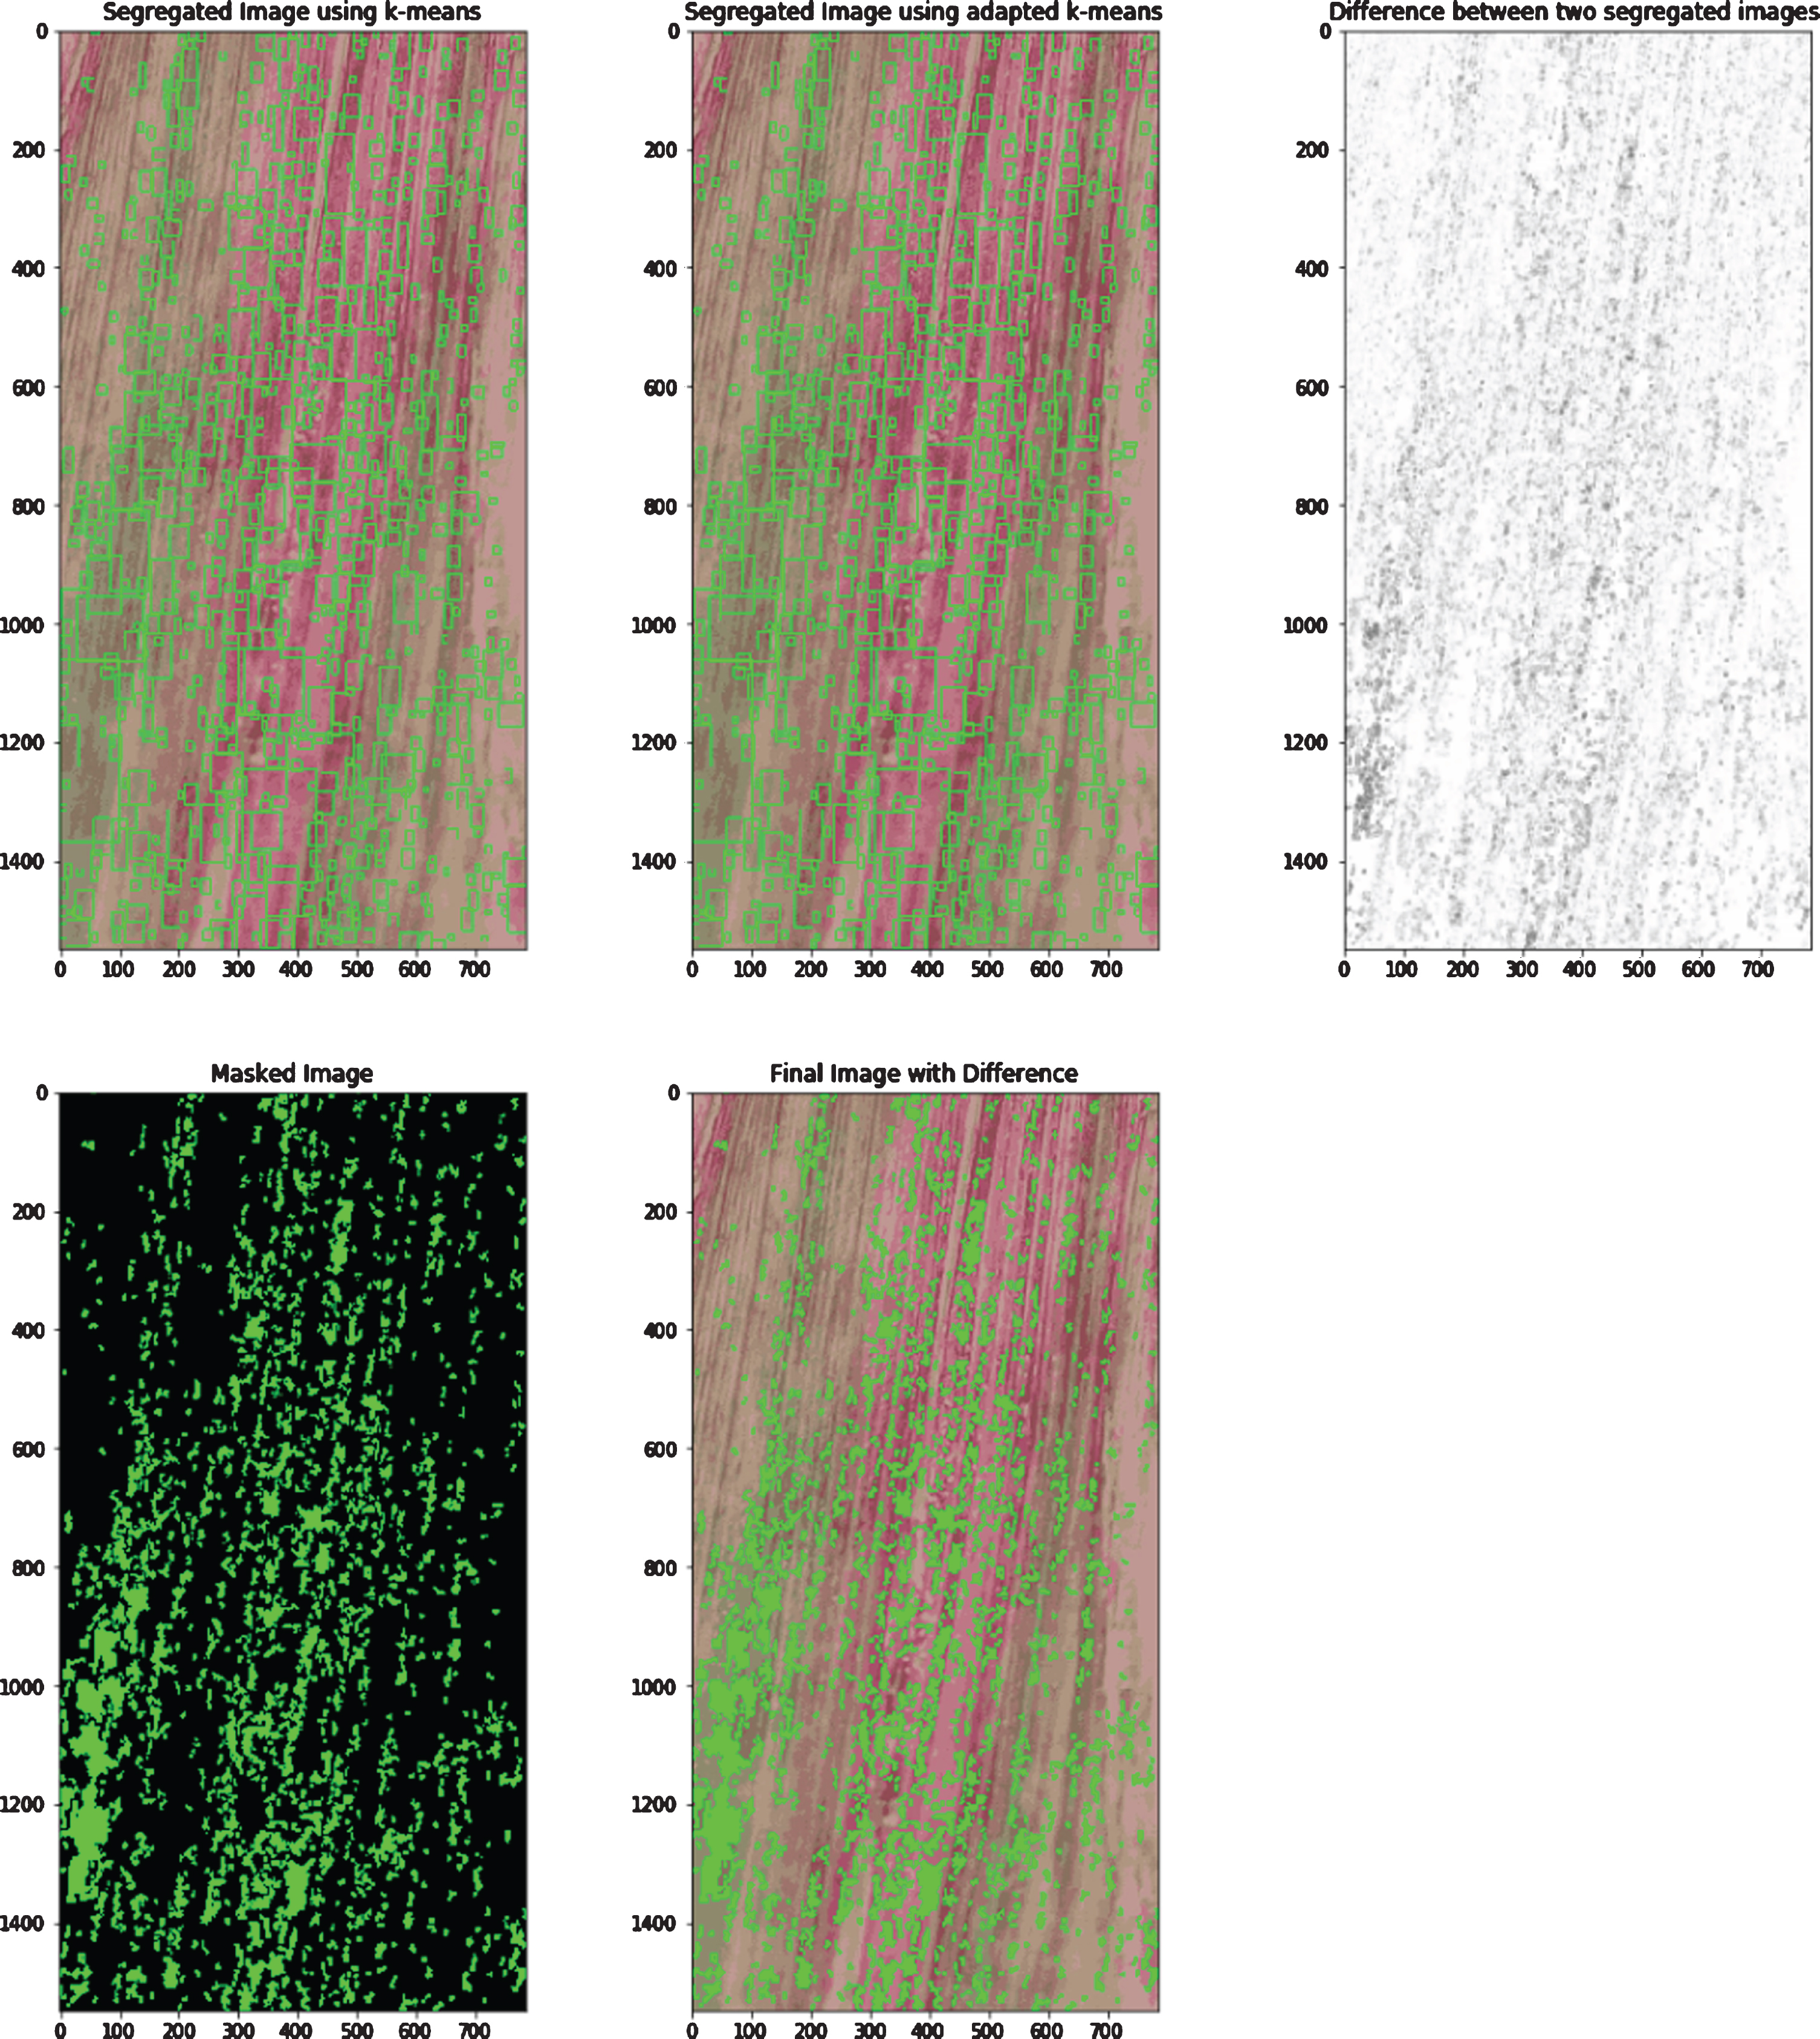
f. Comparison of color segregation using K-means and Adapted K-means algorithm.
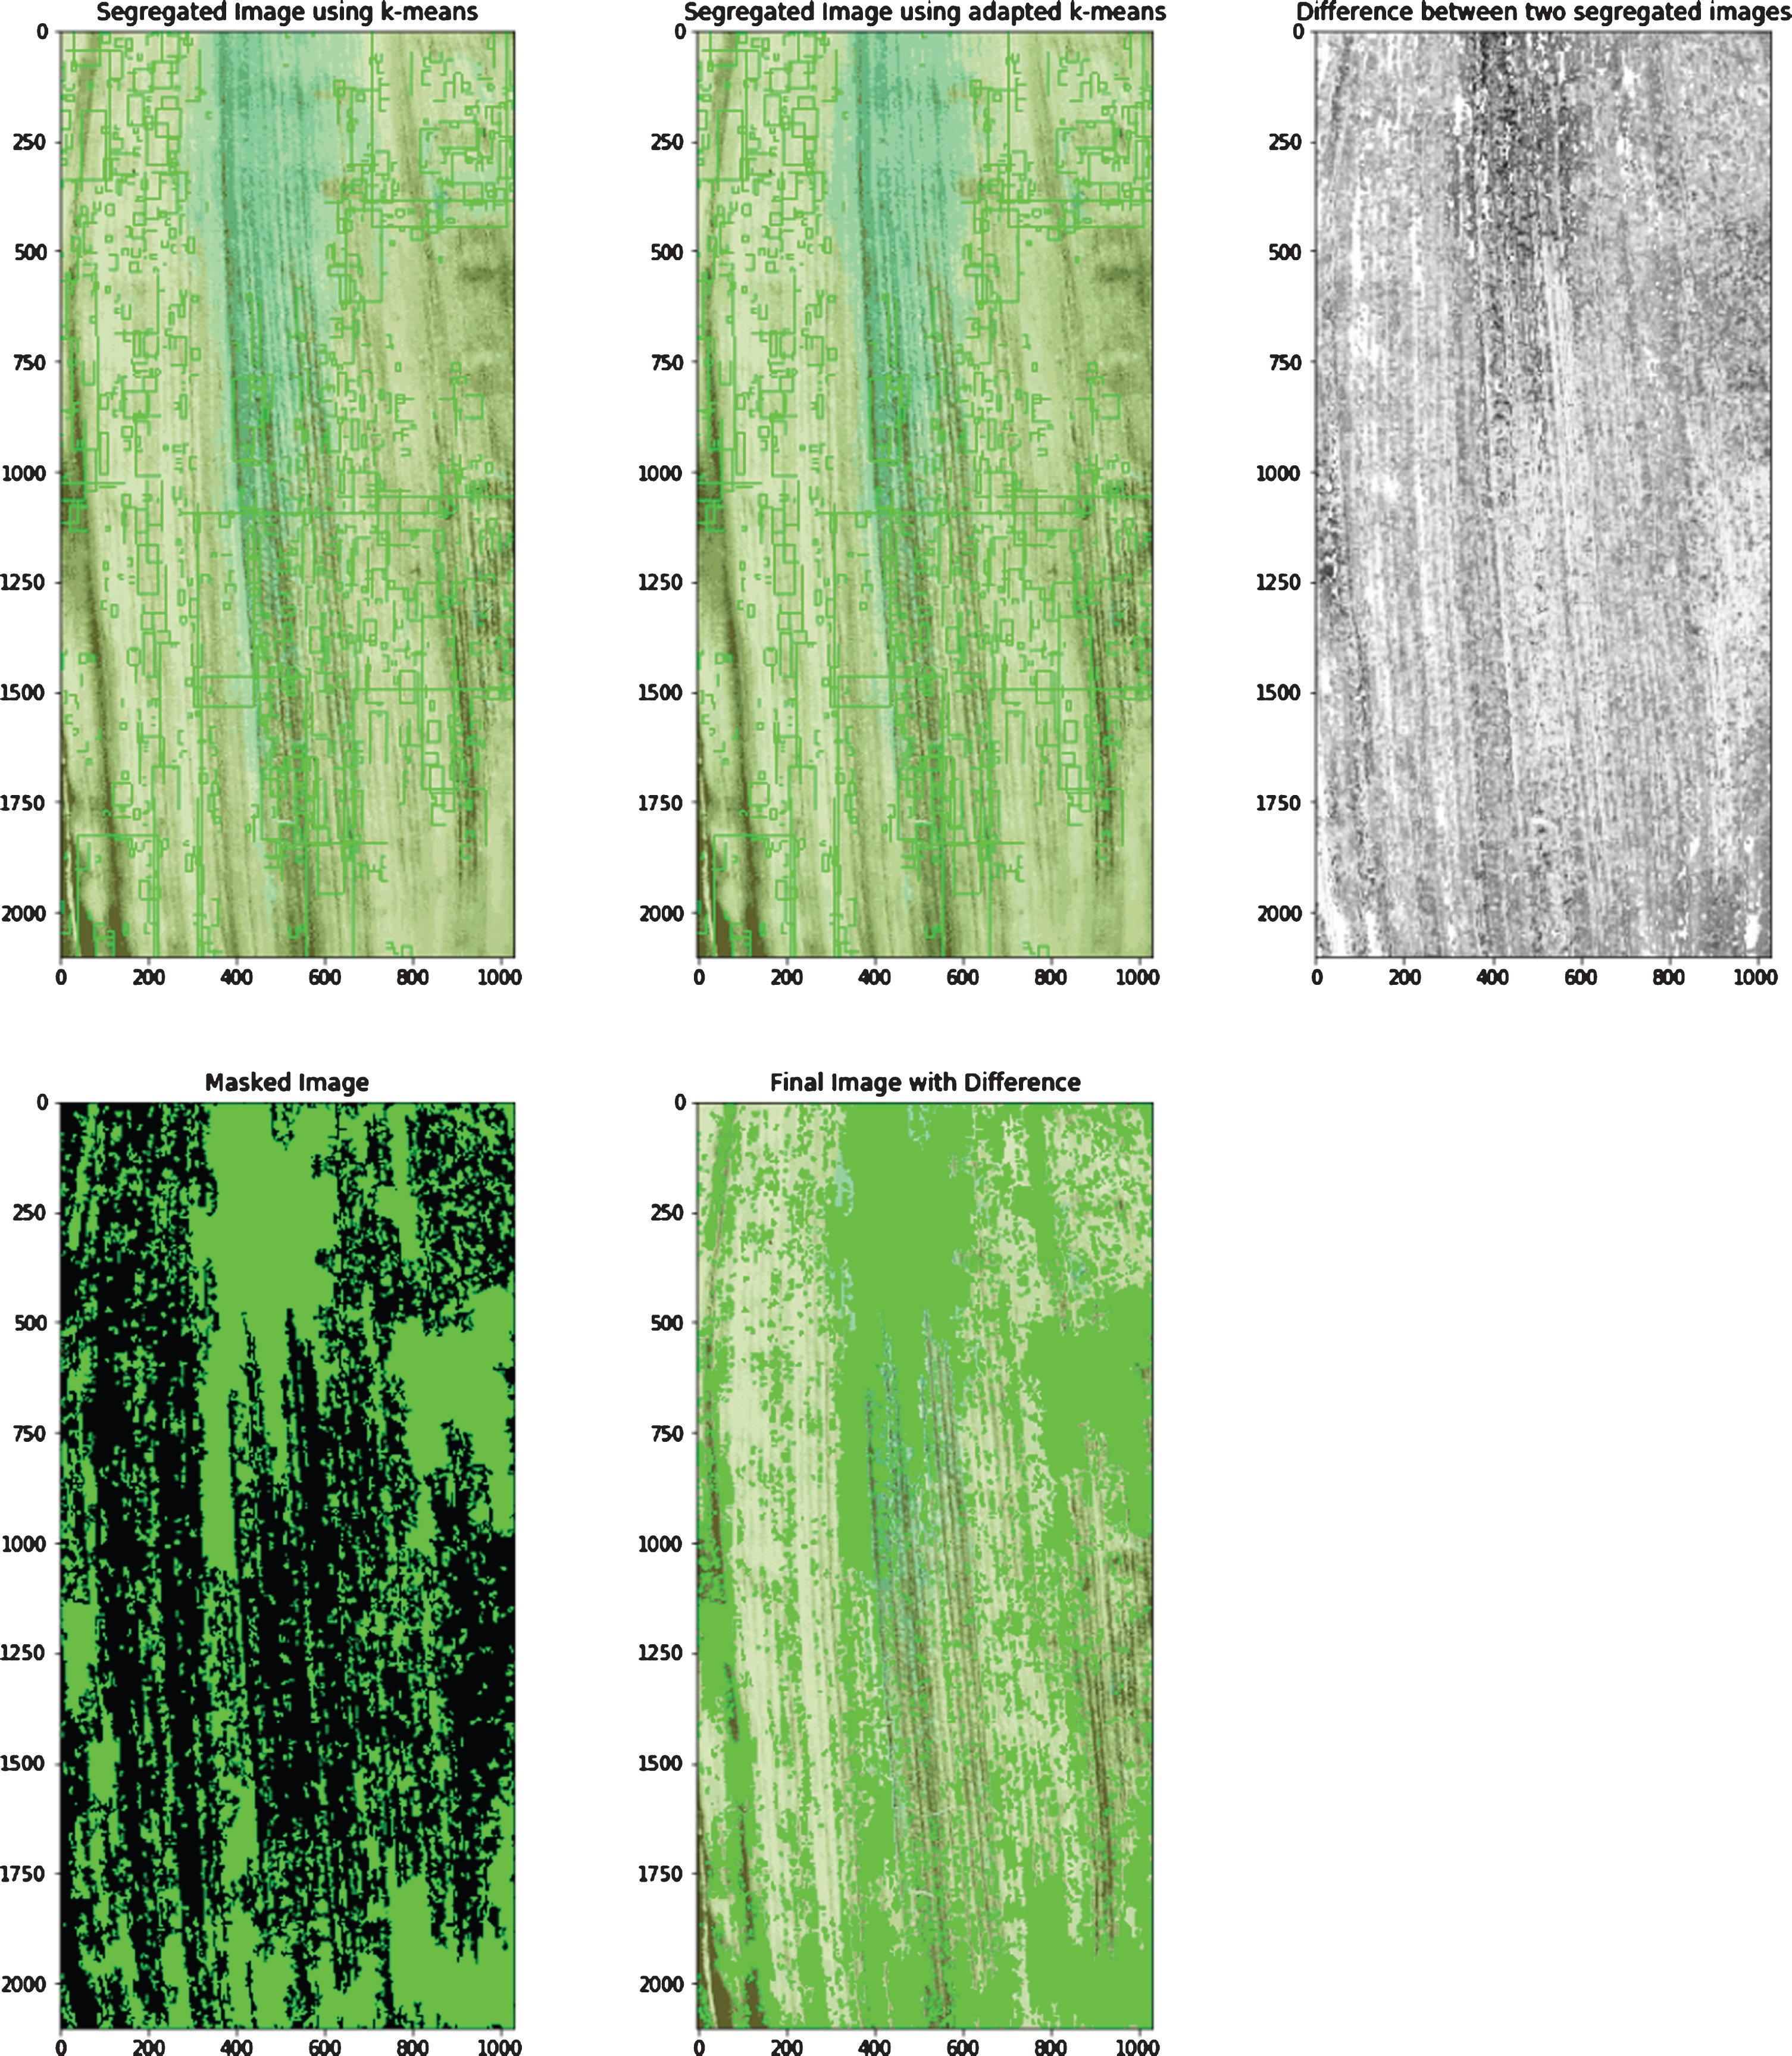
g. Comparison of color segregation using K-means and Adapted K-means algorithm.
Similarity between images generated by k-means and adapted k-means
Summary of recent programming developments for analyzing soil and plant parameters
A novel Python script based on adapted K-means algorithm is developed to automate the segregation of color in a plant leaf. Experiments were conducted in green house to simulate growth of Axonopus compressus. In total, 150 images of leaves of Axonopus compressus is captured. The results of novel program were compared with that python script based on general K-means algorithm. It was found that adapted K-means provides better accuracy and resolution in terms of differentiating colors. The results of this script can be used to find vulnerable areas (i.e., locust infestation of crops globally) using UAV monitoring in large agricultural fields and rangeland. This study is a first step towards use of automation in understanding plant leaf and further work is required to integrate Python script with the output from unmanned vehicles to command the vulnerable and safe areas. It should be noted that the current study is utilizes Euclidean Distance because all color distances are relatively compared and represented in 3D space with Red, Green and Blue as axes. Future work needs to be done to utilize Jefferys and Matusita distance, Canberra distance and cosine coefficients [30, 31] for colour segregation of leaf. In addition, 2 stage clustering method) [32] and mathematical models [33–36] would be developed in future.
Funding
This work was supported by the National Natural Science Foundation (NSFC) [grant number: 41907252].
Footnotes
Acknowledgments
The authors declare no competing acknowledgments.