
Abstract
The use of machine learning technology to recognize electrical signals of the brain is becoming increasingly popular. Compared with doctors’ manual judgment, machine learning methods are faster. However, only when its recognition accuracy reaches a high level can it be used in practice. Due to the difference in the data distributions of the training dataset and the test dataset and the lack of training samples, the classification accuracies of general machine learning algorithms are not satisfactory. In fact, among the many machine learning methods used to process epilepsy electroencephalogram (EEG) signals, most are black box methods; however, in medicine, methods with explanatory power are needed. In response to these three challenges, this paper proposes a novel technique based on domain adaptation learning, semi-supervised learning and a fuzzy system. In detail, we use domain adaptation learning to reduce deviation from the data distribution, semi-supervised learning to compensate for the lack of training samples, and the Takagi-Sugen-Kang (TSK) fuzzy system model to improve interpretability. Our experimental results show that the performance of the new method is better than those of most advanced epilepsy classification methods.
Keywords
Introduction
Epilepsy is a chronic disease with sudden abnormal discharges of brain neurons, and this leads to transient brain dysfunction. To diagnose epilepsy [1, 2], people usually use electroencephalogram (EEG) signals. Since it takes considerable time and energy for doctors to diagnose epilepsy based on EEG signals, a new machine learning method has been adopted by researchers; that is, according to EEG signals, epileptic seizures can be detected automatically [3–11]. There are many classical machine learning models, such as decision trees (DTs) [9], the naive Bayes (NB) method [7, 9], support vector machines (SVMs) [6, 11], K-nearest neighbors (KNN) classification [7] and linear discriminant analysis (LDA) [5, 10]. There is no doubt that machine learning methods exhibit faster detection and better consistency than manual annotation, but they may be problems with low detection accuracy. Jiang et al. [12] found that most machine learning methods default to the same data distribution, but in actual, complex applications, this may not be accurate. To solve this problem, this paper adopts a domain adaptation learning method based on a deep subdomain that aligns each subdomain and retains the precision of features. The results show that subdomain adaptation learning can solve this problem well.
In addition, two problems are considered: (1) We attempt to improve the interpretability of the model, which would be very helpful for medical research. (2) We determine whether the unlabeled test data can be fully utilized to obtain some characteristic information to further improve the model performance. For the first question, we use the Takagi-Sugen-Kang (TSK) fuzzy system as the core classifier. For the second question, semi-supervised learning (SSL) is used to obtain feature information from unlabeled test data.
The rest of this paper is organized as follows. The second section introduces the common methods in the field of epileptic EEG signal recognition. The third section introduces the concepts and learning algorithms of the two types of TSK fuzzy systems. The fourth section introduces a novel TSK fussy system model using subdomain adaptation learning and semi-supervised learning (SDA-SSL-TSK-FS) along with its learning algorithm. The fifth section compares the performance of the proposed method with those of existing methods on six real EEG datasets. The sixth section is the conclusion.
Related work
This section mainly introduces the methods of feature extraction and machine learning in epilepsy recognition.
Method of extracting original signal features
Signal feature extraction methods are used to extract accurate and useful features from an original EEG signal. The use of processed data can not only reduce computational costs [4, 8] but also improve classification performance [12, 23–29]. Generally, we use three common features: 1) time domain features [23, 25], such as principal component analysis features; 2) frequency domain features [3, 24], such as Fourier transform features; and 3) time-frequency features [3, 25–27], such as wavelets. This article considers these three characteristics.
Machine learning methods
Machine learning methods can quickly detect epilepsy through EEG signals. As long as they are trained correctly, machine learning methods can achieve satisfactory accuracy. Currently, there are many classic machine learning methods, such as the DT, SVM, KNN and LDA methods, being used. To use these machine learning methods, there is usually a premise: the training data and testing data must have the same or similar data distributions, but in many practical situations, the sample distribution is different. Therefore, the actual test results are often not satisfactory. Transduction transfer learning [13] is a well-known method for dealing with differences in sample distributions. For instance, Jiang et al. [12] studied a conversion transfer learning (TL) algorithm, i.e., a transfer support vector machine (TSVM) [18], which has been used to identify epilepsy using EEG signals and has achieved good performance.
In addition, most machine learning methods have another problem. The training model is a black box model that is difficult to explain, and this is not conducive to medical diagnosis. To improve the interpretability of the training model and make it easy for people to understand, we use the essentially interpretable TSK fuzzy system as the initial model.
TSK fuzzy system model
There are two fuzzy system models. One is the Mamdani fuzzy system [20], and the other is the Takagi-Sugeno-Kang (TSK) fuzzy system [21, 38]. The latter is adopted because of its convenience and scalability. This section introduces the specific composition of the TSK fuzzy system (TSK-FS). The next section uses the ensemble principle to optimize the model and achieve high classification performance.
Concepts and principles
The TSK fuzzy system is a model that uses rules for classification or regression. In this model, there is a typical rule R k for describing fuzzy systems.
where
and
N is the number of input samples, u jk is the fuzzy membership degree obtained by the fuzzy c-means (FCM) [30] algorithm, and η is a range parameter, which is generally set manually or optimized through cross-validation.
Through the following five formulas:
Given an EEG signal dataset D S = {x i , y i } for training, the following parameter P g is optimized by the least-squares method, and the objective function is:
When the derivative of J
TSK
with respect to each pg,j is zero, the minimum value of J
TSK
(p
g
) is obtained. The optimal solutions of the subsequent parameters are:
The following is a summary of the TSK fuzzy system (TSK-FS) modeling method.
In this section, we introduce two algorithms for integration with the basic classifier TSK-FS.
Subdomain adaptation learning (SDA)
The process of learning a differentiated model when there is a difference between the distribution of the training data and the distribution of the testing data is called domain adaptation or transfer learning [44–46].
The previously developed domain adaptation methods [47–49] mainly learn the global domain offset, that is, the distributions of the source domain and the target domain are homogeneous without considering the relationship between the two subdomains of each of the two domains. Therefore, different categories of data in a domain are confused, so good feature structures cannot be learned. In other words, the unique feature information of each category may be lost. As shown in Fig. 1 (left), although the data distributions seem to be similar, different types of subdomain data are still mixed together, so it is difficult to perform accurate classification. To solve this problem, we propose a subdomain adaptation learning method that uses relevant subdomains to accurately align the source domain and target domain. As shown in Fig. 1 (right), when the sample distributions of the subdomains are the same, the global sample distributions also tend to be the same.

left: Overall domain adaptation may confuse the feature information of samples from the same class. Right: the same-category subdomain alignment can use its own characteristics to capture the unique feature information of each category.
To achieve the correct alignment of subdomains, a local maximum mean square deviation (LMMD) method is proposed in this paper. It measures the spatial distances between the sample distributions of related subdomains in the source domain and the target domain.
By minimizing the LMMD, we can not only reduce the differences between the data distributions of the source domain and target domain but also learn highly precise feature representations. The literature [12] has proven that the use of transfer learning can have a significant effect on the classification of EEG signals. We use the same technique to improve the performance of the TSK-FS model.
The labeled data samples are taken as the source domain, D
S
= {x
i
, y
i
}, and the unlabeled data samples are taken as the target domain D
T
= {x
i
}. We define the spatial distance between two domains as [12, 18]:
Finally, (6) can be rewritten as
For offline classification, even if the data have no labels, SSL can be used to obtain hidden feature information from the data, thus further improving model performance. Figure 2 shows the method used to realize this idea; it is based on clustering theory, where similar sample distributions belong to the same category. Therefore, using the above heuristic method to further improve the performance of the model, we design a new SSL method similar to the fuzzy c-means method [30] to perform label clustering.
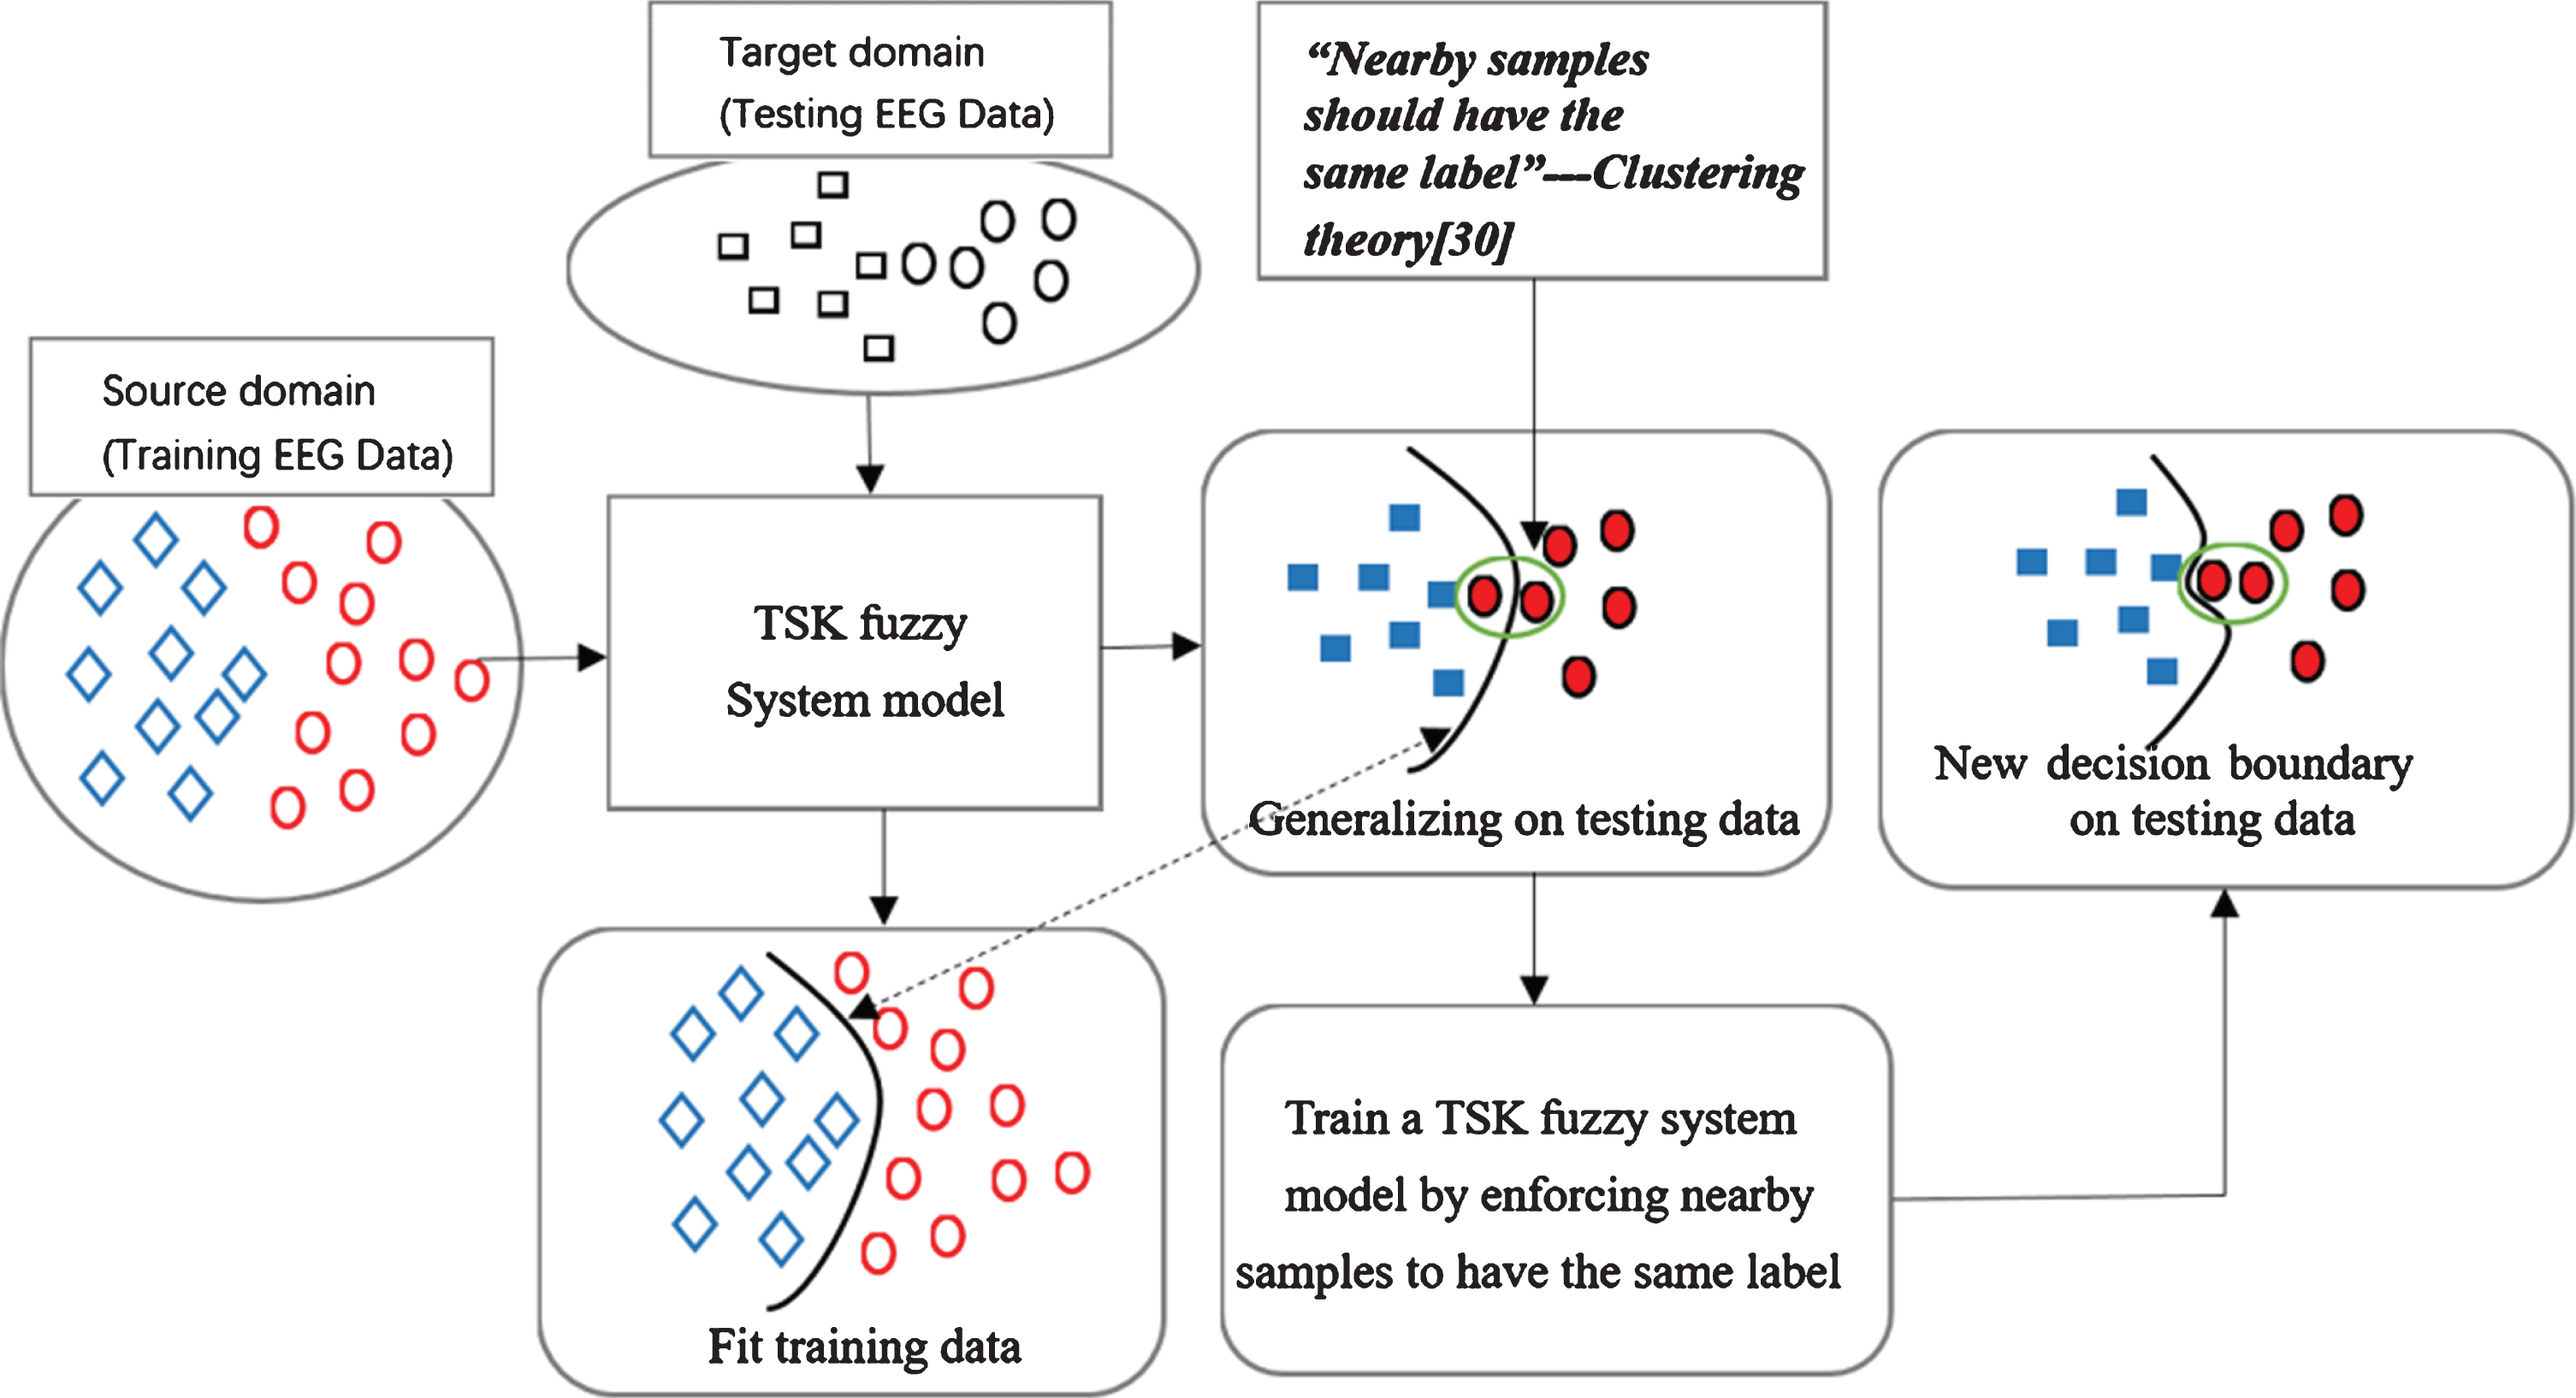
Illustration of SSL with label clustering.
In this section, we introduce the integrated objective function used to train the SDA-SSL-TSK-FS model:
Suppose
By setting the derivative of JSDA-SSL-TSK w.r.t. p g to zero, the optimal result parameter can be calculated, and the solution is:
The following is a summary of the SDA-SSL-TSK fuzzy system modeling method.
In this section, the new SDA-SSL-TSK-FS model is evaluated by classifying EEG signals collected during the seizures of healthy subjects and epileptic patients. We compare six classic machine learning methods, two transfer methods, and two semi-supervised methods. The experimental results are shown in Table 1.
Description of the eeg data
Description of the eeg data
To ensure the fairness of the experiment, we conduct comparative experiments with the same feature extraction method and the same dataset. The experimental environment and experimental data are prepared as follows.
For this experiment, all the algorithms were implemented in MATLAB on a computer with an Intel core i5-8500U CPU at 1.70 GHz and 12 GB RAM. The following are the specific experimental settings.
1) Methods for comparison Non-transfer learning-based methods: NB [7, 9], LDA [5, 10], DT [9], KNN [7], SVM [6], TSK-FS. Transfer learning-based or semi-supervised learning-based methods: transfer support vector machine (TSVM) [33], semi-supervised support vector machine (S4VM) [34], transfer learning with a graph co-regularization method (GTL2) [35], and large-margin transductive transfer learning method (LMPROJ) [18]. Among them, the TSVM and S4VM methods are semi-supervised learning methods, and LMPORJ and GTL2 are transfer learning methods.
2) Data Sources
The EEG data used in this study are the same as those in [12] and can be downloaded from http://epileptologie-bonn.de/cms/front_content.php?Idcat=193&lang=3&changeling=3 [41]. The dataset contains five groups of data (Groups A to E), and each group contains 100 single-channel EEG segments with 23.6 s durations. The average sampling rate for all the datasets was 173.6 Hz. Table 1 gives a detailed description of the five groups. Figure 3 shows some typical EEG signals in each group.
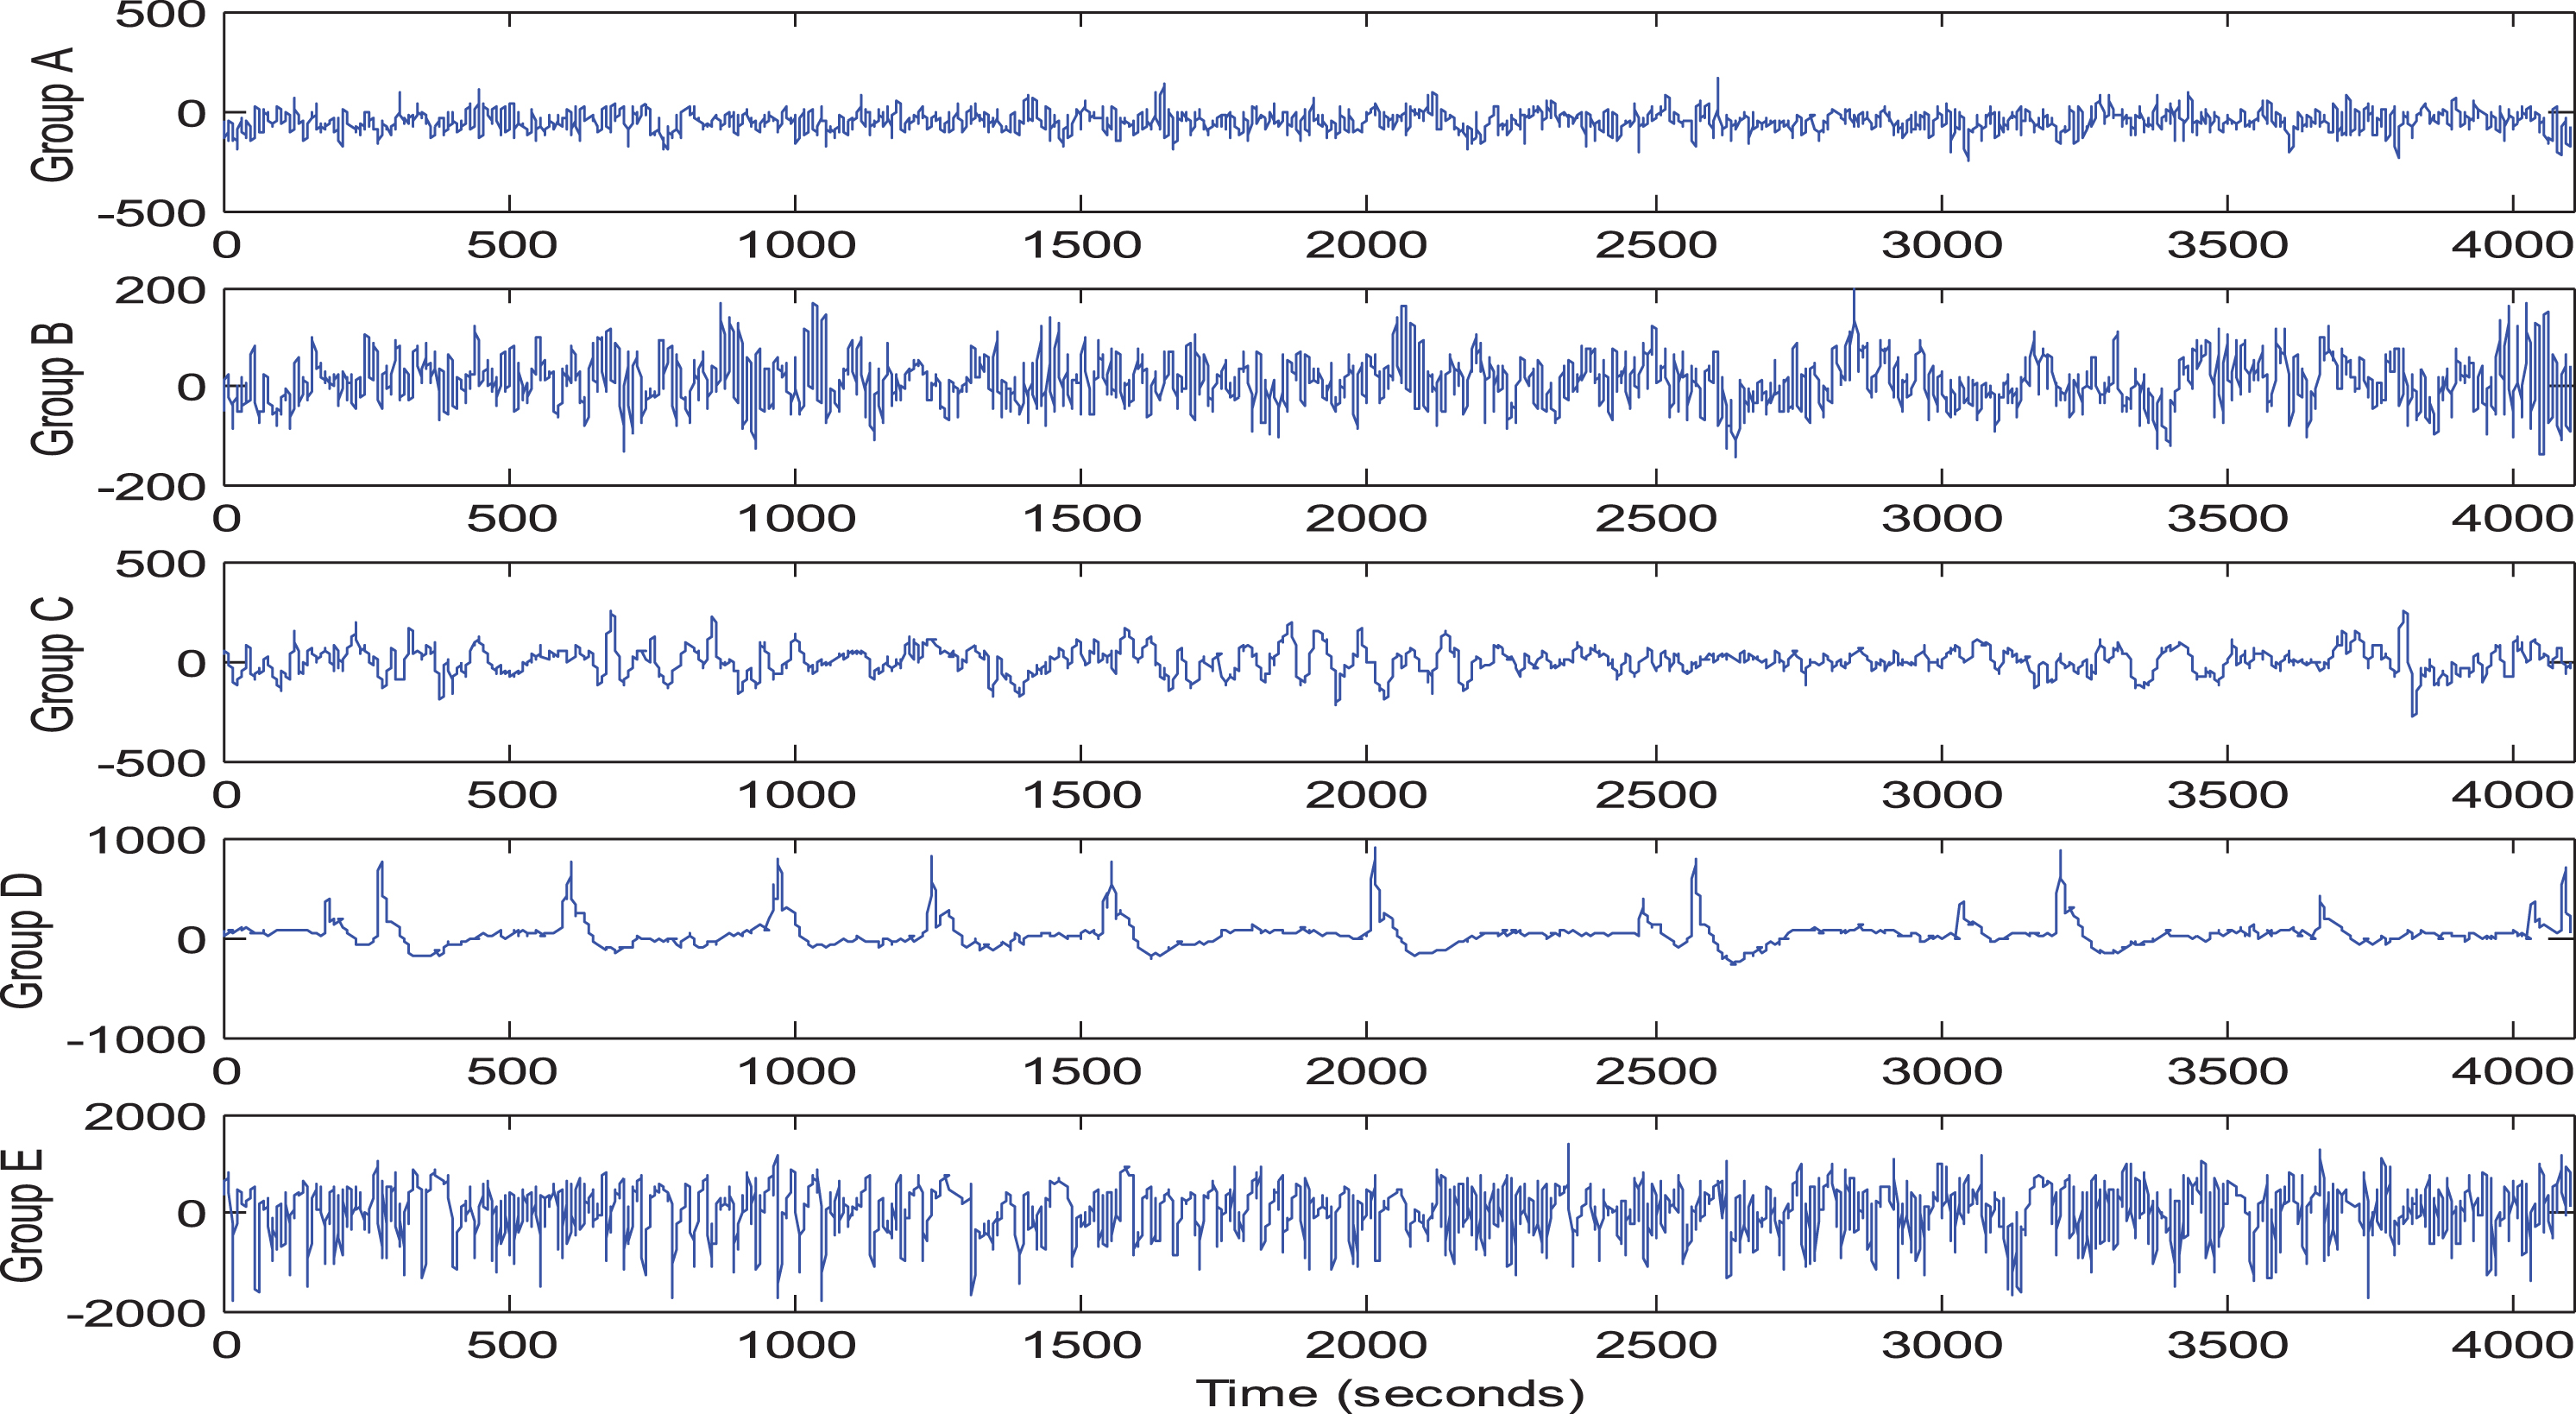
Typical EEG signals in Groups A-E.
3) Feature extraction method for EEG signals
We used the following feature extraction methods to process the original EEG data: Wavelet packet decomposition (WPD) Short-time Fourier transform (STFT) Kernel principal component analysis (KPCA)
4) Performance evaluation measures
To evaluate our proposed method, we adopted the following two common performance metrics:
5) Specific parameter settings For the NB, LDA, DT, KNN, SVM, and TSK-FS methods, we set the experimental parameters according to [12]. For the TSVM, S4VM, LMPROJ and GTL2 methods, we adopted the experimental settings in [33, 34] and [35], respectively. For the TSK-FS and SDA-SSL-TSK-FS methods, the number of fuzzy rules was selected from 5, 10, 15, 20, 25, 30, the regular parameters λ1, λ2, and λ3 were selected from {10-3, 10-2, ⋯ , 102, 103}, the transfer balance parameter η was selected from 0, 0.1, 0.2, 0.3, ... ,0.9, 1, and the fuzzy index m was selected from 1.1, 1.5, 2, 2.5. Five-fold cross-validation was applied on the training data for all the methods.
We followed the two TL scenarios used in [12] to configure the dataset. In Scenario 1, the source domain data and target domain data have the same data distribution; in Scenario 2, the data distributions of the source domain data and target domain data are different, as shown in Table 2.
Dataset Configurations for Epileptic eeg Signal Recognition
Dataset Configurations for Epileptic eeg Signal Recognition
1) Identification performance analysis To achieve a comprehensive comparison, we have made the following arrangements. We use three feature extraction methods, namely, WPD, STFT and KPCA. Under the same extraction method, six classical methods and four composite methods are compared with our new method. The accuracy of each classifier is shown in Tables 3–5. Among the six classic non-transfer methods, the TSK-FS model has the best comprehensive performance. The results show that TSK-FS is suitable for EEG signal processing. In addition, compared with black box methods such as support vector machines, this method also has the advantage of interpretability. In Scenario 1, the classic (non-transfer) machine learning methods can also obtain good accuracy. However, for the data in Scenario 2, the performances of these methods drop significantly. This is because the data distributions of the source domain data and the target domain data are not the same, so these non-transfer methods have difficulty distinguishing between data samples. Different from non-transfer learning methods, methods that use transfer learning or semi-supervised learning generally achieve satisfactory classification performance. This shows that transfer learning and semi-supervised learning can indeed have a positive effect on EEG signal recognition. Compared with the four composite TL methods or SSL methods, the SDA-SSL-TSK-FS model has the highest classification accuracy for datasets with different source and target data distributions. This is because TSVM and S4VM are only based on semi-supervised learning, LMPROJ and GTL2 are only based on transfer learning, and our method uses both. Specifically, the new method uses subdomain adaptation (SDA) to learn feature information common to the same category to reduce the deviation from the data distribution. At the same time, SSL makes full use of unlabeled data to obtain a large amount of potential feature information. To assess whether the methods used are statistically significant, we use Friedman’s test and Holm’s test [36, 37]. The former test is used to calculate the average ranks of different methods and to determine whether the statistical differences between the methods are significant. If the p-value is less than 0.05, the null hypothesis (that is, there is no statistically significant difference) is rejected. We also perform a Holm post-hoc test to verify whether there is a statistically valid difference between the control method (that is, the method that achieves the best Friedman rank) and other methods.
Performance of Each Classifier Based on Wpd
Performance of Each Classifier Based on Wpd
Performance of Each Classifier Based on Stft
Performance of Each Classifier Based on Kpca
The results of Friedman’s comparative experiment are shown in Tables 6 and 7. The results of the test show that the accuracy of the newly proposed method is significantly different from those of the other methods. Holm’s test shows that the SDA-SSL-TSK-FS model is significantly better than all six TL-based methods, but the performances of existing composite methods are different. Although the diagnostic method we proposed does not show statistical improvement this is not important for our more explanatory diagnostic method.
Friedman Test Results for the Average Performance of Each Method (α = 0.05)
Holm Test Results for the Average Performance Results of the Friedman Test (α= 0.05)
In summary, the experimental results show that the new composite method can be applied to the recognition of EEG signals from epileptic patients: the classification performance of the model is excellent and superior to those of most existing methods, and our method has high interpretability, which is highly conducive to medical diagnosis.
2) Analysis of the interpretability of the models
This subsection analyzes the interpretation function of the SDA-SSL-TSK-FS model to prove the superiority of the proposed method. The parameters of the model generated from dataset D4 are shown in Table 8.
The Sda-Ssl-Tsk Model Trained on Dataset d4 with Wpd Features
Fig. 4 shows the membership function (MF) of the corresponding fuzzy set under each fuzzy rule. We use the level of signal frequency (Low, Slightly low, Medium, Slightly high, High) as the natural-language description of each MF. Considering the fact that doctors have different understandings of the same semantics, the descriptions of the rules will be different.
For the data in the first row of Fig. 4, the antecedent parameters (the center c and variance σ of band 1), i.e., (32.21, 0.85) for the 1st fuzzy rule, (30.99,0.96) for the 2nd fuzzy rule, (31.53,0.88) for the 3rd fuzzy rule, (29.9,0.42) for the 4th fuzzy rule, and (28.39,0.61) for the 5th fuzzy rule are represented by generating five MFs, which are recorded as band 1. The five MFs can express “Low", “Slightly low", “Medium", “Slightly high” and “High” in natural language, arranged in ascending order with regard to the central value. By analogy, other features (bands) also have their own descriptions generated by five MFs. Finally, the language expression of the “IF” part of the fuzzy system is given. Then, the corresponding linear functions of the five fuzzy rules generated according to the WPD features can be described in natural language as follows:
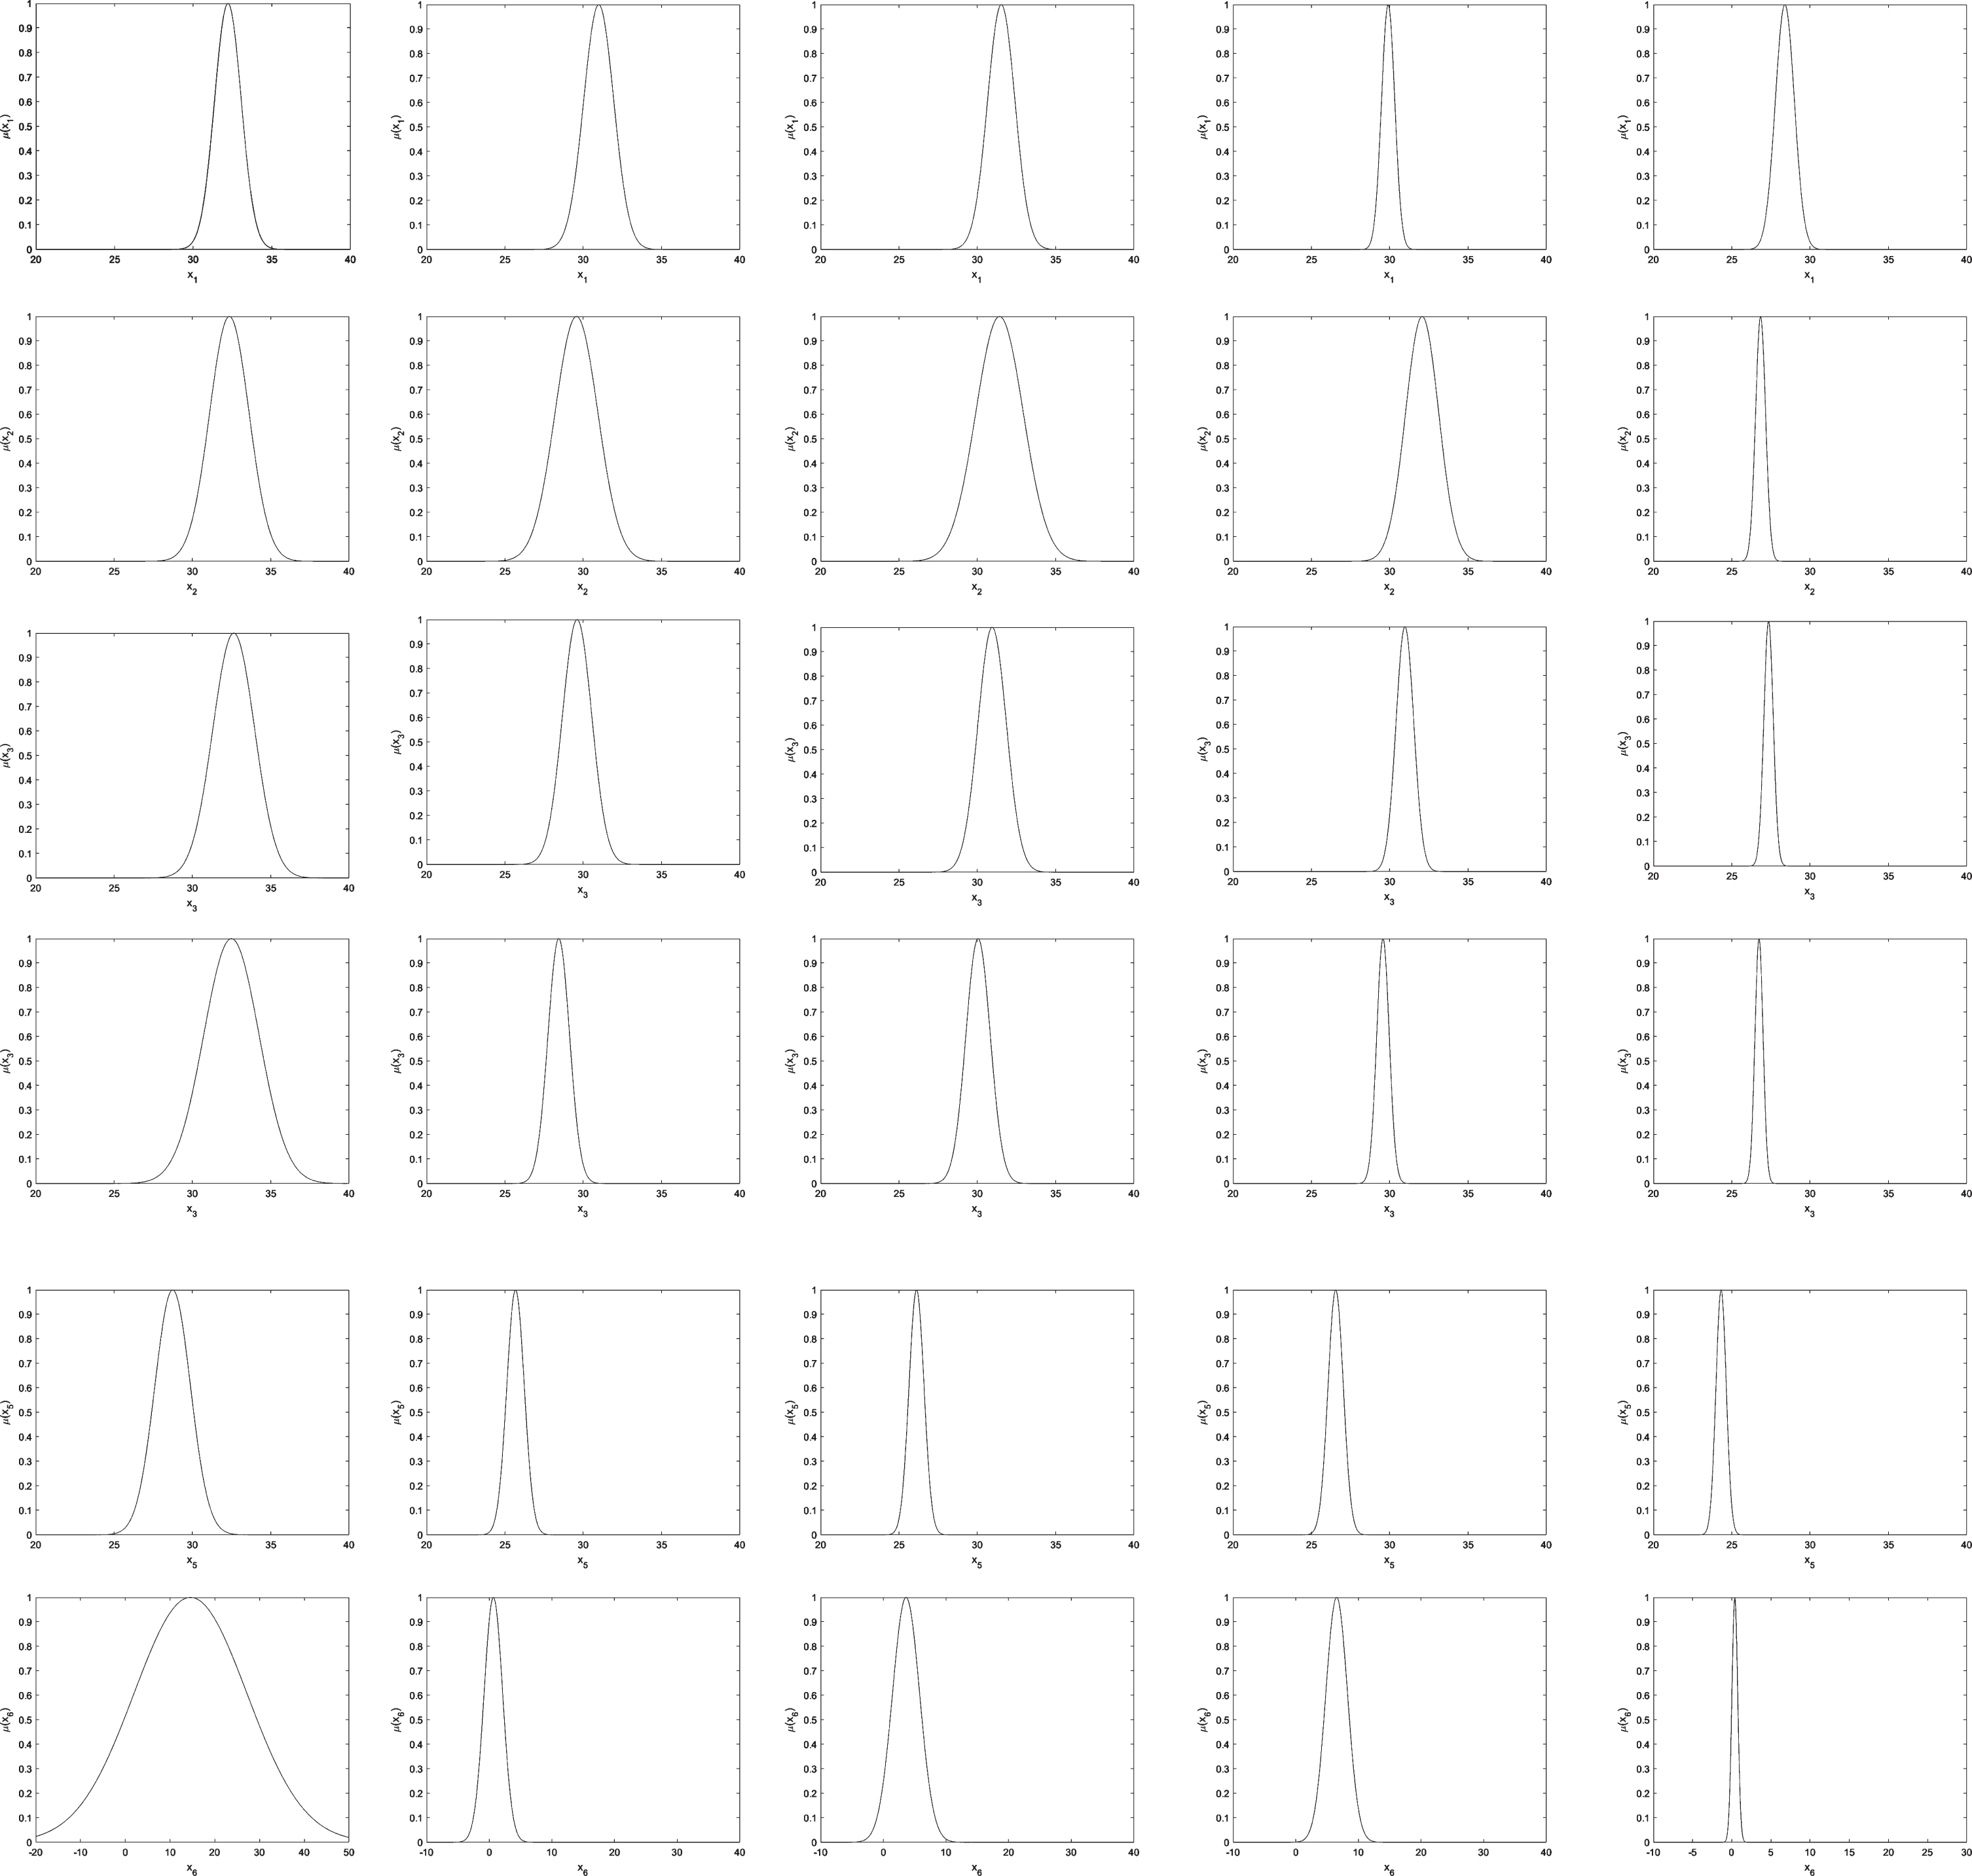
The membership function of the fuzzy subset of the antecedent of the fuzzy rule in the fuzzy system and its possible natural-language interpretation. The fuzzy system uses WPD features. *The preceding parameters (c1, σ1) of the first feature (dimension) of the data. ** is a possible explanation for the obtained fuzzy set.
The 1st Fuzzy Rule:
The 2nd Fuzzy Rule:
The 3rd Fuzzy Rule:
The 4th Fuzzy Rule:
The 5th Fuzzy Rule:
Similarly, fuzzy systems constructed with WPD features, STFT features or KPCA features can also be explained accordingly. Figure 5 shows an example that details how the SDA-SSL-TSK-FS model uses rules to recognize epileptic signals. In Fig. 5, we use the SDA-SSL-TSK fuzzy system to diagnose EEG signals processed by using the WPD method. Using one-hot encoding to represent the output of the system, [1, 0] denotes healthy people, and [0, 1] denotes epilepsy patients. When a patient’s sample is obtained, such as Data = [29.8734,28.7518,28.376,27.5648,24.659,0.0423] in Fig. 5, we can input these data into our built SDA-SSL-TSK-FS model, and then the corresponding decision function values of each rule are computed, such as f2 = [–0.0154,0.7065] in Fig. 5. Finally, using Equation (3.f), the SDA-SSL-TSK-FS model obtains the output value Y = [–0.0154, 0.7065]. According to the “winner takes all” principle, we end up with Y = [0,1], which means that this person is a patient with epilepsy.
The below illustration proves that the proposed fuzzy system is an explanatory model for identifying patients with epilepsy based on the generated fuzzy rules.
3) Computational complexity
In this section, the computational complexity of the new method is compared with those of the other two methods. Table 9 reports the running times of the three observations. The substitution of the TSK fuzzy system can solve the problem of long operating times based on TL or SSL. The results show that the new method is better than the existing methods for epilepsy classification, not only in terms of recognition accuracy but also in terms of real-time performance.
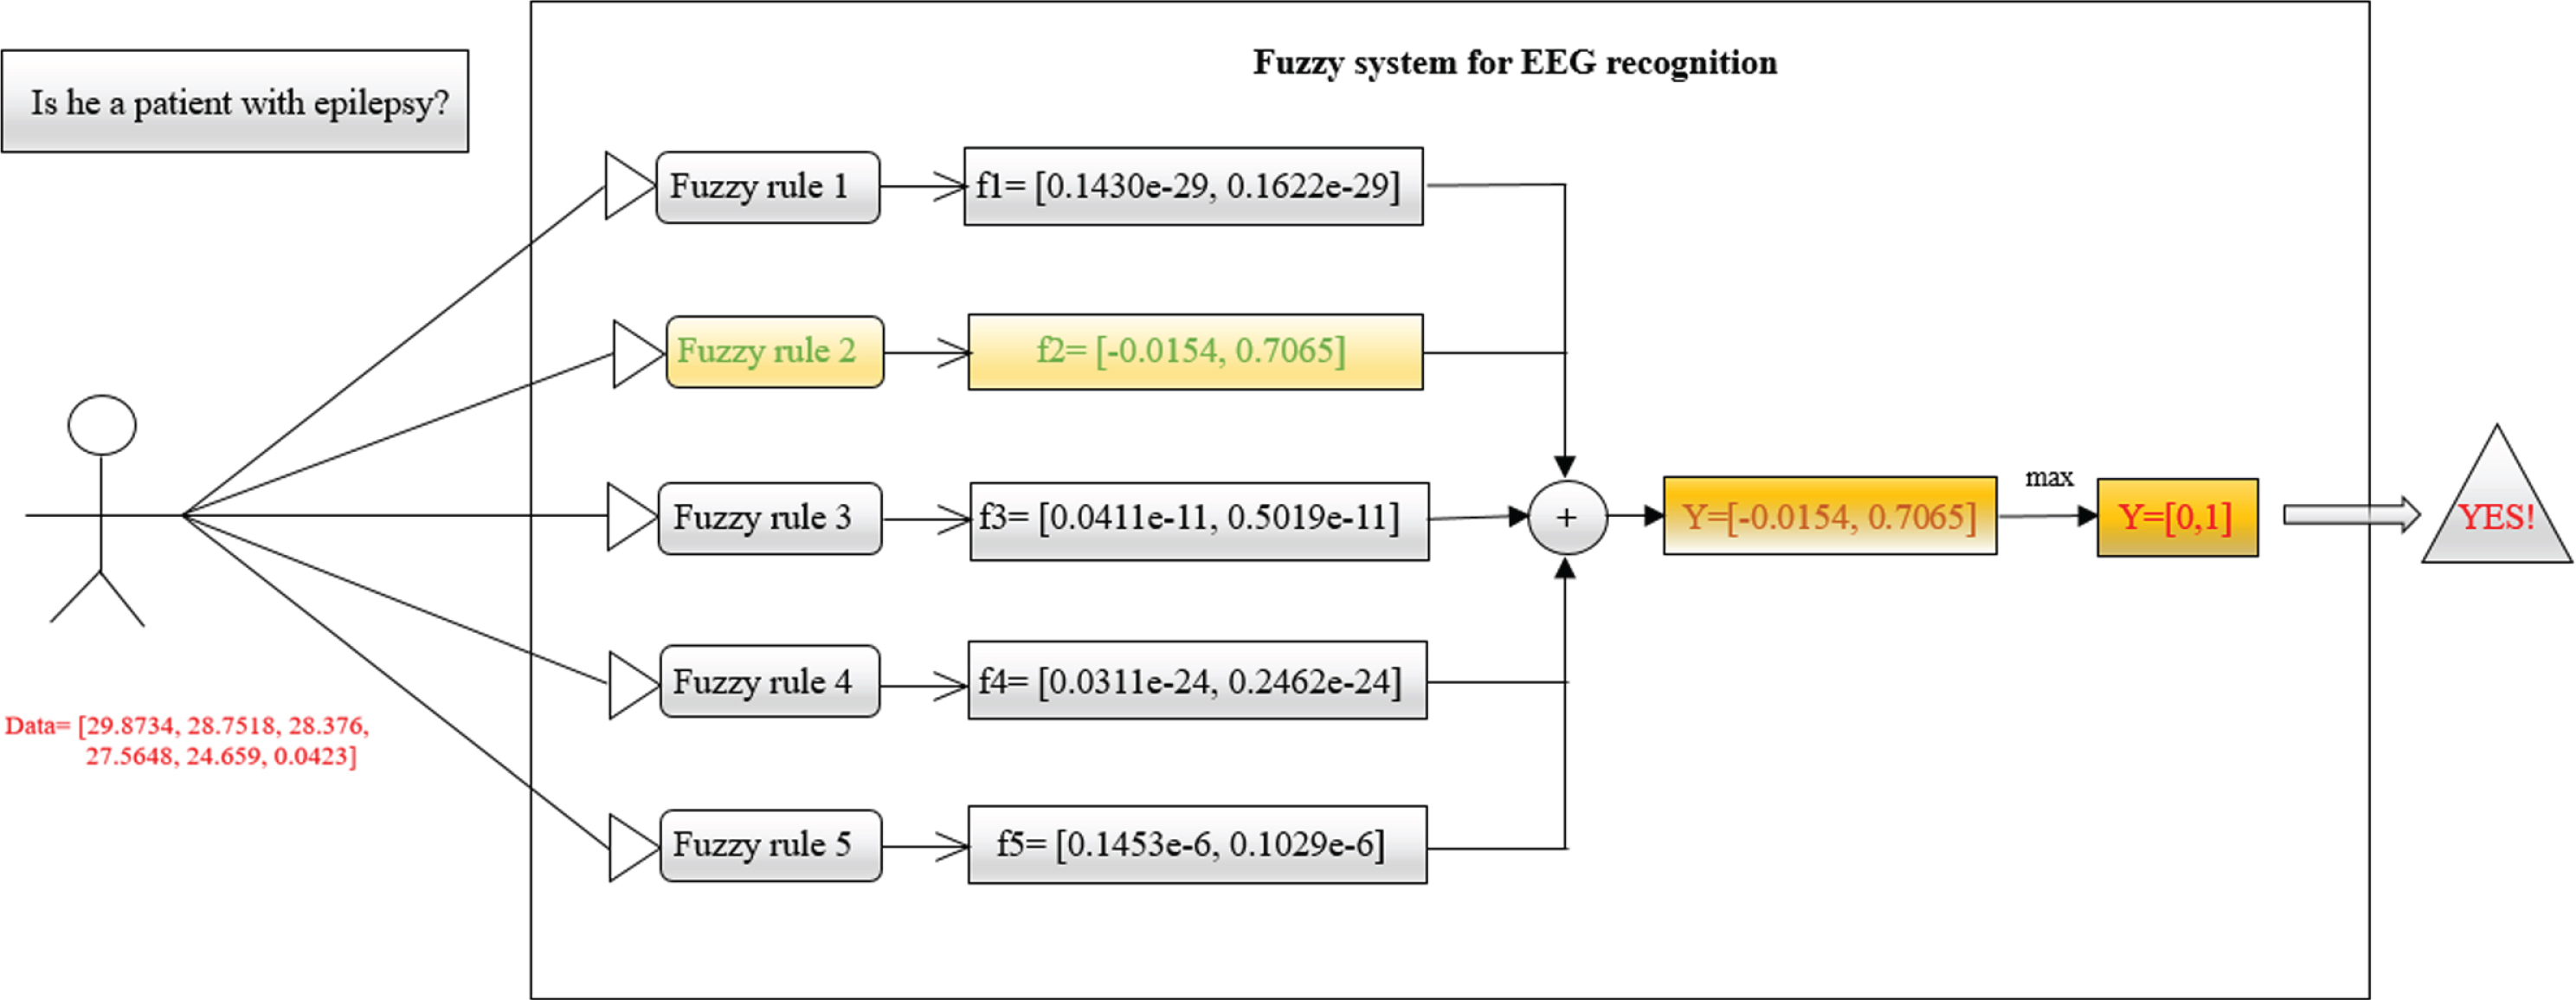
An example showing how to use the generated fuzzy rules and fuzzy system to identify epileptic patients, where “+” represents the merging operation, and “Max” means setting the maximum element in Y to 1 and the other elements to 0.
Comparison of computational complexity for the SDA-SSL-TSK method and the SSL-based and TL-based methods on dataset D4
This paper proposes a new model for epilepsy classification that combines subdomain adaptation learning, semi-supervised learning and the TSK fuzzy system model to improve the accuracy and
interpretability of the classifier. Through comparative experiments, the results obtained by the new algorithm are better than those of most existing advanced algorithms. Moreover, in the experiment, only 50 labeled samples and 50 unlabeled samples are needed as training samples to achieve satisfactory accuracy. This shows that the method extracted in this article is effective for the classification of epileptic EEG signals. Using practical examples, the average accuracy of the proposed method is over 96%. Future research will focus on reducing the computational cost of the algorithm and extending it to other related applications, including brain-computer interfaces.
Footnotes
Acknowledgments
This work was supported in part by the National Natural Science Foundation of China under Grant 61702225, 61772241, and 61873321, in part by the 2018 Six Talent Peaks Project of Jiangsu Province under Grant XYDXX-127, in part by the Science and Technology Demonstration Project of Social Development of Wuxi under Grant WX18IVJN002, and in part by the Youth Foundation of the Commission of Health and Family Planning of Wuxi under Grant Q201654.