
Abstract
With the advancement of machine learning, credit scoring can be performed better. As one of the widely recognized machine learning methods, ensemble learning has demonstrated significant improvements in the predictive accuracy over individual machine learning models for credit scoring. This study proposes a novel multi-stage ensemble model with multiple K-means-based selective undersampling for credit scoring. First, a new multiple K-means-based undersampling method is proposed to deal with the imbalanced data. Then, a new selective sampling mechanism is proposed to select the better-performing base classifiers adaptively. Finally, a new feature-enhanced stacking method is proposed to construct an effective ensemble model by composing the shortlisted base classifiers. In the experiments, four datasets with four evaluation indicators are used to evaluate the performance of the proposed model, and the experimental results prove the superiority of the proposed model over other benchmark models.
Introduction
The credit market has developed rapidly over the past few decades, and financial institutions have faced severe challenges. Previously, financial institutions relied on the experiences of managers or simple statistical methods to evaluate borrowers and decide whether to issue loans [41]. However, traditional statistical methods gradually lost their effectiveness due to the increasingly complex characteristics of borrowers, causing financial institutions to incur losses. Therefore, machine learning methods, which have advantages such as predictive accuracy and stability, have been applied widely in credit scoring to identify potential behavior patterns from past data and assess the credit scores of borrowers before issuing loans [40].
In complex real-world applications for credit scoring, it is helpful to select, organize, and optimize various machine learning methods well [9, 50]. One promising scheme is to employ ensemble learning to improve the effectiveness of the credit scoring model [39]. Ensemble learning integrates multiple weak classifiers to form a strong classifier, which can effectively improve the stability of the model and accuracy of the prediction [20]. Various base classifiers, such as multilayer perceptron (MLP) [35], decision tree (DT) [37], AdaBoost [12], gradient boosting (GBDT) [13], random forest (RF) [4], extreme gradient boosting (XGBoost) [8], linear discriminant analysis (LDA) [27], and light gradient boosting machine (LGBM) [23], can be used to compose an ensemble model.
Although ensemble learning has many advantages, similar to all machine learning methods, it is affected by imbalanced data [15, 28]. Further, in the real world of financial institutions, the negative samples (users with good credit) significantly outnumber the positive samples (users with bad credit), and most real datasets can be regarded as imbalanced. Failure to consider the imbalanced data problem may result in the credit scoring model being overwhelmed by the negative samples and ignoring the positive samples. Therefore, this study is motivated by solving the imbalanced data problem and building an effective credit scoring model. The main contributions of this study can be summarized as follows: A novel multi-stage credit scoring model is constructed to obtain a superior prediction result from real datasets with different distributions. The proposed methods can enhance the robustness of the credit scoring model by dealing with imbalanced data and composing the better-performing base classifiers effectively. A new multiple K-means-based undersampling (MKBUS) method is proposed to address the imbalanced data problem. It can not only alleviate class overlapping and small disjuncts problems but also reduce information loss during sampling. A new selective sampling mechanism (SSM) is proposed. It can adaptively select the better-performing ones between the candidate base classifiers trained using the original imbalanced data and sampled data, respectively, to constitute the candidate trained base classifiers for the proposed model. A new feature-enhanced stacking (FES) method is proposed to compose the shortlisted base classifiers into an effective classifier ensemble. Four imbalanced credit scoring datasets were used to verify the effectiveness of the proposed model. Inspired by the statistical method proposed by Demšar [10], the Friedman test [14] and the Nemenyi test [32] were used to validate the reliability of the experiments further.
The remainder of this paper is organized as follows. Section 2 presents a literature review on imbalanced learning and classifier ensemble. Section 3 introduces the methodology of the proposed model. Section 4 details the experimental design. Section 5 presents the experimental results and experimental analysis. Section 6 provides conclusions and directions for future studies.
Literature review
The ensemble model for credit scoring is a hot topic of research in the last few decades. In this study, the model performance was improved by addressing the imbalanced data problem using a novel multi-stage ensemble model with multiple K-means-based selective undersampling. In this section, the related works regarding the two aspects are reviewed, that is, imbalanced learning and classifier ensemble.
Imbalanced learning
In the field of machine learning, learning from imbalanced data is a relatively new challenge that has been receiving increasing attention from both academia and industry [17]. Imbalanced data are characterized by an imbalanced number of positive and negative samples in the training data. Galar et al. [15] reported that class overlapping and small disjuncts in imbalanced data increase the difficulty in training effective classifiers. In the past two decades, to alleviate the impact of imbalanced data on classifiers, many scholars have proposed imbalanced learning approaches; in particular, the widely used undersampling methods (e.g., reducing the number of samples).
Random undersampling (RUS) is one of the simplest undersampling approaches for balancing data by randomly removing some of the negative samples. Recently, Lin et al. [30] proposed a clustering-based undersampling approach in which the K-means clustering technique is used to cluster the negative samples, and the cluster centers are used to replace the original negative samples. However, no evidence has been provided to show that the centers of negative clusters have the same effects as negative samples on the classifiers; this method may introduce extra noisy data and eliminate useful information. Ofek et al. [33] proposed a fast clustering-based undersampling method in which K-means is used to cluster the positive samples and then assign as many negative samples as positive samples in each positive cluster. The assigned criterion is to assign the negative samples to the closest positive clusters. However, the negative samples that cause class overlapping remain because they are usually close to the positive clusters. Furthermore, the K-means-based undersampling methods mentioned above only cluster positive samples or negative samples but ignore the complex relationships between the negative and positive samples that tend to result in class overlapping. Additionally, K-means clustering has high volatility, which makes the K-means-based undersampling significantly volatile as well. Therefore, a single K-means scheme cannot divide all samples correctly [2].
Although the existing imbalanced learning approaches, including RUS and K-means clustering technique, can alleviate the effect of imbalanced data on most classifiers to a certain degree, the undersampling methods are highly volatile and tend to cause information loss. Few studies have addressed data imbalance by effectively resolving class overlapping and small disjuncts problems.
To overcome the abovementioned limitations, a new imbalanced learning method called MKBUS, is proposed in this study, which handles undersampling by combining multiple K-means schemes [22] with different initial centers. MKBUS deals with imbalanced data by removing the negative samples from clusters that are dominated by positive samples and by retaining all the samples in clusters that are dominated by negative samples. Compared to traditional sampling approaches, MKBUS not only alleviates class overlapping and small disjuncts problems but also reduces information loss during sampling.
Although the undersampling approaches can improve the performance of most classifiers, it is still possible that the original imbalanced data perform better than the sampled data in training a few classifiers. It has been reported in some studies that most classifiers performed better when sampled data were used to train the models, but a few classifiers still performed worse when sampled data were used [7, 49]. The types of classifiers that perform better in the original imbalanced data are less affected by data imbalance and can be considered as those that are adaptable to imbalanced data. However, in the existing literature on ensemble learning, sampled data were primarily used to train all the base classifiers, and few studies considered the influence of classifier adaptability on the performance of ensemble models.
To overcome the limitation mentioned above, a new selective sampling mechanism, i.e., SSM, is proposed in this study to adaptively select the better-performing ones between the candidate base classifiers trained using the original imbalanced data and sampled data, respectively.
Classifier ensemble
In the domain of credit scoring, machine learning has the potential to outperform traditional statistical methods. However, Wolpert & Macready [46] suggested that no single complex classifier in machine learning can effectively solve various problems. Therefore, the ensemble of multiple base classifiers has been employed widely to solve credit scoring problems. Ensemble methods, such as stacking [45], boosting [38], and bagging [3], can be used to combine multiple base classifiers to construct ensemble models that outperform any single base classifier. Bagging and boosting are often used to construct homogeneous models from the same type of base classifiers, and stacking is suitable for constructing both heterogeneous models (with different types of classifiers) and homogeneous models (with the same type of classifiers).
Recently, the superior performance and robustness of heterogeneous models have been demonstrated and have drawn considerable attention [42–44]. The stacking method integrates base classifiers by learning the prediction results of base classifiers through a meta-classifier. However, Lessman et al. [26] evaluated different types of ensemble models for credit scoring and argued that stacking was sometimes less effective than boosting and bagging. Xia et al. [47] discovered that a simple stacking structure design and poorly performing base classifiers are the major factors affecting the performance of the ensemble model. Therefore, in this study, the design of the stacking structure is improved through a new FES method that adaptively selects and combines the features of training data, after which the shortlisted base classifiers are combined into an effective ensemble model for credit scoring.
Methodology
The model proposed in this study consists of three stages: the MKBUS method for addressing imbalanced data, the SSM method for selecting the better-performing base classifiers, and the FES method for combining the shortlisted base classifiers into an effective ensemble model. The framework of the proposed model is shown in Fig. 1.
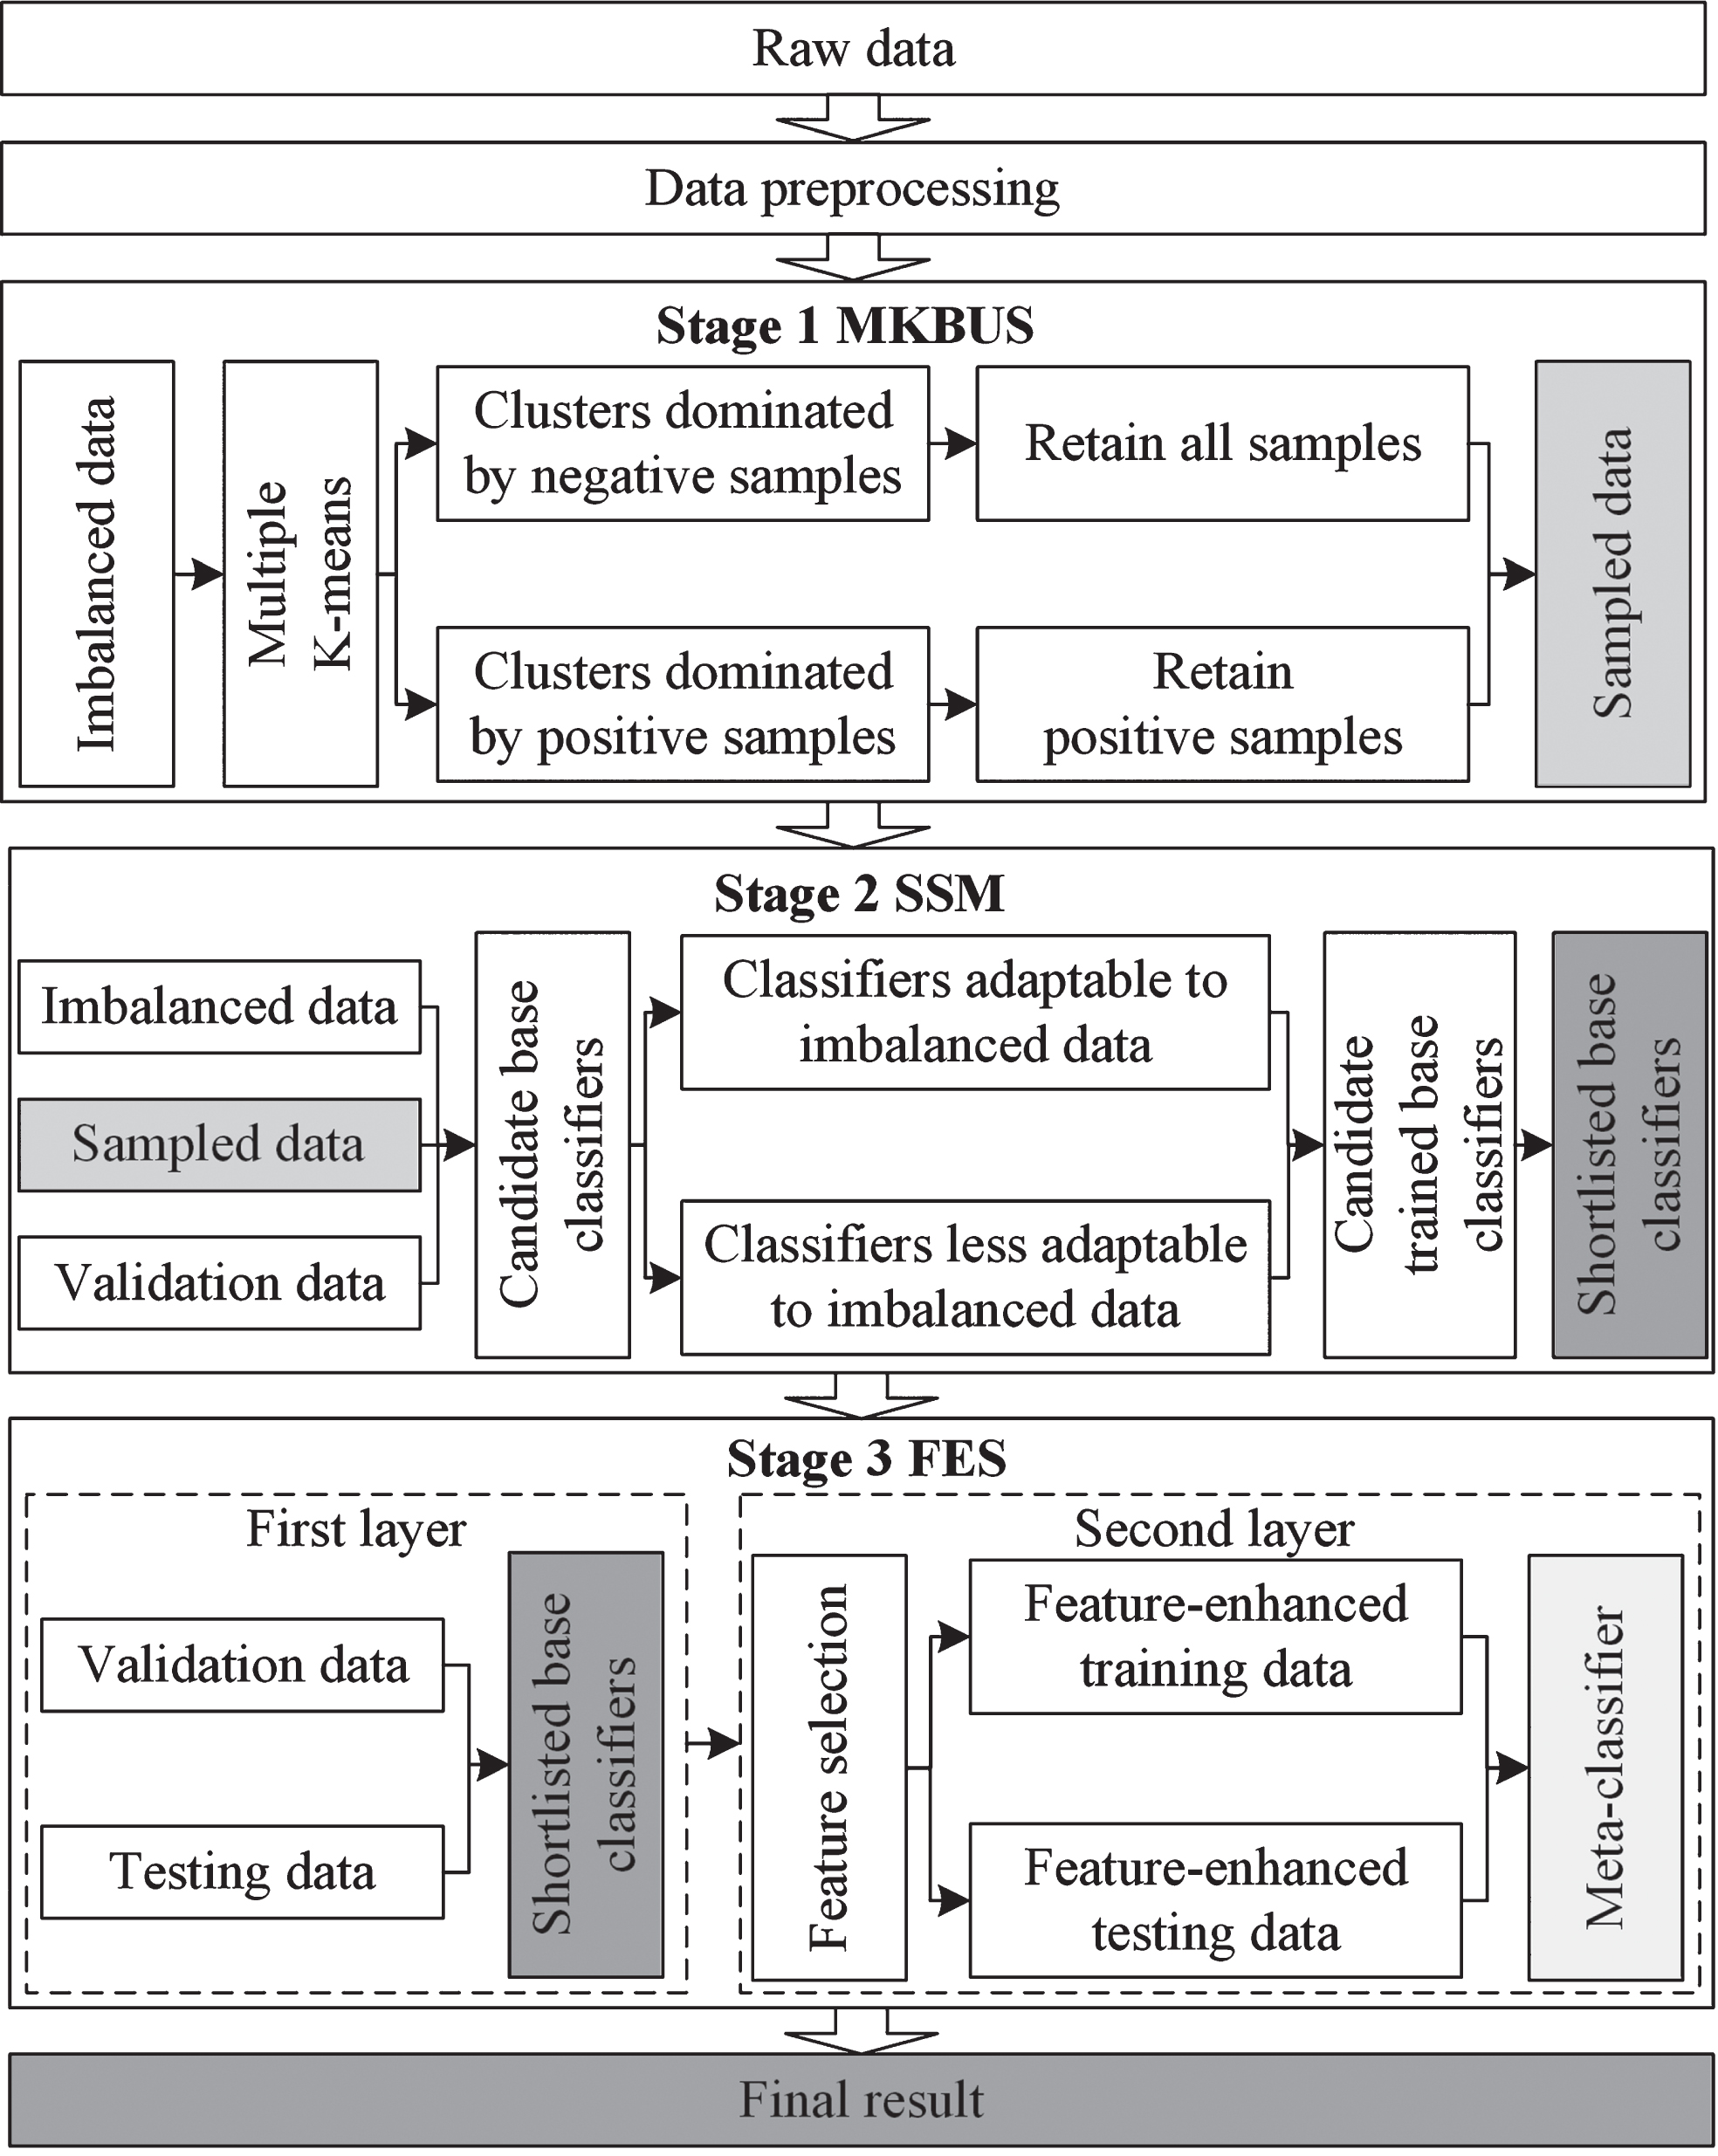
Framework of the proposed model.
Traditional imbalanced learning approaches via clustering-based undersampling have high volatility and tend to cause information loss. To overcome these drawbacks, a new imbalanced learning method, i.e., MKBUS, is proposed in this study, with the following steps demonstrated using an illustrative example shown in Fig. 2.
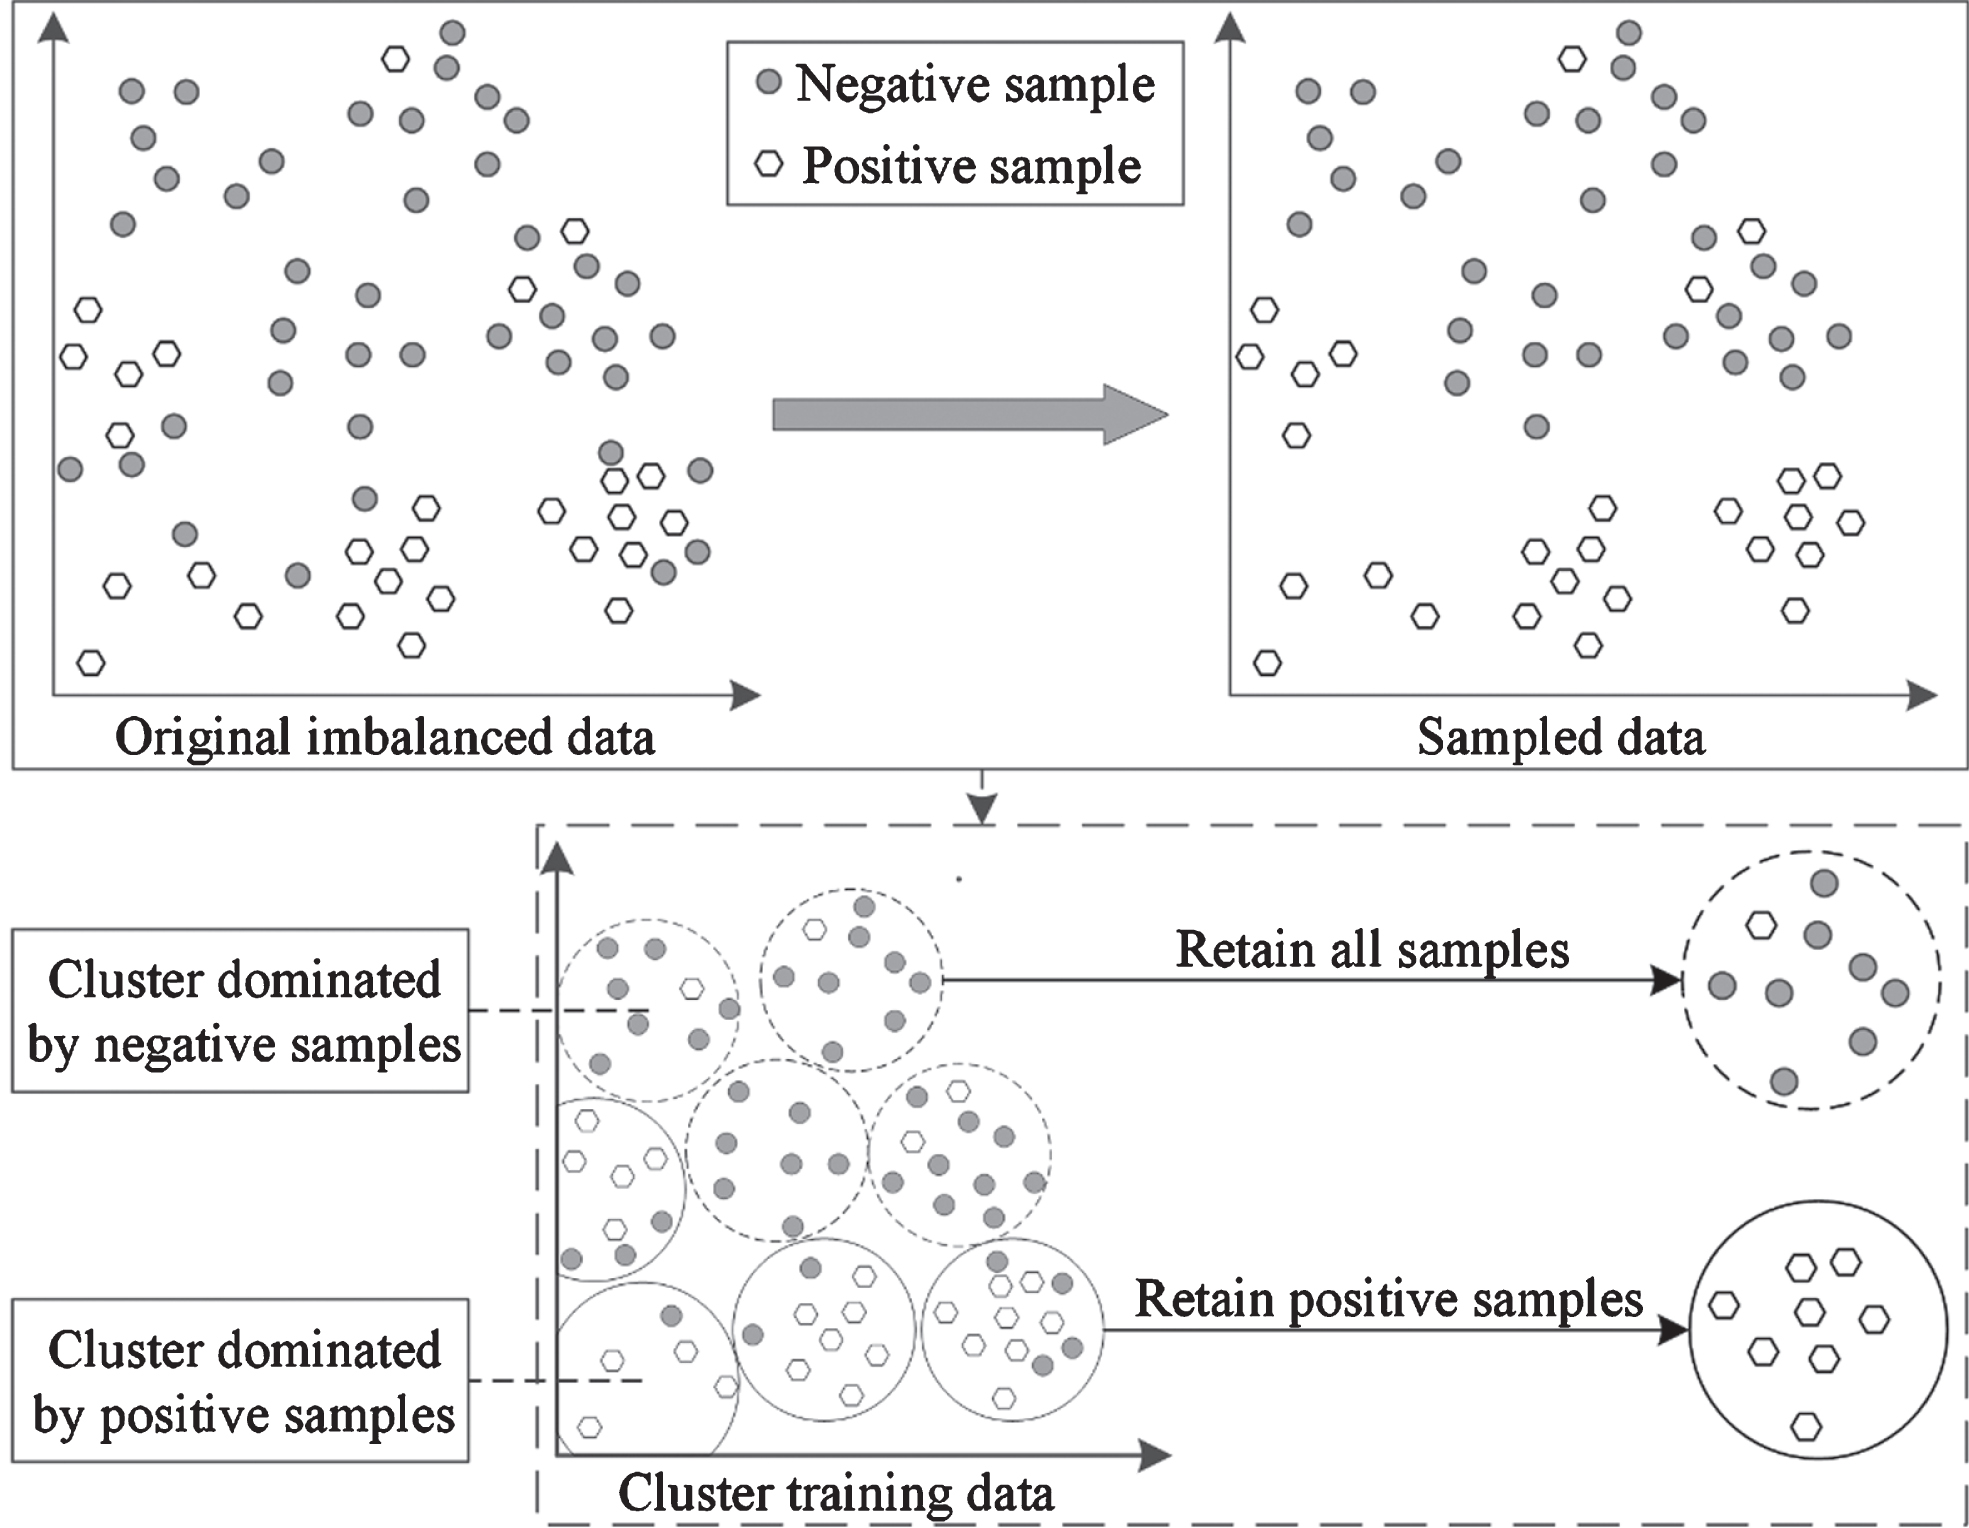
Process of the MKBUS.
Step 1: Divide the original imbalanced training data into multiple Z clusters using the multiple K-means schemes [22] with different initial centers. Then, inspired by Fred [11], use voting method to integrate multiple decisions of these K-means schemes to obtain the Z ensemble clusters.
Step 2: Calculate the negative imbalance coefficient, θ
a
, in the ath ensemble cluster using Equation (1), where a belongs to [1, Z], and
Step 3: Compare the negative imbalance coefficient of each ensemble cluster with a given threshold, R. If the negative imbalance coefficient in an ensemble cluster is lower than R, all positive samples in this cluster are retained and all negative samples in this cluster are removed.
Step 4: Combine Z ensemble clusters to form the sampled training data.
From these steps, it can be observed that MKBUS integrates the decisions of multiple K-means schemes to obtain ensemble clusters first. Next, the imbalanced data is handled by selectively removing the negative samples from the ensemble clusters that are dominated by positive samples. This is unlike the traditional RUS, which randomly removes some negative samples or existing clustering-based undersampling approaches that only cluster positive or negative samples. The K-means algorithm organizes all samples with similar features into the same clusters. Considering that the samples labeled with different classes (positive or negative) in the same ensemble clusters may cause class overlapping and small disjuncts, which increase the difficulty of effectively training classifiers [15], hence, MKBUS removes the negative samples from the ensemble clusters that are dominated by positive samples. On the contrary, MKBUS retains the negative samples in the clusters that are dominated by negative samples and hence reduces the information loss arising from undersampling. Compared to traditional clustering-based undersampling approaches, MKBUS can cluster samples more effectively by alleviating volatility and without removing too much useful information, which may cause information loss.
The sampling approaches are useful for most classifiers that are less adaptable to imbalanced data. However, they change the distribution of the original data, affecting the performance of classifiers that are adaptable to imbalanced data. It is necessary to consider the influence of classifier adaptability on the performance of ensemble models and identify the original imbalanced data and sampled data that perform better in training different classifiers.
However, the existing ensemble models mainly use sampled data to train all the base classifiers and ignore the influence of classifier adaptability. To overcome these shortcomings, a new SSM method is proposed in this study to adaptively select the better-performing ones between the candidate base classifiers trained using the original imbalanced data and sampled data, respectively.
As depicted in Fig. 3, Clf i represents the ith one of I candidate base classifiers, and Sclf i and Oclf i represent the ith candidate base classifiers trained using the sampled data and original imbalanced data, respectively.
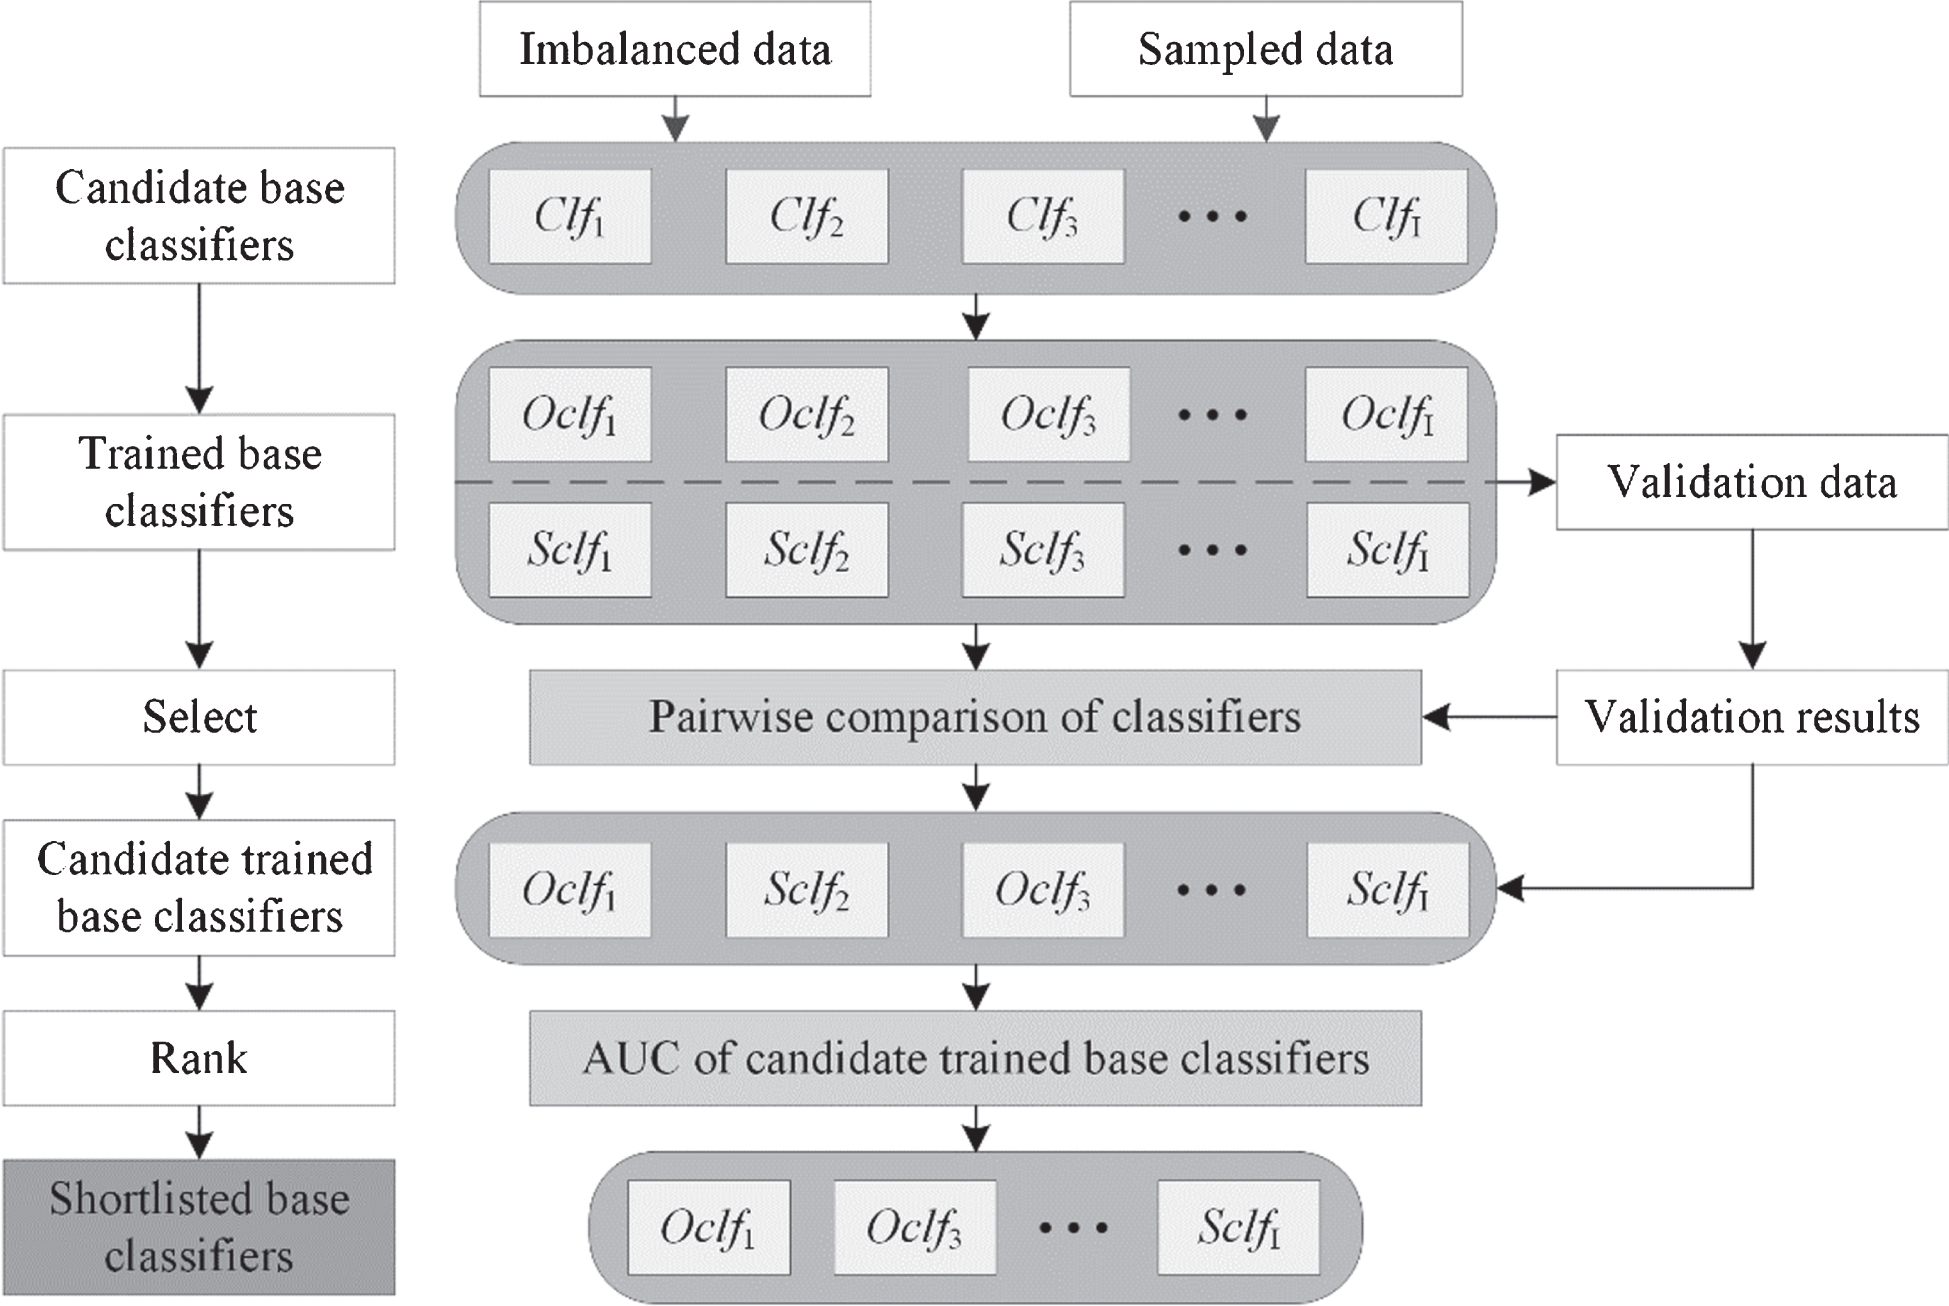
Framework of the SSM.
First, all the candidate base classifiers are trained using the sampled data and original imbalanced data respectively. Next, the validation data is adopted for pairwise comparison between the candidate base classifiers trained using sampled data and original imbalanced data, where the performance of each trained base classifier is measured based on the area under the receiver operating characteristic curve (AUC) [19]. If the AUC of Sclf i is higher than that of Oclf i , this candidate base classifier is less adaptable to imbalanced data, and Sclf i is selected as one of the candidate trained base classifiers. Otherwise, this candidate base classifier is adaptable to imbalanced data, and Oclf i is selected as one of the candidate trained base classifiers. Finally, the performances of the candidate trained base classifiers are evaluated and ranked by AUC values to form the shortlisted base classifiers that will be composed into a classifier ensemble in the next stage.
Although the stacking method has been proven to improve the performance of the credit scoring model, the model robustness tends to be affected by the simple design of the stacking structure and underperforming base classifiers. Therefore, in this study, the architecture of stacking is improved by implementing a new FES method comprising three modules: primitive feature generation, synthetic feature generation, and feature selection and combination. Owing to its excellent performance as the meta-classifier in the stacking method, logistic regression (LR) is employed as a meta-classifier in the FES method. Figure 4 illustrates an example of the FES framework according to the following steps.
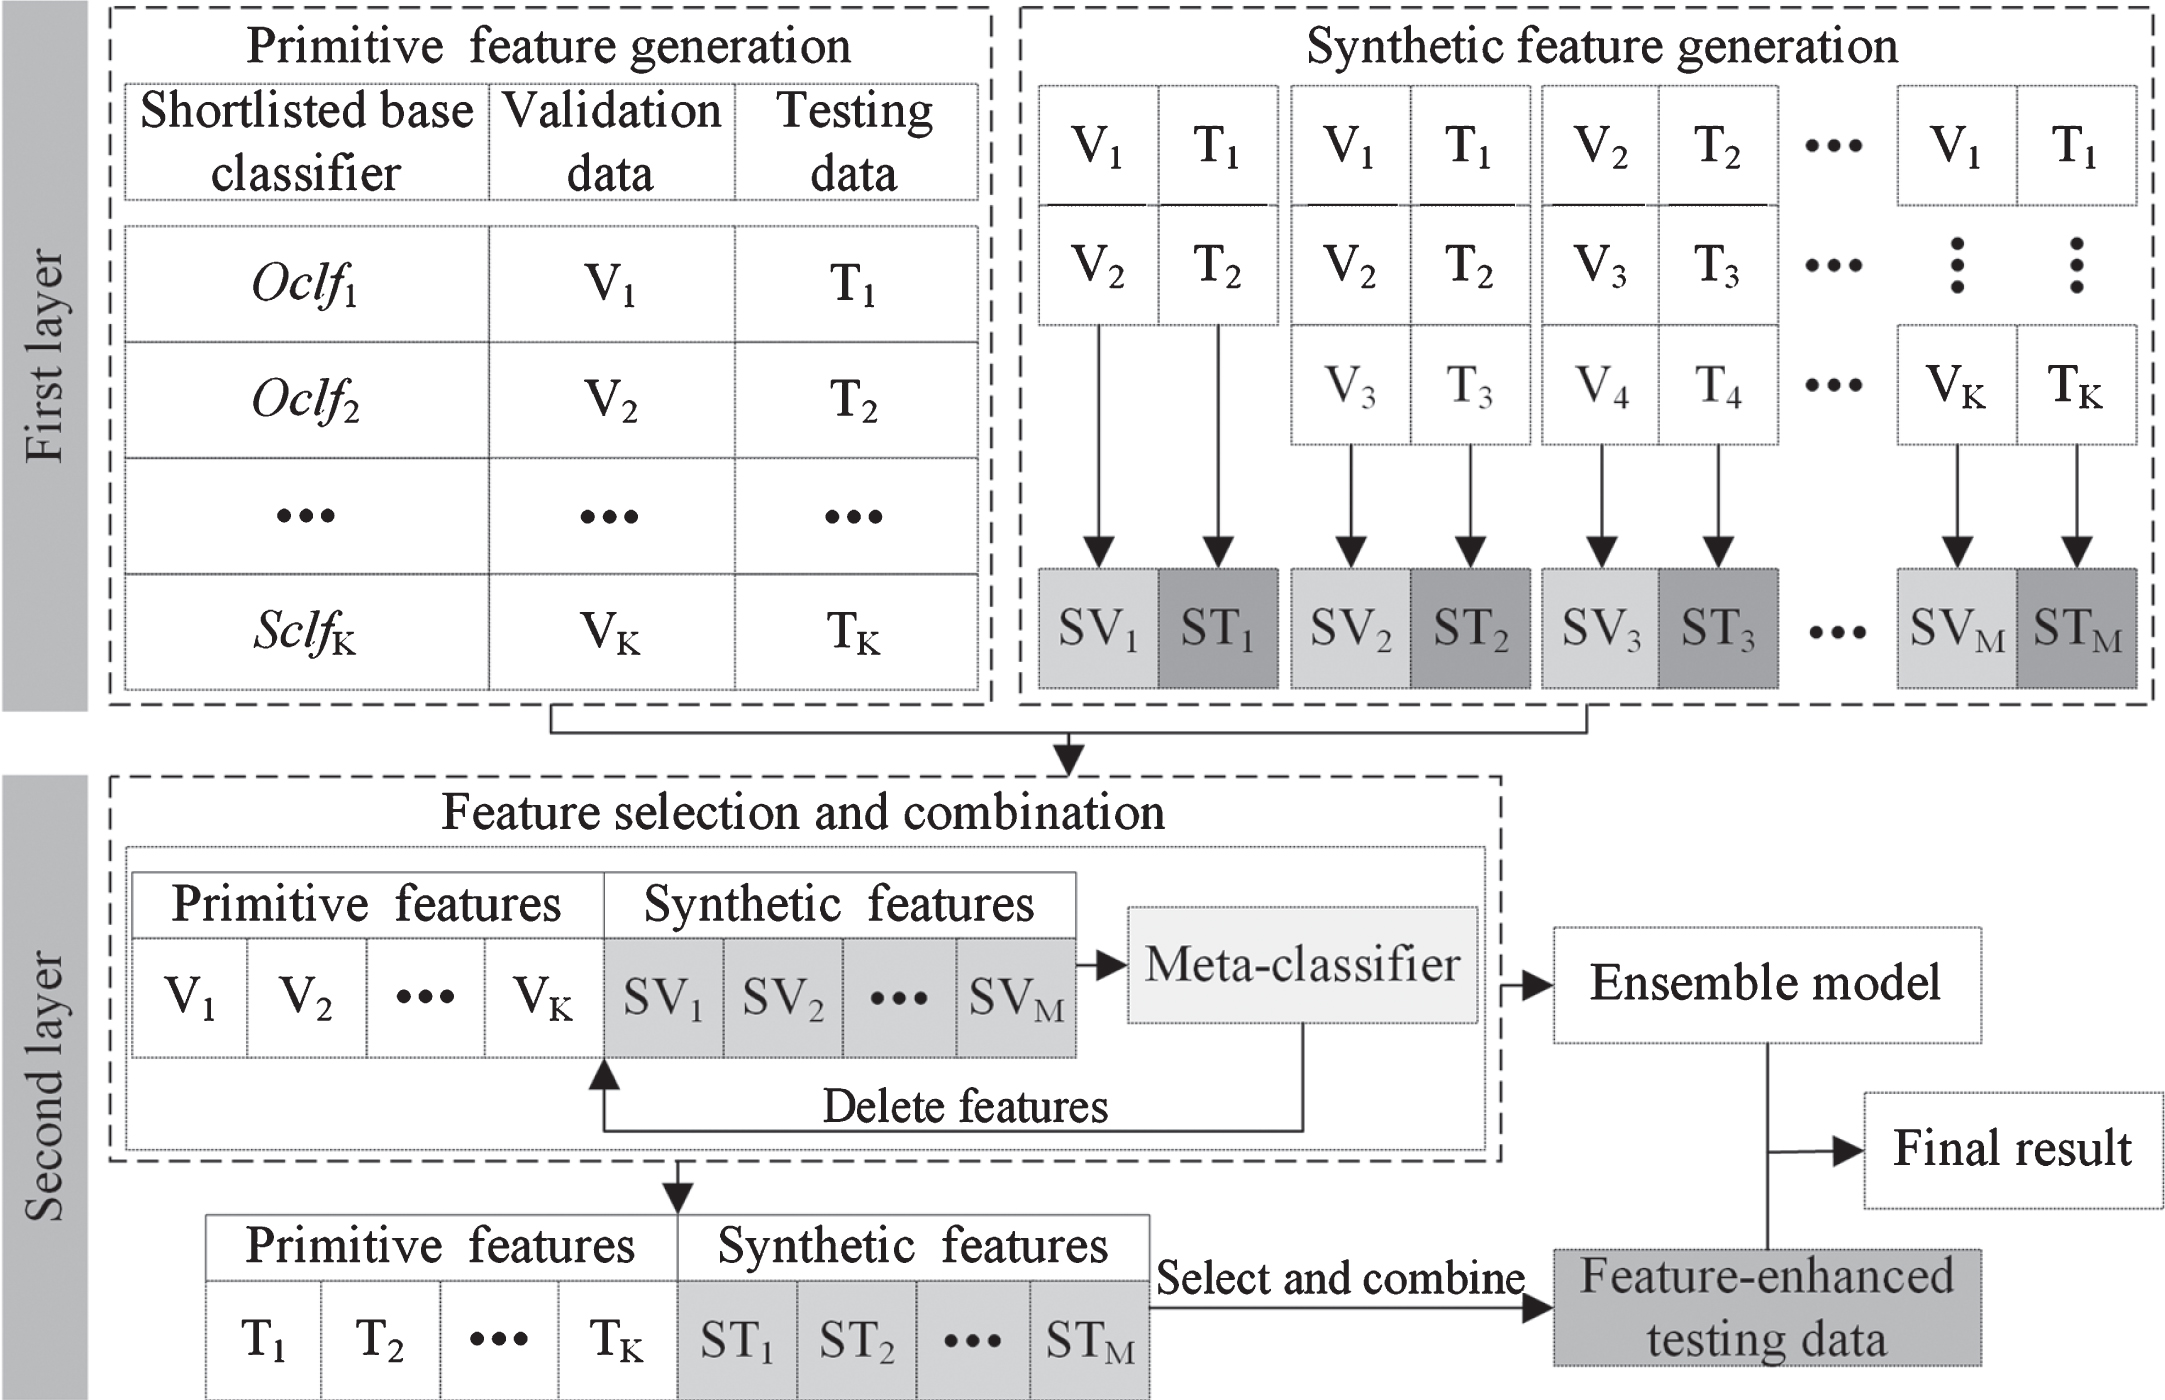
Framework of the FES.
The implementation process of FES is as follows:
Step 1: Through the primitive feature generation in the first layer, the shortlisted K base classifiers obtained through MKBUS and SSM are employed to predict the validation data and testing data, and the corresponding prediction results are expressed as V k (k = 1, 2, ... K) and T k (k = 1, 2, ... K), respectively. Each V k and T k can be used as primitive features for training and testing the meta-classifier, respectively, in the second layer.
Step 2: Through the synthetic feature generation in the first layer, the validation results, V
k
(k = 1, 2, ... K), are permutated and combined to produce the synthetic features, SV
m
(m = 1, 2, ... M), based on the simple average of the combined V
k
. M is determined using Equation (2). The synthetic features SV
m
, can also be used for training the meta-classifier in the second layer. Similarly, the testing results T
k
, are permutated and combined to produce the synthetic features, ST
m
(m = 1, 2, ... M), which can be used for testing the meta-classifier in the second layer.
Step 3: In the second layer, the primitive and synthetic features are selected and combined to train and test the meta-classifier. This can be achieved by discovering an optimum feature subset (i.e., salient features) by recursively eliminating useless features [18]. The meta-classifier outputted more accurate and robust predictions owing to the input of more comprehensive information obtained by enhancing the salient primitive and synthetic features. The final ensemble model that output the prediction results of the testing data as the final result is composed of the shortlisted base classifiers with enhanced features.
Credit datasets
To verify the effectiveness of the proposed model, four popular real-world credit datasets were employed in the experiment, namely, the Australian, Japanese, and German datasets, which are credit datasets from the UCI machine learning repository [1], and the AER dataset contributed by Greene [16]. The details of these datasets are listed in Table 1.
Details of the four datasets
Details of the four datasets
The Australian dataset contains 690 samples, including 307 positive samples and 383 negative samples. The dimension of the input features, including the class label, is 15, with eight numeric features and seven nominal features. The Japanese dataset contains 690 samples, including 307 positive samples and 383 negative samples. The dimension of the input features, including the class label, is 16, with five numeric features and 11 nominal features. The German dataset contains 1000 samples, including 300 positive samples and 700 negative samples. The dimension of the input features, including the class label, is 21, with seven numeric features and 14 nominal features. The AER dataset contains 1319 samples, with 296 positive samples and 1023 negative samples. The dimension of the input features, including the class label, is 12, with six numeric features and six nominal features.
Data preprocessing plays an important role in ensemble modeling. In the data preprocessing stage, the missing values of the numeric features were filled with the mean values, and the missing values of the nominal features were filled with the mode values. To handle the different orders of magnitude on different numerical features, standardization and normalization were applied to the numerical features by removing the mean and unit variance, respectively. To leverage the meaningful distance relationships between the different nominal feature values, dummy coding was applied to transform the nominal feature values into binary attributes [5].
In this study, four evaluation indicators were adopted: the AUC, geometric mean (G-Mean) [24], Kolmogorov-Smirnov test (KS) [29], and balanced accuracy (BACC) [6]. These evaluation indicators are calculated based on the values of the true positive (TP), false positive (FP), true negative (TN), and false negative (FN). The performance of a classifier is better if the values of the indicators mentioned above are higher. The specific calculation rules of these indicators are as follows.
AUC is a classical evaluation indicator in classification problems, and is defined as the area between the receiver operating characteristic curve and the coordinate axis.
G-Mean is a comprehensive indicator and is widely used to measure the accuracy of models in imbalanced learning. The definition of G-Mean is presented in Equations (3–5).
KS is used to measure a classifier’s ability to identify the samples correctly. The definition of KS is presented in Equation (7), where t represents the number of cumulative quantiles. The values of the true positive rate (TPR) and false positive rate (FPR) are represented by TPR(t) and FPR(t), respectively, when the cumulative quantile accumulates until t. The definitions of the TPR and FPR are provided in Equations (4) and (6), respectively.
BACC can more accurately reflect the classifier’s actual performance in imbalanced learning. It is defined in Equation (9), and the true negative rate (TNR) is defined in Equation (8).
The raw dataset was divided into training data, validation data, and testing data at a ratio of 0.64, 0.16, and 0.2, respectively, using the “train_test_split” function in Python’s skit-learn (sklearn) module. In the data preprocessing stage, the standardization and normalization of the numerical features was performed using the preprocessing package in Python’s sklearn module.
The candidate base classifiers, RF, DT, AdaBoost, MLP, GBDT, and LDA, were imported from the sklearn module. XGBoost and LGBM were imported from Python’s XGBoost module and LightGBM module, respectively. To facilitate a fair comparison, the default hyperparameters were adopted for all the candidate base classifiers.
Experimental results and analysis
In this study, eight candidate base classifiers, RF, XGBoost, AdaBoost, DT, GBDT, LGBM, MLP, and LDA, were adopted. Their performances were evaluated on four datasets using four evaluation indicators. The evaluation results of these base classifiers were used as benchmarks for comparison.
To avoid single-bias results and enhance the credibility of the experimental results, each experiment was performed 10 times, and the average values of the evaluation indicators were used for comparison. All the experiments were performed using Python version 3.7.5 on a PC with a 3.8 GHz Intel Core I7-10700K processor, 32 GB RAM, and Windows 10 operating system.
Baseline results
The baseline results, that is, the performances of the eight candidate base classifiers on the four datasets (i.e., Australian, Japanese, German, and AER), are shown in Table 2.
Baseline results on the four datasets
Baseline results on the four datasets
To verify the effectiveness of the proposed MKBUS, the sampled data with MKBUS were used to train eight candidate base classifiers, and their performances were evaluated based on the four evaluation indicators. The experimental results are presented in Table 3. The values in bold indicate that compared with the baseline results on the same dataset, applying MKBUS improved the performance of the base classifier.
Performance of candidate base classifiers after the application of MKBUS
Performance of candidate base classifiers after the application of MKBUS
According to a majority of the evaluation indicators, almost all of the candidate base classifiers performed better after MKBUS was applied. As explained in Section 3.2, the sampling approaches are effective in improving the performance of classifiers that are less adaptable to imbalanced data but not sensitive to classifiers that are adaptable to imbalanced data. This justifies the application of the SSM to enhance the effectiveness of the sampling approaches in ensemble models. The effectiveness of the SSM will be verified in the next subsection.
To compare the effectiveness of the proposed MKBUS with that of traditional undersampling methods, such as the selection of the near-miss samples (NearMiss) [48] and clustering-based undersampling (CBUS) [30], the sampled data obtained using the NearMiss and CBUS were used to train eight candidate base classifiers on the same datasets respectively. The evaluation results are presented in Table 4. If the NearMiss or CBUS outperformed MKBUS for a base classifier, the value of the evaluation indicator is in bold. The comparison showed that the NearMiss and CBUS only outperformed MKBUS on a few evaluation indicators for a few candidate base classifiers. This is because the proposed MKBUS can cluster samples more effectively by alleviating volatility and without removing too much useful information, which may cause information loss.
Performance of candidate base classifiers after the application of NearMiss and CBUS
To verify the effectiveness of the proposed FES and SSM methods, the FES ensemble model consisting of four shortlisted base classifiers with MKBUS applied was evaluated using four evaluation indicators, after which the FES ensemble model consisting of four shortlisted base classifiers, with both MKBUS and SSM applied was evaluated. The experimental results are presented in Table 5. For the FES ensemble model with MKBUS applied, the values in bold indicate that it outperformed the single best-performing candidate base classifier with only MKBUS applied. Further, the values in bold indicate that the FES ensemble model to which both MKBUS and SSM were applied outperformed the FES ensemble model to which only MKBUS was applied.
Performance of FES ensemble models with MKBUS with/without SSM applied
Performance of FES ensemble models with MKBUS with/without SSM applied
The above comparison shows that the FES ensemble model performs better than the single best-performing candidate base classifier for most evaluation indicators. This is because the FES integrates the advantages of multiple base classifiers, and the internal meta-classifier performs more accurately and with robust predictions owing to the input of more comprehensive information obtained by enhancing the salient primitive and synthetic features. This proves the effectiveness of the FES. Additionally, after the SSM is applied, the performance of the FES ensemble model is further enhanced for most evaluation indicators. This is because the SSM can help the ensemble model to adaptively select the better-performing classifiers between the candidate base classifiers trained using the original imbalanced data and sampled data, respectively. This proves the effectiveness of the SSM.
To enhance the reliability of the experiment further, and inspired by Demšar [10], statistical tests were applied. First, the Friedman test [14] was used to test the significance of all methods, and when the null hypothesis was rejected, the Nemenyi test [32] was applied. In the Friedman test, 34 classification models were ranked, based on different evaluation indicators. These models included eight base classifiers before the MKBUS method was applied, eight base classifiers after the MKBUS method was applied, eight base classifiers after the NearMiss method was applied, eight base classifiers after the CBUS method was applied, the FES ensemble model with the MKBUS method applied, and the proposed model (i.e., the FES ensemble model with both MKBUS and SSM methods applied). Next, the average ranking of each method was calculated by averaging the rankings of all classification models. Finally, the average method ranking was used to calculate the statistical significance of the Friedman test. Table 6 summarizes the significance test results of the average method ranking using the Friedman test.
Significance test results of the average method ranking using the Friedman test
Significance test results of the average method ranking using the Friedman test
According to the Friedman test results, the null hypothesis was rejected. The Nemenyi test was then applied to compare the performance of the proposed method with that of the other methods. The graphical representation of the Nemenyi test results is shown in Fig. 5. In the figure, the critical distance (CD) indicates the mean ranking score difference. The more the position of the proposed method on the coordinate axis is to the right, the better the performance of the classifier using this method. It can be seen from Fig. 5 that the proposed model MKBUS + SSM + FES was superior to all other models.
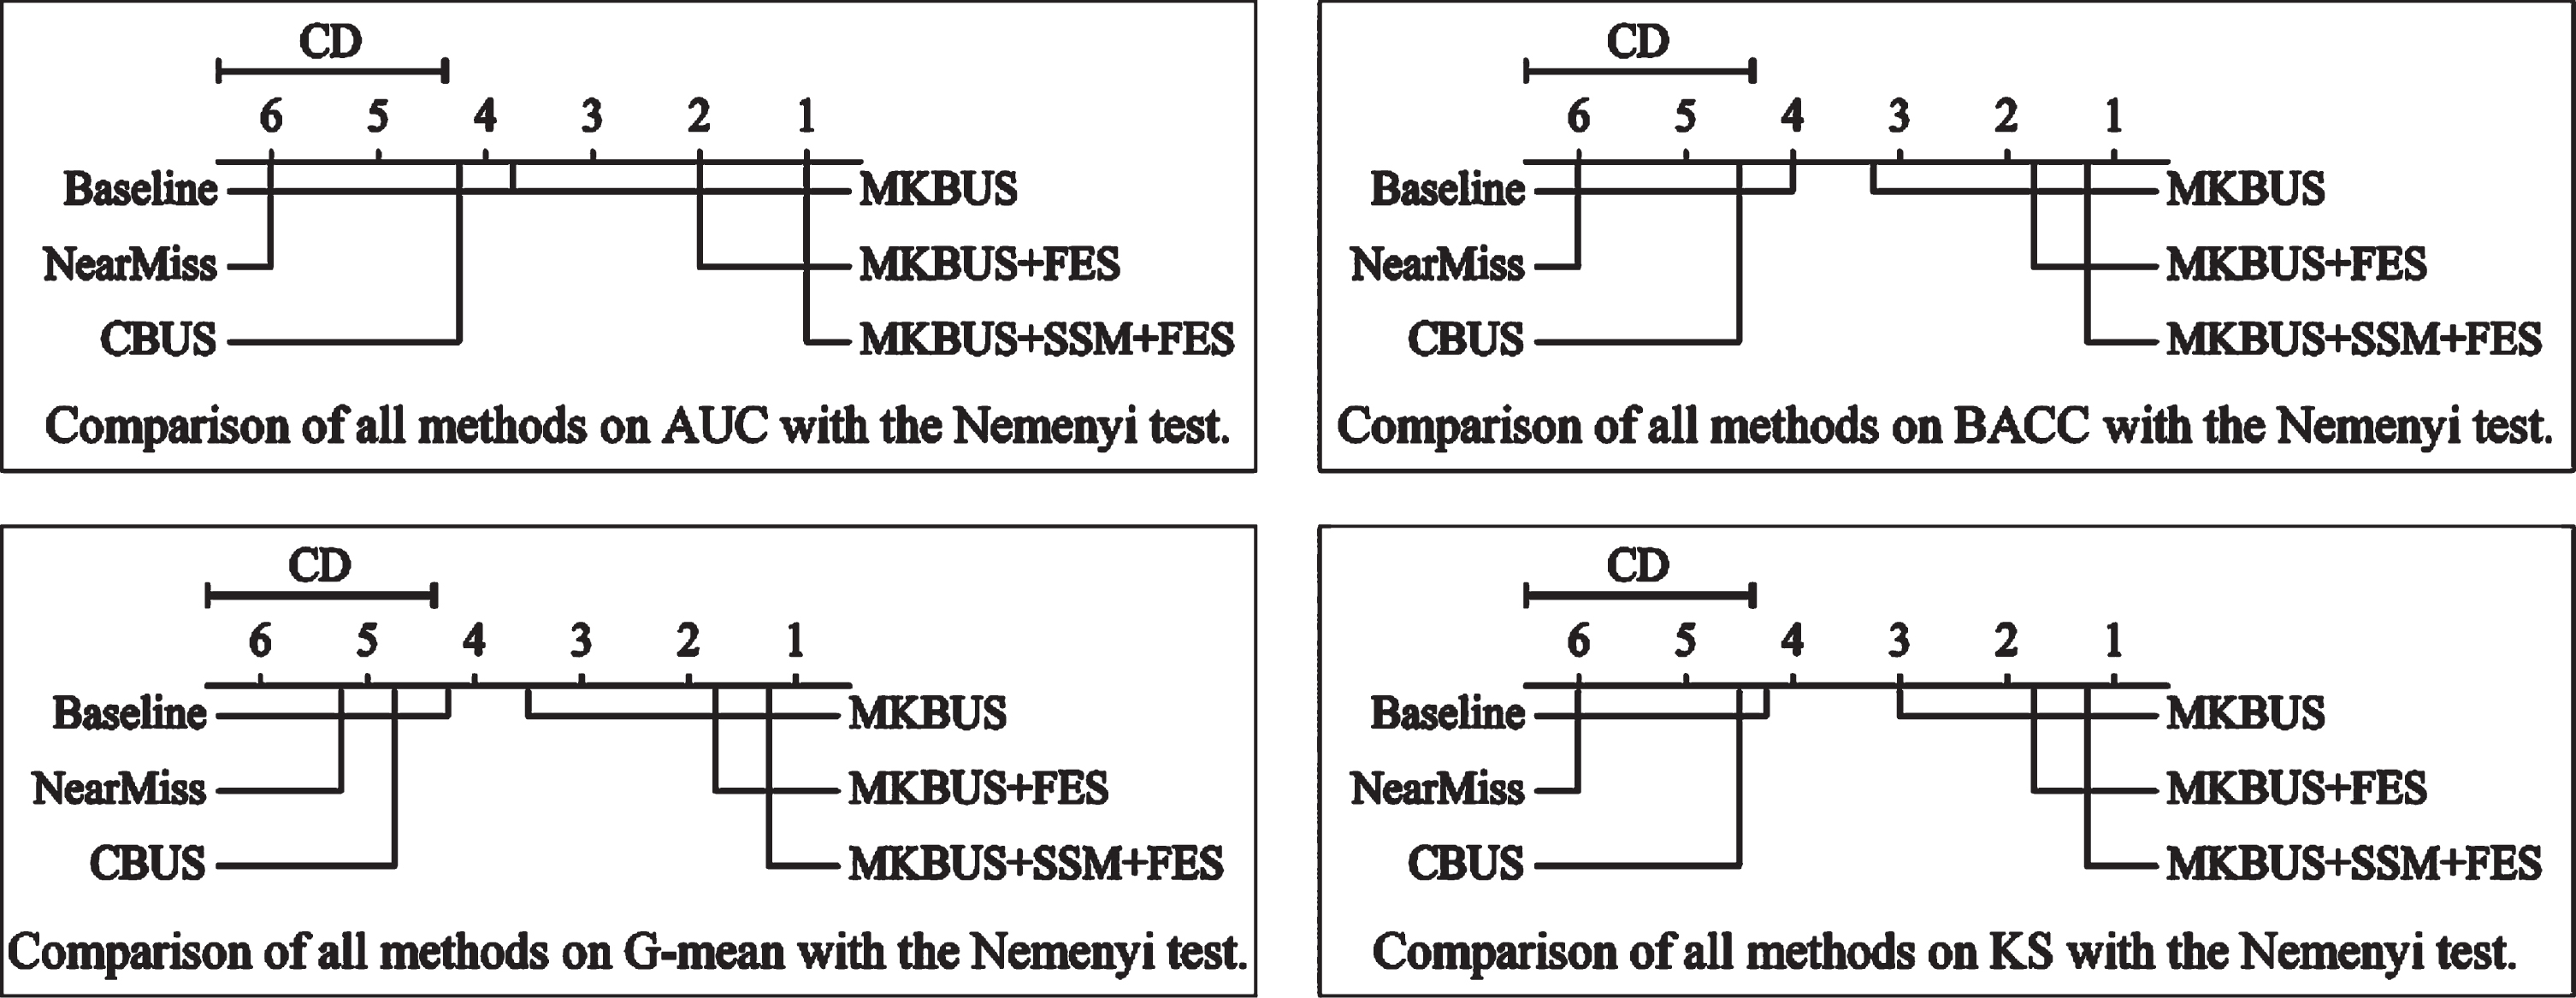
Graphical representation of the Nemenyi test results.
To verify the effectiveness of the proposed model further, some existing ensemble models were implemented as benchmark ensemble models on the three standard credit scoring datasets, that is, the Australian, Japanese, and German datasets. The selected benchmark ensemble models were the models proposed by Jadhav et al. [21], Rajaleximi et al. [36], Lan et al. [25], and Nanni & Lumini [31]. Because the source codes of these benchmark ensemble models were not publicly available, and most of them only published the achieved AUC as the evaluation indicator on some datasets, the original AUC values in the references were cited directly for comparison with those of the proposed model. For the Australian and German datasets, the comparison results between the proposed model and the benchmark ensemble models proposed by Jadhav et al. [21], Rajaleximi et al. [36], and Lan et al. [25], were provided because these benchmark ensemble models were applied on these two datasets in the references. For the Japanese dataset, the comparison results between the proposed model and benchmark ensemble models proposed by Rajaleximi et al. [36] and Nanni & Lumini [31] were provided because these benchmark ensemble models were applied on the Japanese dataset in the references. For the AER dataset, no comparison results between the proposed model and benchmark ensemble models were provided in the experiment because none of the benchmark ensemble models were applied to the AER dataset according to these references.
The comparison results are shown in Fig. 6, with various models differentiated using different filling patterns. It can be observed that on the Australian, Japanese, and German datasets, the proposed model significantly outperformed the benchmark models based on the AUC values. For the Australian dataset, the proposed model outperformed the second-best benchmark ensemble model, which was proposed by Rajaleximi et al. [25], with a 2.25% improvement in the AUC value. For the Japanese dataset, the proposed model outperformed the second-best benchmark ensemble model, which was proposed by Nanni & Lumini [31], with a 0.10% improvement in the AUC value. For the German dataset, the proposed model outperformed the second-best benchmark ensemble model, which was proposed by Jadhav et al. [21], with a 0.79% improvement in the AUC value.
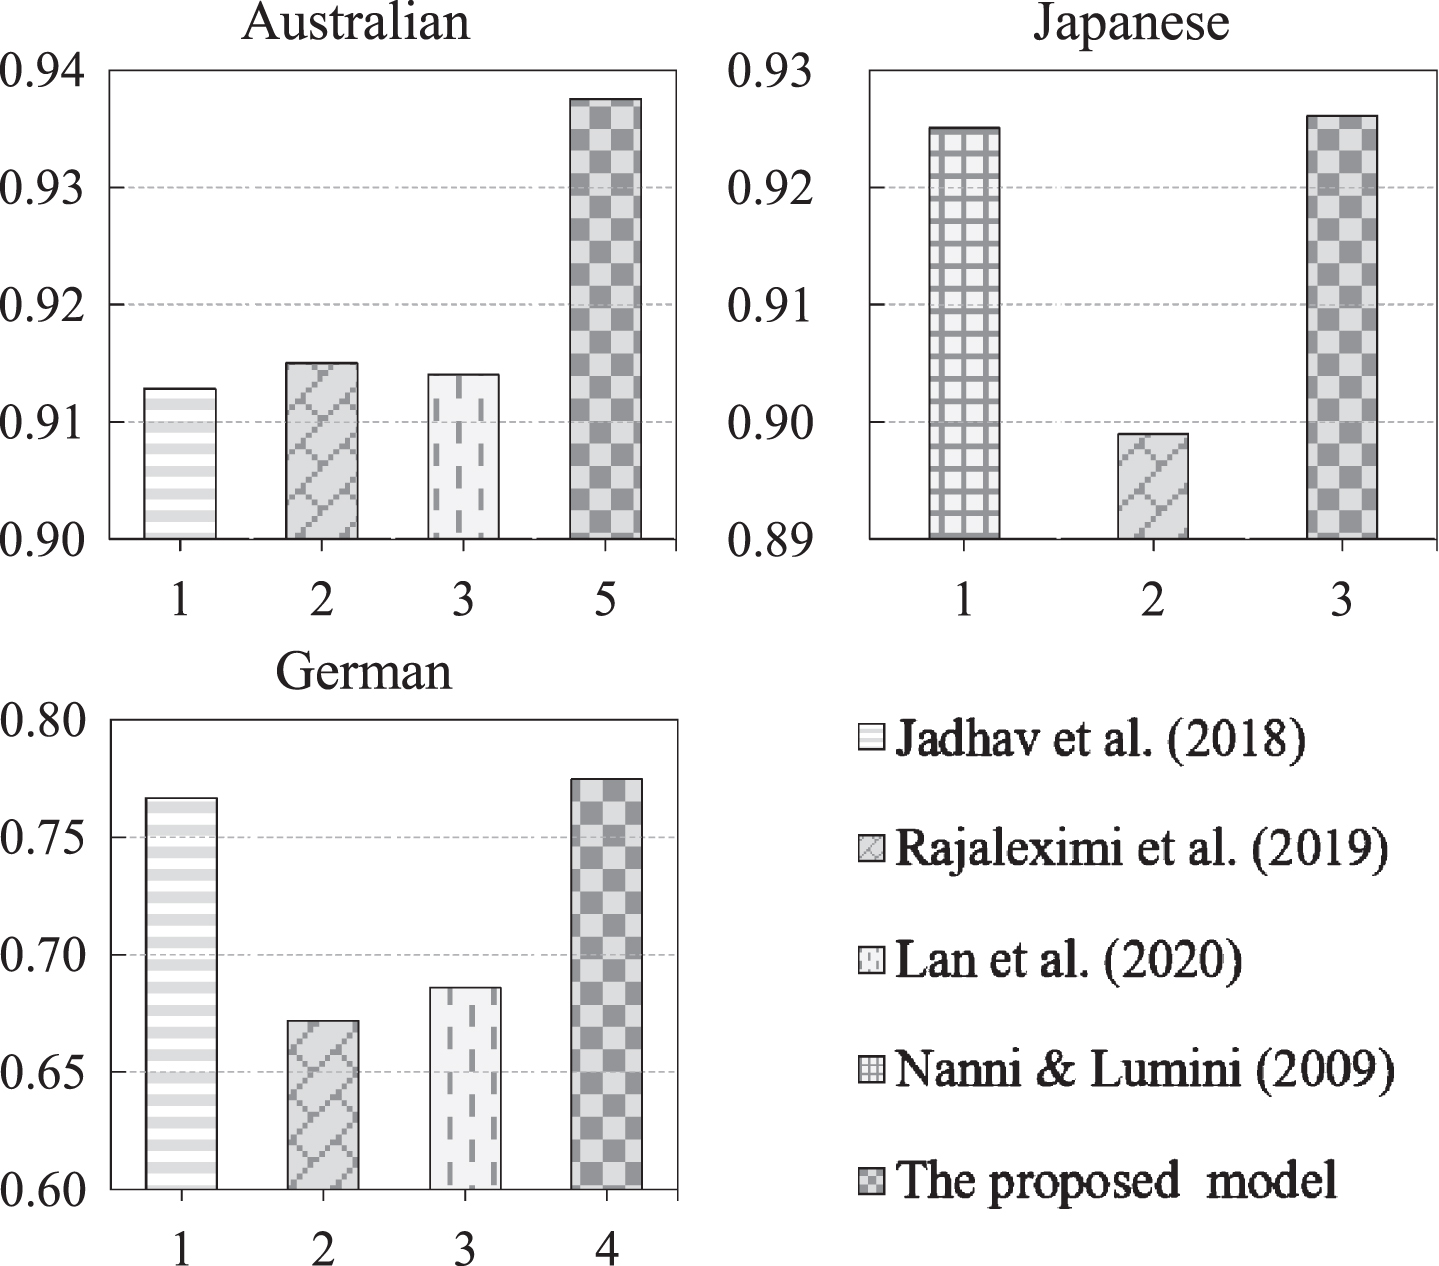
Comparison of AUC values of the proposed model and benchmark models on three datasets.
Credit scoring plays a crucial role in financial business development. In this study, a novel multi-stage ensemble model that integrates the MKBUS, SSM, and FES methods was proposed to achieve a superior classification performance for credit scoring. The proposed ensemble model was verified on four credit scoring datasets based on four comprehensive evaluation indicators. The experimental results demonstrated the superior performance of the proposed ensemble model over the four benchmark ensemble models.
However, this study has some limitations. For example, to reduce the computational complexity, the hyperparameters of the base classifiers were not sufficiently optimized. This can be performed in future studies. Additionally, various sampling algorithms can be combined through weighting to address the imbalanced data problem more comprehensively. Finally, the multi-label classification problem will also be considered in future studies, which can bring the research closer to the real world.
Supporting information
The raw data for this paper has uploaded to Figshare (https://doi.org/10.6084/m9.figshare.12928418.v2). The raw data are divided into four parts: the Australian credit dataset (Australian.csv), the German credit dataset (German.csv), the Japanese credit dataset (JapanData.csv), and AER dataset (AER.csv).
Conflicts of interest
The authors declare that there is no conflict of interest regarding the publication of this article.
Footnotes
Acknowledgments
This work was supported by the National Natural Science Foundation of China (No. 51875503, No. 51975512), Zhejiang Natural Science Foundation of China (No. LZ20E050001).