
Abstract
Due to the complexity and variety of textures on Strip steel, it is very difficult to detect defects on rigid surfaces. This paper proposes a metal surface defect classification method based on an improved bat algorithm to optimize BP neural network. First, this paper uses the Local Binary Pattern(LBP) algorithm to extract features from six types of defect images including inclusion, patches, crazing, pitted, rolled-in, and scratches, and build a feature sample library with the extracted feature values. Then, the WG-BA-BP network is used to classify the defect images with different characteristics. The weighted experience factor added by the network can control the flight speed of the bat according to the number of iterations and the change of the fitness function. And the gamma distribution is added in the process of calculating loudness, which enhances the local searchability. The BP network optimized by this method has higher accuracy. Finally, to verify the effectiveness of the method, this article introduces the five evaluation indicators of accuracy, precision, sensitivity, specificity, and F1 value under the multi-class model. To prove that this algorithm is more feasible and effective compared with other swarm intelligence algorithms. The best prediction performance of WG-BA-BP is 0.010905, and the accuracy rate can reach 0.9737.
Keywords
Introduction
The detection of defects on the surface of the steel plate is an important part of the manufacturing process [1–3], strip steel is prone to pitting inclusion, patches, crazing, scratches, and other problems during the production process [4–8]. Therefore, the detection of steel surface defects has received extensive attention from steel plate manufacturers.
Using image recognition technology can solve the problem of classification of steel plate defects, Image recognition and technology can be divided into two steps: image feature extraction and image classification [9]. For the feature extraction of metal surface defect detection, the texture feature of the image is usually selected [10]. In addition to texture features, the selection of image classifiers also has a great impact on image classification [11], The most widely used neural network is the BP neural network [12]. BP network is a feed-forward neural network, which uses error backpropagation and uses gradient descent to find the optimal value of the function. However, the BP network has the disadvantages of slow convergence speed, easy to fall into a local minimum, and poor generalization ability [13].
To improve the disadvantages of the BP network, many scholars have proposed improved algorithms. Yi Jiang proposed an attenuation parameter genetic algorithm to optimize the BP network to improve the convergence speed and accuracy [14]. Jiaoyan Ai et al. proposed a BP neural network optimized with an artificial bee colony algorithm to predict PM2.5 content and avoid the neural network from falling into the local optimum [15]. Ge Yaru et al. proposed a spark parallel optimization algorithm based on the improved BP neural network to achieve data-parallel classification [16]. Qinghua Liu et al. proposed an improved PSO optimization algorithm based on nonlinear weights to improve the BP network to solve the problem of target location [17]. Ren Heng et al. used the predictive momentum increase method to improve the BP neural network algorithm for the field test of roof stability classification, and the results showed that the classification results were consistent with the actual field [18]. Lu Wang et al. proposed a BP neural network based on momentum factors to study and establish an integrated classification model, and build a trusted target identification model based on this model. The results show that the model can improve the reliability of target recognition to a certain extent, thereby providing more security and credibility for the recognized target [19]. Qi Hao et al. proposed an analytical model based on BP natural network. By establishing a sleep classification model based on BP neural network, the correlation between various sleep indicators and diagnosis results was studied [20].
Professor Yang proposed a new heuristic algorithm-Bat Algorithm (BA) [21] in 2010. This algorithm is inspired by the behavior of bats preying on prey through echolocation. It is a new swarm intelligence algorithm based on iterative optimization. In terms of performance, it is superior to algorithms such as genetic algorithm (GA) and particle swarm optimization (PSO) [22–26] and has the characteristics of fast convergence and strong global search capabilities [27]. Therefore, the BA algorithm is widely used in industrial production, image processing, aerospace, and other aspects [28–30].
But the BA also has its limitations. It is prone to fall into local optimality and low convergence accuracy [31, 32]. To overcome the shortcomings of the bat algorithm, this paper proposes an improved bat algorithm (WG-BA) to train the weights and thresholds of the neural network. This method can overcome the shortcomings of the basic bat algorithm that it takes a long time to converge and is easy to fall into the local optimum. And then improve the accuracy of image classification, the main work of this paper is: A new type of inertial weight is applied to the basic bat algorithm. The WG-BA improves the global searchability in the early stage and adjusts the flight speed adaptively according to the fitness value. As the number of iterations increases, the speed of the bat’s flight becomes slower, and the local search ability is gradually enhanced, which better regulates the relationship between global search and local search. A new method for updating the loudness of the bat algorithm is proposed, which improves the searchability of WG-BA in the local search process. Combine the WG-BA with the BP network, and use the improved bat algorithm to train the weights and thresholds of the BP network. This method can improve the accuracy of the BP network in identifying metal surface defects.
The remaining part of the paper is organized as follows: Section 2 introduces the Local Binary Pattern (LBP) algorithm, the classic bat algorithm, and the BP neural network. Section 3 introduces the WG-BA algorithm proposed in this paper. Section 4 introduces the combination of the improved bat algorithm and the BP network, Section 5 introduces the experiment and data, Section 6 summarizes the work of this paper.
Theoretical basis
LBP algorithm
The LBP algorithm was proposed by T. Ojala et al. in 1994 [33, 34]. It is an algorithm used to describe image texture. It is widely used in image processing because of its robustness to light source changes.
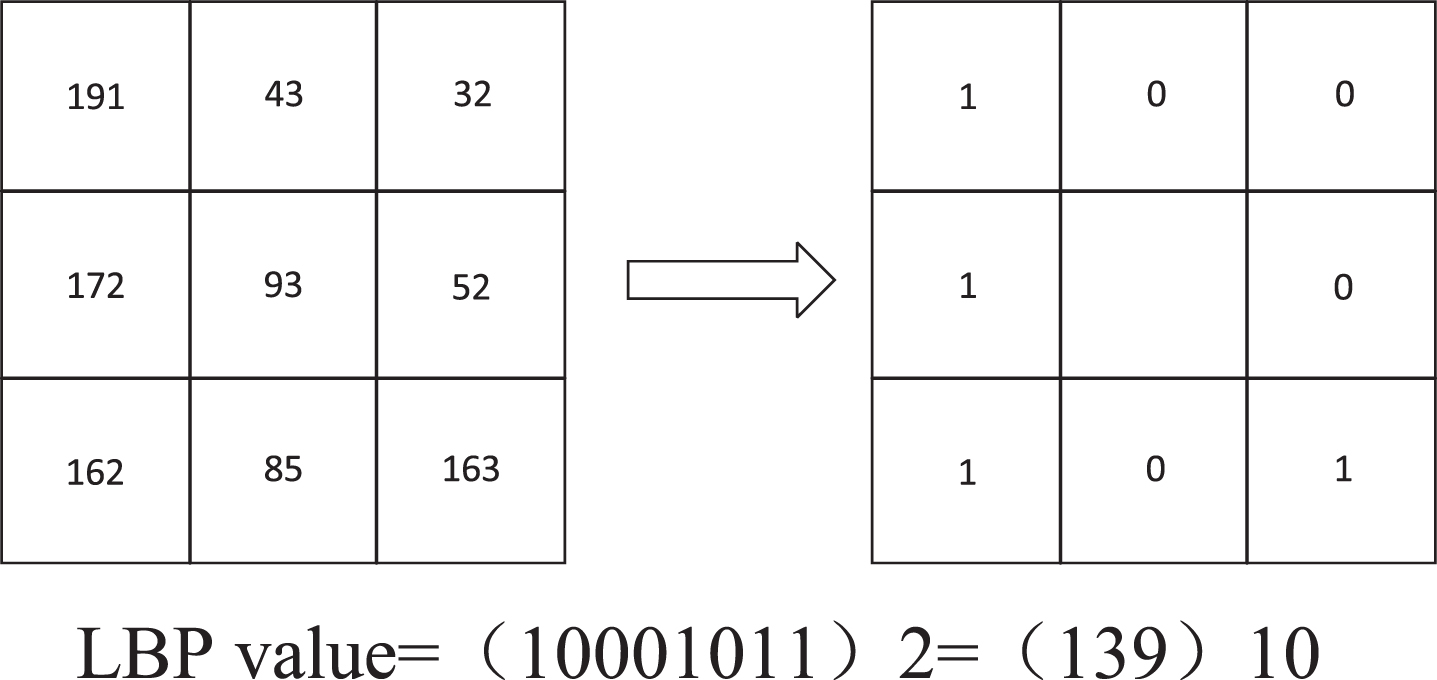
The LBP algorithm uses an area with a size of 3*3 as the calculation area. As shown in Fig. 1, the gray value of the center point is used as the threshold, and 8 areas in the neighborhood of the center point are binarized. The gray value area is marked as Fig. 1, and the gray value less than the center point is marked as 0. The LBP value of the center point represents the texture information of the surrounding pixels, finally, it is converted into a binary form to represent the feature value of the area and the integration. All feature values are used as texture features of the image, so this feature is also called the LBP feature [35].
LBP algorithm.
The BP network is a neural network proposed in 1986 for data forward propagation and error backpropagation. BP network is a multi-layer neural network composed of three or more layers. It can be divided into the input layer, hidden layer, and output layer. Each layer of neural network is composed of several neurons. Its basic idea is the gradient descent method is used to find the weight that minimizes the mean square error of the actual output and the expected output and then optimizes the network.
BP network, as a multi-layer feedforward network based on error backpropagation, generally has three or more network layers. Each layer consists of several neurons, and the neurons in adjacent layers are fully connected. Way to connect. BP network solves nonlinear problems through infinite approximation theory [36], as shown in Fig. 2. It is mainly divided into input layer, hidden layer, and output layer.

The structure diagram of the classic three-layer BP neural network.
The number of nodes in the input layer is consistent with the number of input features, and the number of nodes in the output layer is consistent with the number of classifications. The hidden layer is located between the input layer and the output layer. The number of nodes in the hidden layer has a great influence on the network training results [37]. The number of hidden layer nodes can be determined by an empirical formula. The empirical formula is as Eq. (1):
his the number of hidden layer nodes, m and n are the numbers of input layer and output layer nodes respectively, and a is a constant (1≤a1≤10). Suppose the weight between the network node i of the previous layer and the network node j of the next layer is ω
ij
. The threshold of node j in the hidden layer is b
j
, The output value of the previous layer node is x
i
, The activation function is f (x). The calculation method is as Eqs. (2), (3) and (4):
o j represents the output value of the transfer function of the output layer. ω sj represents the weight between the hidden layer and the input layer. a s is the threshold of the output layer.
The basic bat algorithm is a new heuristic algorithm proposed by Professor Yang in 2010. During the echolocation process of the bat algorithm, the following rules are mainly used: Every bat uses echolocation to perceive the distance to targets and obstacles. Each bat flies randomly at position Xi at speed Vi and has a fixed frequency. Besides, it can automatically adjust its wavelength and pulse loudness according to the distance from the target. Impulse loudness decreases from the initial maximum A0 to the minimum A
min
, The update method of the position Xi and velocity Vi of each generation of bats is as Eqs. (6), (7) and (8):
β is a random vector, β ∈ [0, 1], f i is the frequency emitted by the bat, f i ∈ [fmin, fmax]. The frequency is given to each bat should be evenly distributed. X* is the optimal solution of the position in the current group, and it is also the global optimal value.
The local search of the bat algorithm generates a local solution through a random walk method. The generation scheme for the new location is as Eq. (9):
ɛ is a random number, ɛ ∈ [-1, 1], A t is the average loudness of all bats of the same generation in the group.
The bat will continuously adjust the loudness and frequency of the pulses according to the position of the target. The closer the bat is to the target, the lower the loudness and the higher the frequency the bat emits, to quickly captures the target. The loudness of the bat i in the group
a and γ are constants, a is the loudness attenuation coefficient a ∈ (0, 1), γ is the frequency enhancement factor, γ > 0, When the position of the bat changes, the loudness, and frequency of the pulse are updated, and the bat moves to the best position.
Increase weight experience factor
To improve the performance of the bat algorithm, many scholars have proposed their improvement methods. M.R. Ramli proposed an inertial weight factor, which prevents the BA from falling into the local minimum of the multi-dimensional function by modifying the exploration size and providing the inertial weight [38]. Literature [39] proposed a hybrid bat algorithm with genetic crossover operation and intelligent inertial weights to solve the problem of selecting the best threshold in image segmentation. Literature [40] uses chaotic sequences and developed population diversity metrics to perform local searches and generate an improved initial population respectively, trying to control randomly flying bats. This function helps the proposed BA to find the best parameters. Although these algorithms have certain advantages over the original algorithms, because the basic bat algorithm only relies on the global optimal position to update the speed, it is easy to fall into the local optimal situation during the bat search process. This paper proposes a way to add two new gravitations to the velocity update formula. The calculation method of the weight experience factor is as Eqs. (12) and (13):
ω max is the maximum weight empirical factor, ω min is the minimum weight empirical factor, t is the number of iterations, fmax is the best fitness value, fmin is the worst fitness value, τ and φ are constant, 0 < τ < 1, 0 < φ < 1.
Eqs. (12) and (13) retain the advantages of the linear decline of the classic bat algorithm, and at the same time, it can calculate a new position based on the number of iterations and changes in the fitness function. This makes the WG-BA algorithm have a good global optimization performance in the initial stage of calculation, it can avoid falling into the local optimum and avoid too fast convergence. The local optimization performance is strengthened in the late iteration. This method plays an important role in improving the solution quality of the algorithm and speeding up the optimization speed.
If the random variable x is the time required for the occurrence of the event a, then the density function is as Eq. (14):
The mean, variance, and characteristic function are as Eqs. (15), (16) and (17):
α is called the shape parameter, β is called the inverse scale parameter.
In the basic BA, as the number of iterations is superimposed and the loudness decreases, the number of bats for global search will increase, and the number of bats for local search will decrease. The ratio of a global search to local search of each generation of bat algorithm is a problem of probability, the basic bat algorithm updates the loudness through Eq. (10). This paper proposes to introduce the gamma function into the loudness update formula [41], so that bats can adjust the changes in loudness with the increase of iterations, and find the target in bats. Initially enhance the local searchability, and reduce the local search ability after finding the target. The new loudness update formula is as Eq. (18):
The WG-BA-BP network uses the weights and thresholds of the BP network as the position vector of the WG-BA. Each bat is equivalent to each node of the network, and the position of each bat represents the weight or threshold in the network. Set three input layer, hidden layer, and output layer of a layered neural network have m, n, and q neurons, respectively, and the position vector represented by the bat i is calculated as Eq. (19):
x
i
represents the position of the bat, d = nq + qm + q + m, w
ij
(i = 1, 2 ⋯ n, j = 1, 2 ⋯ q) represents the weight of the connection between the input layer and the hidden layer, w
jk
(j = 1, 2 ⋯ q; k = 1, 2 ⋯ m) represents the weight of the connection between the input layer and the hidden layer, θ
j
and θ
k
represents the threshold of each layer, The fitness function of training the weight and threshold of the BP network using the position of the bat is as Eq. (20):
n represents the number of learned features, O ih represents the actual output of the bat i under this network, T ih represents the expected output of the bat i under this network. Each time a bat in the population updates a position, the weight and threshold of the network will be updated once to achieve the effect of optimizing the weight and threshold of the network with the improved bat algorithm.
The flow chart of WG-BA-BP is as Fig. 3:

Flowchart of WG-BA.
Algorithm steps Perform LBP processing on the original image, extract the feature vectors of inclusion, patches, crazing, pitted, rolled-in, scratches, and input the network. Initialize the network, set the number of layers of the network and the number of nodes in each layer of the network. Assign values to the initial parameters of WG-BA, including initial position, speed, loudness, frequency, the maximum number of iterations. Calculate the weight experience factor. The bat uses Eq. (8) and Eq. (12) to move, and update the loudness and pulse rate. Record the global optimal position and the local optimal position of the current population, and update the speed using the formula. According to the formula, the letter position of the population of bats is obtained as The optimal solution Determine whether the maximum number of iterations is reached and if so, output the result. If not, go back to step (4).
Operating environment CPU Intel Core i7-8700 @ 3.20 GHz memory is 16 G, the program is written and run using MATLAB-2016a.
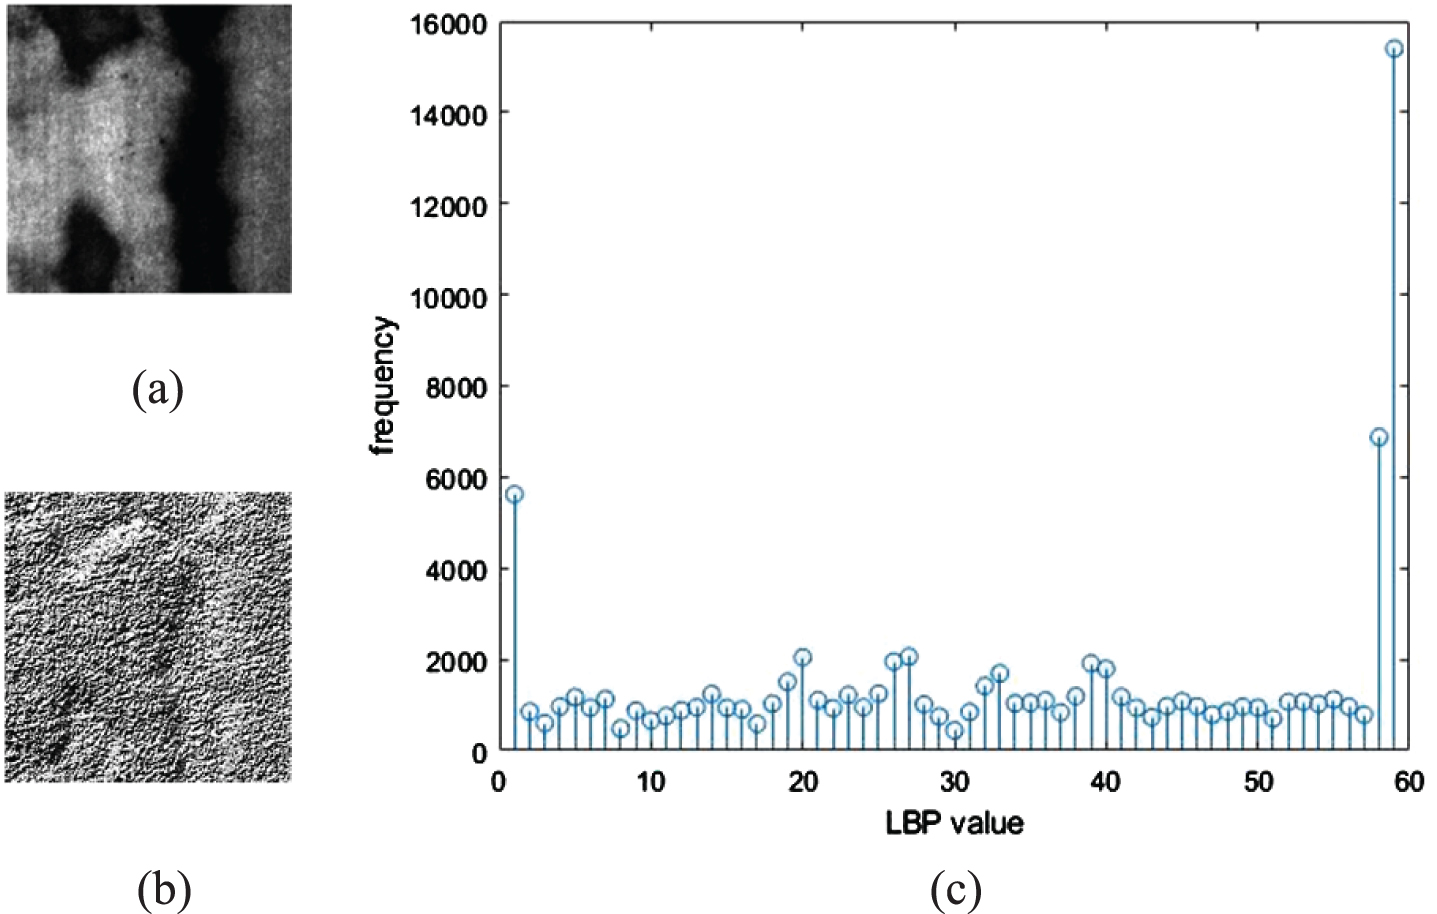
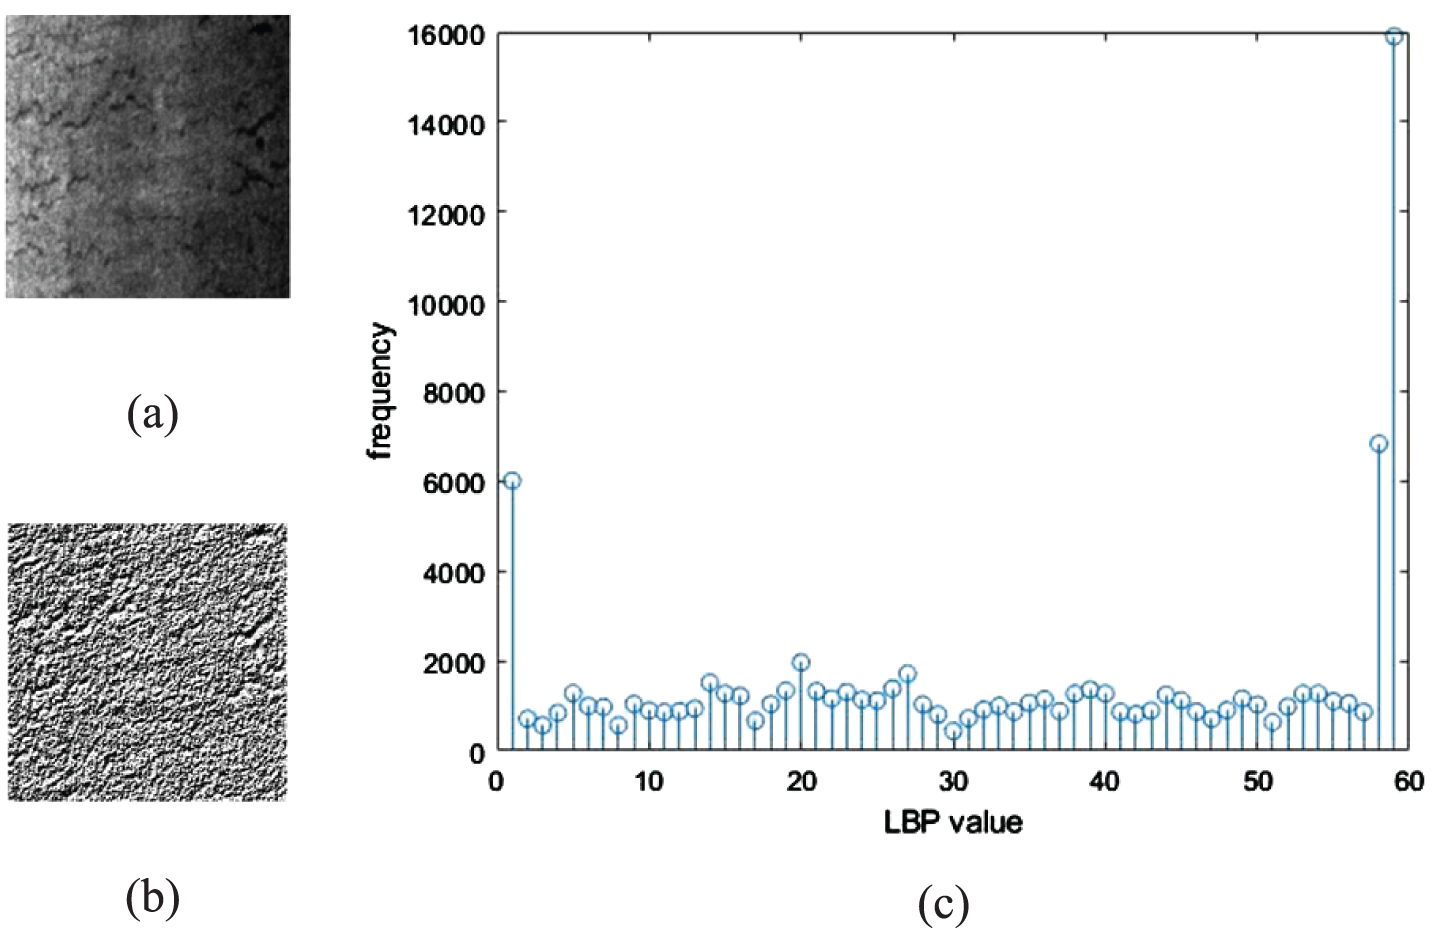
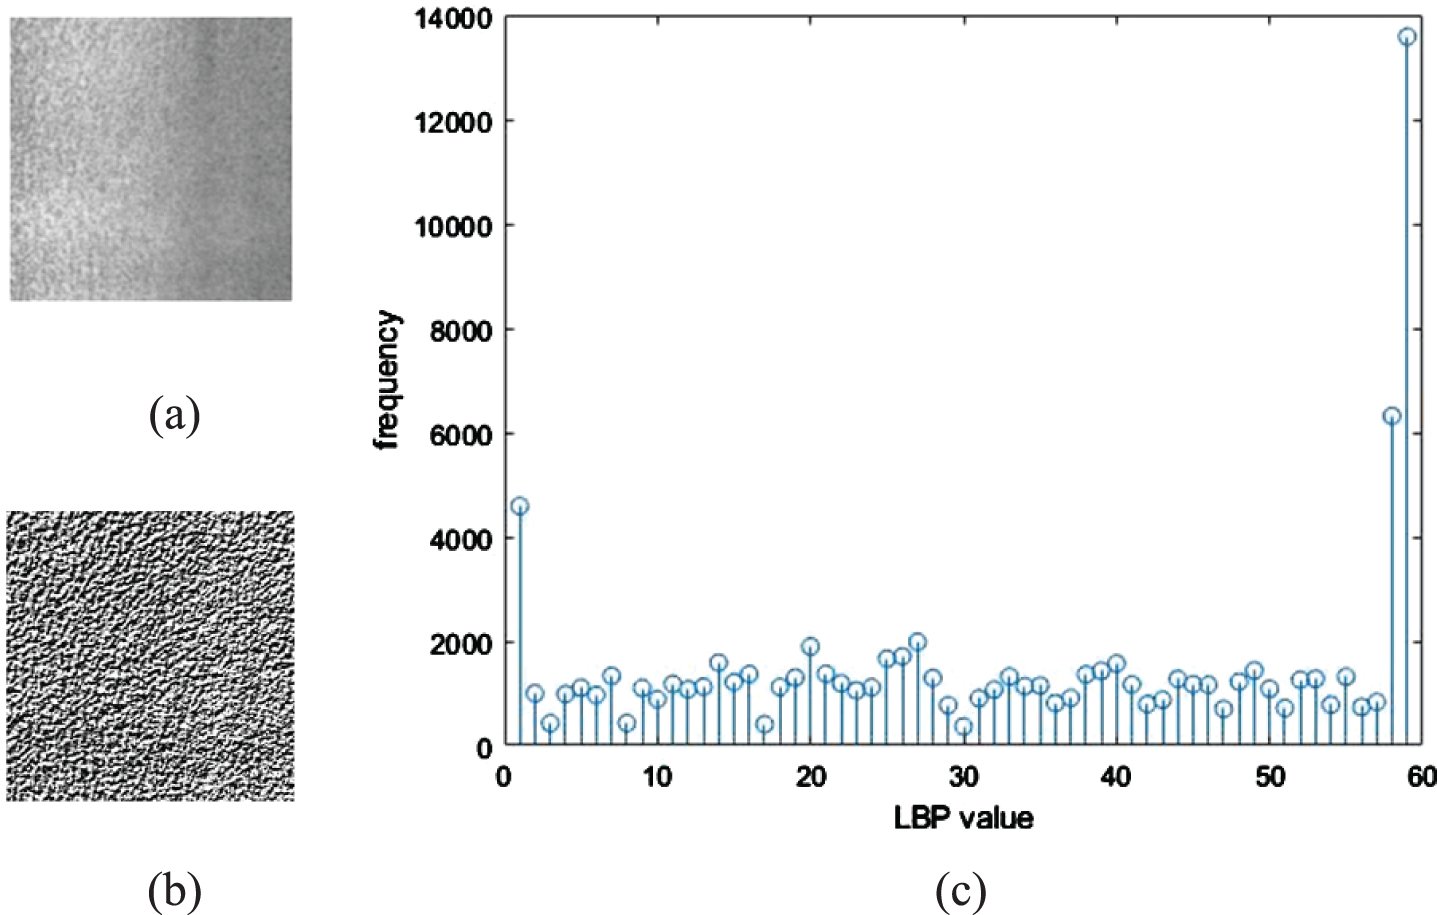
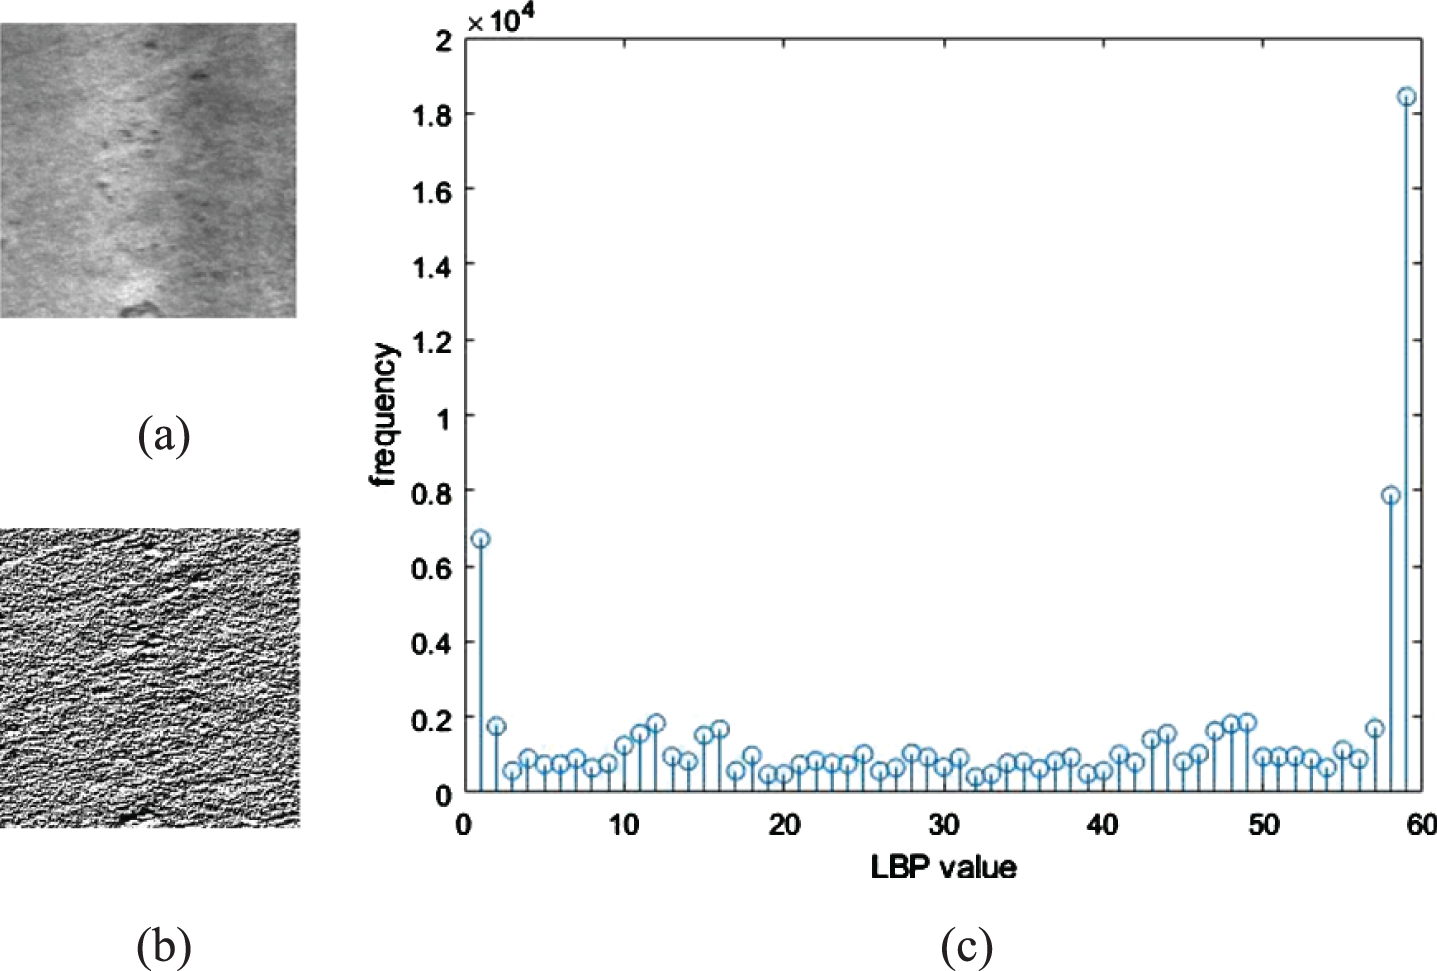
This paper selects the NEU-CLS metal surface defect database released by Northeastern University as the data set of this article. The database contains six metal surface defects, namely inclusion, patches, crazing, pitched, rolled-in, and scratches. Each type of defect has 300 pictures. The texture image and LBP histogram obtained after LBP calculation on 6 types of images are shown in Figs. 4–9, (a) is the original image of the defect image, (b) is the LBP image (c) is the histogram of LBP distribution.

LBP processing diagram of inclusion.
LBP processing diagram of patches.
LBP processing diagram of crazing.
LBP processing diagram of pitted.
LBP processing diagram of rolled-in.
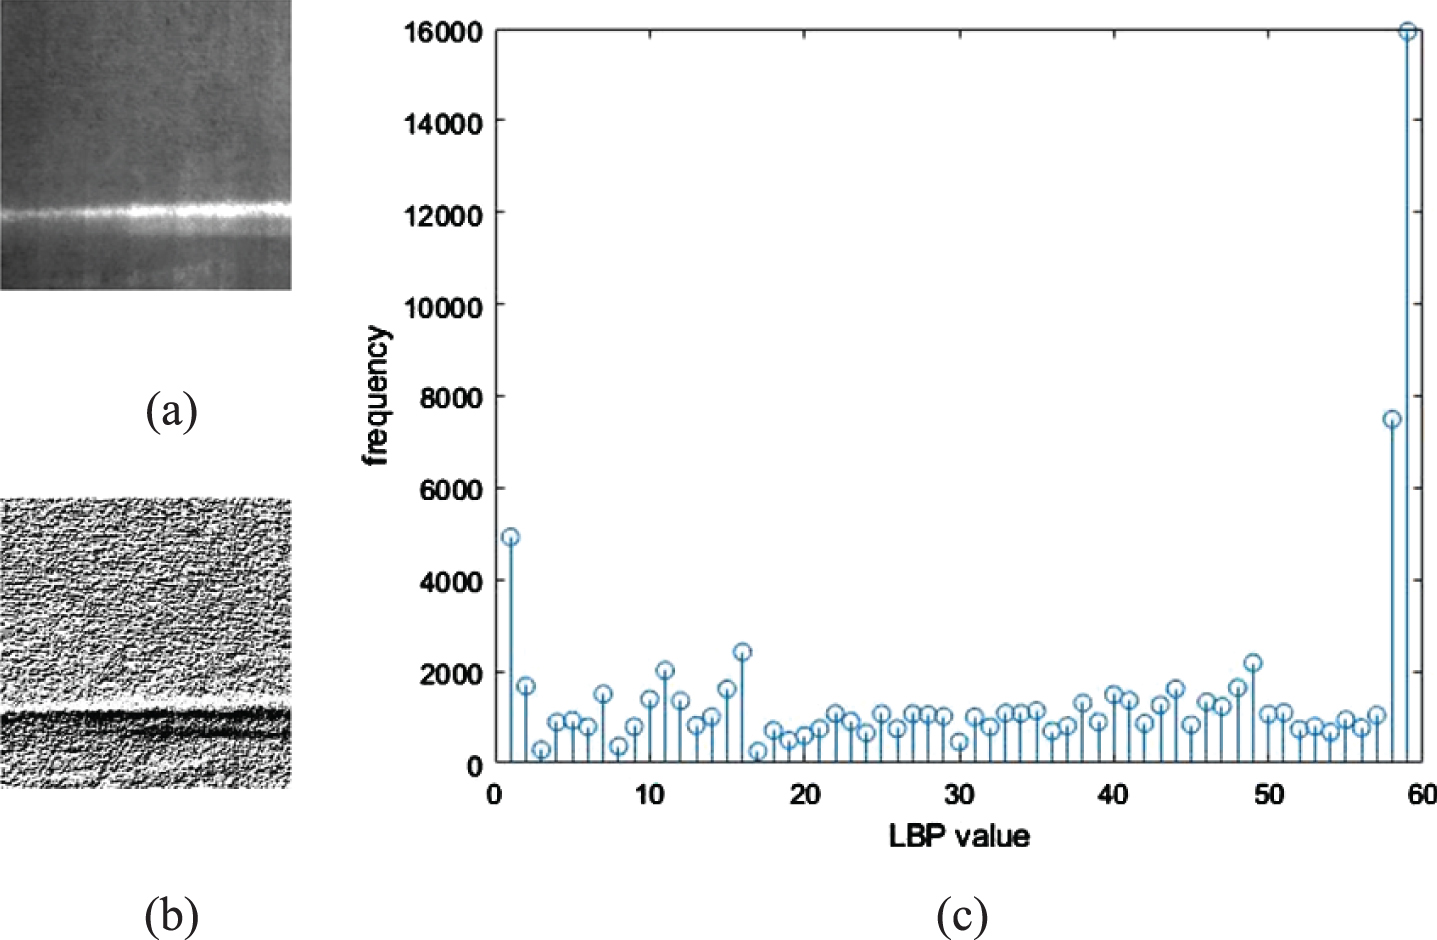
LBP processing diagram of scratches.
Figures 4–9 shows that different defect types correspond to different LBP statistical results. This is due to the irregular flaws and textures of nearby areas formed in the production process of the workpiece. There are obvious differences in gray levels. The graph counts the difference between different defects and organizes the LBP histogram into feature vectors as the input of the BP network for training.
This paper evaluates the classification level of WG-BA-BP through accuracy, precision, sensitivity, specificity, and F1 value. Figure 10 shows the confusion matrix of the actual category and the predicted category.
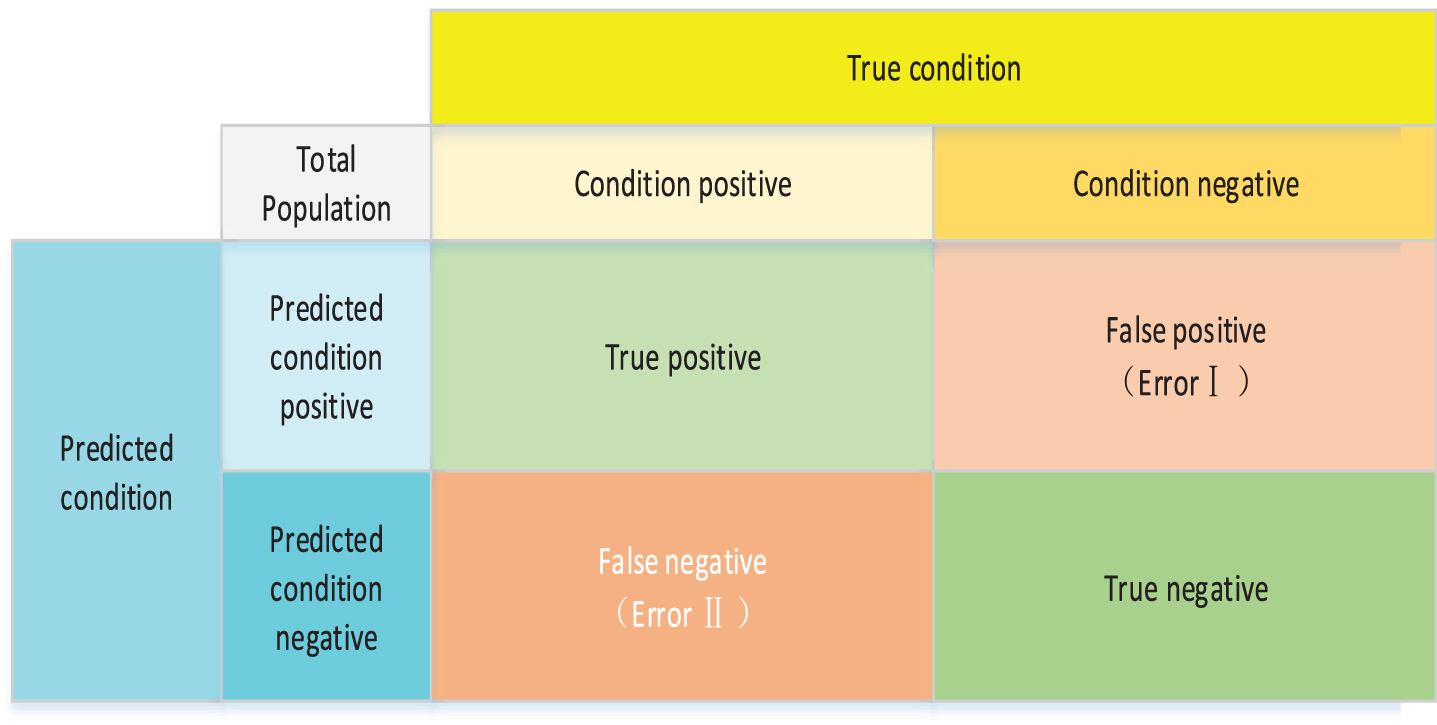
Confusion matrix.
Accuracy is the ratio of the number of correctly divided samples to the total number of samples. It represents the classification accuracy of the model for all samples. The accuracy calculation method is as Eq. (21):
Precision is the proportion of the positive data predicted to be correct to the positive data predicted. Precision focuses on the accuracy of the model when the predicted result is true and represents the credibility of the model when the predicted result is true. The precision calculation method is as Eq. (22):
Recall is the proportion of positive data predicted to be correct to the actual positive data. Recall rate represents the proportion of all positive classes in the Label that are predicted to be positive. It measures the model’s ability to extract actual positive classes. The recall calculation method is as Eq. (23):
F1 score is the harmonic average of precision and recall. F1-score is equivalent to a comprehensive level of the model in terms of Precision and Recall. The F1 score calculation method is as Eq. (24):
TP: True Positive, predict the positive class as positive; FP: False Positive, predict the negative class as positive; TN: True Negative, predict the negative class as negative; FN: False Negative, predict the positive class as negative Class; P is the Precision, R is Recall.
This paper introduces several well-known optimization algorithms. Table 1 introduces the parameter values of GA, PSO, sparrow search algorithm (SSA), and BA.
Parameter values for the chosen optimization algorithms
This paper introduces several well-known optimization algorithms. Table 1 introduces the parameter values of GA, PSO, SSA, and BA.
Table 2 shows the best fitness value, average fitness value, and standard deviation value of the BP network optimized by each group of intelligent algorithms. The results show that WG-BA has better development capabilities than other algorithms and is more stable than other algorithms.
Comparison of fitness values of different algorithms
Figure 11 shows the convergence curves of GA, PSO, SSA, BA, and WG-BA. Compared with other algorithms, WG-BA requires fewer iterations to reach the optimal value. In terms of convergence speed, WG-BA is better than GA, PSO, SSA, BA. And WG-BA and BA have similar convergence curves, it shows that WG-BA will not change the search mode of BA. WG-BA still has the search advantage of the original BA.
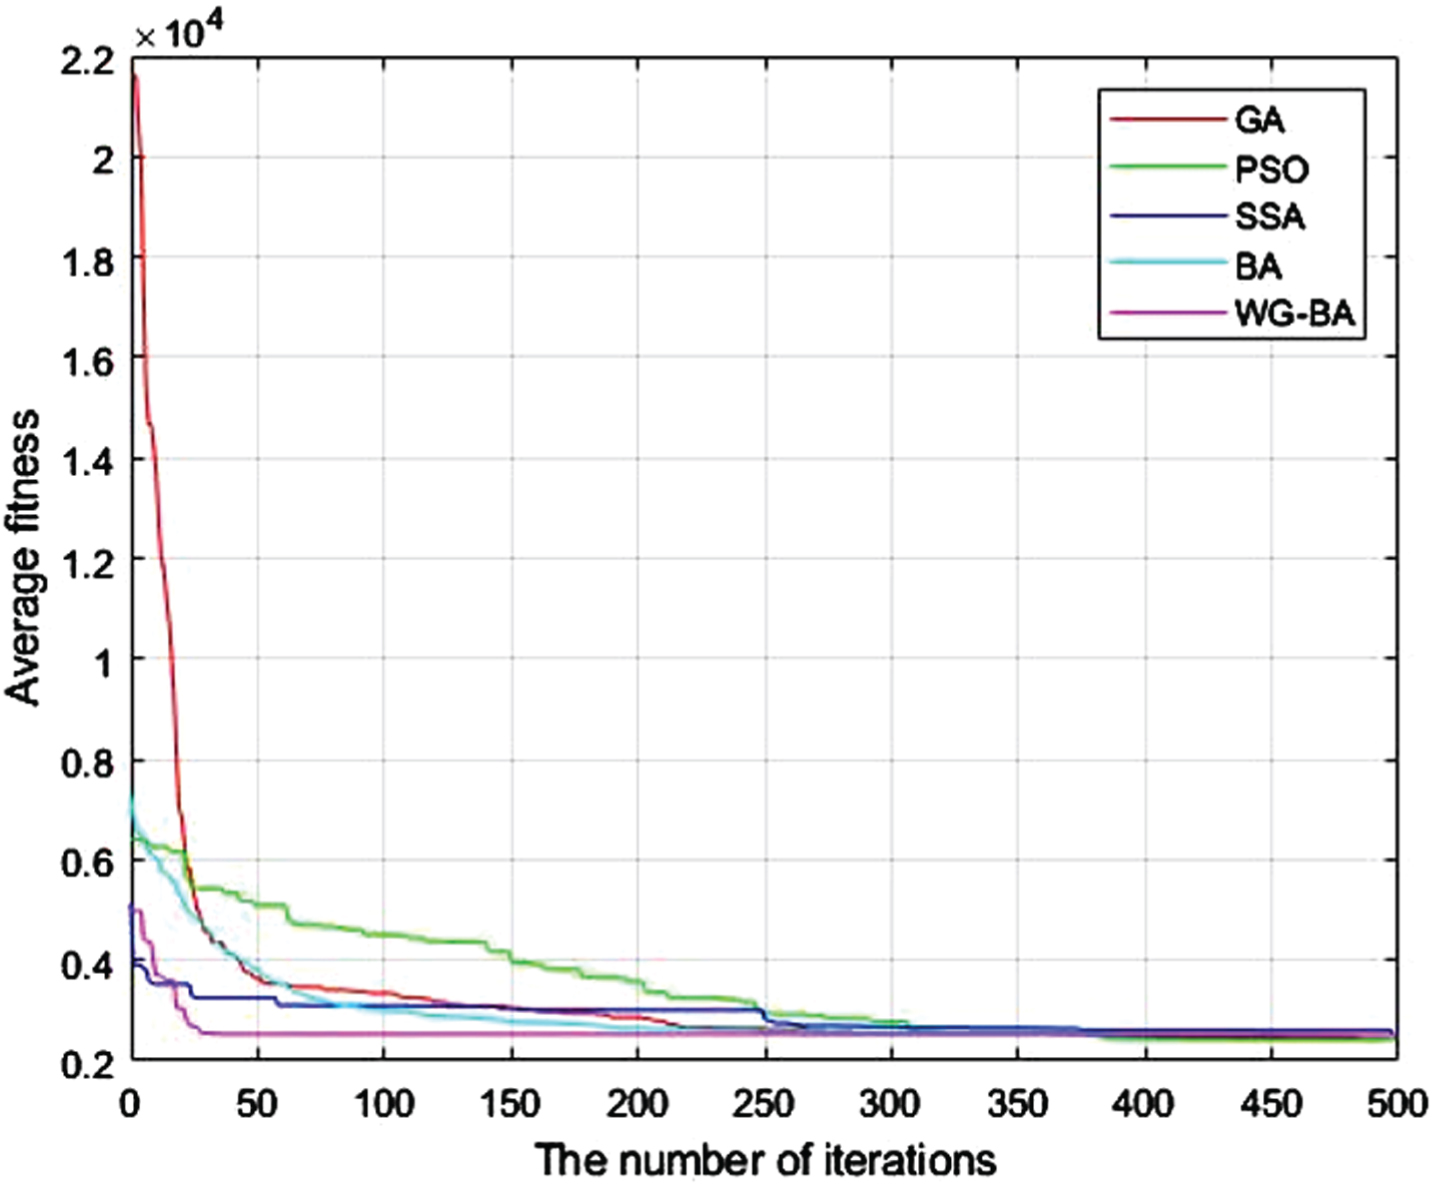
Convergence curve.
Figure 12 shows the relationship between the number of iterations obtained by training five types of defect images and the test error of the BP, GA-BP, PSO-BP, SSA-BP, BA-BP, and WG-BA-BP network. The results show that WG-BA-BP needs 8 iterations Reach the minimum error.
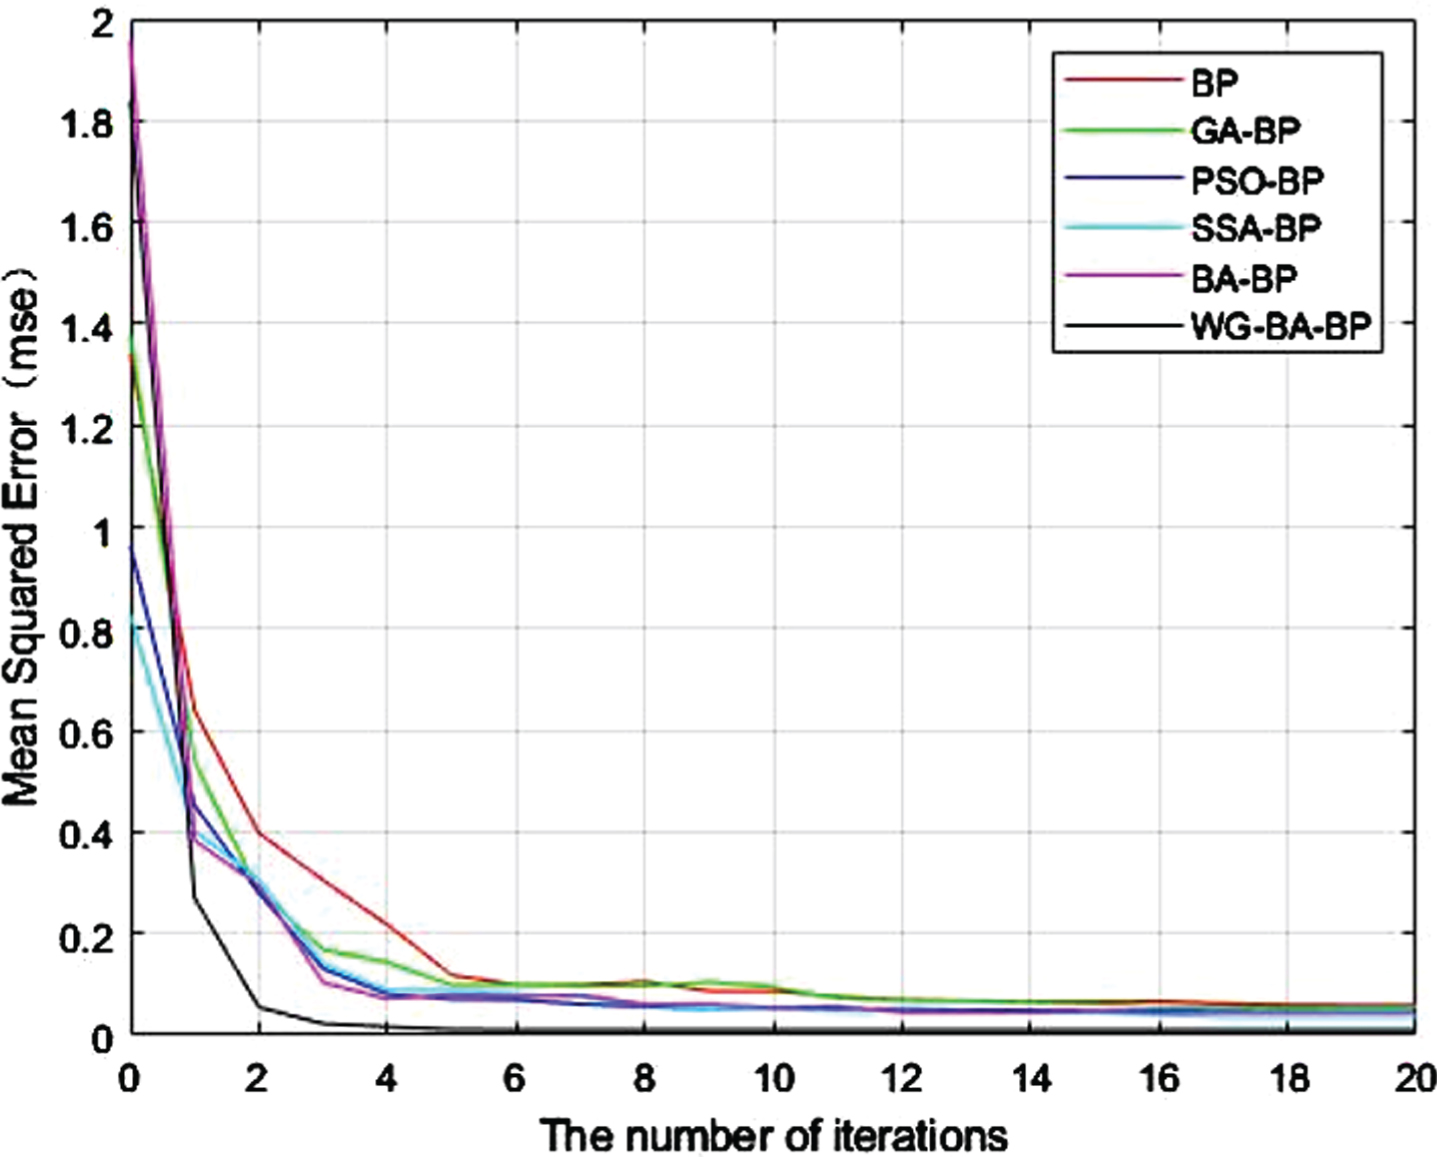
WG-BA-BP test results.
It can be seen that WG-BA-BP iterated 8 times to reach the preset convergence standard. The error size is 0.010905, which shows that WG-BA-BP can perform image classification.
Figure 13 shows the confusion matrix of six defects predicted by WG-BA-BP.
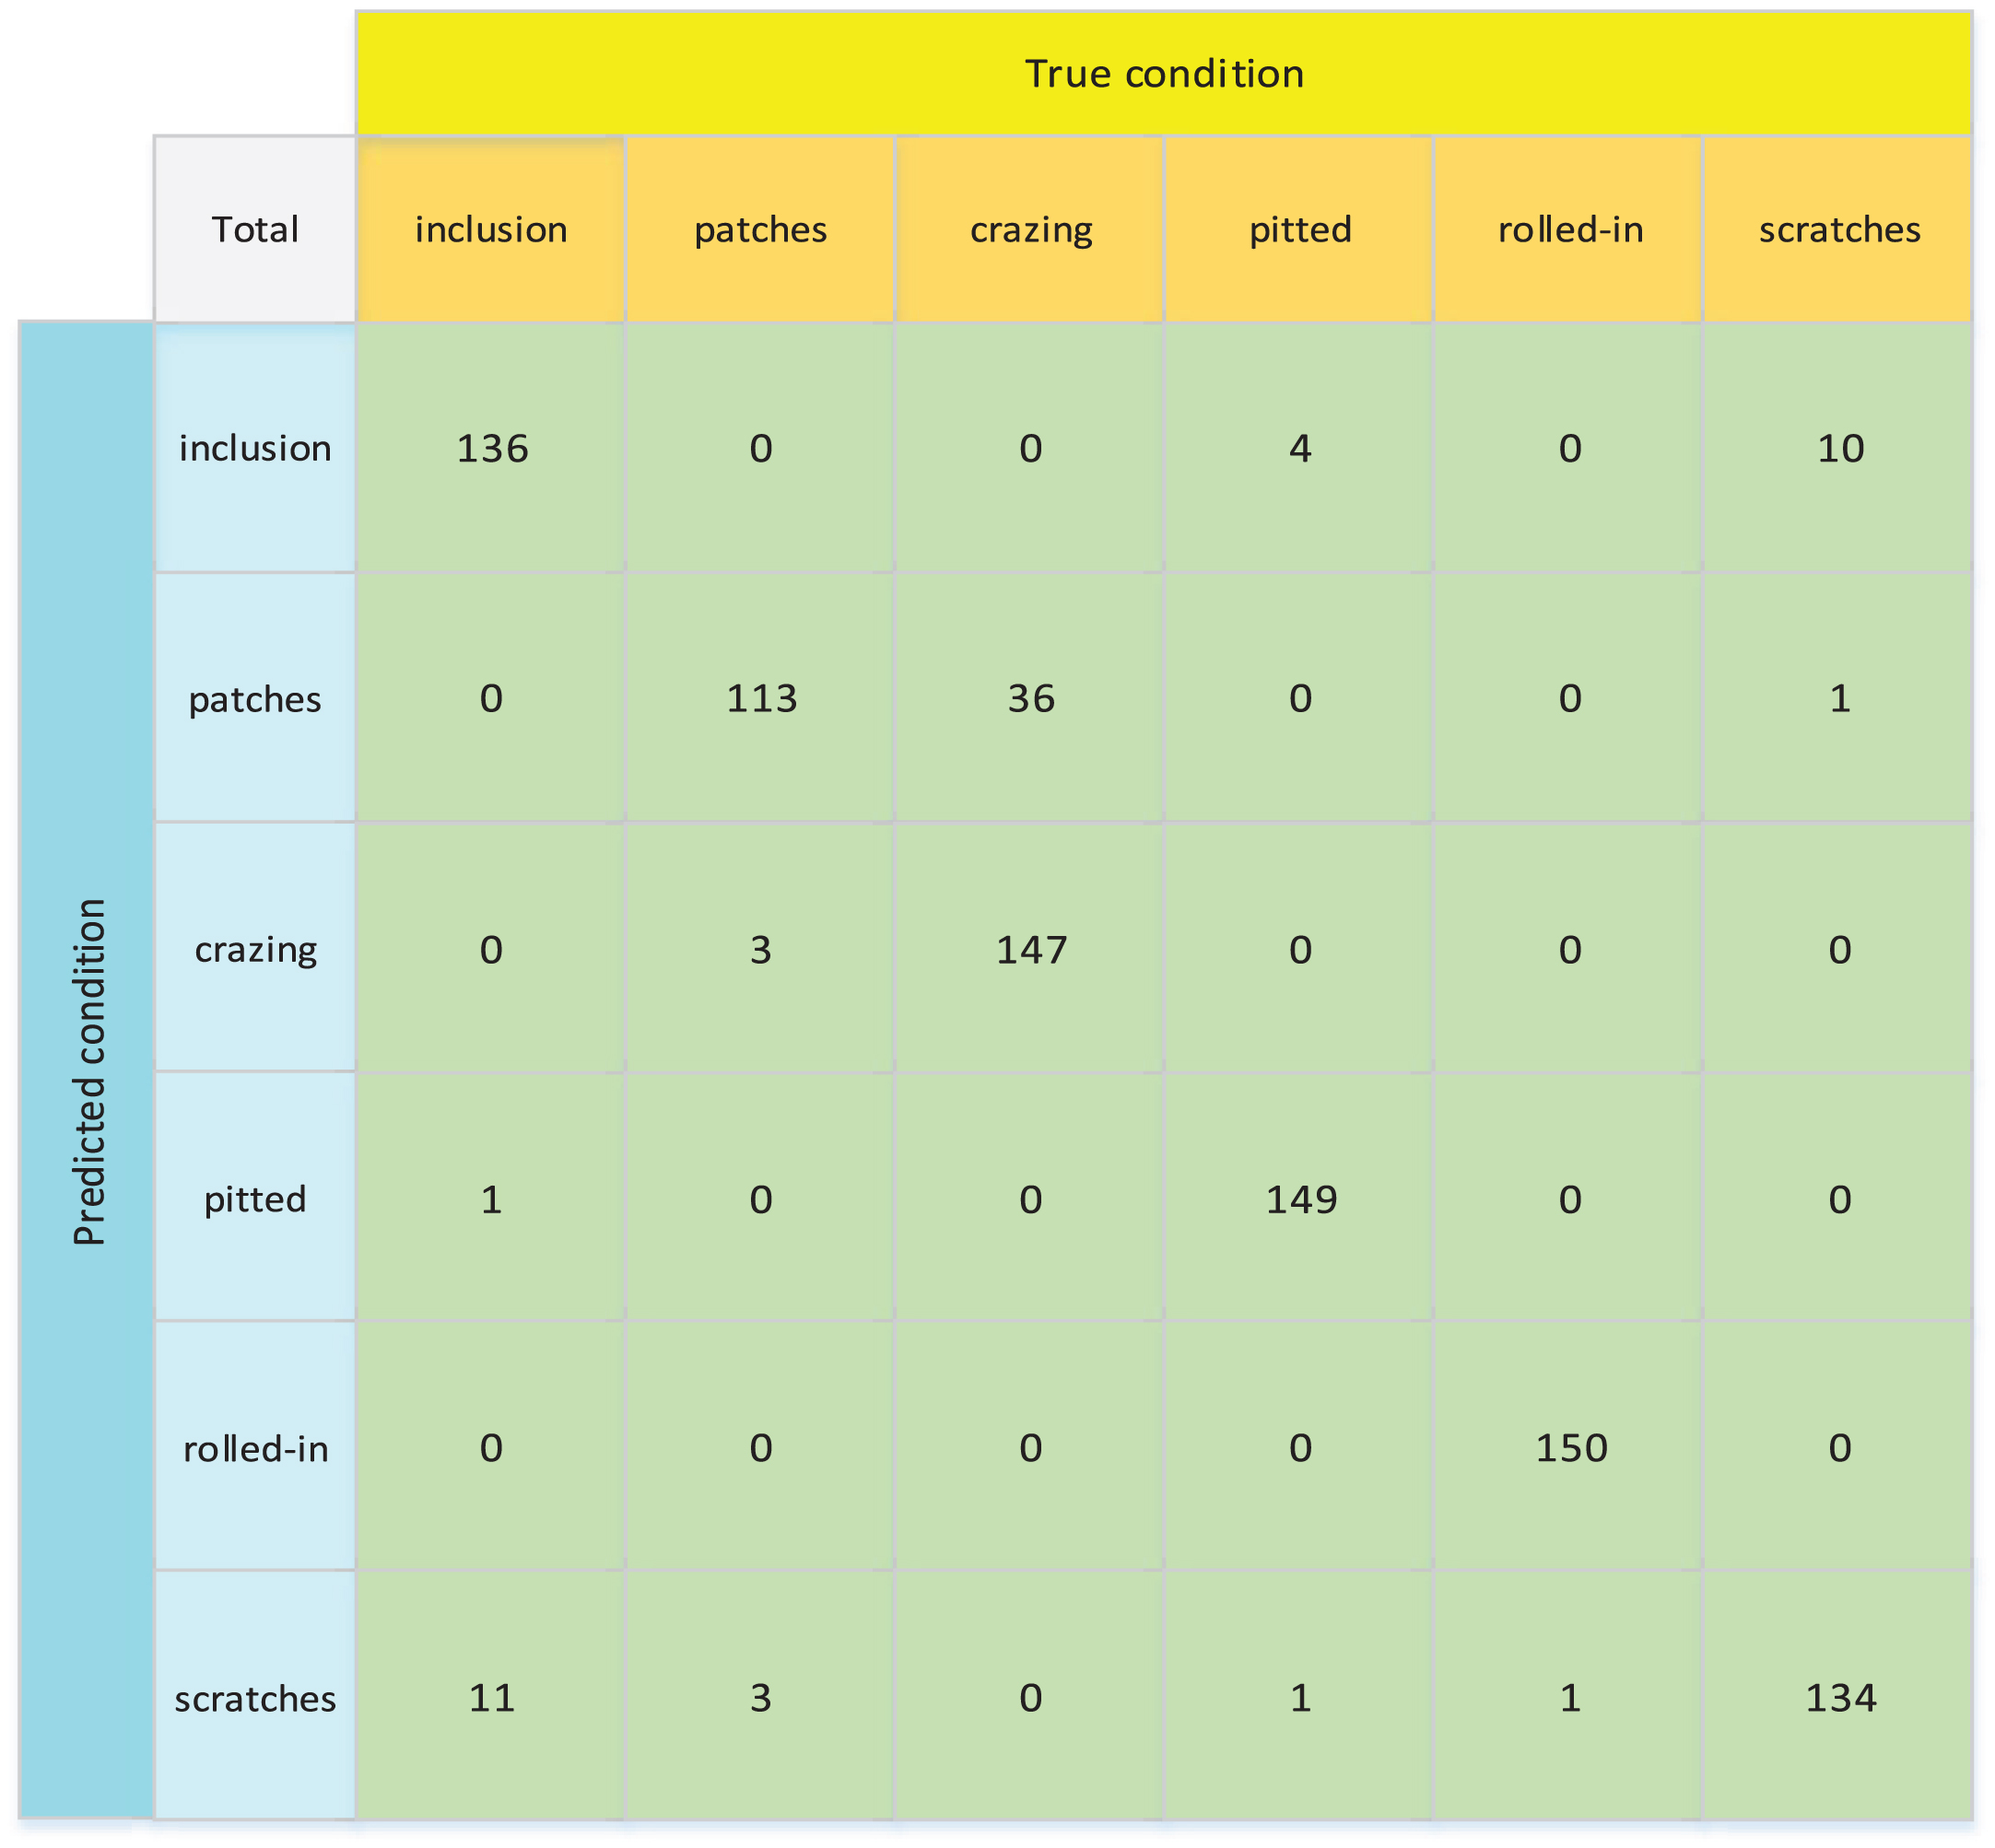
Confusion matrix of six defects.
Table 3 shows the accuracy, precision, sensitivity, specificity, F1 value of BP network, GA-BP network, PSO-BP network, SSA-BP network, BA-BP network, WG-BP network in 6 defect classification.
Accuracy, precision, sensitivity, specificity, F1 value of different networks
Table 3 shows that the accuracy, precision, sensitivity, specificity, and F1 value of WG-BA-BP compared with other algorithms are increased by 2.52% –5%, 3.57% –5.32%, 3.89% –6.33%, 0.8% –1.26, respectively %, 3.92% –6.66%. WG-BA-BP is superior to the BP network optimized by other swarm intelligence algorithms in terms of accuracy, precision, sensitivity, specificity, and F1 value in the classification of metal surface defects. To clearly express the difference in the classification effect of different algorithms on the BP network, this paper draws the five indicators of BP network, GA-BP network, PSO-BP network, SSA-BP network, BA-BP network, WG-BA-BP network as a line chart, Figs. 14–20 is shown below.
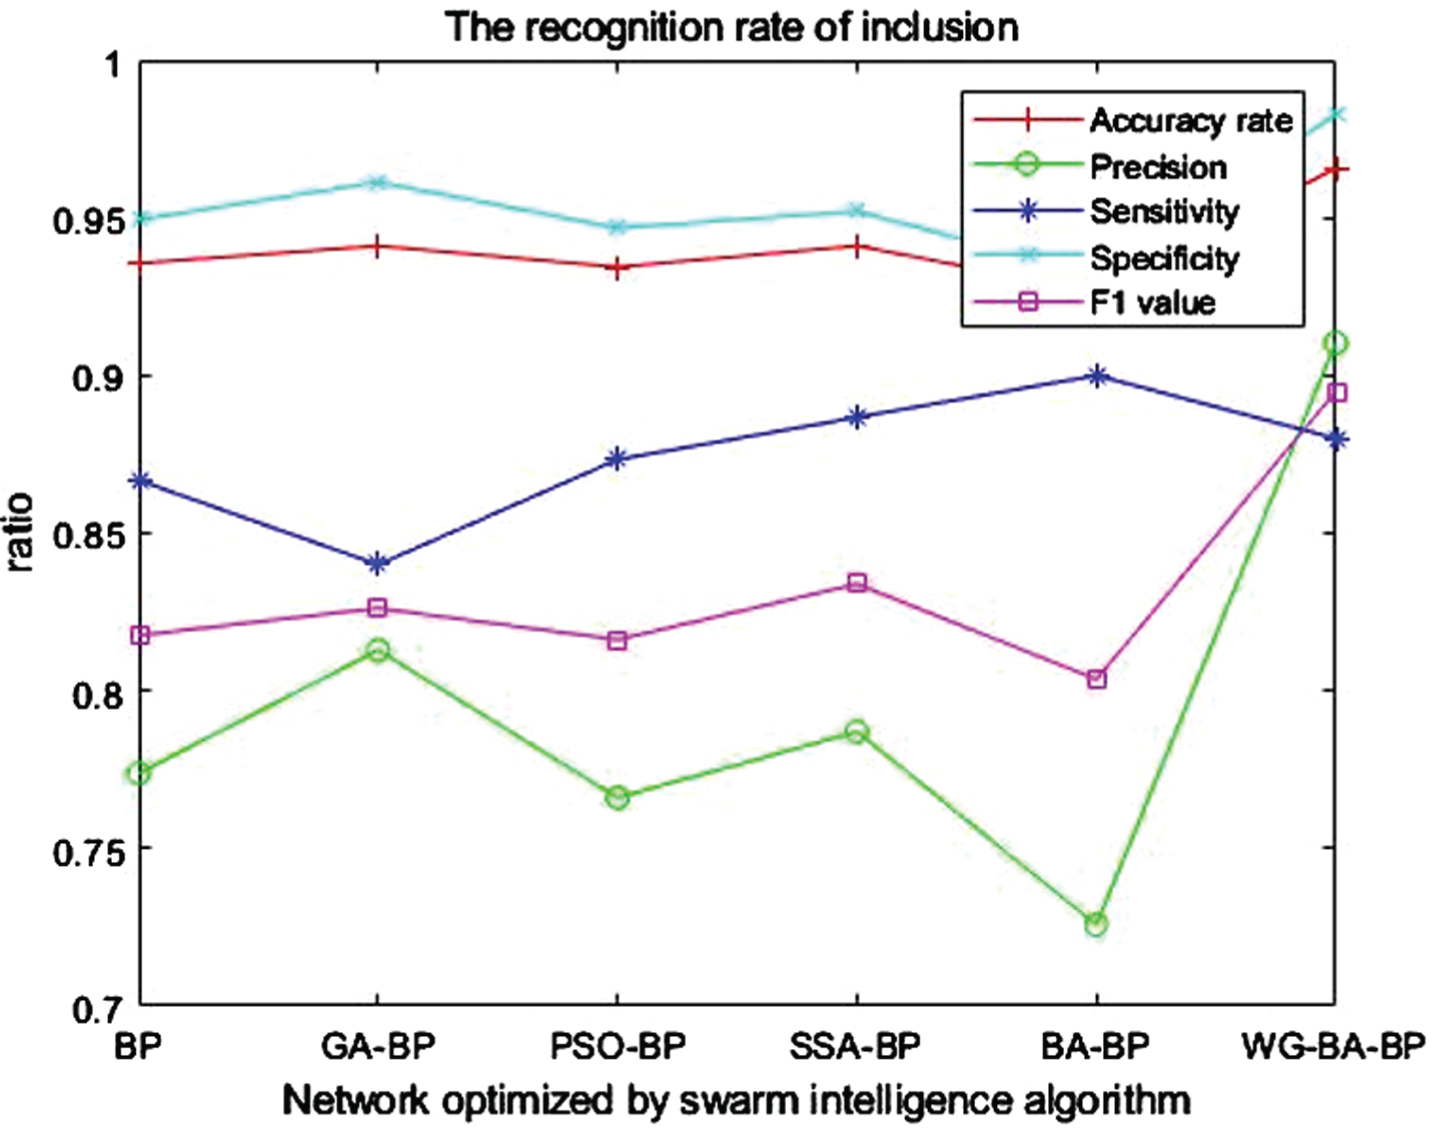
The recognition rate of inclusion.
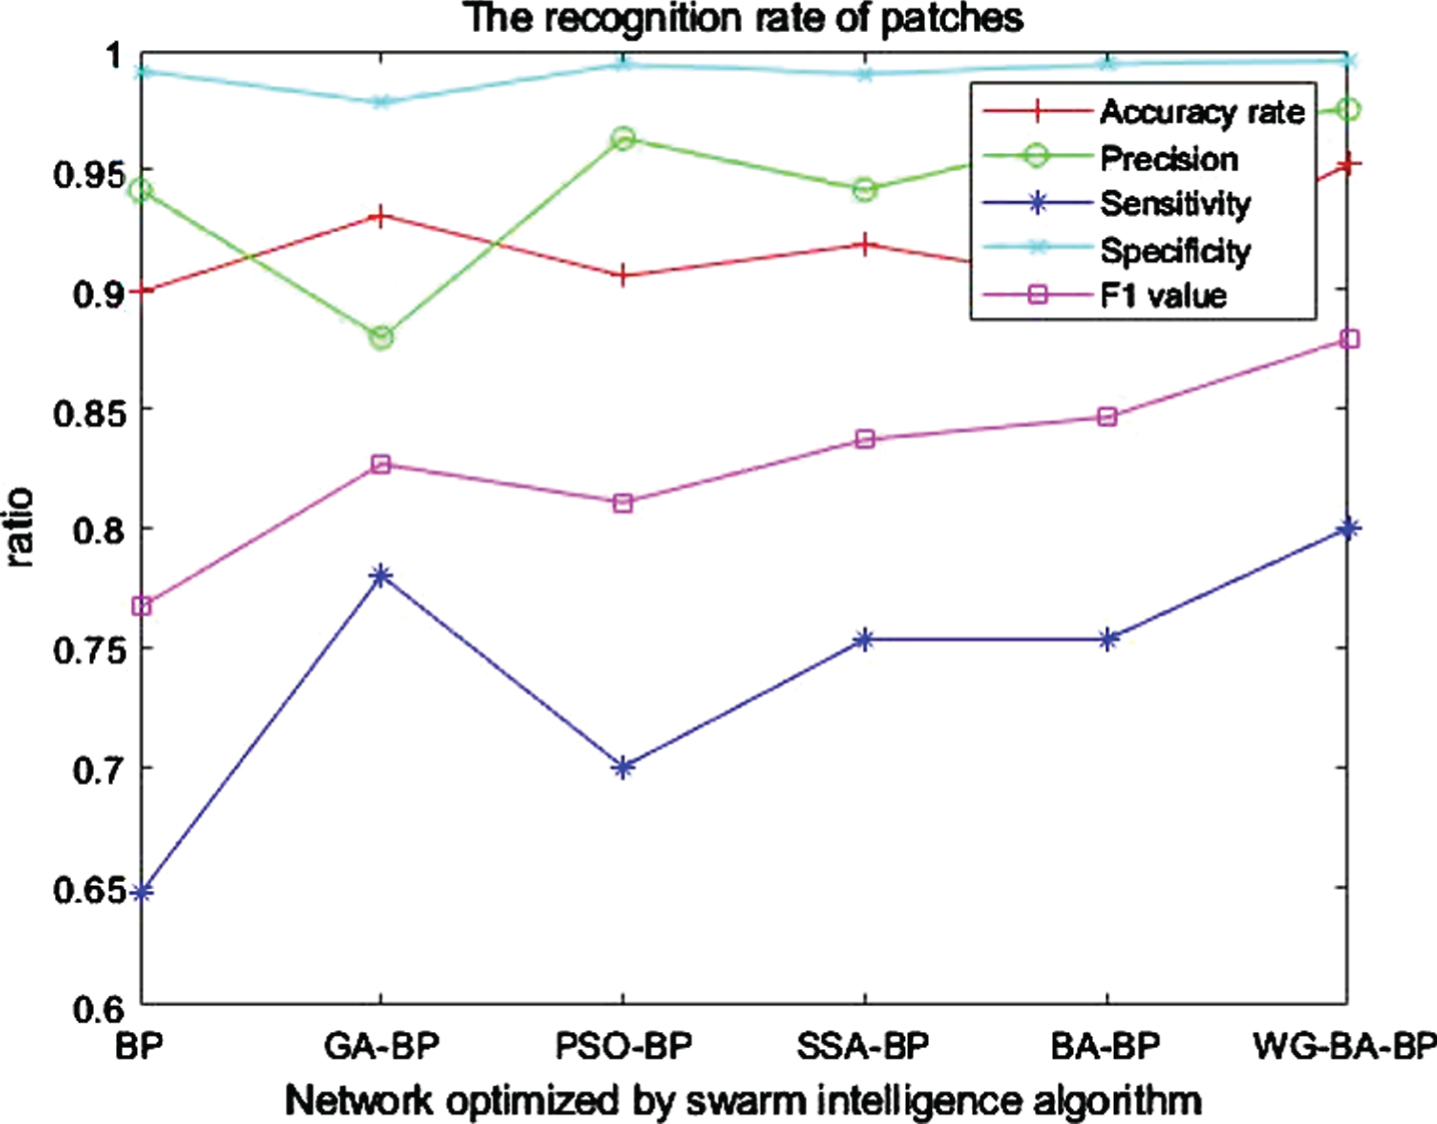
The recognition rate of patches.
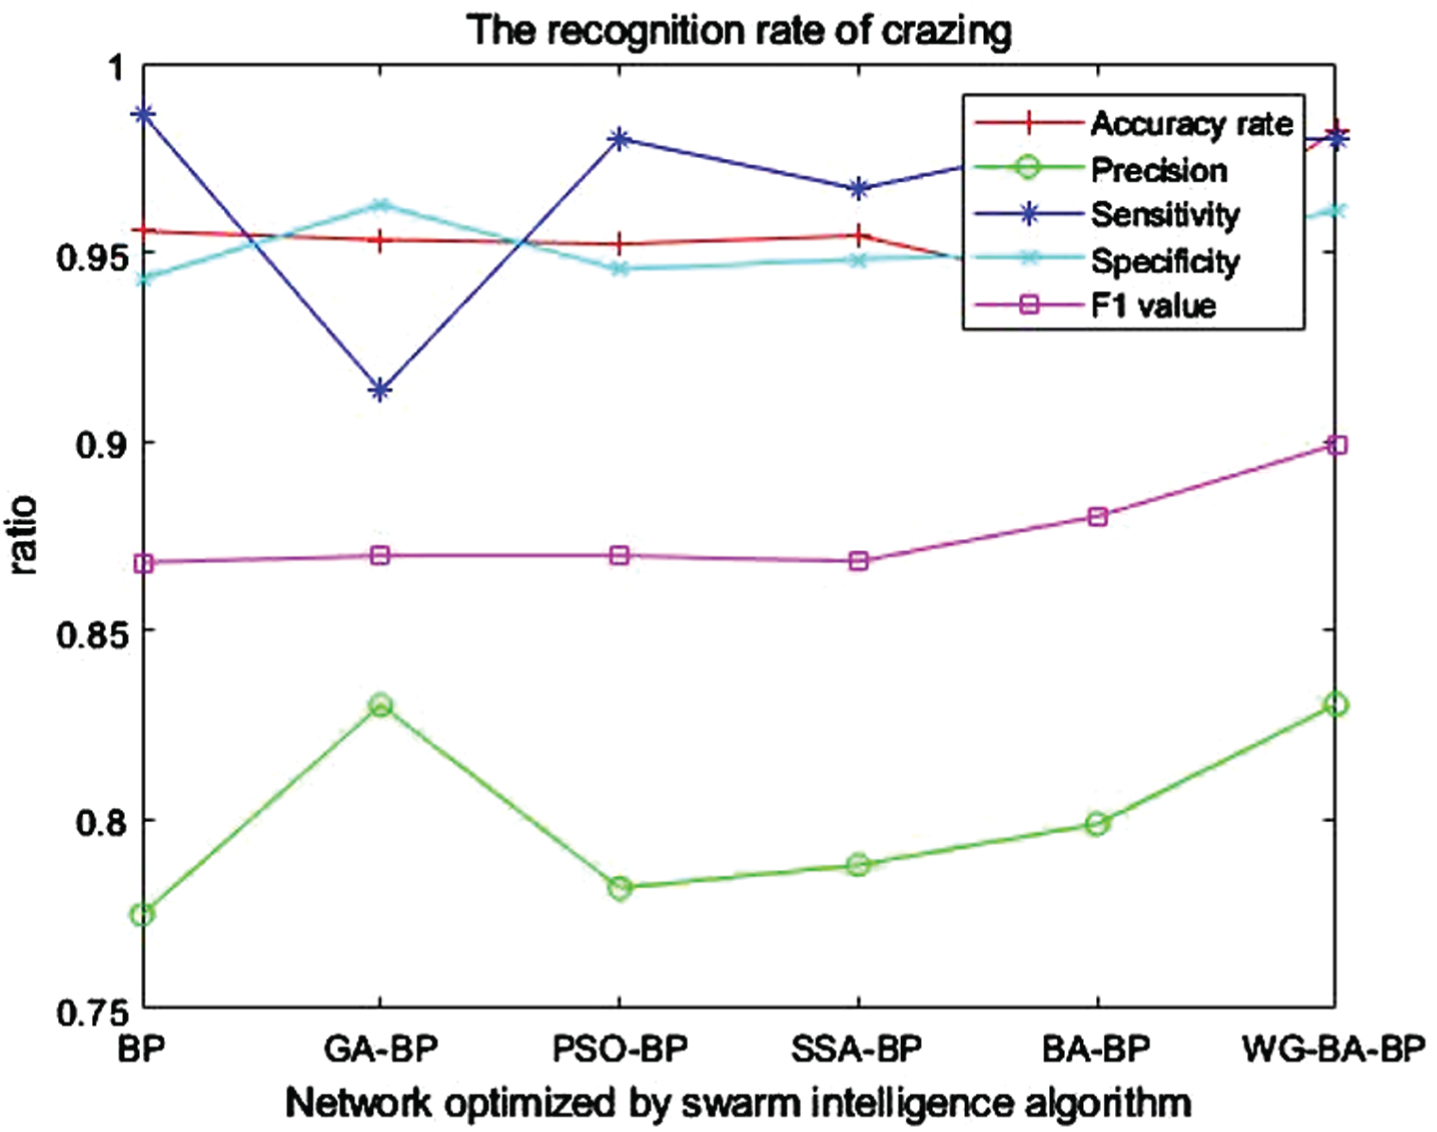
The recognition rate of crazing.
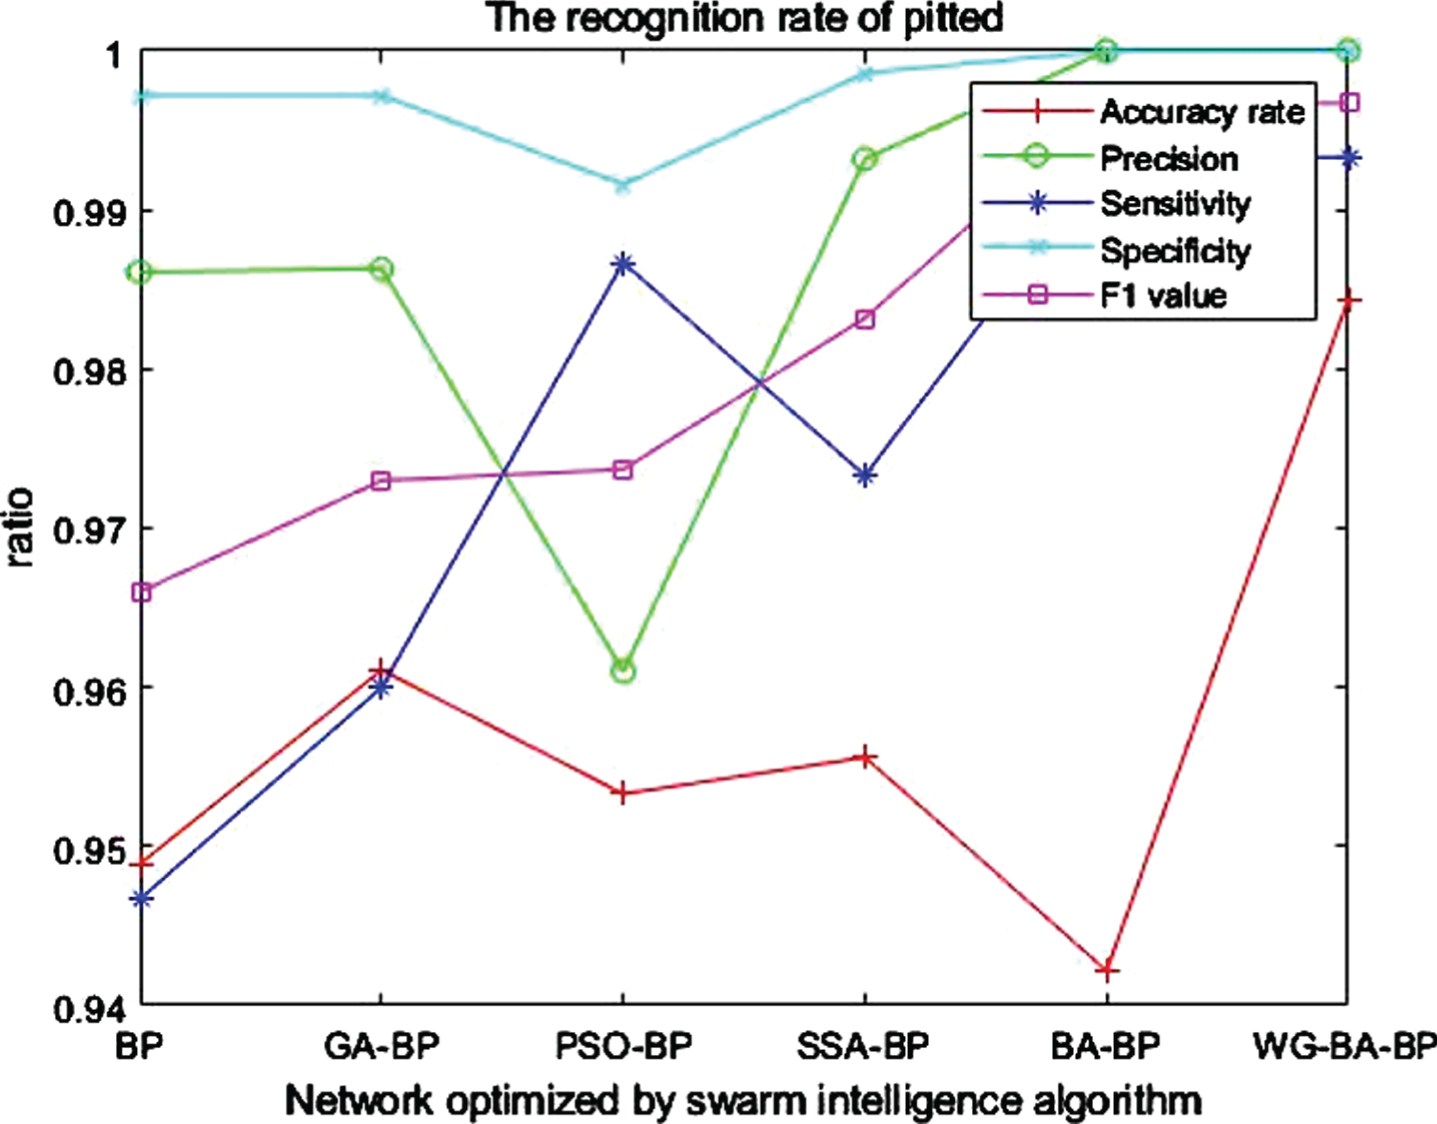
The recognition rate of pitted.

The recognition rate of rolled-in.
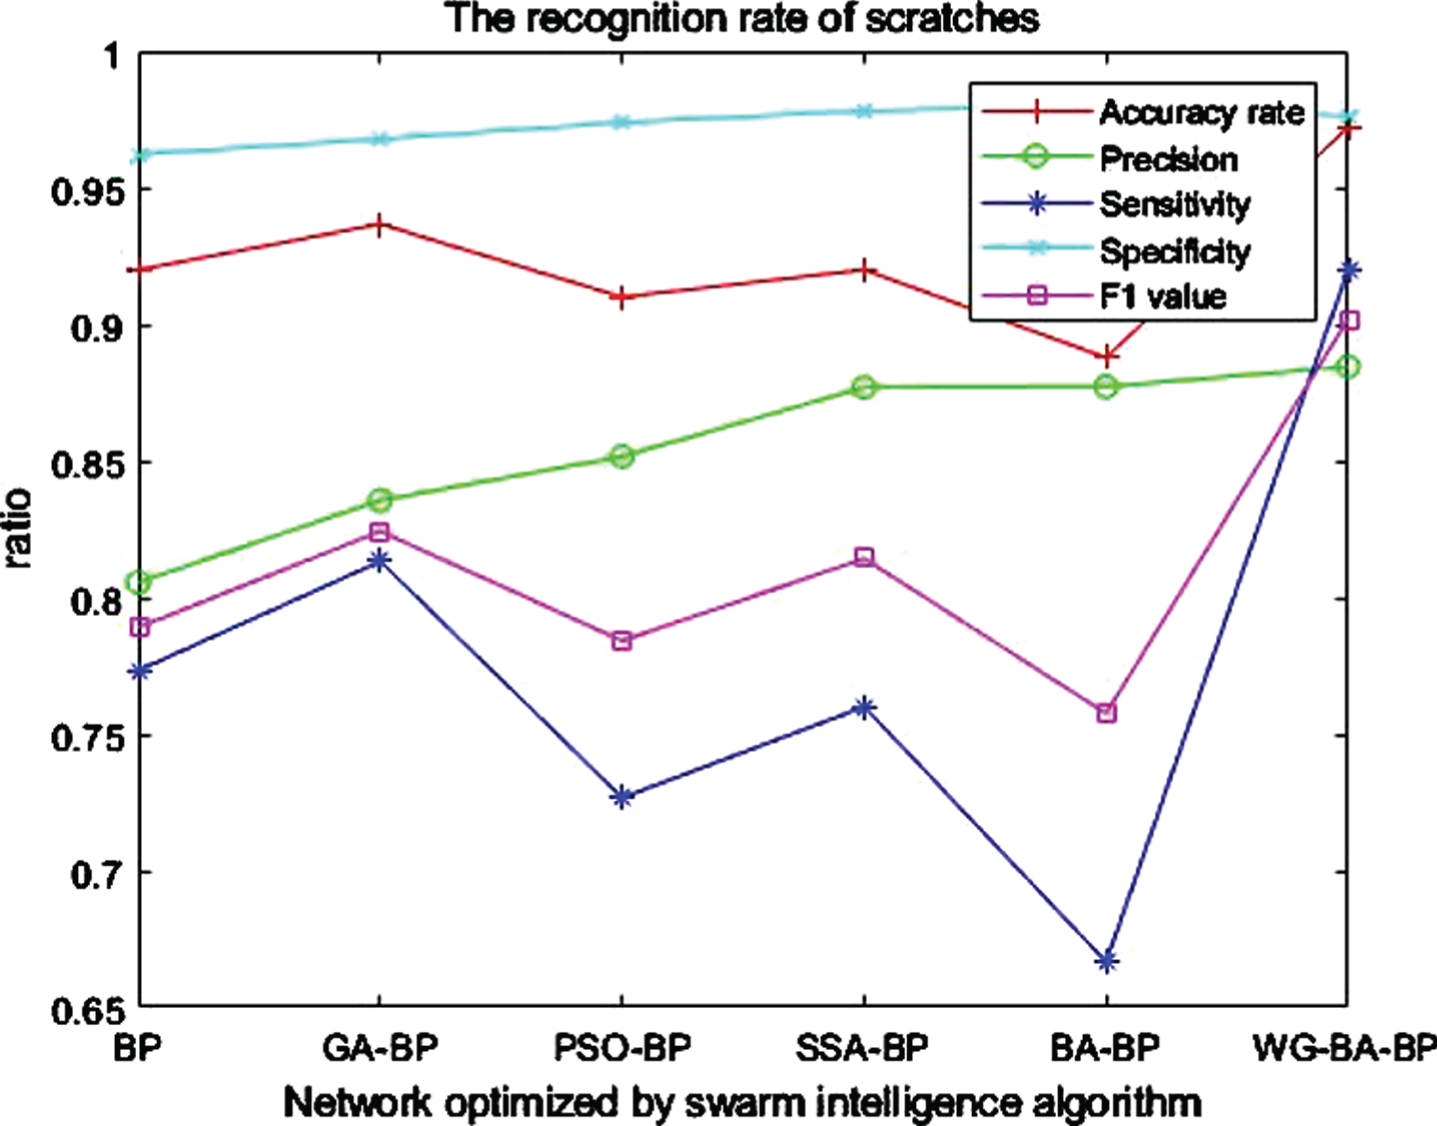
The recognition rate of scratches.
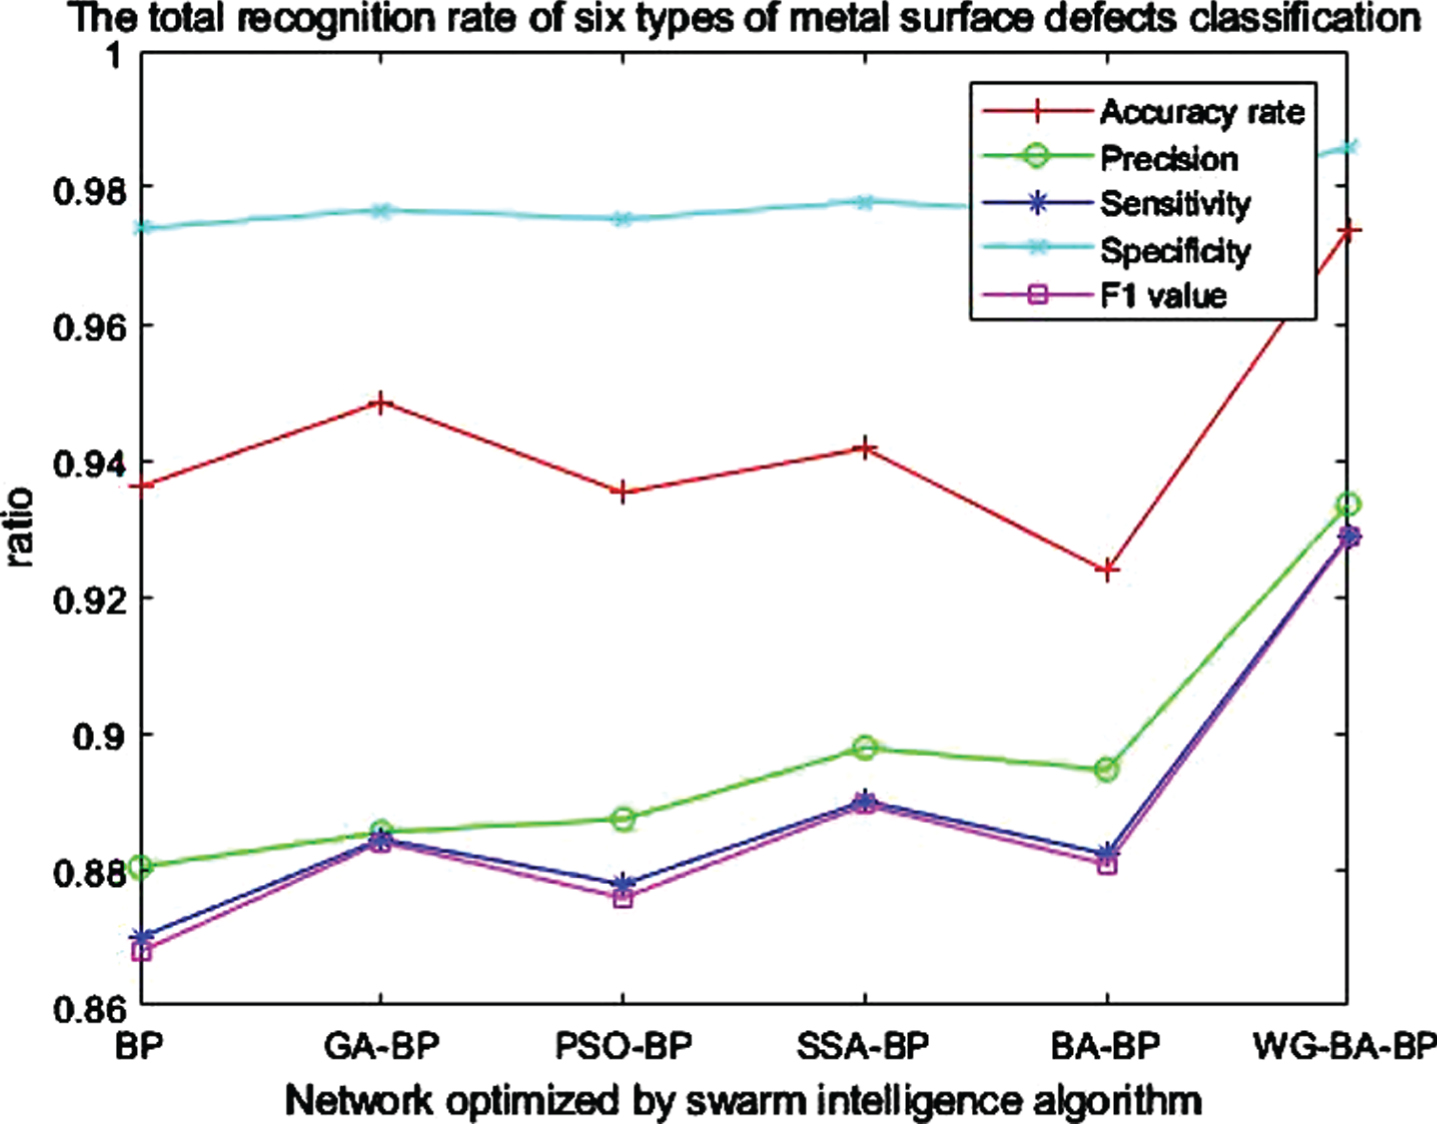
The total recognition rate of six types of metal surface defects classification.
This paper proposes an improved bat algorithm to optimize the BP network (WG-BA-BP), It can improve the classification accuracy of strip steel surface defects, The research conclusions obtained are as follows: Compared with other algorithms, WG-BA has a faster convergence speed. The added weight experience factor can be changed according to the number of iterations and the fitness function to control the flight speed of the bat; the gamma distribution is added to the calculation of the bat’s loudness, which can enhance the local search ability of bats. Experiments show that WG-BA has more development ability and is more stable. Compared with BP, GA-BP, PSO-BP, SSA-BP, and BA-BP, WG-BA-BP can reach the minimum error faster. Compared with other algorithms, WG-BA-BP has increased accuracy, precision, sensitivity, specificity and F1 value by 2.52% –5%, 3.57% –5.32%, 3.89% –6.33%, 0.8% –1.26%, 3.92 % –6.66%. WG-BA-BP can solve the classification problems of six kinds of defect images (inclusion, patches, crazing, pitted, rolled-in, scratches), and its accuracy can reach 97.37%. The experiment verifies WG -BA-BP is an effective method to classify strip steel surface defects.