
Abstract
With the rise of the Internet of Things, the opportunistic network of portable smart devices has become a new hot spot in academic research in recent years. The mobility of nodes in opportunistic networks makes the communication links between nodes unstable, so data forwarding is an important research content in opportunistic networks. However, the traditional opportunistic network algorithm only considers the transmission of information and does not consider the social relationship between people, resulting in a low transmission rate and high network overhead. Therefore, this paper proposes an efficient data transmission model based on community clustering. According to the user’s social relationship and the release location of the points of interest, the nodes with a high degree of interest relevance are divided into the same community. Weaken the concept of a central point in the community, and users can share information to solve the problem of excessive load on some nodes in the network and sizeable end-to-end delay.
Keywords
Introduction
With modern technological demand development, users have higher requirements for mobile communication equipment and mobile communication technology with high efficiency, speed, wide range, and a large amount of data [1]. With the rise of the Internet of Things (IoT), intelligent wireless device (Wi-Fi) technology [2], notebook computers, smartphones, wearable intelligent watches [3], and sensors [4] have rapidly spread. Researchers have witnessed the rapid development of mobile communication technology, which has also induced the emergence of a time-delay and split-tolerant wireless self-organizing network, namely the opportunistic network [5, 6].
An Opportunistic network can be regarded as a self-organizing network with delay-tolerant network characteristics [7, 10]. The opportunistic network includes static nodes and dynamic nodes, which generally have specific storage, communication, and computing capabilities. They can store the sensed data and perform routing selection based on the characteristics of the network. As a new type of network communication technology, opportunistic networks can realize end-to-end data routing and transmission between nodes when the wireless network connection is unstable and discontinuous [11, 12]. For its particular data transmission method, the opportunistic network adopts the “storage-carry-forward” data routing and forwarding mechanism [13].
As the supporter of the 5 G network and big data environment, Opportunistic Network [14] can enable intelligent mobile devices to connect in the same communication area, thereby improving the communication method on traditional infrastructure [15]. The opportunistic network nodes often form relatively stable and interdependent social relationships due to the same interests, attributes, geographic location, and so on [16]. Based on this, related scholars have proposed a variety of ways to divide the opportunistic network into communities [17, 19] and design various routing algorithms according to the sociality of nodes [20, 21]. Many communities rely on one or two source nodes in the opportunistic network to transmit information for traditional algorithms. These nodes not only transmit a large amount of data but also need to provide computing power, which is under tremendous pressure [22, 23], and if they do not have enough cache and overhead, the transmission of data in the community may wait a long time [24].
To solve the problems mentioned above, this paper proposes a data transmission model based on community clustering (DMBCC). Introduce important social attributes such as node interest and geographic location into the community division, discover and mining nodes with similar interests in the network, divide them into the same community, and design an efficient data transmission model based on community division. Weaken the concept of a central point in the community, and users can share information to reduce some nodes’ pressure. At the same time, trusted nodes are selected for data transmission under the quantification of social relations so that the entire transmission process has a higher success rate and lower transmission delay.
The contributions of this research are as follows:
(1) Reconstruct the community with critical social attributes to fully demonstrate the relationship between user-interest-point publishing, user social interaction, and user-location check-in. It is convenient to cluster and divide each layer of model structure, expand the scope of information sharing in the community, and improve the data transmission rate.
(2) Propose different clustering methods for each layer model of the community network. That is, the fuzzy clustering method is used to obtain the overlapping user interest points at the user interest point layer, the hypergraph clustering method is used to obtain the interest point feature at the geographic location layer, and the matrix decomposition method is used to establish the correlation between the two layers, thus showing Geographical distribution characteristics of user points of interest.
(3) Design a simulation experiment comparing with other existing routing algorithms and use three different mobile models to verify the algorithm’s performance. The results prove that the algorithm has significant advantages in terms of time complexity and energy consumption.
The remaining parts of this article are introduced as follows: The second part lists the current research status of Opportunistic social networks. On this basis, the third part proposes a community clustering division model and a community evolution prediction model. The fourth part is verified by simulation experiments the model’s performance, and the fifth part summarizes the full text.
Related works
The study of Opportunistic networks can be traced back to the end of the 20th century. An opportunistic network is a specific network structure model and a unique wireless network communication technology. It has significant application value in many fields and arouses most researchers’ interest in opportunistic networks and opportunistic network routing algorithms. At present, there are many ways to classify opportunistic network routing algorithms. This paper divides opportunistic networks into non-social routing and social routing according to whether nodes’ social attributes are considered.
(1) Non-social routing algorithm
Non-social routing protocols design routing algorithms from the perspectives of node encounter time, node encounter frequency, storage space size, and network load, without considering the social attributes of nodes, so the application scenarios of such algorithms have certain limitations.
Vahdat and Becker [25] proposed an Epidemic routing algorithm, which is the most basic multi-copy routing method and can ensure that all users get a copy of a given data packet within a limited time. The nodes move and contact randomly to achieve the maximum throughput and minimum communication delay. However, the algorithm’s performance is related to the buffer size of the node, and transfer data using flooding technology, so that the network overhead is relatively large. Tan et al. [26] proposed an efficient DTN routing algorithm: ERC 2 routing algorithm, which dynamically adjusts the semi-congested state threshold of nodes according to the perceived network conditions to reduce the possibility of network congestion. In the case of different levels of congestion, it has better network performance than Epidemic routing.
Zhou et al. [27] proposed the Prophet algorithm, a routing algorithm based on probability. It estimates the encounter probability of a node based on the node’s historical encounter information and forwards the message to the node with a higher probability of encountering the destination node each time. It can alleviate the blindness of message forwarding to a certain extent but does not consider the impact of node contact time and cache size on stored data packets. Wu et al. [28] proposed an ICMT routing algorithm to evaluate node identification probability, which provides high-probability nodes to adjust the cache’s priority, thereby reconstructing the cache space and controlling the frequency of information transmission. Guan et al. [29] proposed an effective data transmission scheme based on structured areas, which reduces network overhead by increasing bandwidth and cache space.
Spyropoulos et al. [30] proposed the Spray and wait routing algorithm, which “sprays” a large number of copies into the network and then “waits” until one of the nodes reaches the destination. Ahmed et al. [31] proposed an improved version of binary SNW protocol in the Spray stage: Hexago SNW algorithm. In this method, hexagonal series is used to replace binary series, which can significantly improve transmission utility and reduce transmission overhead.
(2) Social routing algorithm
The social attributes of human beings and their high clustering make it easy to form communities. Therefore, people’s social attributes, including social relations, social status, and geographical location, are considered in routing algorithms based on social routing protocols.
Hui et al. [32] proposed a community-based BubbleRap routing algorithm, which uses two social and structural metrics, namely center and community, and uses accurate human flow trajectories to design forwarding algorithms, avoiding the use of building and updating routing tables to deal with dynamic network environments. It can significantly improve forwarding performance. Nevertheless, when each node’s global centrality in the network is low, the routing strategy will fail. Zheng et al. [33] proposed an effective optimistic transmission routing algorithm (EPTR) based on social relationships in opportunistic social networks. This technology optimizes the method of community division by modularity, which considers the tightness of networks and discusses the social attributes of nodes. It has a high transmission success rate and low network load.
Hui and Crowcroft [34] proposed a label-based routing method, which sets the label of a node according to the node’s social attributes. Nodes with the same label belong to the same community, so Label routing directly transfers information to the destination node or selects the same community node as a relay node. Tibély et al. [35] found that the Label algorithm is equivalent to the Potts model of local minimization. Barber et al. [36] put forward the LPAM routing Algorithm (Modularity-Specialized Label Propagation Algorithm) by studying the Label Algorithm and treating it as an optimization problem.
This chapter introduces the primary research status of opportunistic network routing algorithms. Based on the above methods and problems, we can find more effective methods to solve social networks’ transmission rate and energy consumption problems.
Model design
In extensive data communication based on opportunistic networks, relative to computational consumption, communication between nodes in the network is the main factor in energy consumption, and it is also a critical factor in whether the data can be successfully transmitted.
In real life, everyone has their interests, and people often actively participate in the things they are interested in, showing great enthusiasm. People have social attributes, and there is a community structure between people. The probability of meeting between people in the same community is much greater than that of people belonging to different communities. Therefore, we introduce essential social attributes such as interest and geographic location into the community division, discover and mining nodes with similar interests in the network, divide them into the same community, and design an efficient data transmission model based on community division. The following will introduce the details of the community division model.
The community division model comprises three entity sets: interest point set, user set, and geographic location set. The exciting point set is composed of points of interest reflected by the media information posted or commented on by the user; The geographic location set displays the difference between the user and the sign-in location; The user set is composed of the social relationship network between users, and user activities link the three entity sets. The specific structure is shown in Fig. 1.
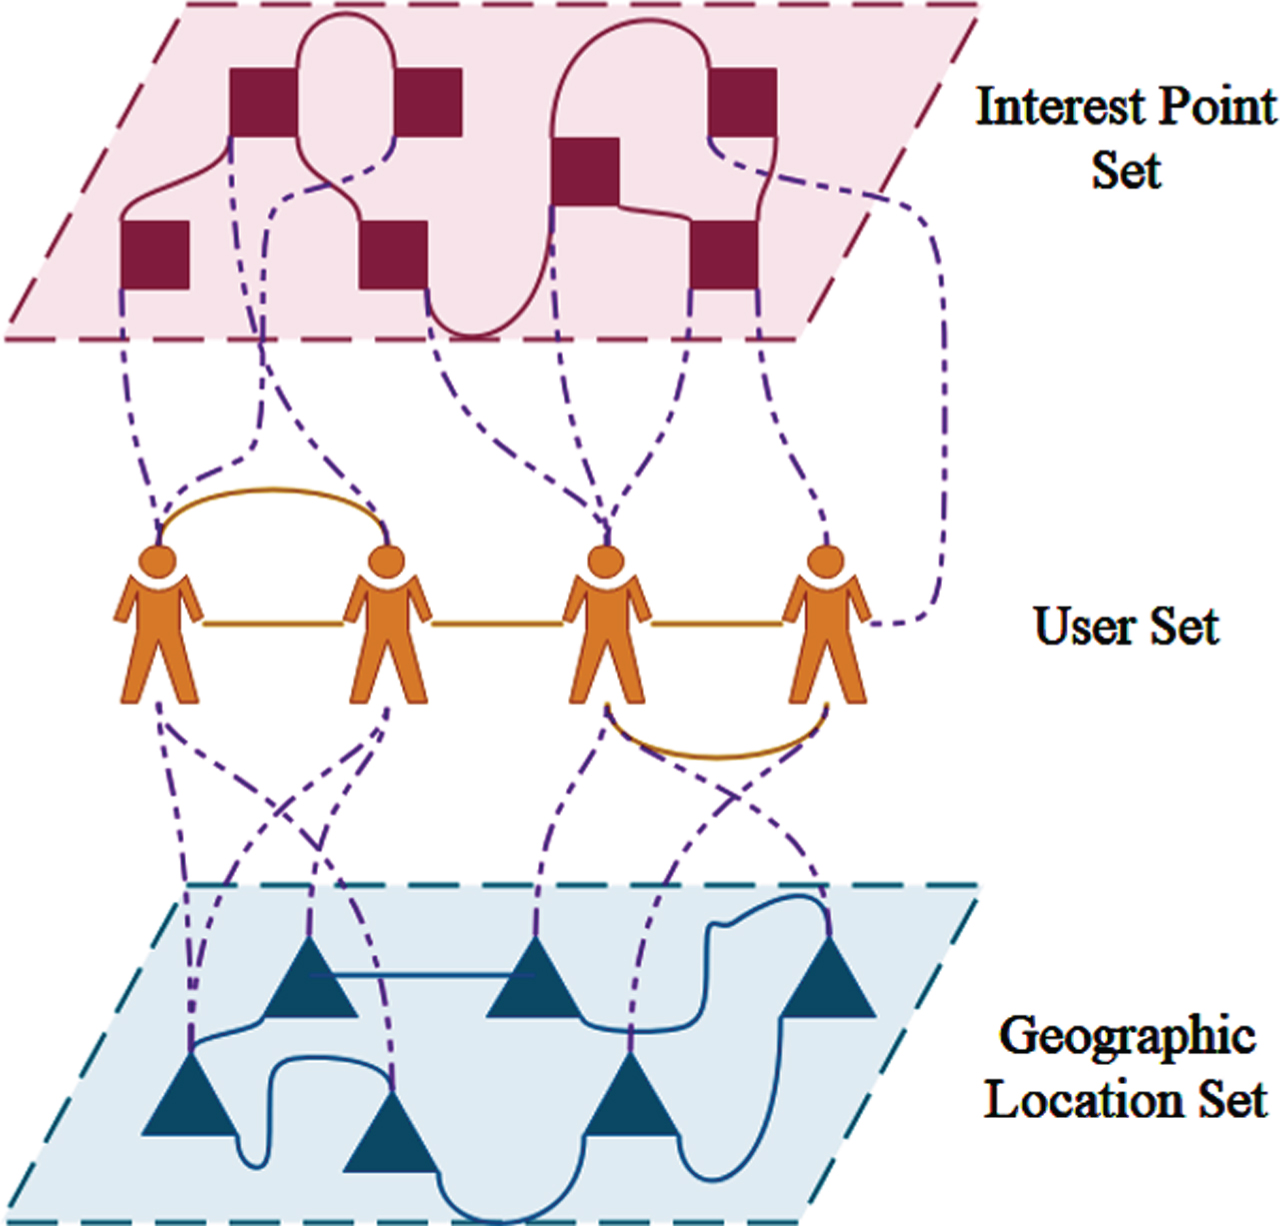
Three-tier structure model.
The following is a detailed definition of the components of the model:
In an opportunistic social network, network nodes have many different social attributes, such as interest, work location, residence, occupation, etc. These attributes play a unique role in community optimization and data transmission. The check-in behaviors of different users at different geographic locations can be abstracted as the user-check-in network S shown in Figure 3, and the network structure can be described as a two-part graph as shown in Figure 2 at the same time. However, the bipartite graph structure can only describe the binary correspondence between users and geographic locations and cannot reflect the same or similar attributes between users and geographic locations. So, it is not easy to wholly and intuitively analyze the characteristics of the network structure. To solve the above problems, this paper uses the hypergraph concept to transform the bipartite graph into a hypergraph, deeply study the correlation degree and distribution characteristics between the user’s points of interest and geographic location, and further solve the problem.
Definition 4 gives a detailed definition of a hypergraph. According to it, the vertex set in a hypergraph has the exact definition as the user set in a bipartite graph, and the hyperedge in a hypergraph means that multiple vertices in the same closed curve have common attribute relations. Therefore, if a bipartite graph is transformed into a hypergraph, the user set Y is only required to remain unchanged. The hyperedge E ls represents the intersection of users who co-check in at geographic locations w l and w s in the bipartite graph. The specific rules are as follows:
According to the above rules, the successful conversion of the user-sign-in network S from the bipartite graph shown in Fig. 2 to the hypergraph shown in Fig. 3 can be completed. In the hypergraph, the user is used as a fixed point; the hyperedge is a closed curve containing multiple associated points of interest and a set of users who have signed in. In contrast, the hypergraph structure transforms the binary correspondence relationship into a network structure with an inclusion relationship, which can and intuitively depict the correlation degree of different users’ check-in at different geographical locations, and also can fully reflect the relationship between the points of interest contained in the hyperedge and the geographical location.
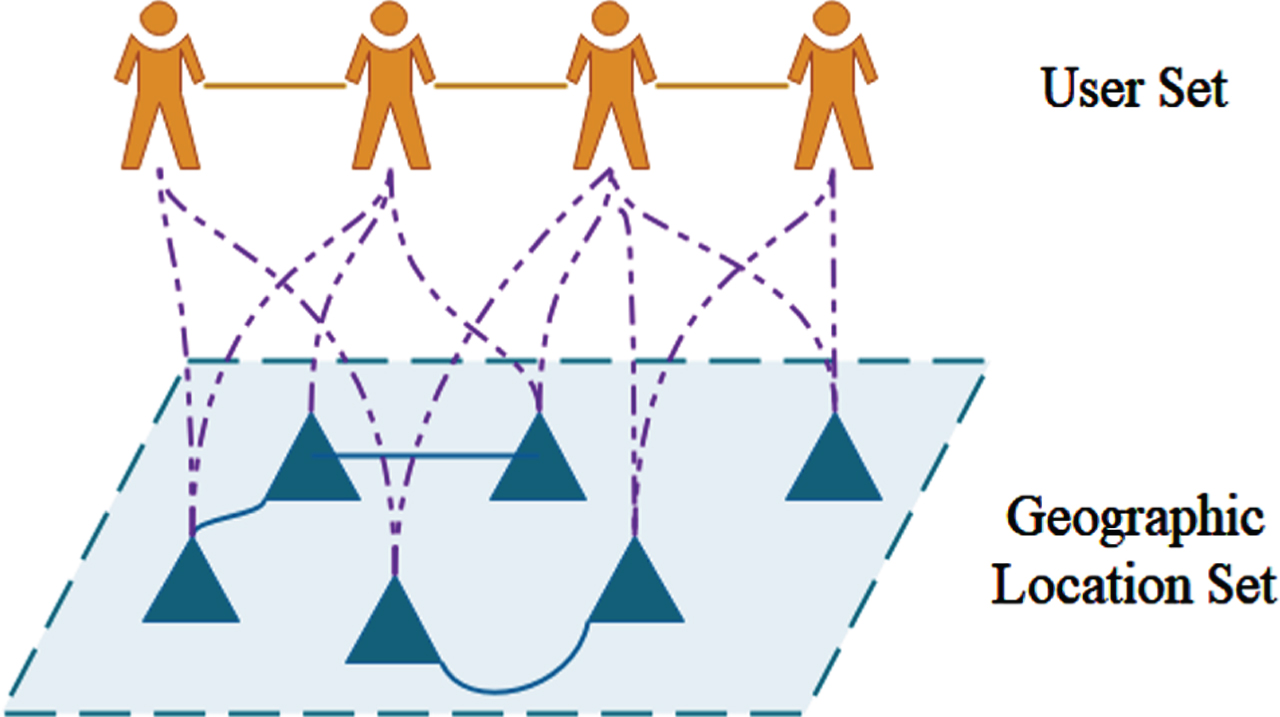
Bipartite network structure.
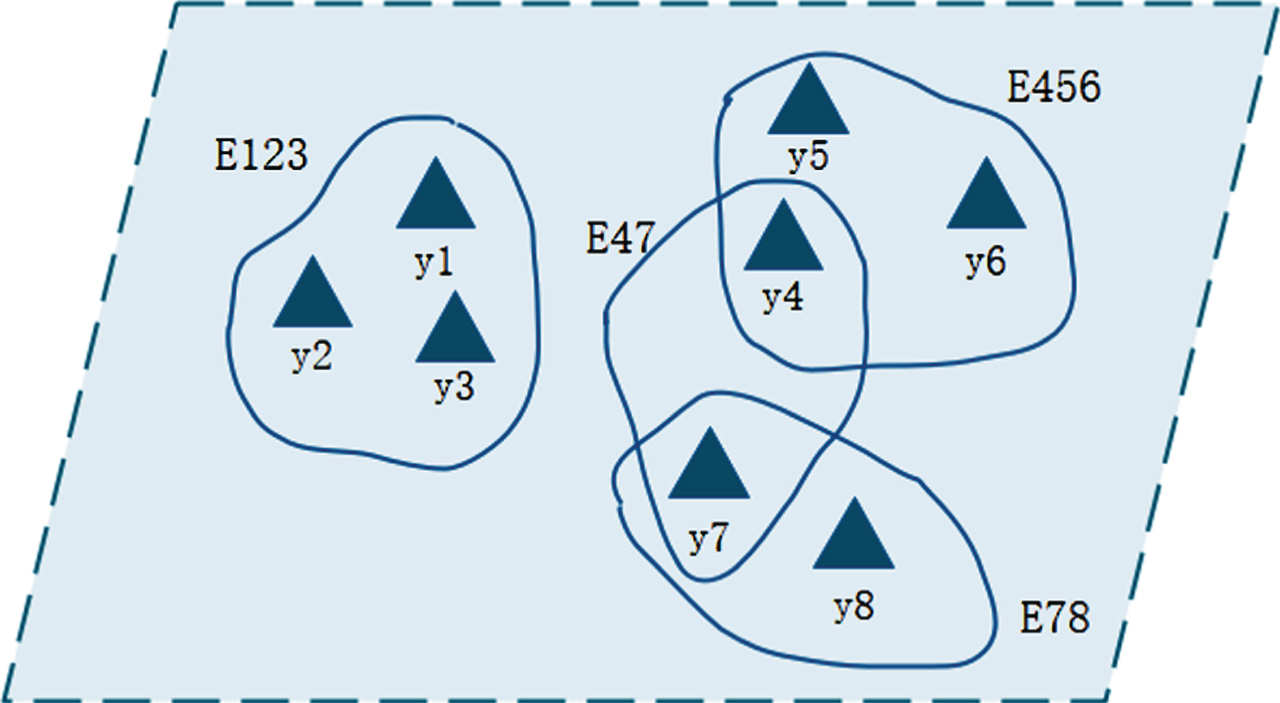
Hypergraph network structure.
In hypergraph C, the similarity between any two hyperedges E
p
and E
q
can be described by the following equation:
The larger the calculation result of Formula 2, the higher the similarity between the two super edges E
p
and E
q
, it indicates that the larger the user cross-domain contained in the two super edges, the more concentrated the interest points contained in the super edges. Thus, the relevant structure of a user’s interest point cluster is obtained. In order to obtain the specific structural characteristics of the interest point cluster, the clustering problem of super edges can be abstracted into
Where n represents the number of clusters, U ={ U1, U2, …, U
t
} represents the divided clusters, and res′ (E
ls
, U
s
) represents the degree of association between hyperedge E
ls
and cluster U
s
, that is
The function of Formula 2 is to divide the hyperedges into hyperedge clusters according to the degree of correlation between different hyperedges and improve the similarity between the hyperedges in the same community. The detailed algorithm steps of the hypergraph clustering method for geographical location concentration are given below:
The main calculation of algorithm 1 focuses on hyperedge clustering division and computing the user’s check-in matrix in a geographic location cluster. The time complexity of the algorithm is analyzed in the following. Assuming that the number of users is y and the number of oversides is c, the first half is used to calculate the degree of association between the overside and the community cluster. If the iteration of m times reaches the convergence state, then the time complexity is O (m · c2). The latter part is divided into the geographic location cluster assigned to the users included in a hyperedge for check-in. Assuming that the average number of users contained each hyperedge is y/c, the time complexity of this part is O (a · c · y/c). Combining these two parts, the overall time complexity of algorithm 1 is O (mc2 + ay), where a is a constant.
Interest points are projected by the keywords contained in the media information released or commented on by users. To obtain the user’s interest point cluster, the degree of correlation between the given keywords should be calculated first. In this paper, the method in Reference [37] is used to measure the degree of correlation between any two keywords:
In Formula 5, p (k l ) represents the percentage of given keyword k l in all keywords, and p (k l k s ) represents the probability that media information contains keyword k l under the condition of keyword k s . It can be concluded above that RD (k l k s ) indicates the degree of dependence of the keyword k l on the keyword k s . Similarly, the dependence degree of keyword k s on keyword k l can be obtained by substituting RD (k s k l ).
In order to further reduce the contingency of the degree of correlation between keywords, a more accurate calculation index ARD (k
l
k
s
) is adopted:
According to Formula 6, the degree of correlation between the two keywords k
l
and k
s
can be calculated:
In Formula 7, degree (k l , k s ) describes the degree of correlation between k l and k s by calculating the average value of the interdependence between the two keywords.
On this basis, by calculating the average correlation degree between keywords contained in media information published or commented by any two users, the similarity degree between the projected points of interest can be obtained, which can be expressed as
In Formula 8, |y l | represents the number of keywords searched by User y l , |y s | represents the number of keywords searched by User y s , and the degree of correlation between user keywords degree (y lm , y sn ) is calculated by Formula 7.
Based on the above proof, continue to construct the user similarity matrix V, where v
ls
∈ V (1 ⩽ l, s ⩽ n, l ≠ s) and let v
ls
= d (y
l
, y
s
), v
ll
= 0. Assume that matrix M represents the distribution of users in the interest point cluster, and m
ab
∈ M represents the social relationship strength of user a in community b. The clustering problem of user interest community can be abstractly modeled as
Where,
Here, we use Lagrange’s theorem to solve Formula 9. Assuming that both vector μT = (μ
l
) (1 ⩽ l ⩽ n) and matrix Ω = [ρ
ab
] m×j are Lagrangian operators, Formula 9 can be rewritten as
Its KKT conditions (Karush –Kuhn –Tucker conditions) are
If there is a solution (M*, φ*, Ω*) that satisfies Formula 11, then M* is the optimal solution of Formula 9. The following iteration update rules are used to solve the problem:
Where, the regularization formula of
According to the above iterative update rule, to obtain the matrix M* to which the user interest community belongs to the optimal match, only the matrix and related parameters need to be updated iteratively until the solution converges to a given threshold. The detailed algorithm steps of the clustering method of interest points are given below:
The specific steps of algorithm 2 are first to calculate the correlation degree of keywords contained in the media information among users in the community to obtain the similarity matrix of users’ interest points, and then to obtain the optimal matching matrix of users’ interest community according to the iterative update rules, that is, the overlap range of interest points among users. The algorithm’s main calculations focus on the calculation of the degree of relevance of keywords between users and obtaining the matrix of the user’s optimal matching interest community. The time complexity of the algorithm is analyzed below. Assuming that users for a, keywords for b, the algorithm step 1 when calculating the similarity matrix of user interest concrete is divided into two steps, each user access to their keywords and computing the correlation degree between overlapping interests range between users, so the time complexity of this step is s. The remaining steps are mainly to realize the iterative updating process of the matrix and related parameters. Assuming the number of iterations is O (a2 · b2), the overall time complexity of algorithm 2 is O (sja + a2 · b2), where j is a constant.
The relationship between user and location check-in is obtained through hypergraph cluster analysis of the geographic location set. Through clustering analysis of the interest point set, the relationship between users and the interest points projected by the keywords in the media information published or commented by users can be obtained. At the same time, there are complex social relations among users. Users’ social relations are used to connect the geographic location set and the interest point set, and the association relationship between them is deeply studied. The specific structure is shown in Fig. 4.
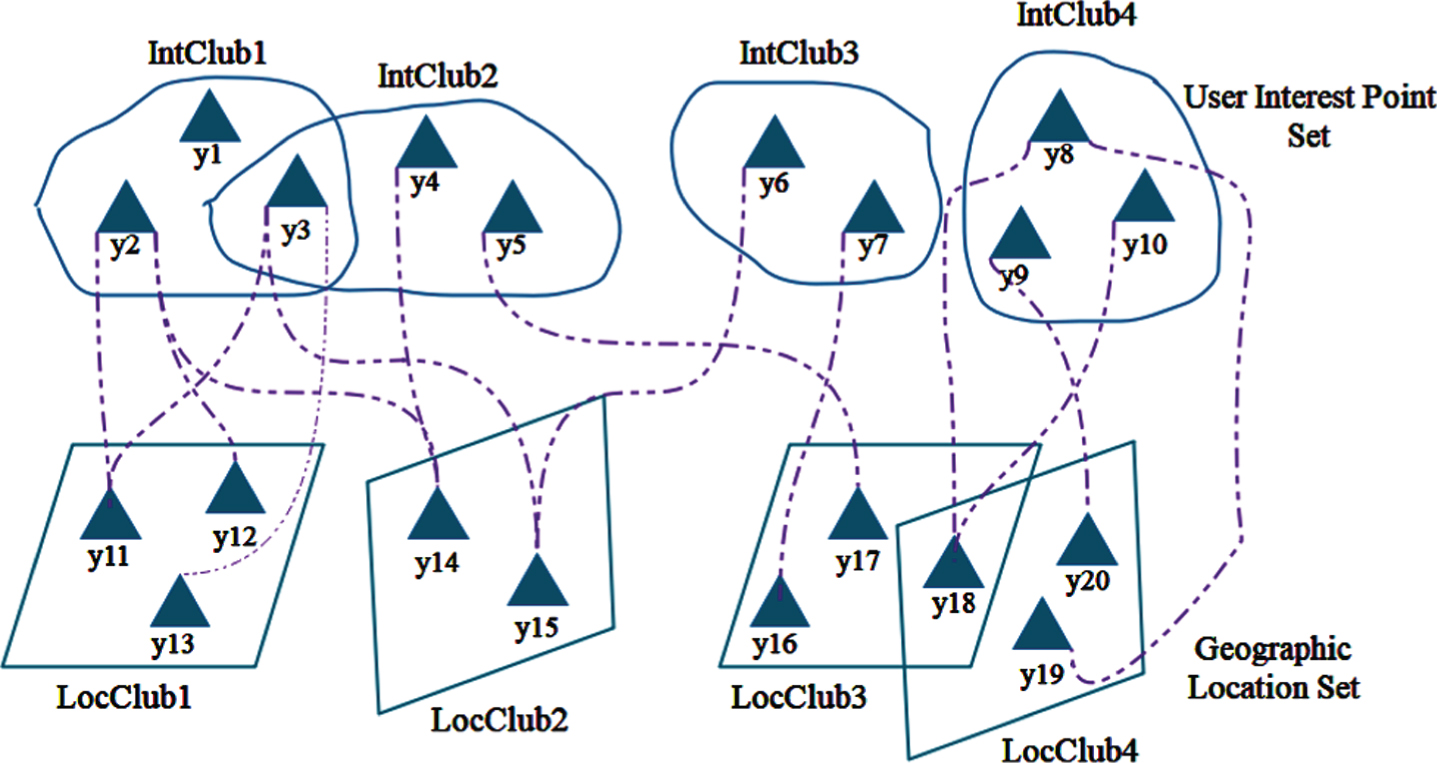
Relationship between user interest set and geographic location set.
It can be seen from Fig. 4 that the user is divided into p location clusters on the geographic location set, and q keyword clusters on the interest point set. Assumed matrix G = [G1, G2, …, G n ] T ∈ Wn×q, where G i represents a feature vector composed of the ownership between the i-th user and q keyword clusters; Assumed matrix H = [H1, H2, …, H n ] T ∈ Wn×p, where H i represents the feature vector composed of the check-in relationship between the i-th user and p location clusters; Matrix W ∈ Wq×p represents the degree of association between location clusters and keyword clusters.
In Definition 2, relevant definitions of social relationship network R=(Y,B) in user set have been given, and its adjacency matrix can be expressed as K = (k
ls
) n×n, where element k
ls
is
Based on this, the expression model of matrix decomposition for social relations of users is as follows:
In order to minimize the loss function, the stochastic gradient descent method is usually used to solve the local optimal solution. The iterative update rule of the matrix variable W is as follows:
Where, parameter β represents the regularization factor, σ represents the number of iterations of gradient descent, and φ represents the learning rate of iteration update step size. When the absolute error value of two adjacent matrix W is less than ɛ, it is considered that the update iteration is completed. Detailed algorithm steps are given below:
An optimized mobile community model is constructed by using different clustering methods for each layer of the social network model. Divide the nodes in the opportunistic social network into several communities, establish a weight distribution and community reconstruction mechanism between nodes, solve the problem of time complexity, and reduce network overhead and energy consumption. The flow chart of the division of the entire community is shown in Fig. 5. The inferences and proofs involved in the division process are as follows:
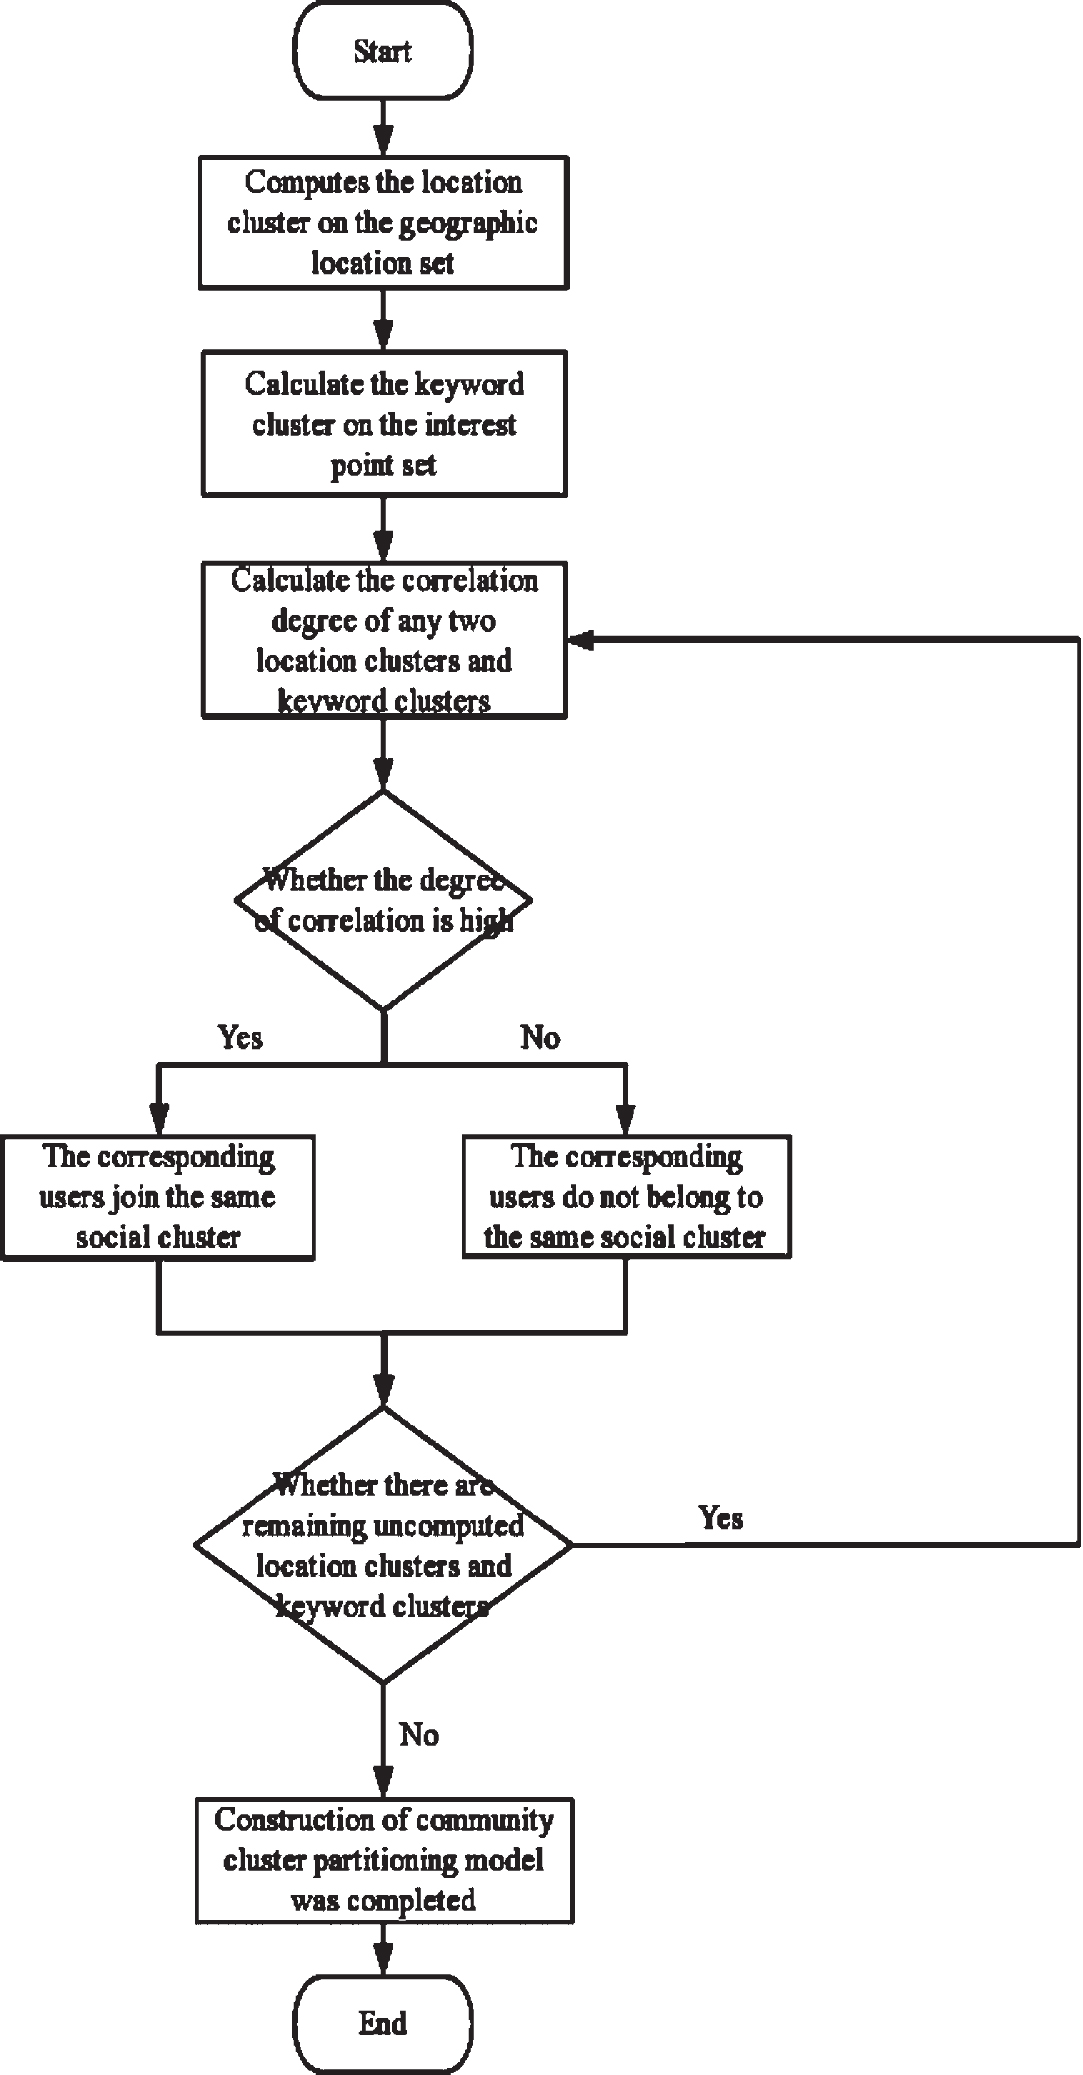
Model flow chart.
Topological structure Q =(N, D, h) is defined, where N is the node in the network, D is the connecting edge between nodes, which can be expressed as D = {(x, y) x ∈ N, y ∈ N}, x and y are nodes, and h is the weight of the connecting edge between nodes x and y. In this paper, modularity is used to explain the community to facilitate the prediction of community variability and reconstruction of the community.
The degree of modularity of the community at time m can be expressed as:
Where K represents the degree of modularity of the community, H represents the total weight on the edge of node connection, h a represents the total weight on the edge of node connection of community a, and e X represents the total degree of source node X in the community.
Subtract K (m) from K (m + 1) to get:
Because Δh > 0 and K (m + 1) - K (m) >0 are known, Formula 19 can be transformed into
That is to say,
Since 2H is the total degree of nodes in the opportunistic network, there is no community with a total degree greater than 2H in this network. According to the above deduction, it can be proved that increasing the weight of the connecting edge between nodes can increase the degree of association with the community.
After the weight of the connected edge changes, the total weight of the community changes to:
Further derivation:
Because
It can be concluded that
According to the above inference,
From this proof, we can conclude that there is a connection relationship between the two nodes, and this connection edge is the only edge of one of the nodes. Even if the weight of this connection edge is reduced, the community will not split.
If node f leaves community X and joins community Y, the degree of modularity can be expressed as
In order to prove that node f joining community Y will increase the modularity of the community, we only need to prove KX-f + KY-f > K
X
+ K
Y
, that is
The Effective weight distribution and communities reconstitution algorithm (WDCRA) is described in algorithm 4.
If the weight (f, g, Δh) is added, the change of the algorithm is shown in algorithm 5.
By clustering and dividing communities in social networks, users with the same social attributes are divided into the same community. The central point concept is weakened in the community, users share information, and the entire transmission process has a higher success rate. In the next part, we will use simulation experiments to verify the performance of the model.
In this chapter’s experiments, this paper uses the simulator ONE (Opportunistic Network Environment) in the literature [38]. It compares it with the three routing algorithms MaxProp (Routing for Vehicle-Based Disruption-Tolerant Networks) [39], TFMC (triangular fuzzy The baseline comparison of layer model and multi-layer clustering algorithm [40], and Spray and Wait routing algorithm [30] evaluates the performance of the DMBCC algorithm from the aspects of transmission rate, average network overhead, energy consumption, and average end-to-end delay.
The configuration and description of the relevant parameters in the simulation experiment are as follows. The transmission method in the experiment is broadcast, the network area involved is 4000m×3600 m, and the simulation time is 0–7 hours. The transmission network contains 500 nodes. All nodes move randomly at a speed of 0.6–1.6 m/s. The nodes use the community model for data transmission. The maximum amount of information that a single node can store is 6MB, and the maximum transmission area is 12m2; the sending interval between data packets is 20–30 s. Also, all nodes’ initial energy is 200 joules, and each data packet sent consumes 2 joules of energy.
The next step will compare the transmission rate, energy consumption, average end-to-end delay, and average network overhead of the DMBCC algorithm with other algorithms. The specific experimental results are shown in Figs. 6–9.
Relationship between transmission rate and time.
Relationship between energy consumption and time.
Relationship between transmission delay and time.
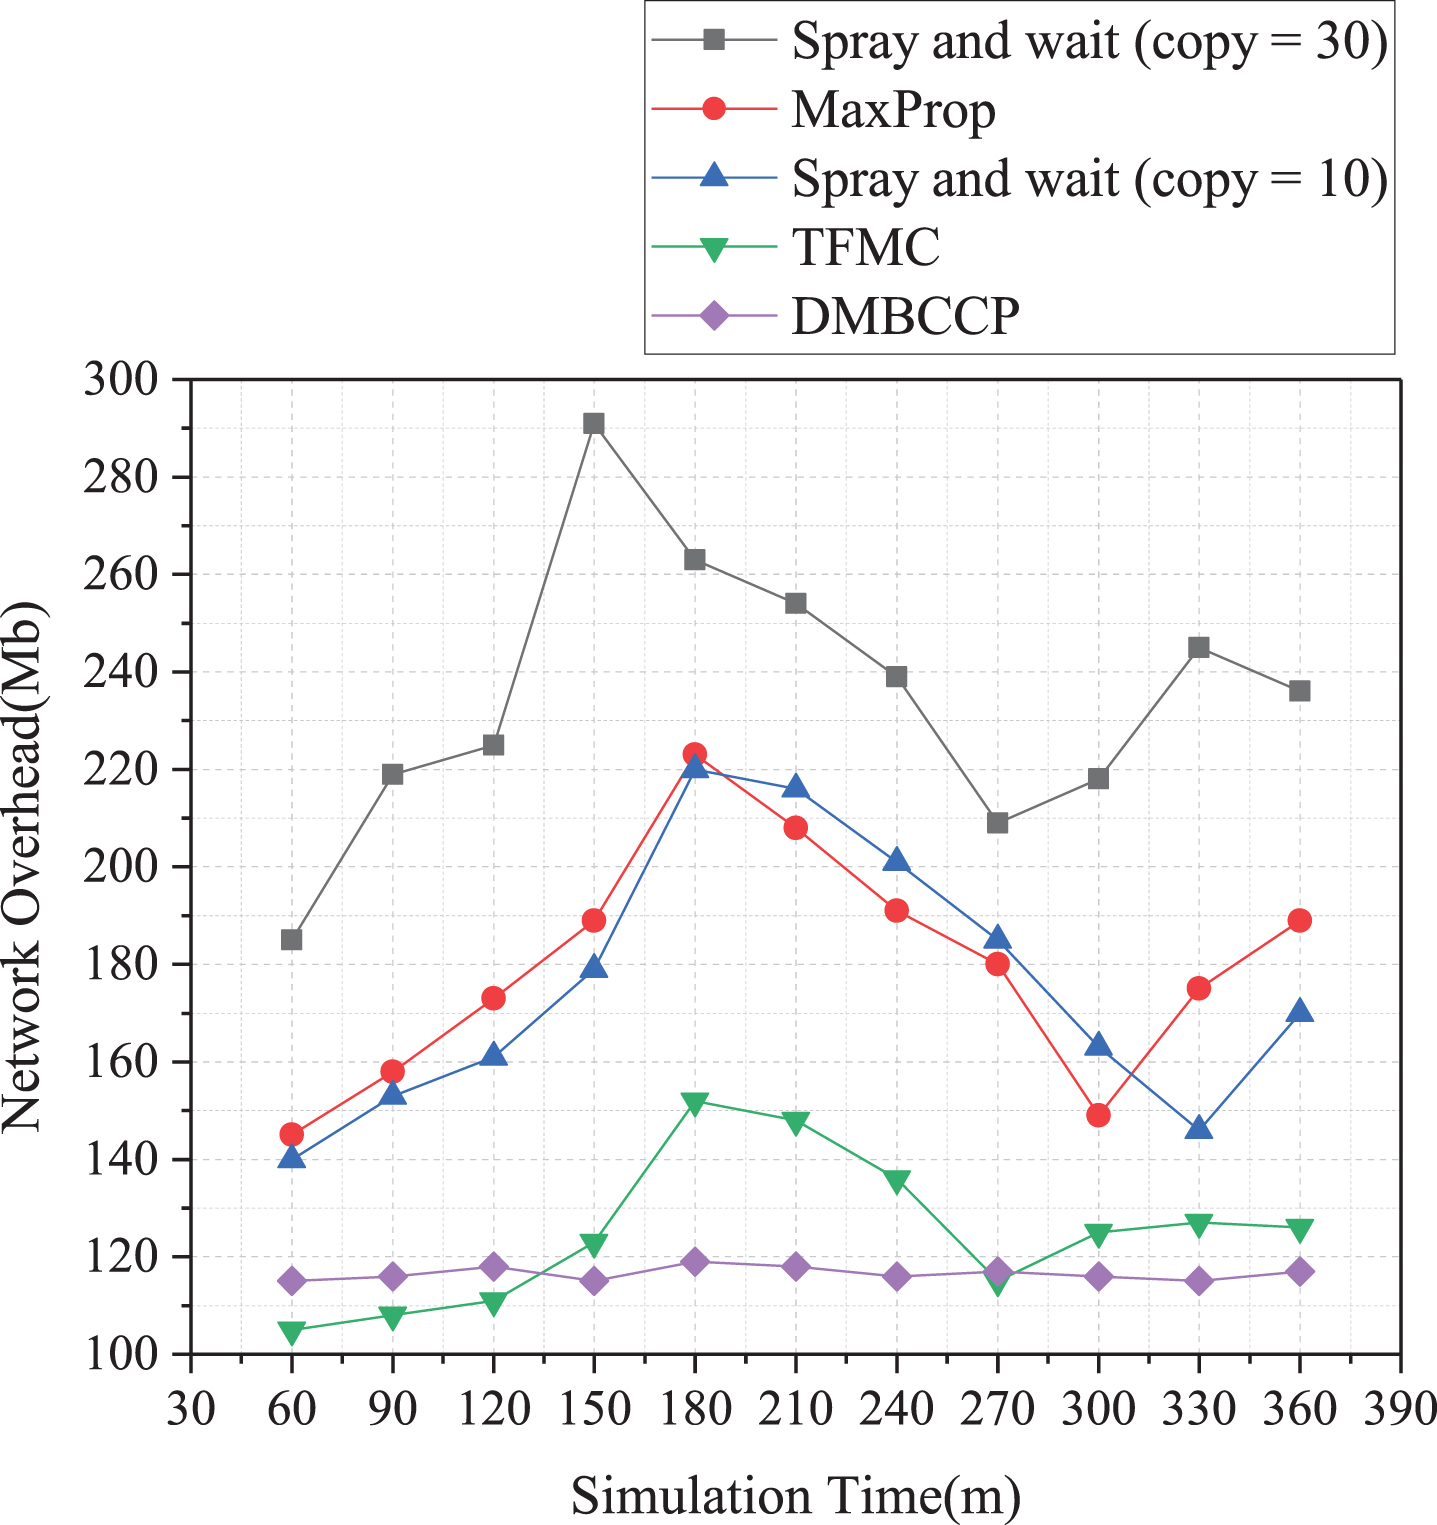
Relationship between network overhead and time.
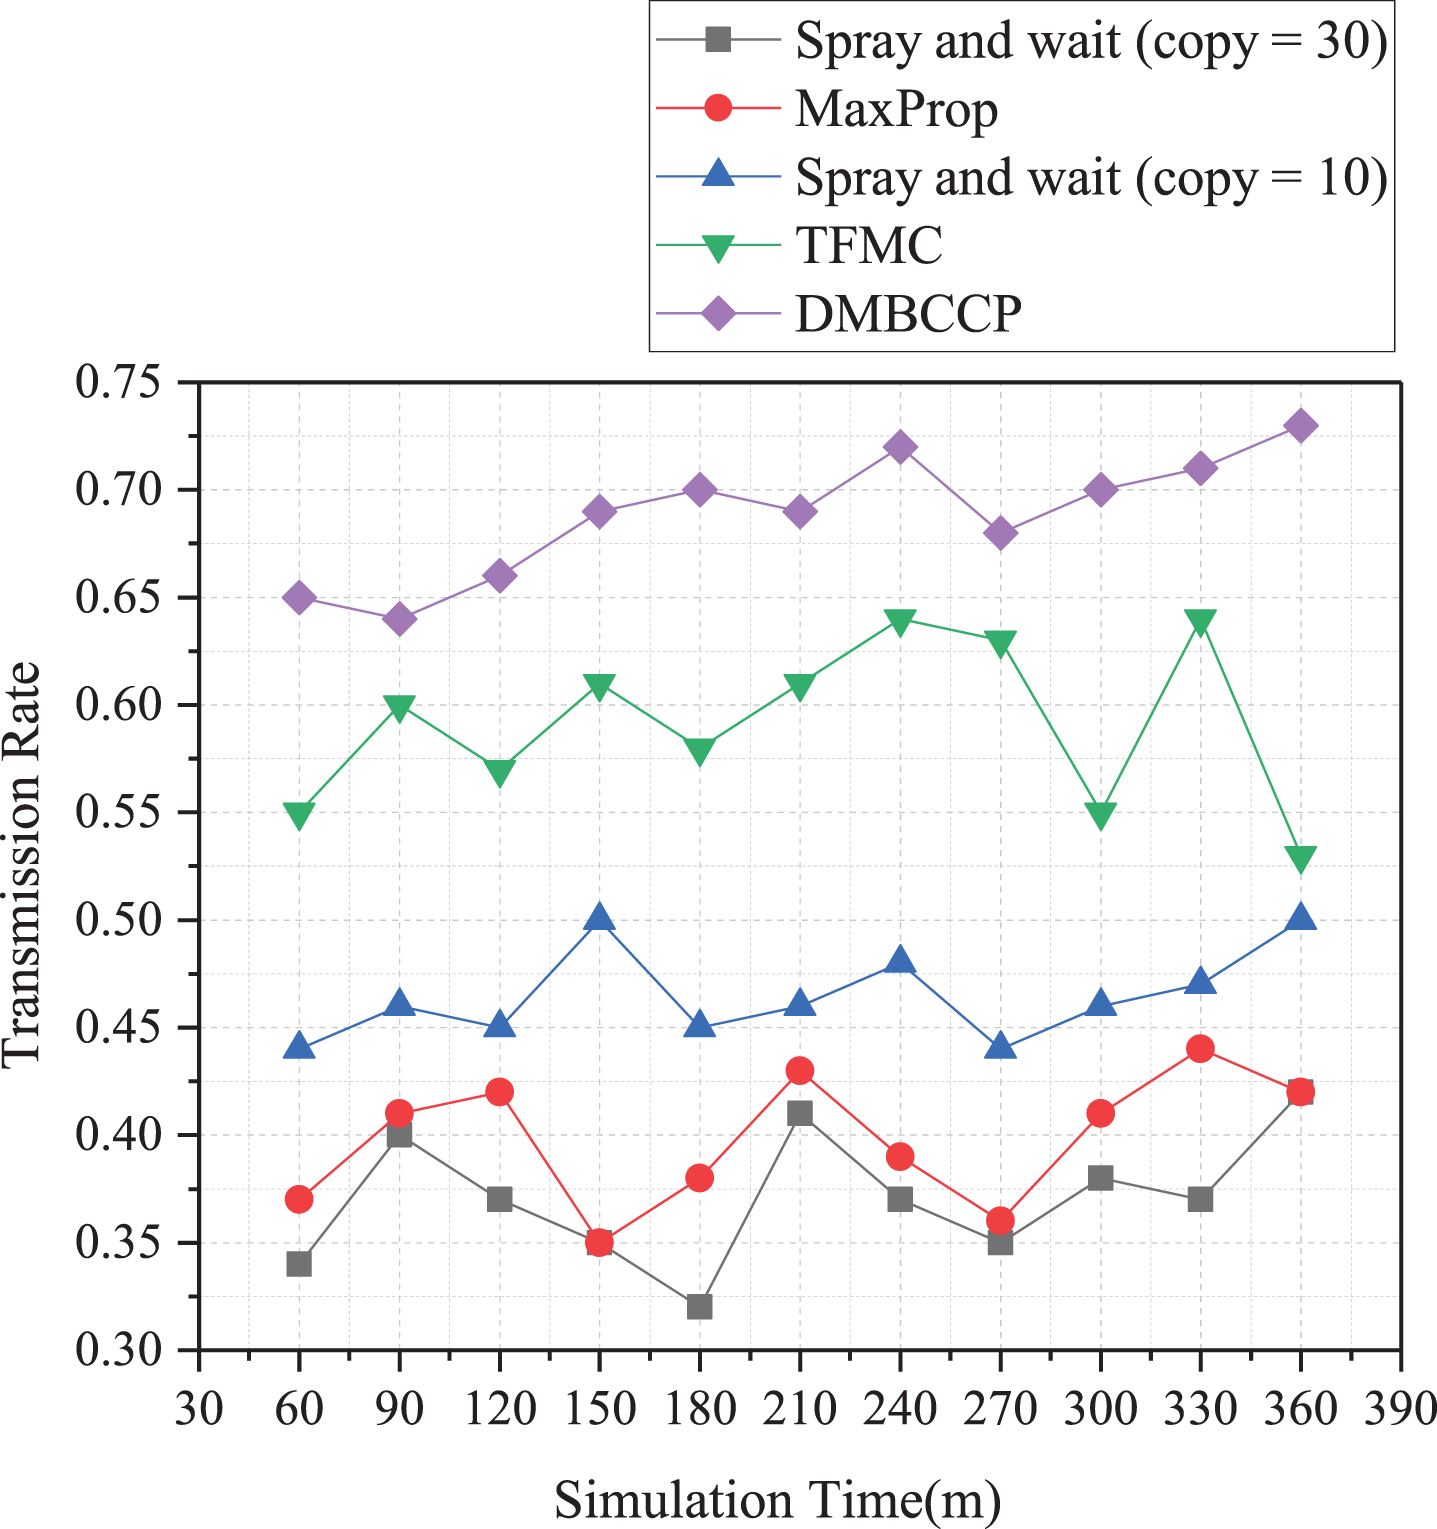
The relationship between the transmission rate and the simulation time is shown in Fig. 6. The routing algorithm with the lowest transmission rate is Spray and wait (copy = 30) with a transmission rate of 0.32–0.41 and MaxProp with a transmission rate of 0.35–0.43. Because these two algorithms use flooding methods to transmit information to nodes directly, it will cause much information to be lost in the community. The Spray and wait (copy = 30) algorithm will copy duplicate information, significantly reducing the transmission rate. In Spray and wait (copy = 10), the transmission rate is increased to 0.43–0.51 due to the reduction of copy information. TFMC algorithm uses fuzzy hierarchy to determine the best information transfer node, which improves the sending and receiving of adequate data, and its transmission rate is 0.53–0.64. The DMBCC algorithm uses community clustering to design a more efficient data transmission model, with a transmission rate of 0.65–0.72. The transmission rates of TFMC and DMBCC algorithms are relatively better, both reaching more than 50%.
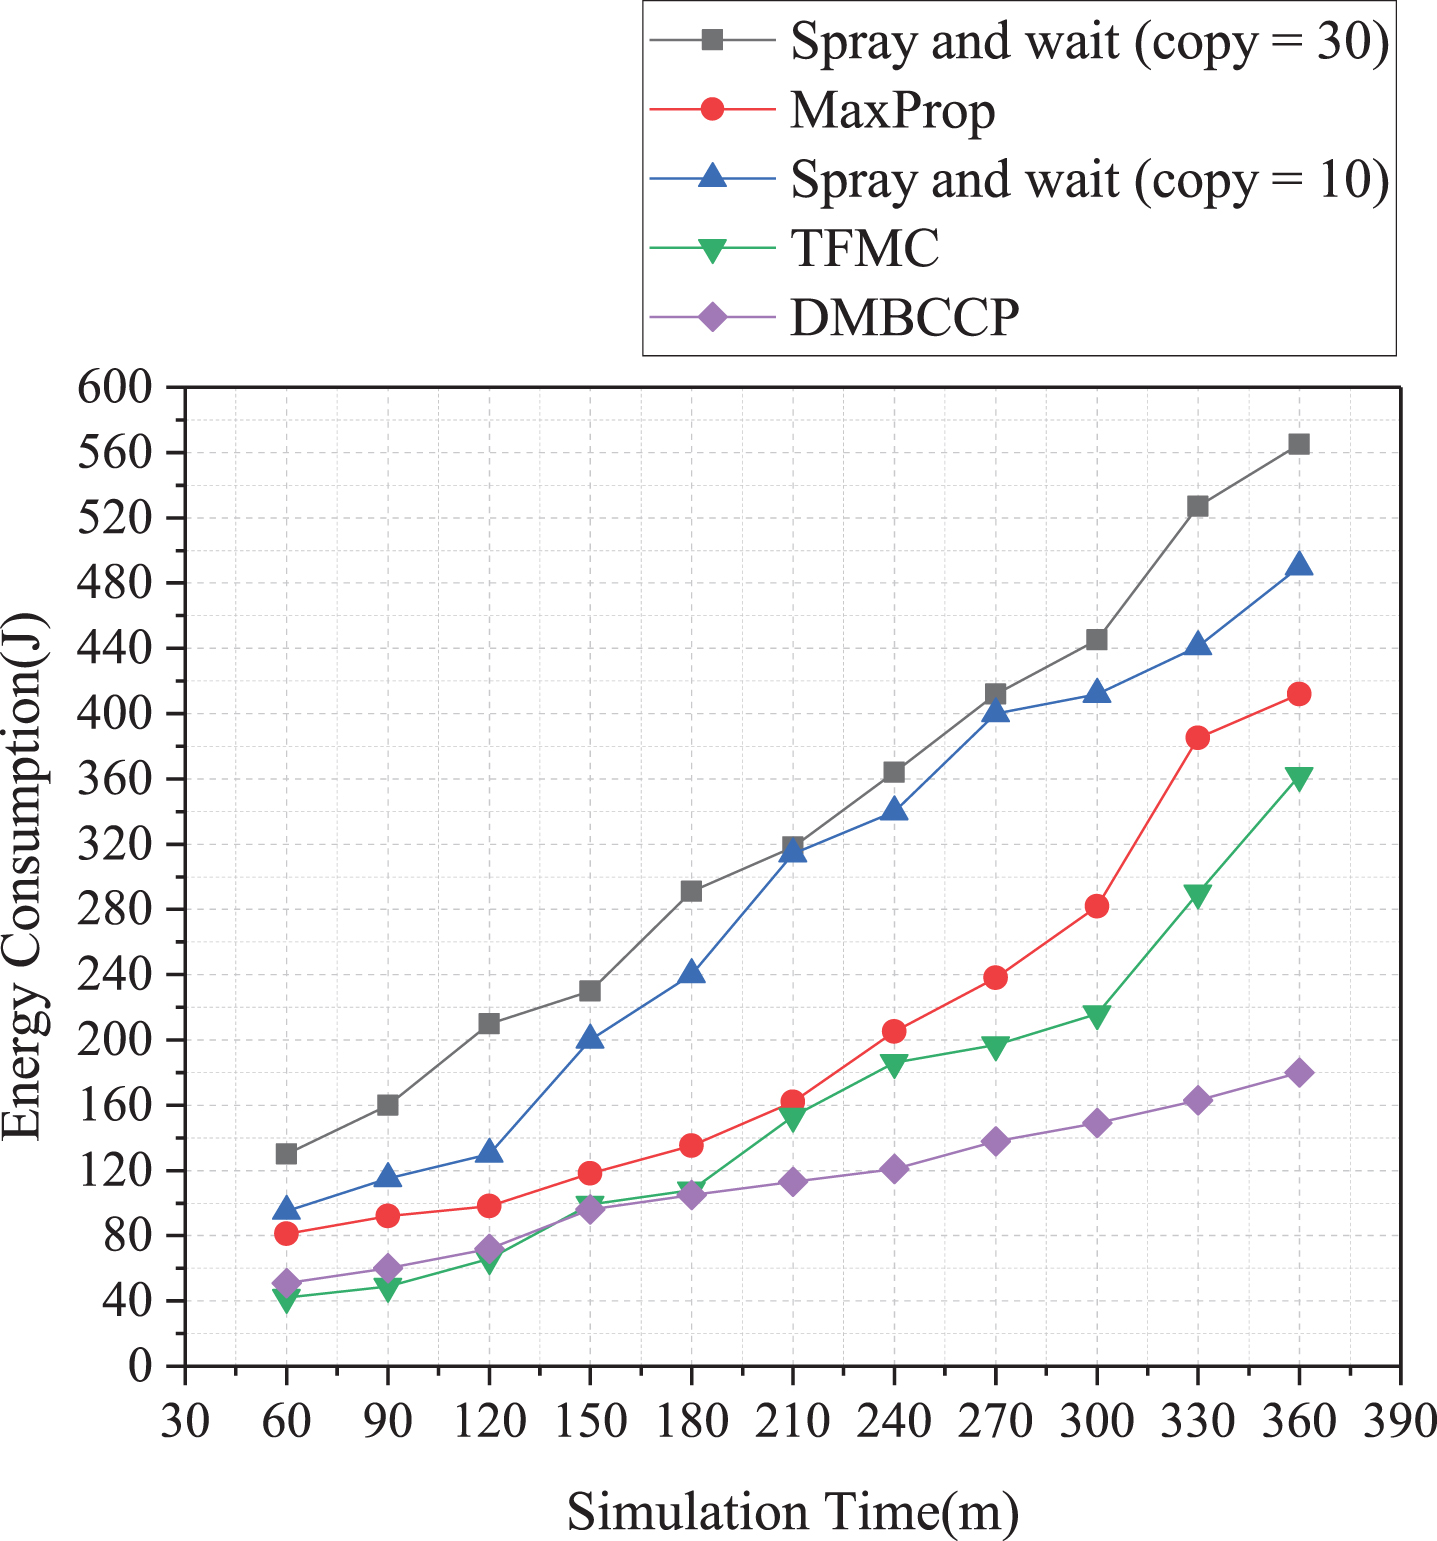
Figure 7 shows the process of energy consumption changing with simulation time. More precisely, energy consumption increases with time. Among them, the Spray and wait algorithm’s energy consumption is the highest, reaching its peak of 560 at 360 m in the simulation time. The reason is that each node needs to transmit data through Spray. The energy consumption of the MaxProp algorithm is better than that of the Spray and wait algorithm. Because only a single copy of the data to be transmitted is performed, the energy consumption of the TFMC algorithm is better than that of the MaxProp algorithm. The energy consumption of the DMBCC algorithm is the lowest among the four routing algorithms, accounting for only 71% of the MaxProp algorithm and 49% of the Spray and wait algorithm. In data transmission, multiple communities participate in it, which prolongs the data transmission time of the node, thereby reducing the number of data transmissions of the source node.
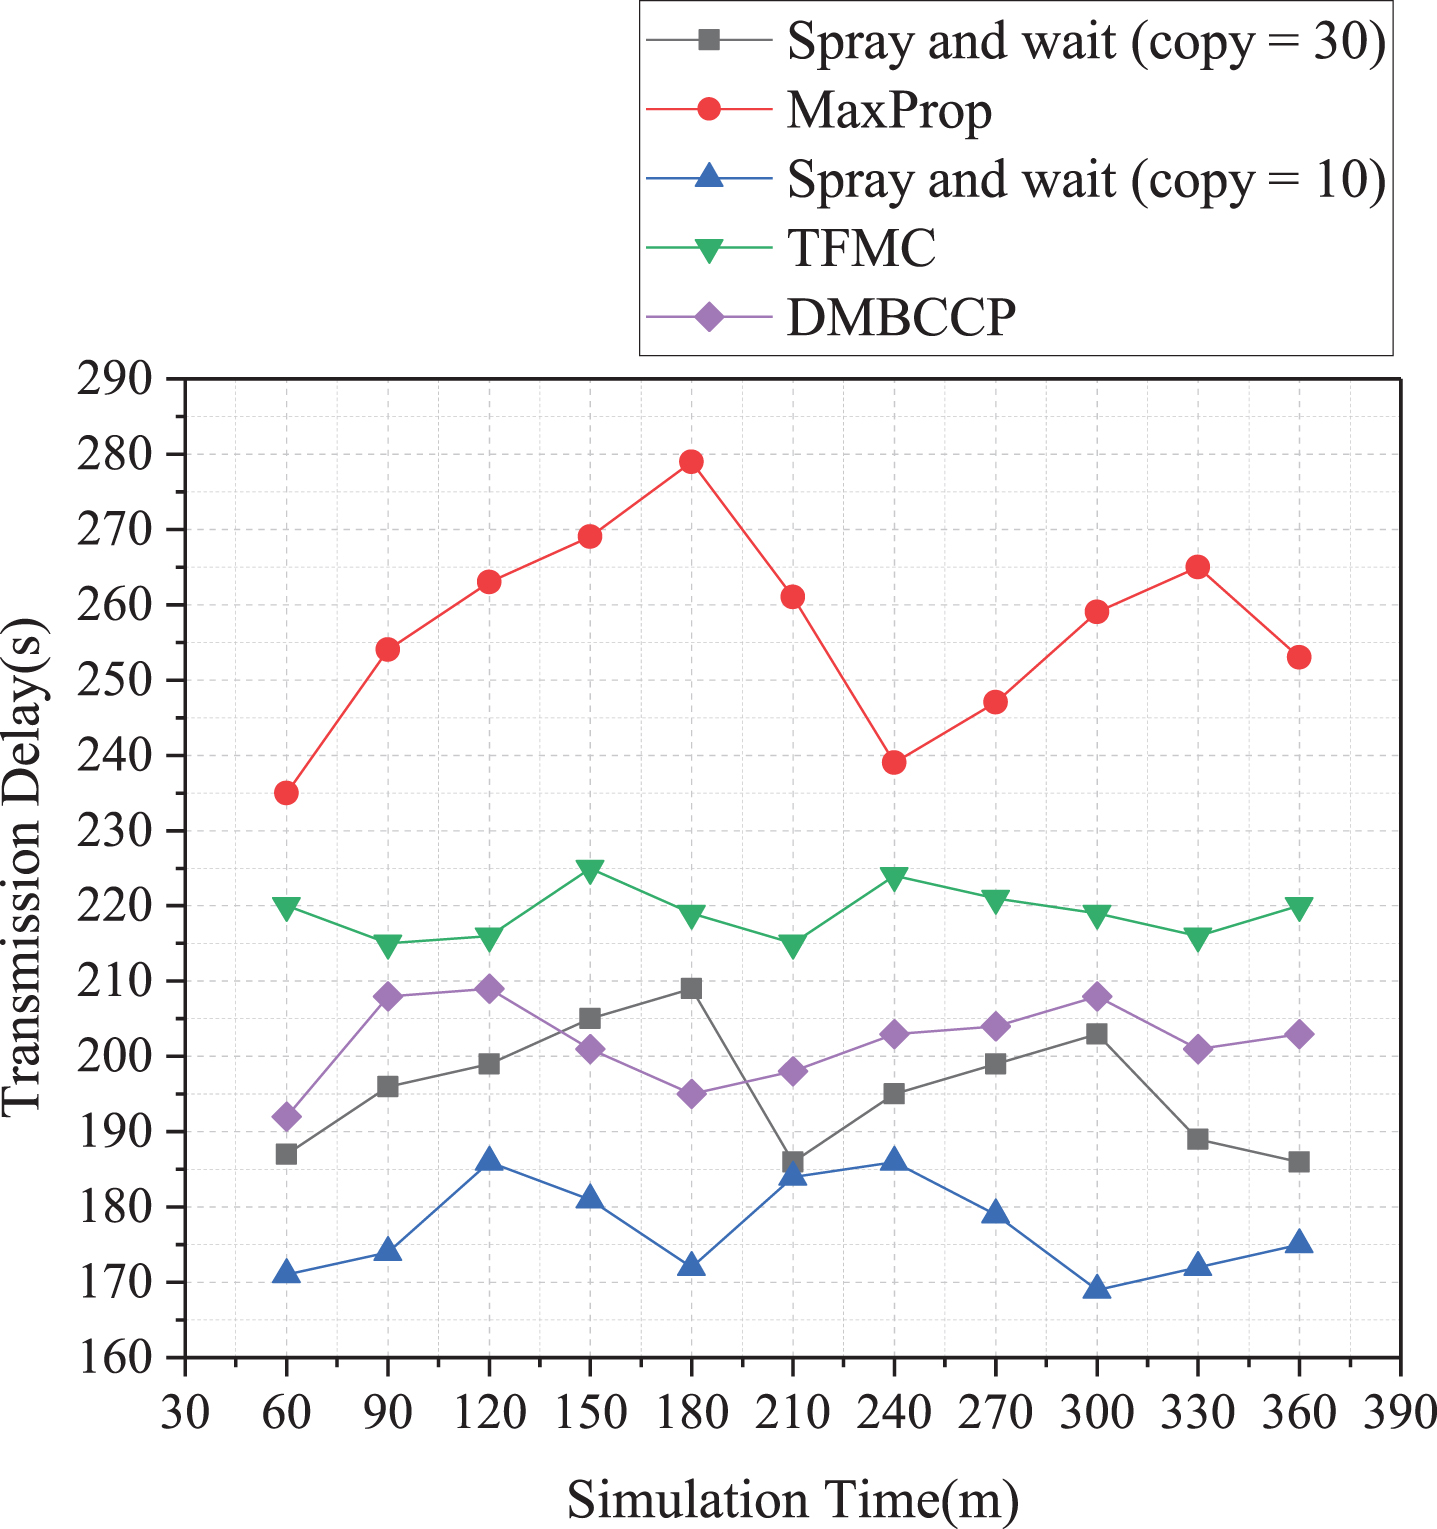
The relationship between transmission delay and simulation time is shown in Fig. 8. Among them, the routing algorithm with the highest average transmission delay is the MaxProp algorithm. Because it adopts the encounter delivery method, there is a certain degree of randomness. Many replicated data is transmitted in the community, resulting in higher transmission delays, with an average delay time of up to 263 s. Although the TFMC algorithm uses controlling the frequency of information transmission, there is still a relatively high time delay, and the average transmission delay is 220 s. As shown from the figure, the MaxProp algorithm is a high-latency algorithm in the community partition model because the data transmission between communities consumes many network resources, resulting in a high average delay of the entire algorithm. Hence, the average transmission delay of the DMBCC algorithm is higher than Spray and wait algorithm, and its value is 202 s. Among the four routing algorithms, the Spray and wait algorithm’s average transmission delay is the lowest, so the information diffusion ability is the strongest.
Figure 9 shows how the network overhead changes with the simulation time. In Fig. 9, the network overhead of the DMBCC algorithm fluctuates between 111–120 on a small scale and is not affected by time. The reason is that as time increases, the community clustering system is gradually improved, and more and more nodes participate in information transmission, the sharing of information is significant, and network overhead tends to be stable. The TFMC algorithm reduces the problem of network overhead by controlling the frequency of information transmission. The maximum network overhead appears at the simulation time of 180 m, reaches 154, and then gradually decreases. It can be seen that the routing delay problem is minor. The Spray and wait (copy = 30) algorithm has the highest network overhead, and the MaxProp algorithm has the highest network overhead. The MaxProp algorithm is close to the Spray and wait (copy = 10) algorithm, and the values vary between 141–220. These two algorithms are relatively stable, but there are local flooding phenomena, which are not suitable for community models to a certain extent.
In general, the DMBCC algorithm is superior to other algorithms participating in the comparison in terms of transmission rate, energy consumption, network overhead, etc. The average transmission delay is higher than that of the Spray and wait algorithm. In a natural environment, the DMBCC algorithm is superior to other algorithms in the long-term data transmission process.
When data packets are transmitted in the virtual community, there are often multiple data transmission methods, and the nodes in the community are also constantly moving. Therefore, in this simulation experiment, three mobile models will be used to verify the DMBCC algorithm’s performance. They are SPMBM (Shortest Path Map-Based Movement), random way point (RWP), and random walk (RM) models [39].
The trend of the transmission rate changing with the simulation time is shown in Fig. 10. Among them, the mobile model with the most significant transmission rate is the SPMBM model, which is roughly on the rise, with a simulation time of 360 m reaching 0.665. The transmission rate of the RWP model is higher than that of the RM model and reaches a peak value of 0.626 at 270 m. The RM model trend is in the shape of a mountain, reaching a peak of 0.575 at 240 m.
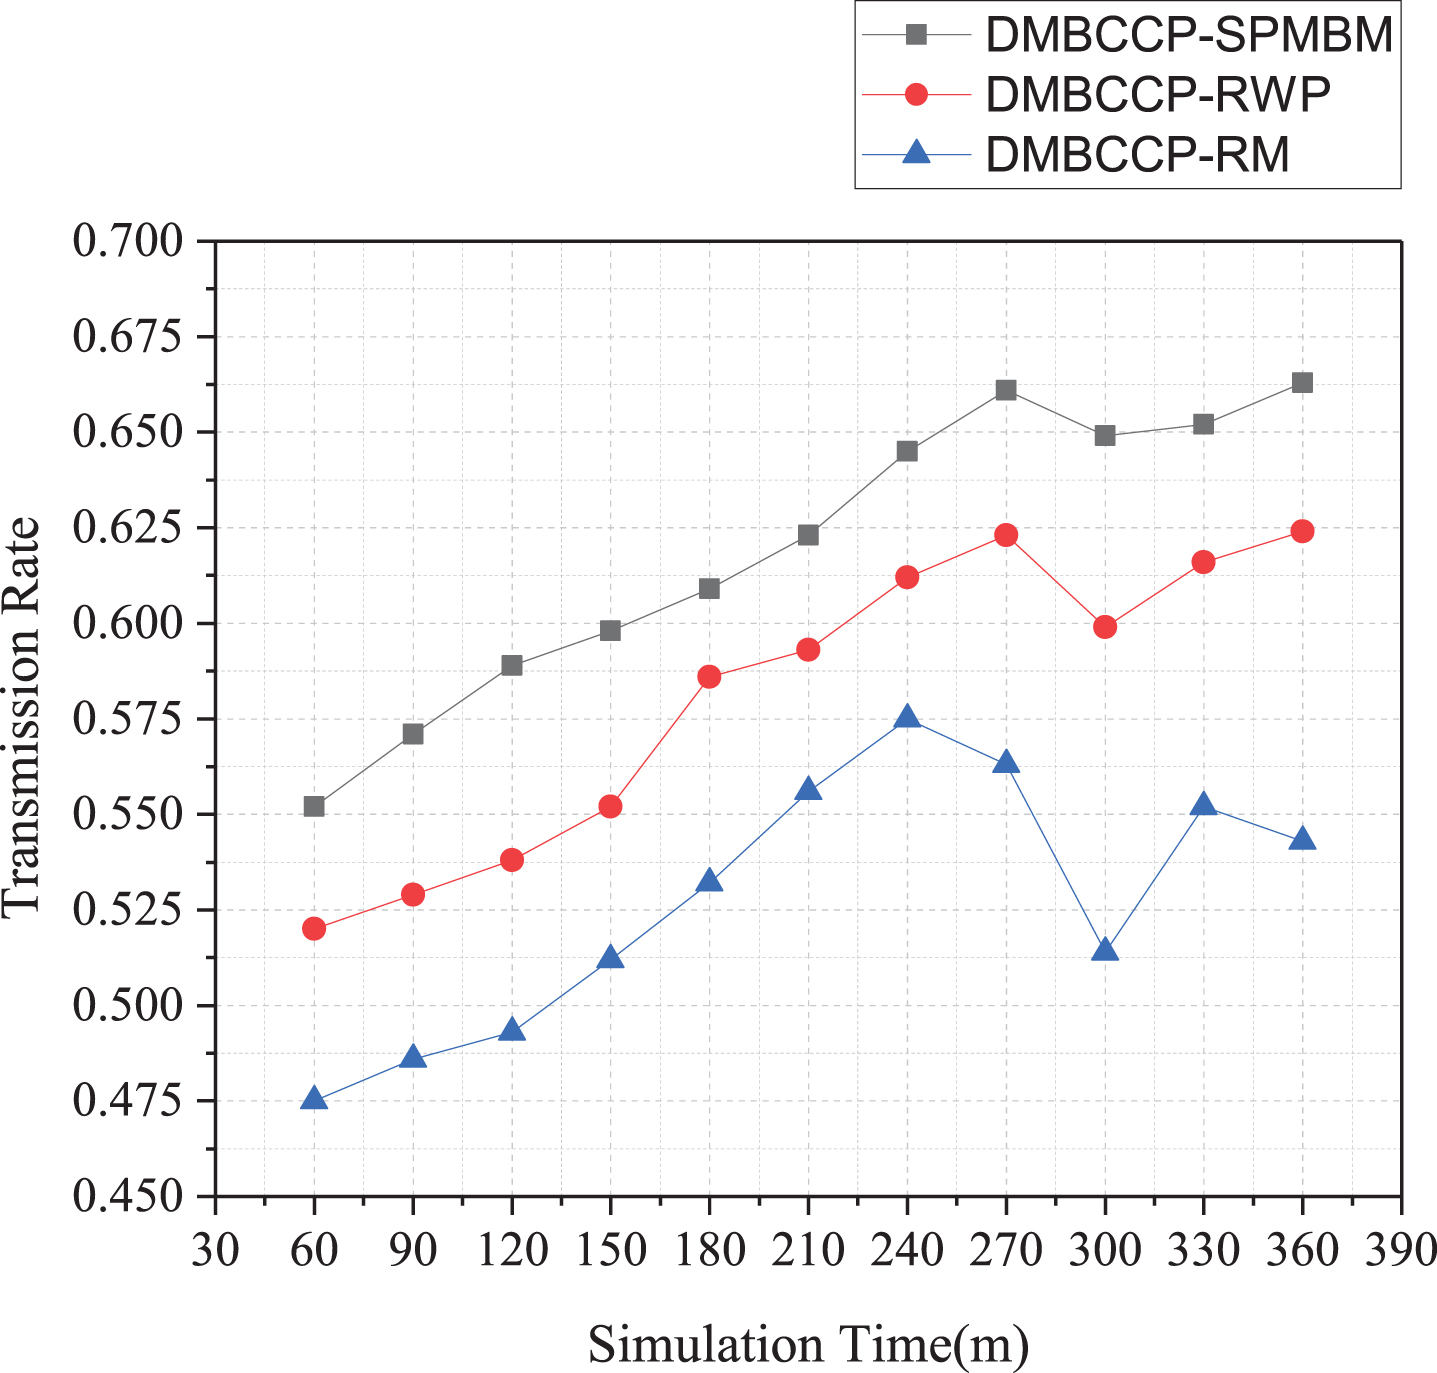
Relationship between transmission rate and time in three mobile models.
Figure 11 shows the network overhead of the DMBCC algorithm under different mobility models. The figure shows that the network overhead of the DMBCC algorithm under the three mobile models is close, and they all vary between 104–121. Because the DMBCC algorithm uses community clustering to share data, with the movement of nodes and the continuous progress of the community clustering process, the larger the data sharing area, which is helpful to reduce network overhead. Experimental results show that the SPMBM mobile model has advantages in data transmission.
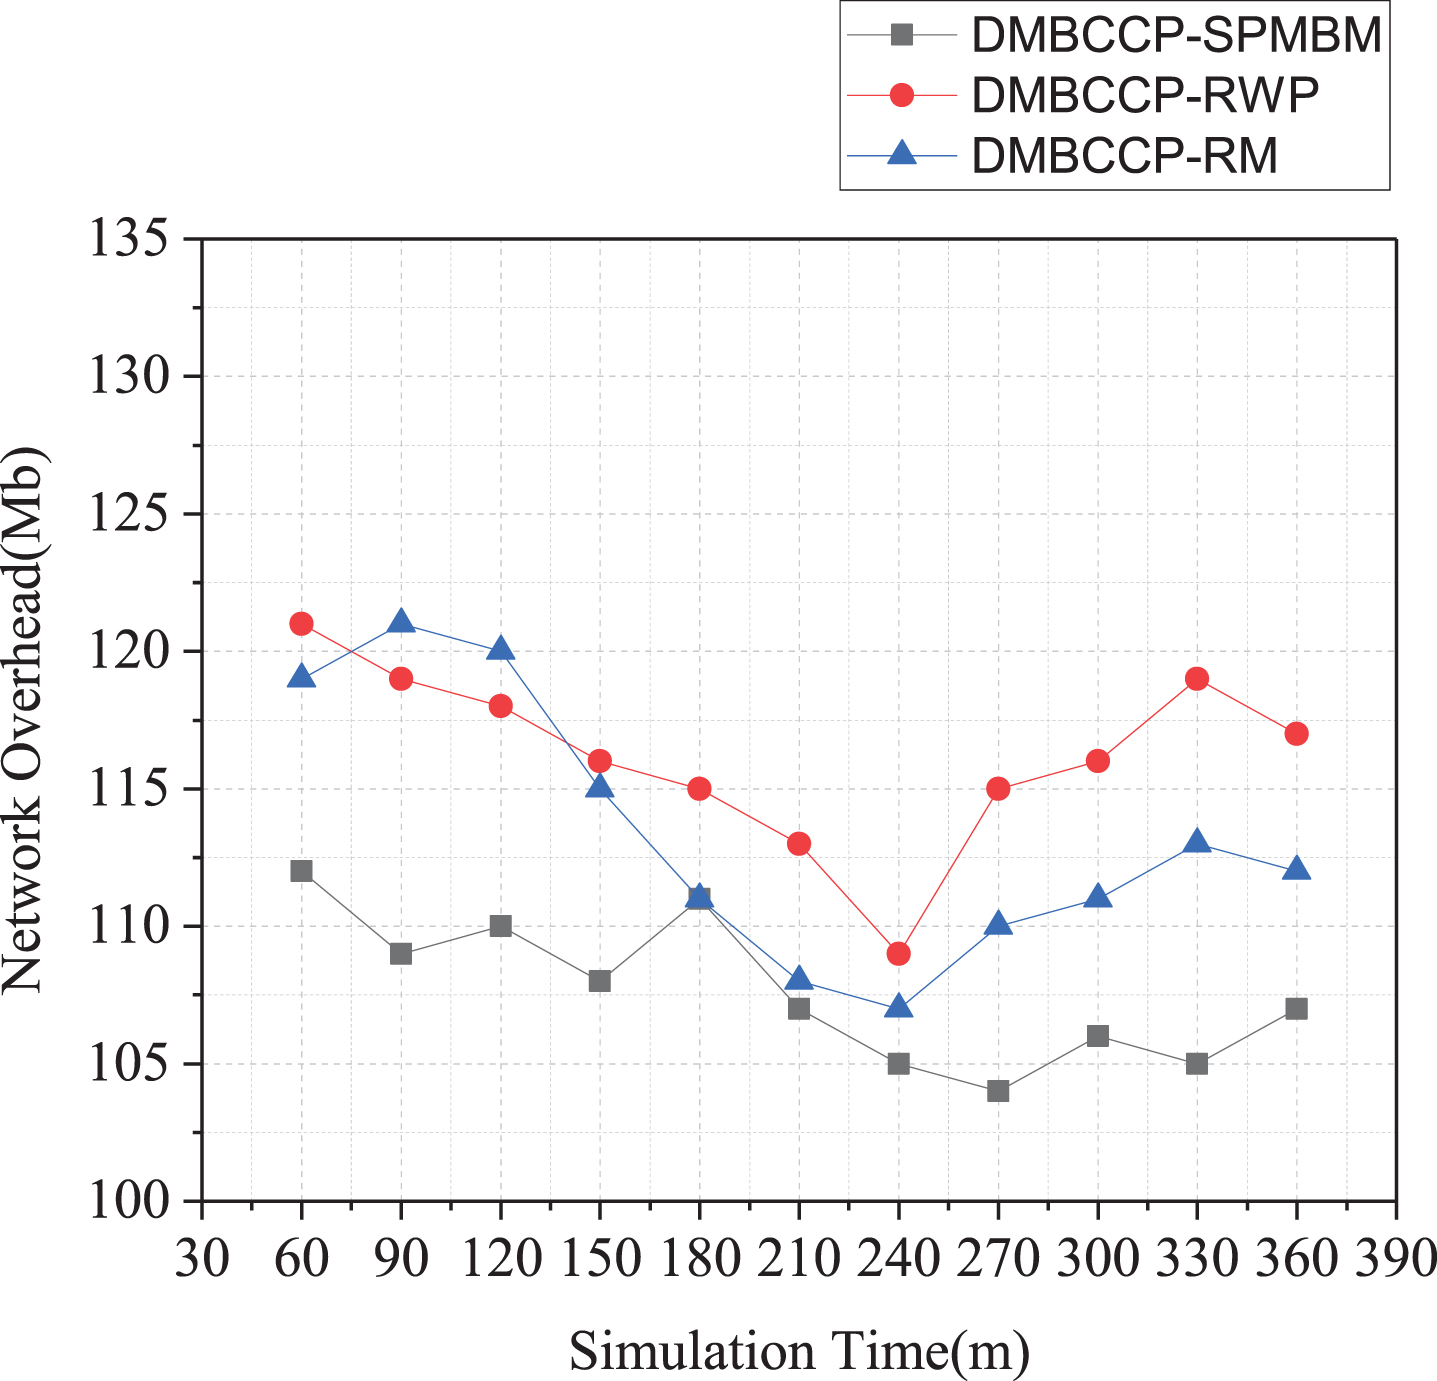
Relationship between network overhead and time in three mobile models.
In opportunistic networks, the cache space and the number of nodes will also affect the routing algorithm’s transmission efficiency. This paper focuses on studying each routing algorithm’s performance under different caches, combining four metrics to illustrate. The specific experimental results are shown in Figs. 12–15.
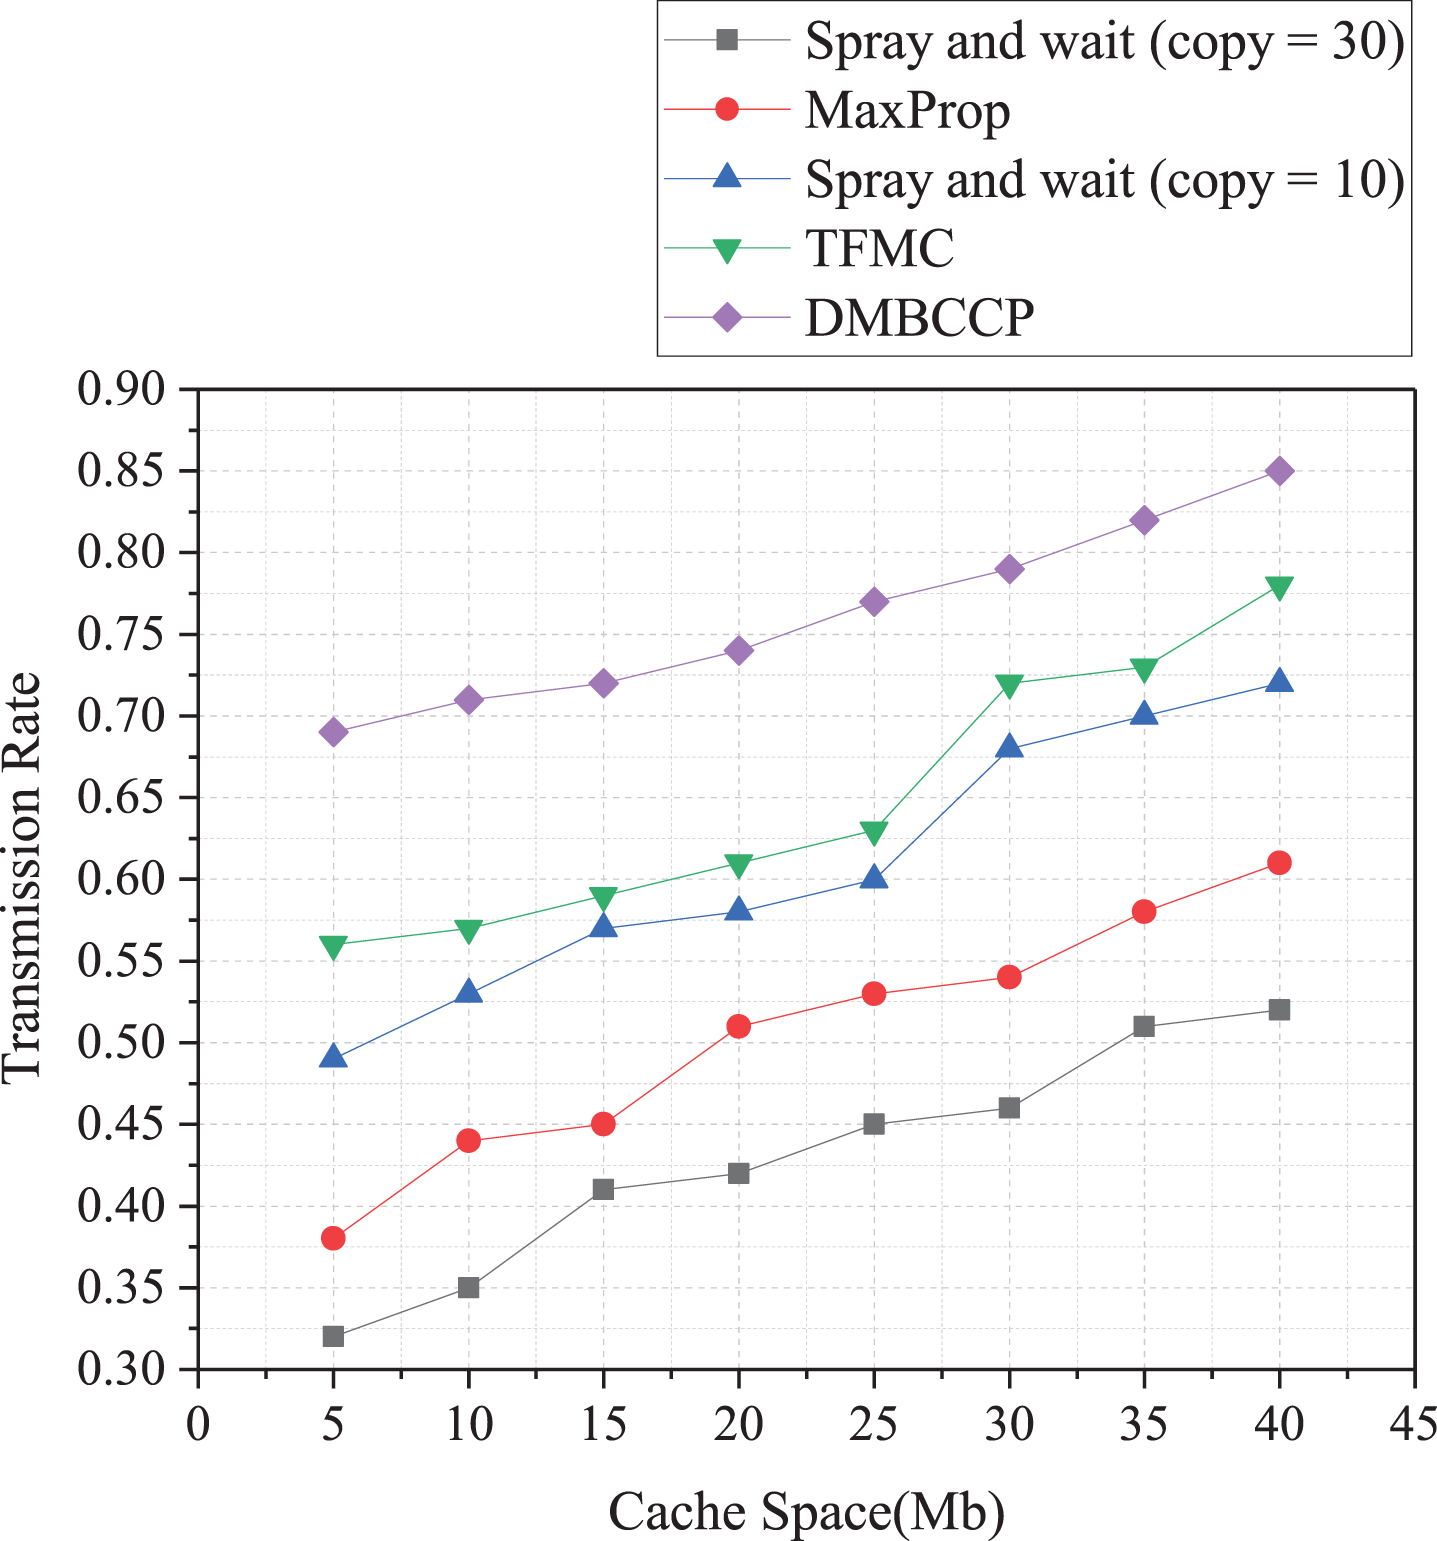
Relationship between transmission rate and cache space.
Relationship between energy consumption and cache space.
Relationship between transmission delay and cache space.
Relationship between network overhead and cache space.
The relationship between the transmission rate and the buffer space is shown in Fig. 12. Among them, the DMBCC algorithm has the highest transmission rate, with a value between 0.68 and 0.85. The reason is that the DMBCC algorithm uses the community clustering method for information sharing when the node cache is increased, which is beneficial to improve the transmission rate of the algorithm. The data transmission conditions of Spray and wait (copy = 10) and TFMC algorithm have been improved, so there is a higher transmission rate, both above 48%. The Spray and wait (copy = 30) algorithm replicates many data copies and uses flooding for data transmission, resulting in a large amount of data loss, which dramatically affects the data transmission rate, just only 0.31–0.51.
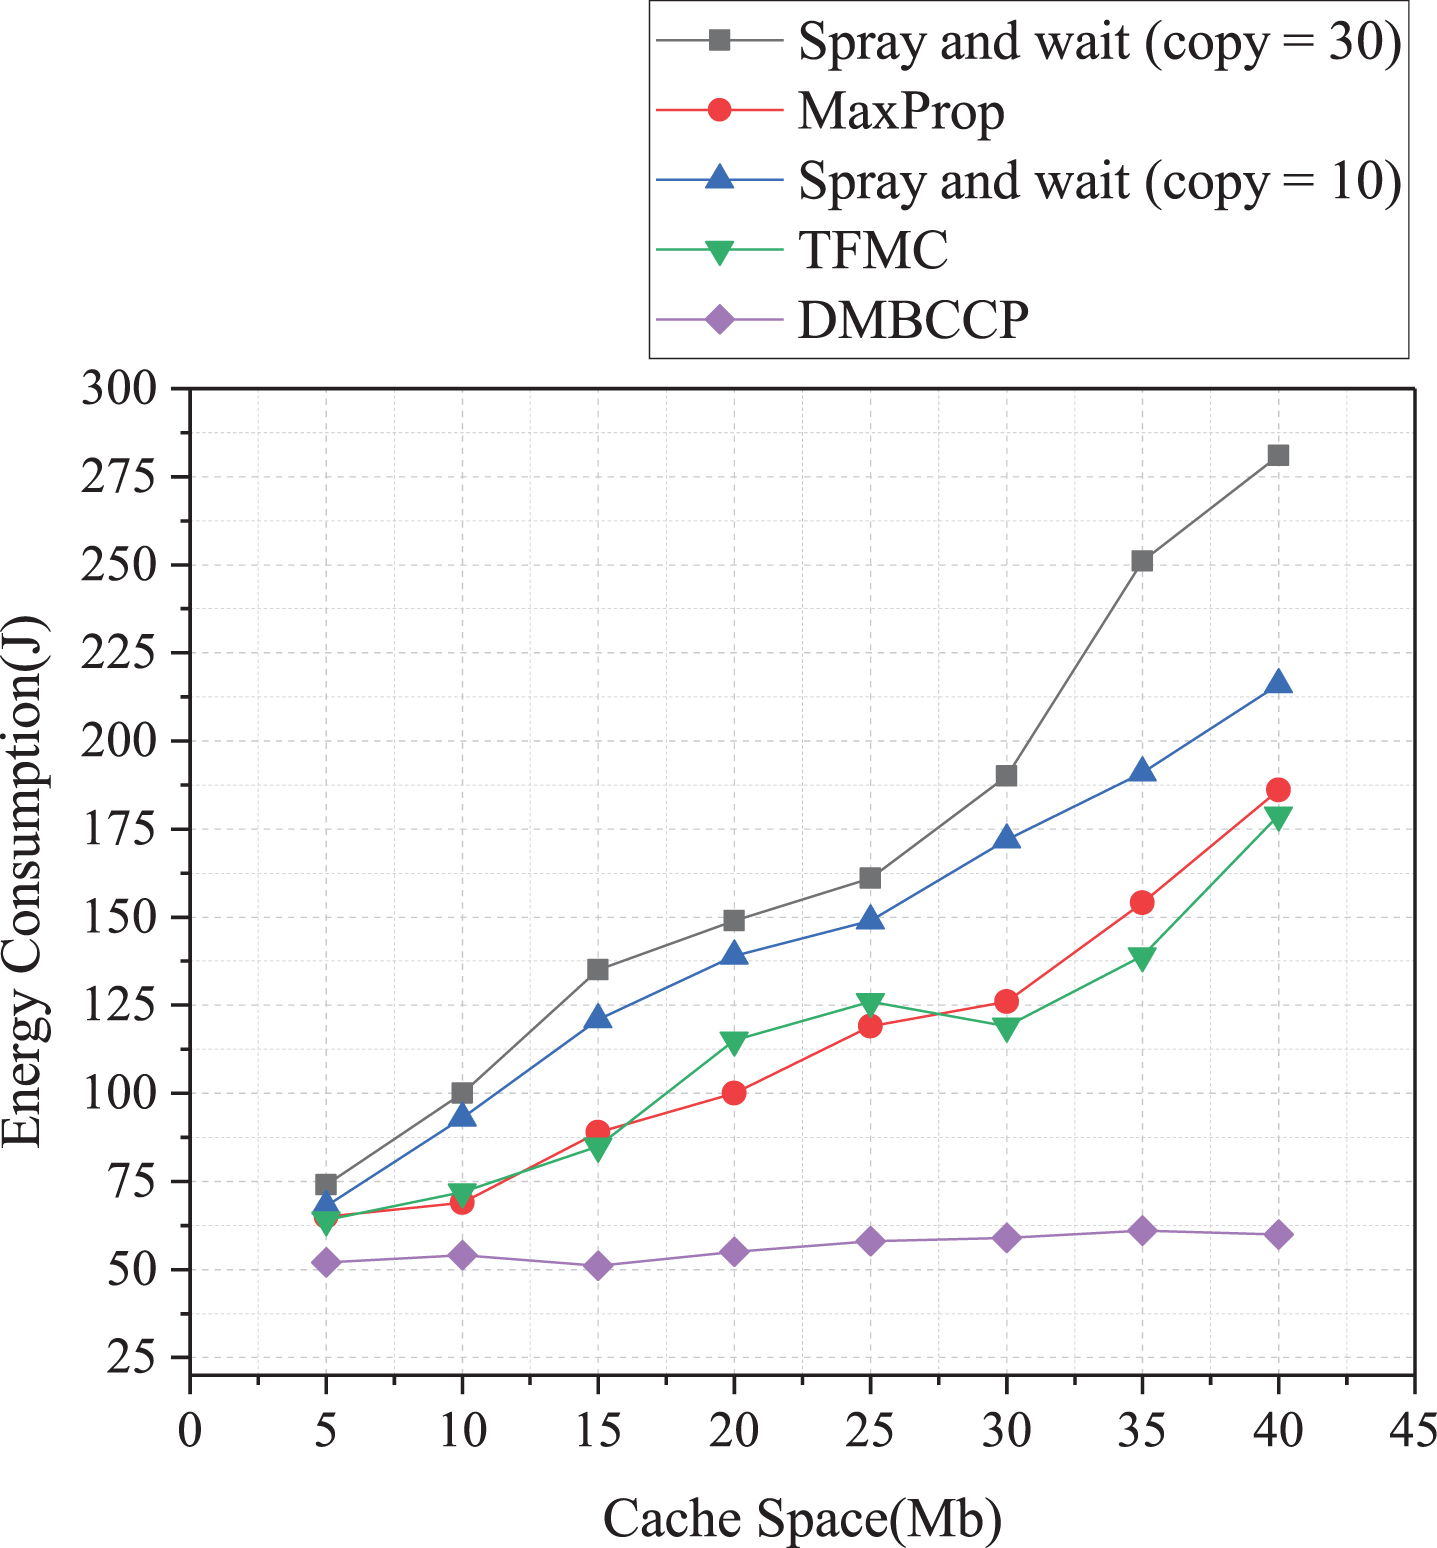
Figure 13 shows how the energy consumption varies with the cache space. It can be seen from the figure that only the energy consumption of the DMBCC algorithm is relatively stable, maintained at about 50. In contrast, other algorithms’ energy consumption increases sharply with the increase of the cache space because the DMBCC algorithm uses a community clustering method to share data, which is beneficial to reduce energy consumption.
The spray and wait algorithm’s energy consumption is the largest, especially under the condition of copy = 30, and it reaches the peak of 275 when the cache space is 40. The reason is that the algorithm transmits data to all neighboring nodes through the spray operation, which consumes much energy. The MaxProp and TFMC algorithms’ energy consumption is nearly the same, both adopting the method of single data copying, and the energy consumption is slightly better than that of the Spray and Wait algorithm.
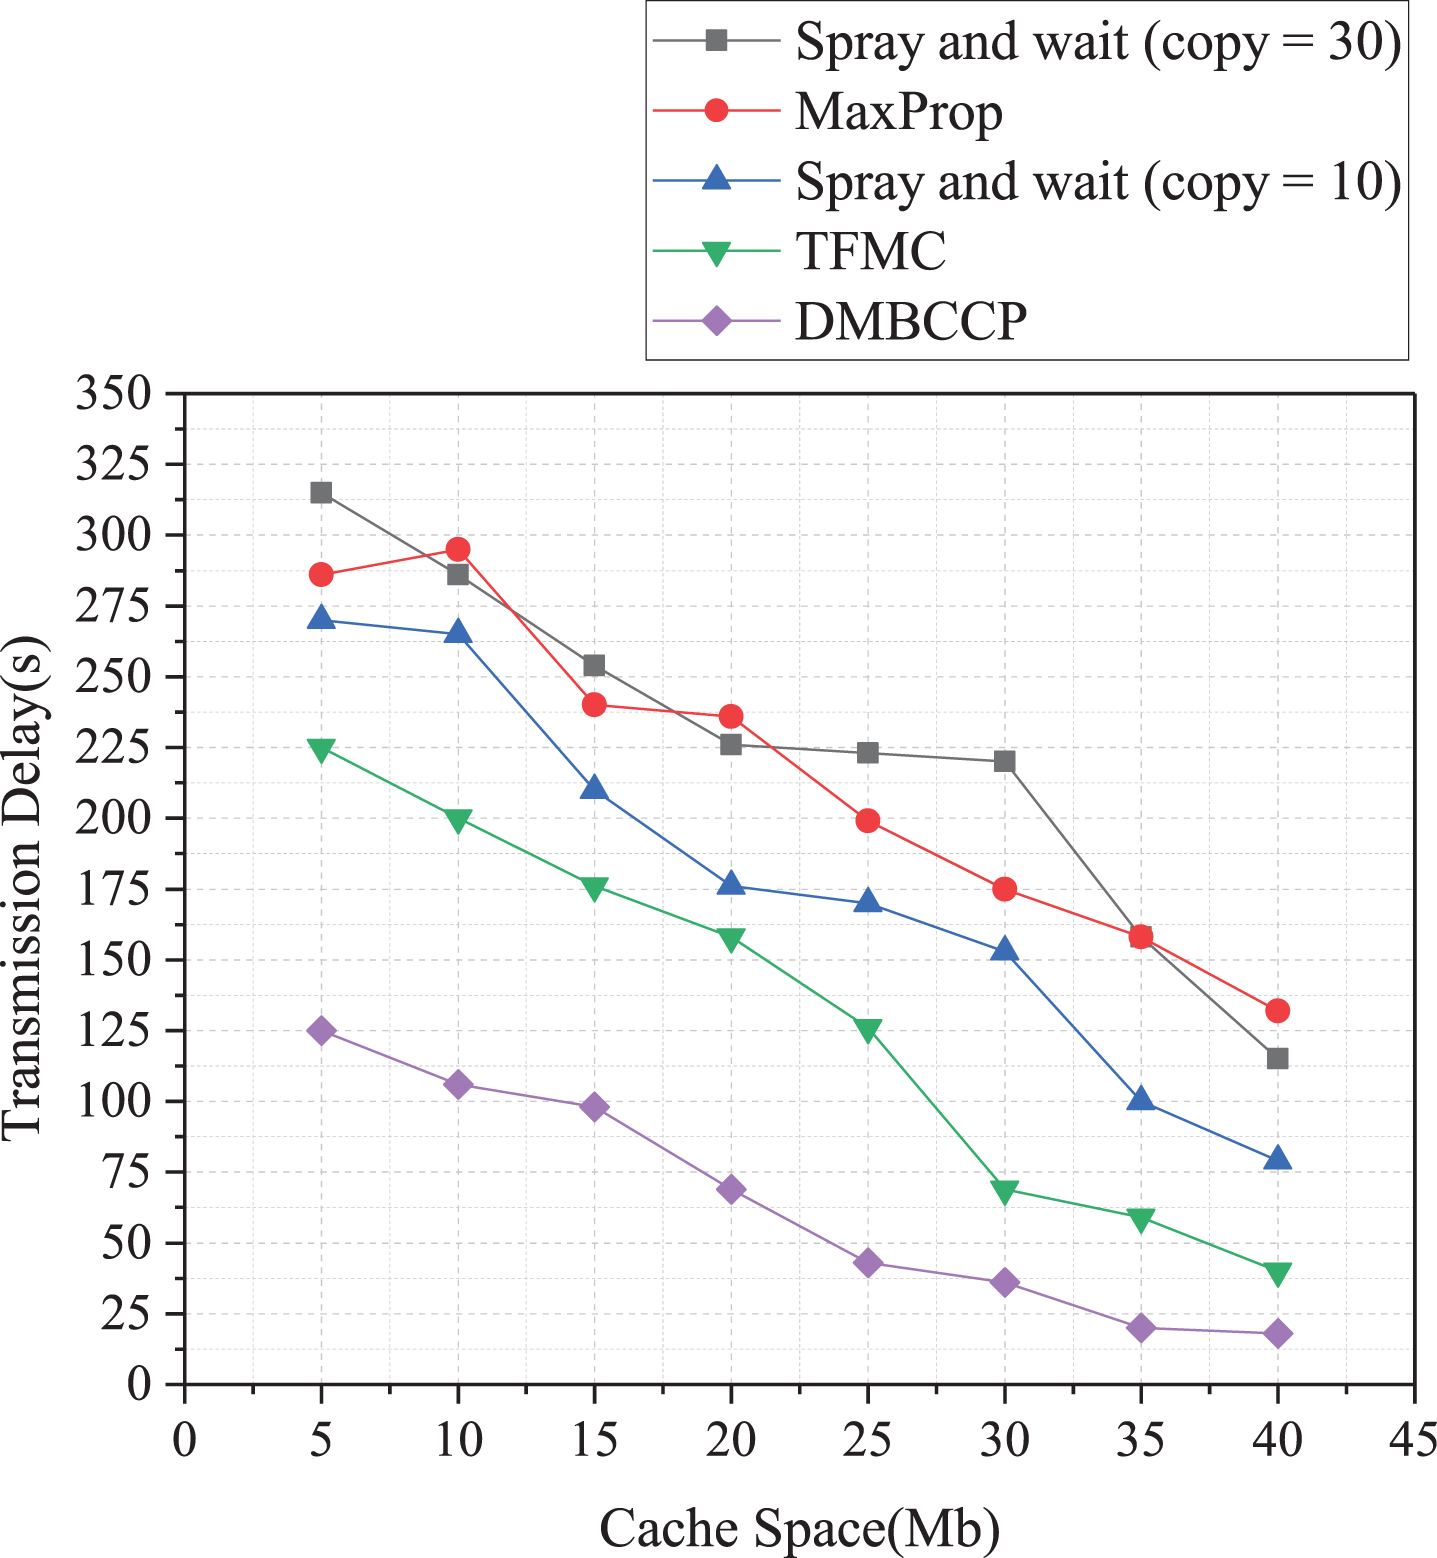
The relationship between transmission delay and cache space is shown in Fig. 14. Generally speaking, the larger the buffer space, the lower the average transmission delay. The transmission delay of the Spray and wait (copy = 10) algorithm is reduced from 220 to 80; the transmission delay of the MaxProp algorithm is reduced from 200 to 82; the transmission delay of the TFMC algorithm is reduced from 180 to 50. The time delay of the DMBCC algorithm is relatively stable, from 50 to 40. The results show that the transmission delay can be reduced by increasing the cache space of nodes.
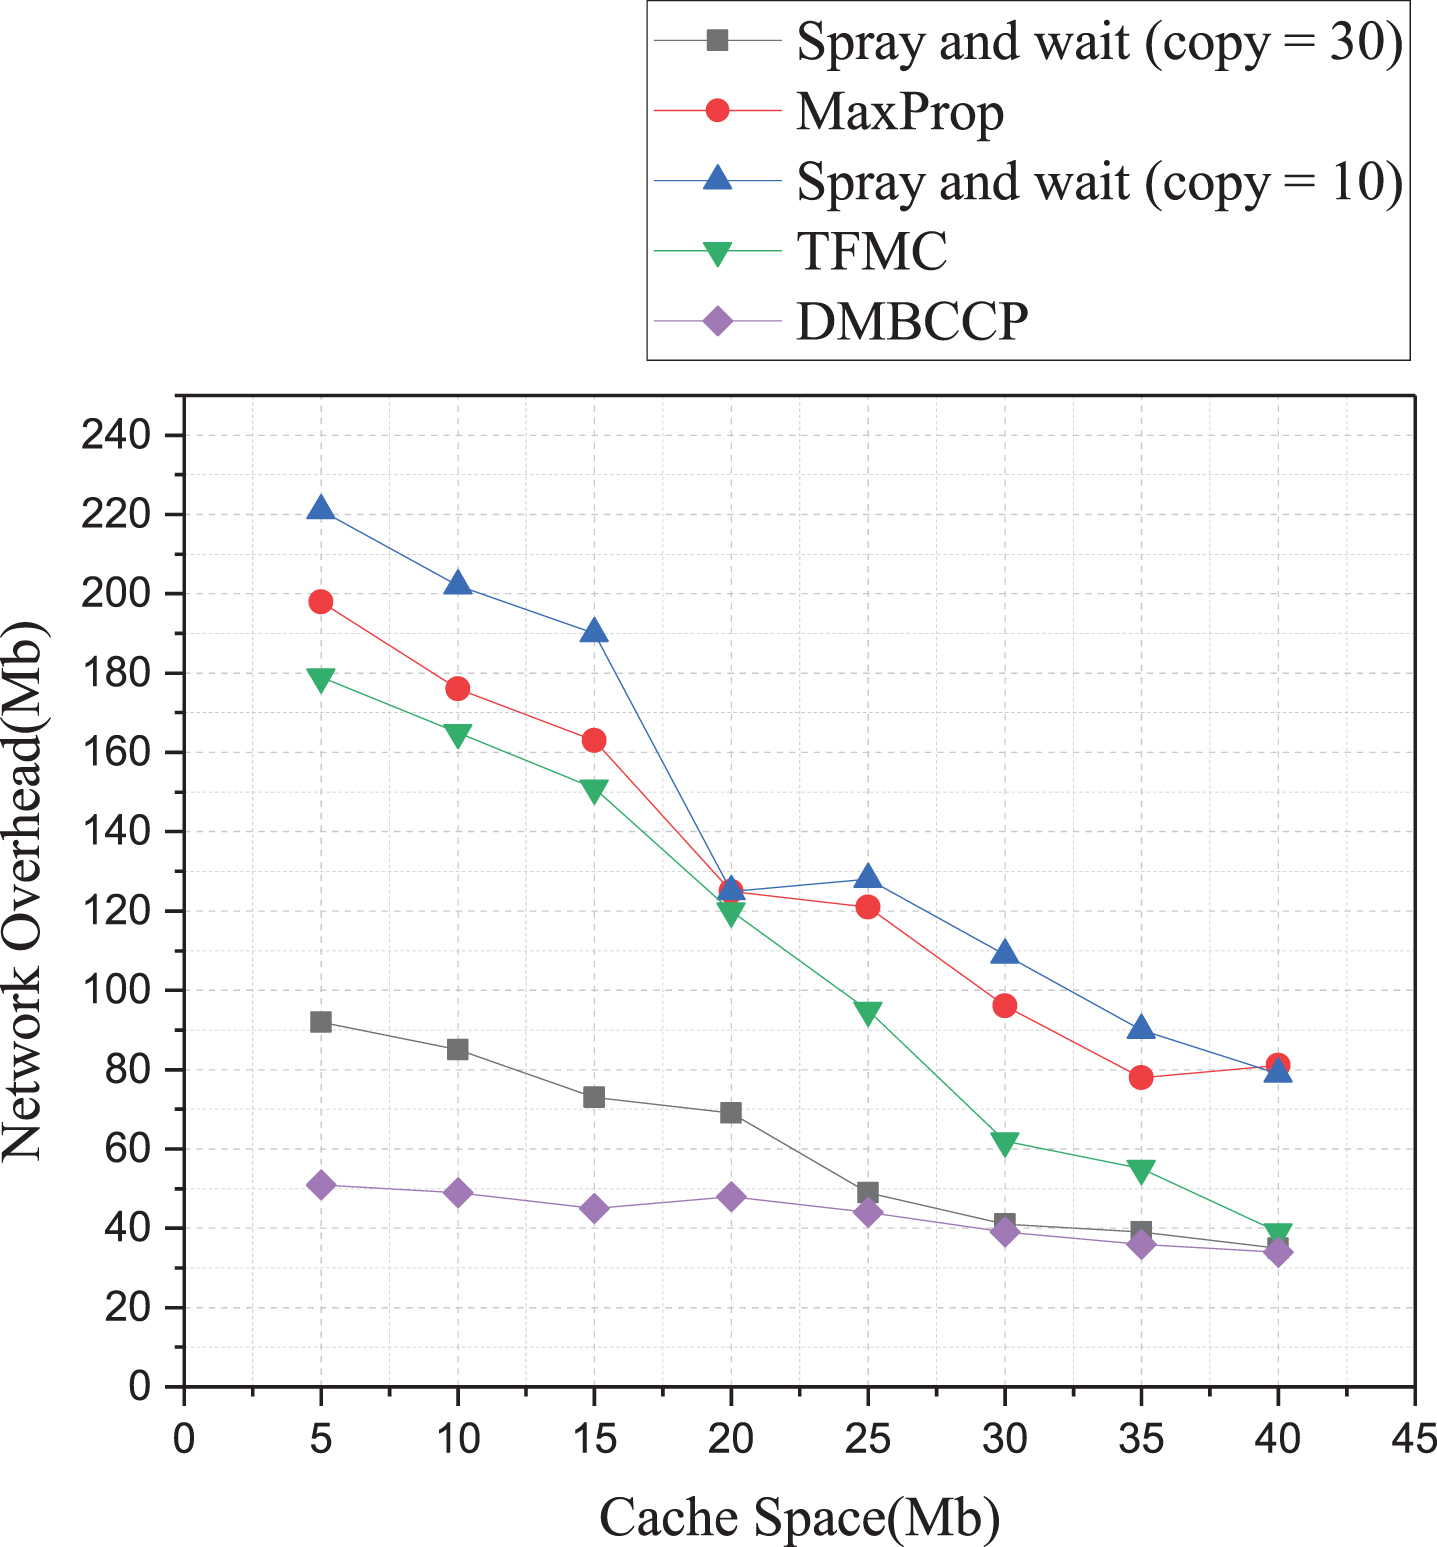
Figure 15 shows how the network overhead varies with the cache space. More specifically, the network overhead of the four routing algorithms decreases with the increase of cache space. The network overhead of the DMBCC algorithm is the lowest, which decreases from 125 to 25; The network overhead of the Spray and wait (copy = 10) algorithm is reduced from 268 to 75; The network overhead of the TFMC algorithm is reduced from 225 to 47. The above three routing algorithms’ values have dropped significantly, indicating that the larger the node cache space, the lower the network overhead of the algorithm. The Spray and wait (copy = 30) and MaxProp algorithms also showed a roughly downward trend, and the data packet loss rate was low. The results show that increasing the cache space of nodes helps reduce the network overhead of the algorithm.
Comparing the DMBCC algorithm with other routing algorithms and using three mobile models to verify the stability of the DMBCC algorithm proves that the DMBCC algorithm has good performance in terms of transmission rate, energy consumption, network overhead, and transmission delay.
This paper proposes a data transmission model that clusters and divides network communities, introduces the critical social attributes of nodes into the community division, shares information within the cluster of users, and effectively solves excessive load on some nodes. Compared with the existing routing algorithms through simulation experiments, it is proved that this method can reduce network overhead and energy consumption and improve data transmission efficiency.
In future work, we will pay attention to extensive data research, use the significant data analysis results of users to use social media to extract users’ social attributes more intelligently, and explore more effective data transmission schemes.