
Abstract
Accurate prediction of traffic flow is of great significance for alleviating urban traffic congestions. Most previous studies used historical traffic data, in which only one model or algorithm was adopted by the whole prediction space and the differences in various regions were ignored. In this context, based on time and space heterogeneity, a Classification and Regression Trees-K-Nearest Neighbor (CART-KNN) Hybrid Prediction model was proposed to predict short-term taxi demand. Firstly, a concentric partitioning method was applied to divide the test area into discrete small areas according to its boarding density level. Then the CART model was used to divide the dataset of each area according to its temporal characteristics, and KNN was established for each subset by using the corresponding boarding density data to estimate the parameters of the KNN model. Finally, the proposed method was tested on the New York City Taxi and Limousine Commission (TLC) data, and the traditional KNN model, backpropagation (BP) neural network, long-short term memory model (LSTM) were used to compare with the proposed CART-KNN model. The selected models were used to predict the demand for taxis in New York City, and the Kriging Interpolation was used to obtain all the regional predictions. From the results, it can be suggested that the proposed CART-KNN model performed better than other general models by showing smaller mean absolute percentage error (MAPE) and root mean square error (RMSE) value. The improvement of prediction accuracy of CART-KNN model is helpful to understand the regional demand pattern to partition the boarding density data from the time and space dimensions. The partition method can be extended into many models using traffic data.
Keywords
Introduction
Short-term passenger demand forecasting is of great importance to the on-demand ride service platform, which can incentivize vacant cars moving from over-supply regions to over-demand regions [1]. The spatial dependencies and temporal dependencies need to be considered simultaneously, however, which makes short-term passenger demand forecasting challenging due to the constant changes of commuting, parades, road work, weather, special events, and other factors in the urban space. These highly dynamic factors in urban space mean that the spatio-temporal variation in the demand for taxis also has high dynamic characteristics [2]. The temporal and spatial characteristics of taxi demand and the unbalanced temporal and spatial distribution of taxis in the transportation network lead to a mismatch between the supply and demand of taxis. For example, in time distribution, peak hours usually make it difficult for transportation resources to meet passenger demand, which causes difficulty in taking a taxi and the long waiting time for passengers, as well as a traffic jam; On the contrary, during the flat-peak period, the phenomenon of high empty-load rate and long unloaded time of taxis is common [3]. From a spatial perspective, undersupply and oversupply of taxis in different regions coexist at the same time. These problems have reduced passenger satisfaction and caused environmental pollution and traffic congestion [4]. The difficulties of demand prediction are modeling spatio-temporal dynamics, real-time predictions and feature extraction, which has attracted a lot of interest in recent years.
Thus, some studies for taxi demand based on historical taxi trajectory data forecasting have been investigated in the past decade [5-7]. Previous studies have shown the feasibility of obtaining predictions from historical taxi trajectory data [8-10]. Generally speaking, existing methods for traffic demand prediction can be classified into four types, the first one is regression model. This kind of model uses regression analysis to describe the statistical relationship quantitatively. Wong et al. introduced the congestion factor and then explored the supply and demand of taxis [11]. The second one is time series model, which is built based on the time series data observed by the system, and using curve fitting and parameter estimation to establish a mathematical model for taxi demand. Riza et al. proposed automatic ARIMA model to perform time-series analysis to predict the passenger’s hotspot area based on the spatio-temporal data [12]. Neema et al. proposed a multi-level clustering technique based on time series, which uses the correlation between adjacent geographic phases to reduce prediction errors [13]. Alvarez et al. proposed a system based on the hidden Markov model to predict taxi trip destinations [14]. A CFM combining three-time series prediction methods that can effectively determine the spatiotemporal distribution of taxi passenger demand was proposed [15]. The third one is neural network model, which uses various neural networks for prediction. Bao et al. considered the interaction between subways and taxis based on univariate traffic prediction and applied the residual neural network to predict the taxi demand in different regions [16]. Ishiguro et al. proposed a taxi demand prediction algorithm using real-time demographic data generated by cellular networks and used a stacked denoising auto-encoder to assess the impact of real-time demographic data on taxi demand prediction accuracy [17]. The last one is probability model, Miao et al. collected taxi occupancy status and location data from networked in-vehicle sensors in real time [18]. Yuan et al. proposed a probabilistic model which estimates the profit of the candidate locations for a particular driver based on where and when the driver requests for the recommendation [19]. In general, most studies focus on the prediction using machine learning. Although these deterministic methods (such as regression model and time series model) can significantly improve the verified prediction accuracy, the difficulties in modeling and calculating hinder their practical application to a certain extent. In contrast, artificial neural network and support vector machine models do not need to design complex mathematical models. However, they need time-consuming adjustment in parameter settings. It is easy to ignore the differences of different density series data in the time dimension. It can also be seen that the KNN model is one of the most commonly used methods of nonparametric regression. A number of studies on traffic forecasting have been carried out by adopting the method [20]. However, KNN model is rarely used in taxi demand forecasting.
On one hand, it can be noticed that existing studies focused on mining the regularity of trajectory data to predict traffic demand, while study combining both linear and nonlinear system theories has rarely been investigated. In normal circumstances, taxi density is rarely a pure linear or nonlinear time series. Therefore, it is unreasonable to use a single linear or nonlinear prediction model. Besides, most studies developed the methods by using historical data from the target link. However, the drawback is that, on an urban network, the traffic condition of the target link would be inevitably influenced by that of the adjacent links. The entire spatio-temporal range cannot share the same model due to the uneven distribution of taxi demand in space and time. Few studies take the spatial correlations into account, which cannot be ignored.
On the other hand, in recent years, short-term traffic forecasting has become an important field in intelligent transportation systems (ITS) [1-21]. It helps to attract drivers from regions of oversupply to regions with overfull demand. With the emergence of traffic big data, short-term traffic prediction becomes more challenging and complex, which put forward higher requirements for data modeling.
To address these problems, a fusion forecasting model for taxi demand, which combines CART model and KNN model, is proposed in this study. This proposed model also takes the temporal and spatial heterogeneity and the global fixed defects of the algorithm into consideration, which can feasibly coordinate the spatio-temporal variables and mine the similarity of different links based on historical data. Nonlinear CART model is a method without definite formula. It has good performance in data mining and porting. So new data can be easily added to the model. The KNN model is one of the most commonly used methods of nonparametric regression. Besides, the concentric partitioning method was applied to search for regions with similar spatial patterns. The boarding data is aggregated into different time series to reveal the regularity for demand density with time. Furthermore, the model can provide effective insight into the spatio-temporal distribution of taxi-passenger demand for a 30-min horizon. This has played a huge role in the timely scheduling of taxi resources.
The main contributions of this work are summarized as follows: Considering the global fixed defects of the algorithm, the time series data of demand are taken as the input feature in CART model and autocorrelation is used to mining the similarity between these time series. The demand of taxi is closely related to the spatial location of a region. According to the research on urban land density, the concentric partitioning method is utilized to divide the research area from the spatial dimension. Considering the general situation, taxi boarding density is rarely pure linear or nonlinear time series. Linear and nonlinear system theories is combined in this research.
The remaining parts of the article are organized as follows. Section 2 introduces the framework of the proposed CART-KNN model. Experiments on the New York City taxi TLC dataset are presented in section 3, in which the accuracy of the proposed model are compared with existing models. Finally, conclusions and future work are described in Section 4.
CART-KNN prediction model theory
Sample space definition
It is known that ride prediction can be regarded as a specific traffic flow prediction task. The demand for getting on or getting off the car is equal to the outflow of the starting area and the inflow of the ending area respectively. Therefore, it can be considered that the essence of the demand forecast of taxi is to find a set of corresponding relations composed of input variable X and output variable Y [23], assuming that X and Y are input variables and output variables respectively (the output variable is the demand density of taxi at d
t+1), and X
t
is defined as the feature vector of the demand density at time t, which can be expressed by the following equation:
An individual prediction model usually has its limitations [24], for example, potential associations in various data are easy to be ignored and random factors have a great influence on the model. In recent years, combined model is more and more widely used in forecasting. Fan et al. presented a SVR model hybridized with the empirical mode decomposition (EMD) method and auto regression (AR) for electric load forecasting. The proposed EMDSVRAR model combines the advantages in statistical learning. And greatly coordinates the unbalanced and complex data sets. It not only generates good results with good accuracy and interpretability, but also tolerates more redundant information [25]. In order to overcome the limitation of applying single models, this study tries to comprehensively apply several models, and combines them in an appropriate way into a fusion model, so that better accuracy can be achieved. CART model is efficient and easy to be assembled. KNN model is especially suitable for multi-classification problems without parameter estimation because of the nonlinear relationship between independent variable and dependent variable. Based on this idea, CART model and KNN model were selected as the submodel. Then the fusion model called CART-KNN model is proposed here.
The classic CART model is a decision tree classification method proposed by Breiman in 1984 [32]. It is popularly applied due to the positive ability in solving prediction and classification problems [26-27]. The CART decision tree is a binary tree. Each interior node matches to an input variable and is divided into children nodes according to the value of the input variable [28]. By dividing each feature recursively, the feature space is divided into finite units. To overcome the defect that the global fixed model cannot clearly describe the temporal and spatial dependence of data, a concentric partitioning method was applied to divide the entire New York City into five areas. Then CART model is established for each area. The Gini coefficient is calculated according to the historical time series data of the demand density of taxi. The value of the feature with the smallest Gini coefficient is found as the optimal cutting point [29]. The Gini index calculation formula used is:

The flow chart of the CART Tree algorithm.
The KNN model has been used in short-term traffic forecasting for nearly 20 years. KNN is a non-parametric and data-driven method widely used due to its simplicity, interpretability, and real-time performance [30]. The key step in the KNN model involves reasonably defining the distance function, for which Euclidean distance and Manhattan distance have been usually adopted. Since the Euclidean distance treats the difference between the dimensions of the variables of the sample as the same, the similarity between samples can’t be effectively distinguished. So the Manhattan distance is chosen, and the distance formula is defined as follows:

The flow chart of the KNN algorithm.
In this paper, the whole research area is divided into five different sub-areas according to its density level by using the concentric partitioning method. The density data of 3 days was extracted for the time series autocorrelation test. And the time series data was taken as the sample feature vector. After the CART tree was established, the boarding density was divided into five grades according to its natural interval. The five grades from low to high correspond to the tags from 1 to 5 respectively. On each leaf node of the CART tree, a KNN model is established for each level of demand grading label to achieve demand density prediction. The model structure is shown in Fig. 3.
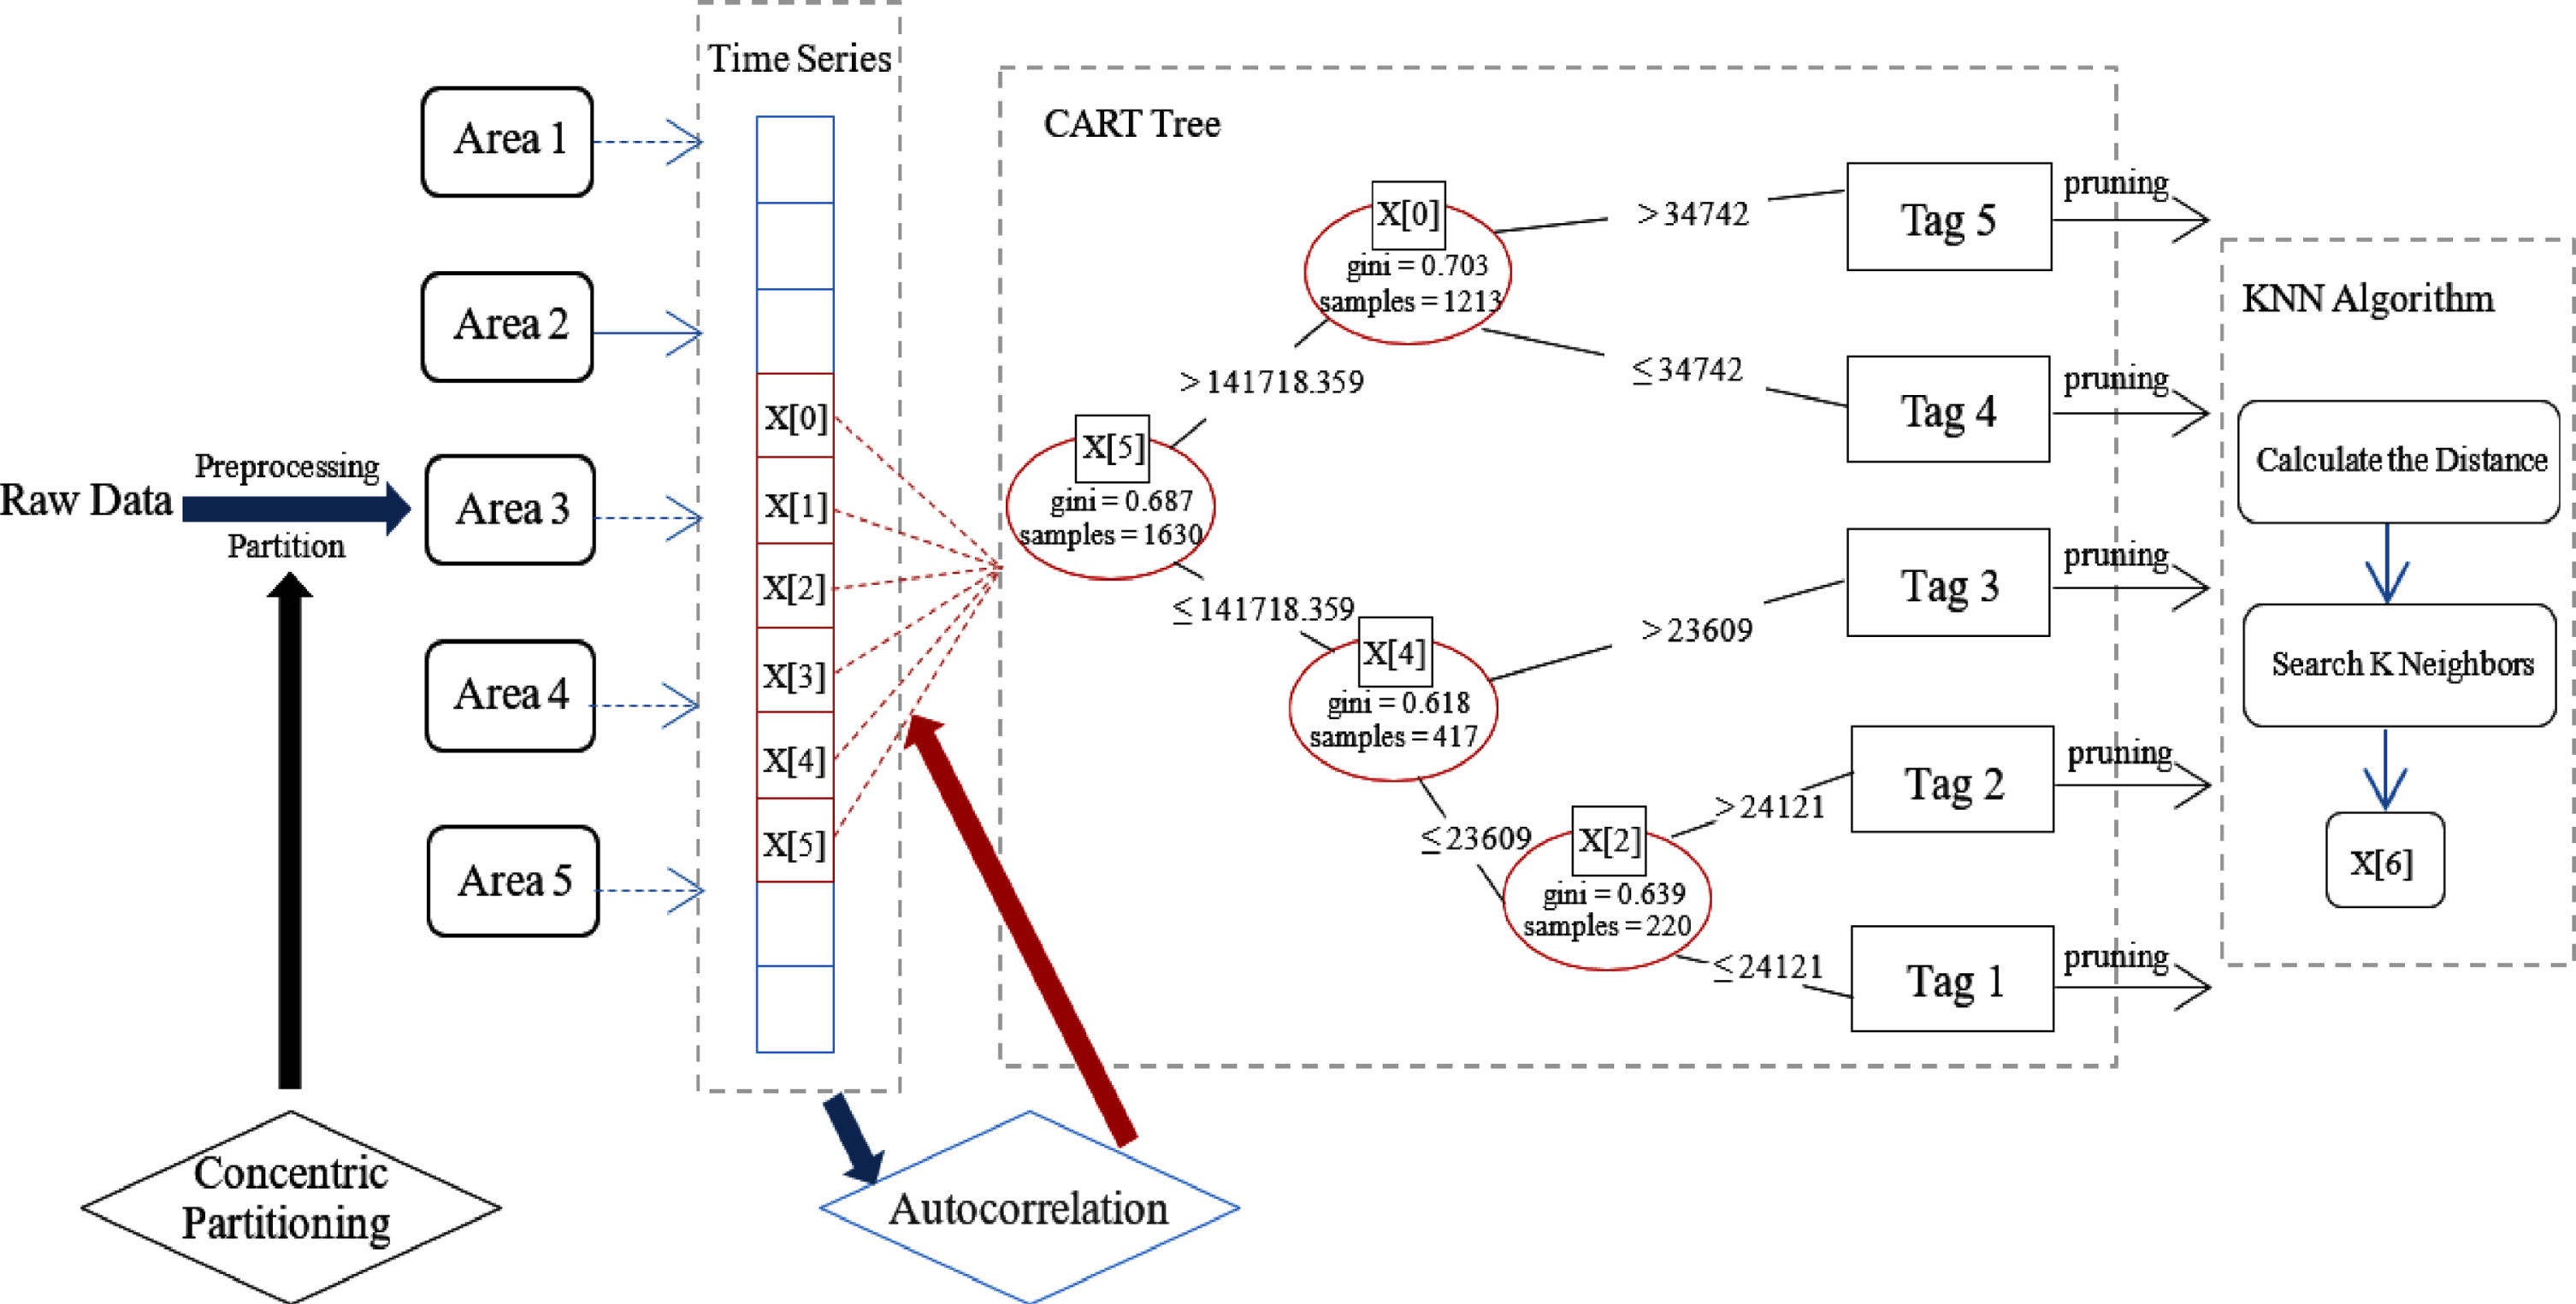
CART-KNN hybrid forecasting model structure.
The New York City taxi data is adopted to train the CART-KNN model. The workflows of the proposed method are described as follows: The regional location data is converted to boarding density data. By using the concentric partitioning method, the whole research area is divided into five different sub-areas according to its density level. The CART tree model is used to divide the subsets. And corresponding KNN models are established for each subset to estimate model variables. Parameters including mean absolute percentage error (MAPE) and root mean square error (RMSE) [31] are used to compare the accuracy of the predictions of three different models. In order to exhibit the results more clearly, the Kriging interpolation is used to visualize the results.
Data preparation
Data source
The FHV driving record files of New York taxis from July 1st to 31st, 2018 was collected here, as well as the shapefile files of the taxi area which were selected from the official website of the New York City TLC (Dataset: https//www1.nyc.gov/site/tlc/about/tlc-trip-record-data.page. Dataset License: Open Database). After data evaluation, a total of 21,596,442 pieces of data and 2,719,224 pieces of missing data were found in the dataset. The missing data rate was 12.6%.
Data processing
Considering that the proportion of missing data is small and does not affect the continuity of the dataset, the missing part was directly removed from the total data. Finally, 18,877,218 pieces of data were collected in the study. The two data files collected from TLC were connected with the taxi area location ID to obtain a dataset containing the area location and taxi boarding time. Based on the time required for taxis to reach different customer single areas, the boarding density data is aggregated at a 30 min interval level, which means that each day was divided into 48 time slots, with each time slot being thirty minutes long. And the description of the dataset was shown in Table 1.
Experimental data set description
Experimental data set description
Layered tinting
The square root segmentation method was used to divide all the density data into five levels. First, the square root of the boarding density was taken in each area for equal distance segmentation. Second, the processed segment points were squared to obtain the corresponding segmentation scheme. Finally, the distribution map of the density of taxi boarding in various regions of New York City in July 2018 was obtained, as shown in Fig. 4.
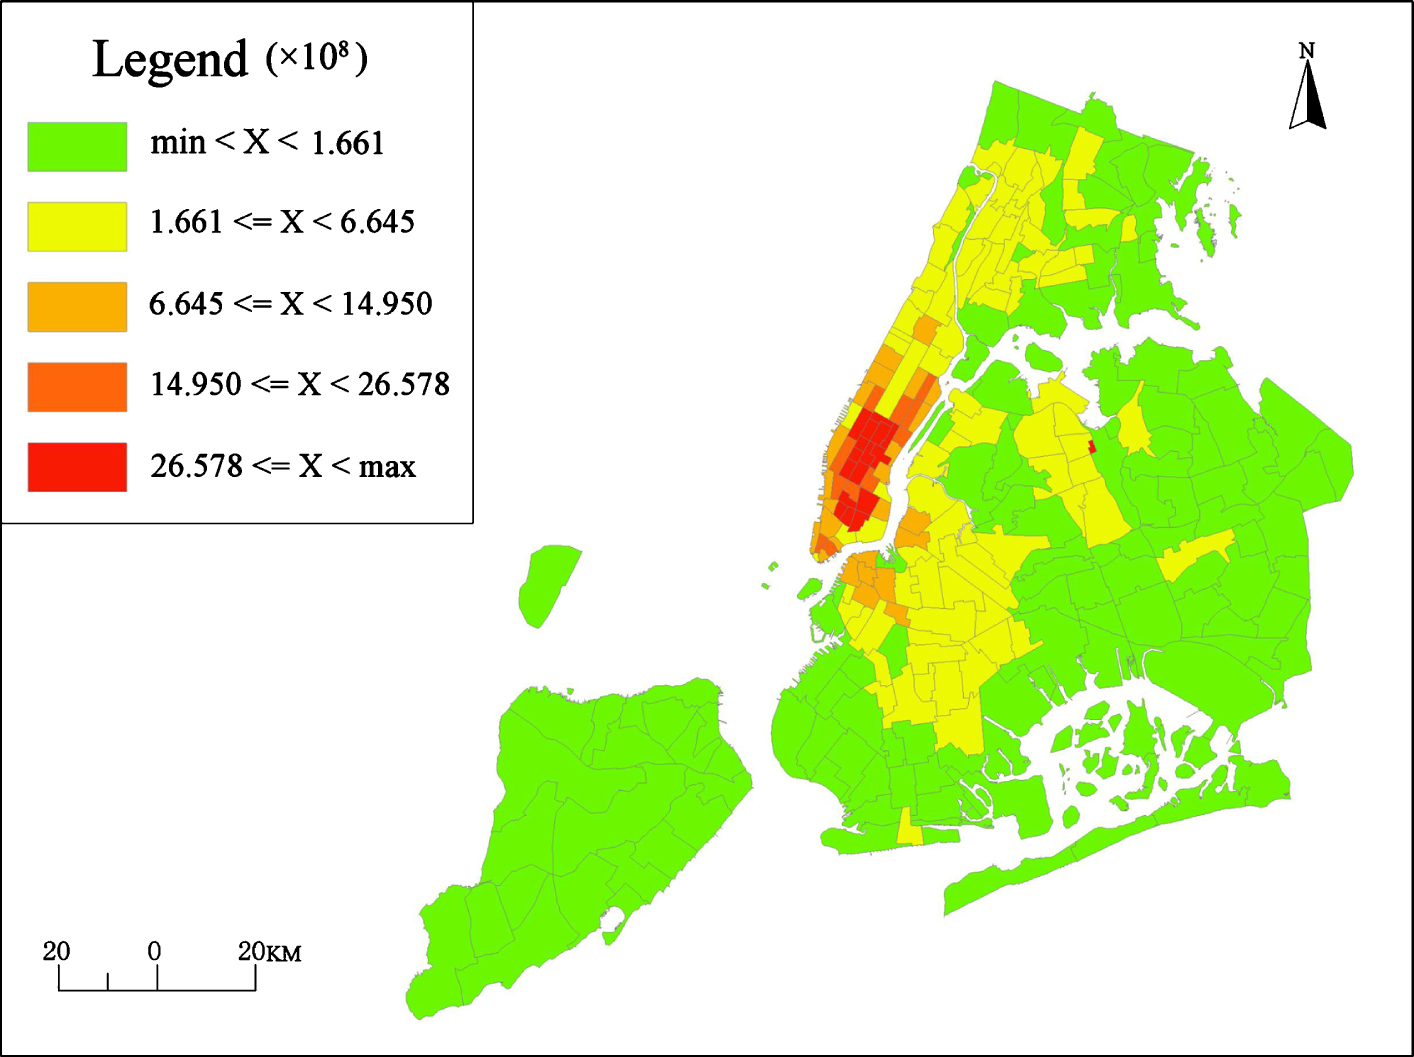
Distribution map of taxi boarding density in various regions of New York City in July 2018.
Figure 4 shows that the density of taxi boarding in New York City presents a spatial distribution of circles radiating from the center to the periphery. The area rate with low boarding density was over 80% in New York City. This is very similar to the distribution of urban land density [33]. When discussing the variation in spatial metrics or density variables from the city center outward, the concentric partitioning of cities was commonly used in many studies [34-35]. Based on the spatial heterogeneity and spatial distribution feature of decreasing from the inside to the outside in this study, the concentric partitioning method is utilized to select districts.
In this section, experiments were conducted, in which the centroid was determined by the metric geographic analysis, and the circle was divided by buffer analysis. Generally, the center of mass of the areas with the highest taxi density was taken as the center of the circle. Buffers were set with a radius of i×2 kilometers (i = 1, 2 ... 18). And eighteen rings were obtained, as shown in Fig. 5. After that, the density of taxi boarding between every two adjacent rings was calculated respectively. By carrying out single linear interpolation, the density curve is shown in Fig. 6. Finally, five rings with a faster change rate of density were selected. These rings were taken as the boundary of the study area. And the whole study area was divided into area 1 to area 5, as shown in Fig. 5. The five rings appear red in Fig. 5 (Ring Number = 1, 2, 3, 6, 15). In each of the five areas, four sub-areas were separately selected as representatives of the corresponding area. The boundaries of the selected twenty sub-areas are presented blue in Fig. 5.
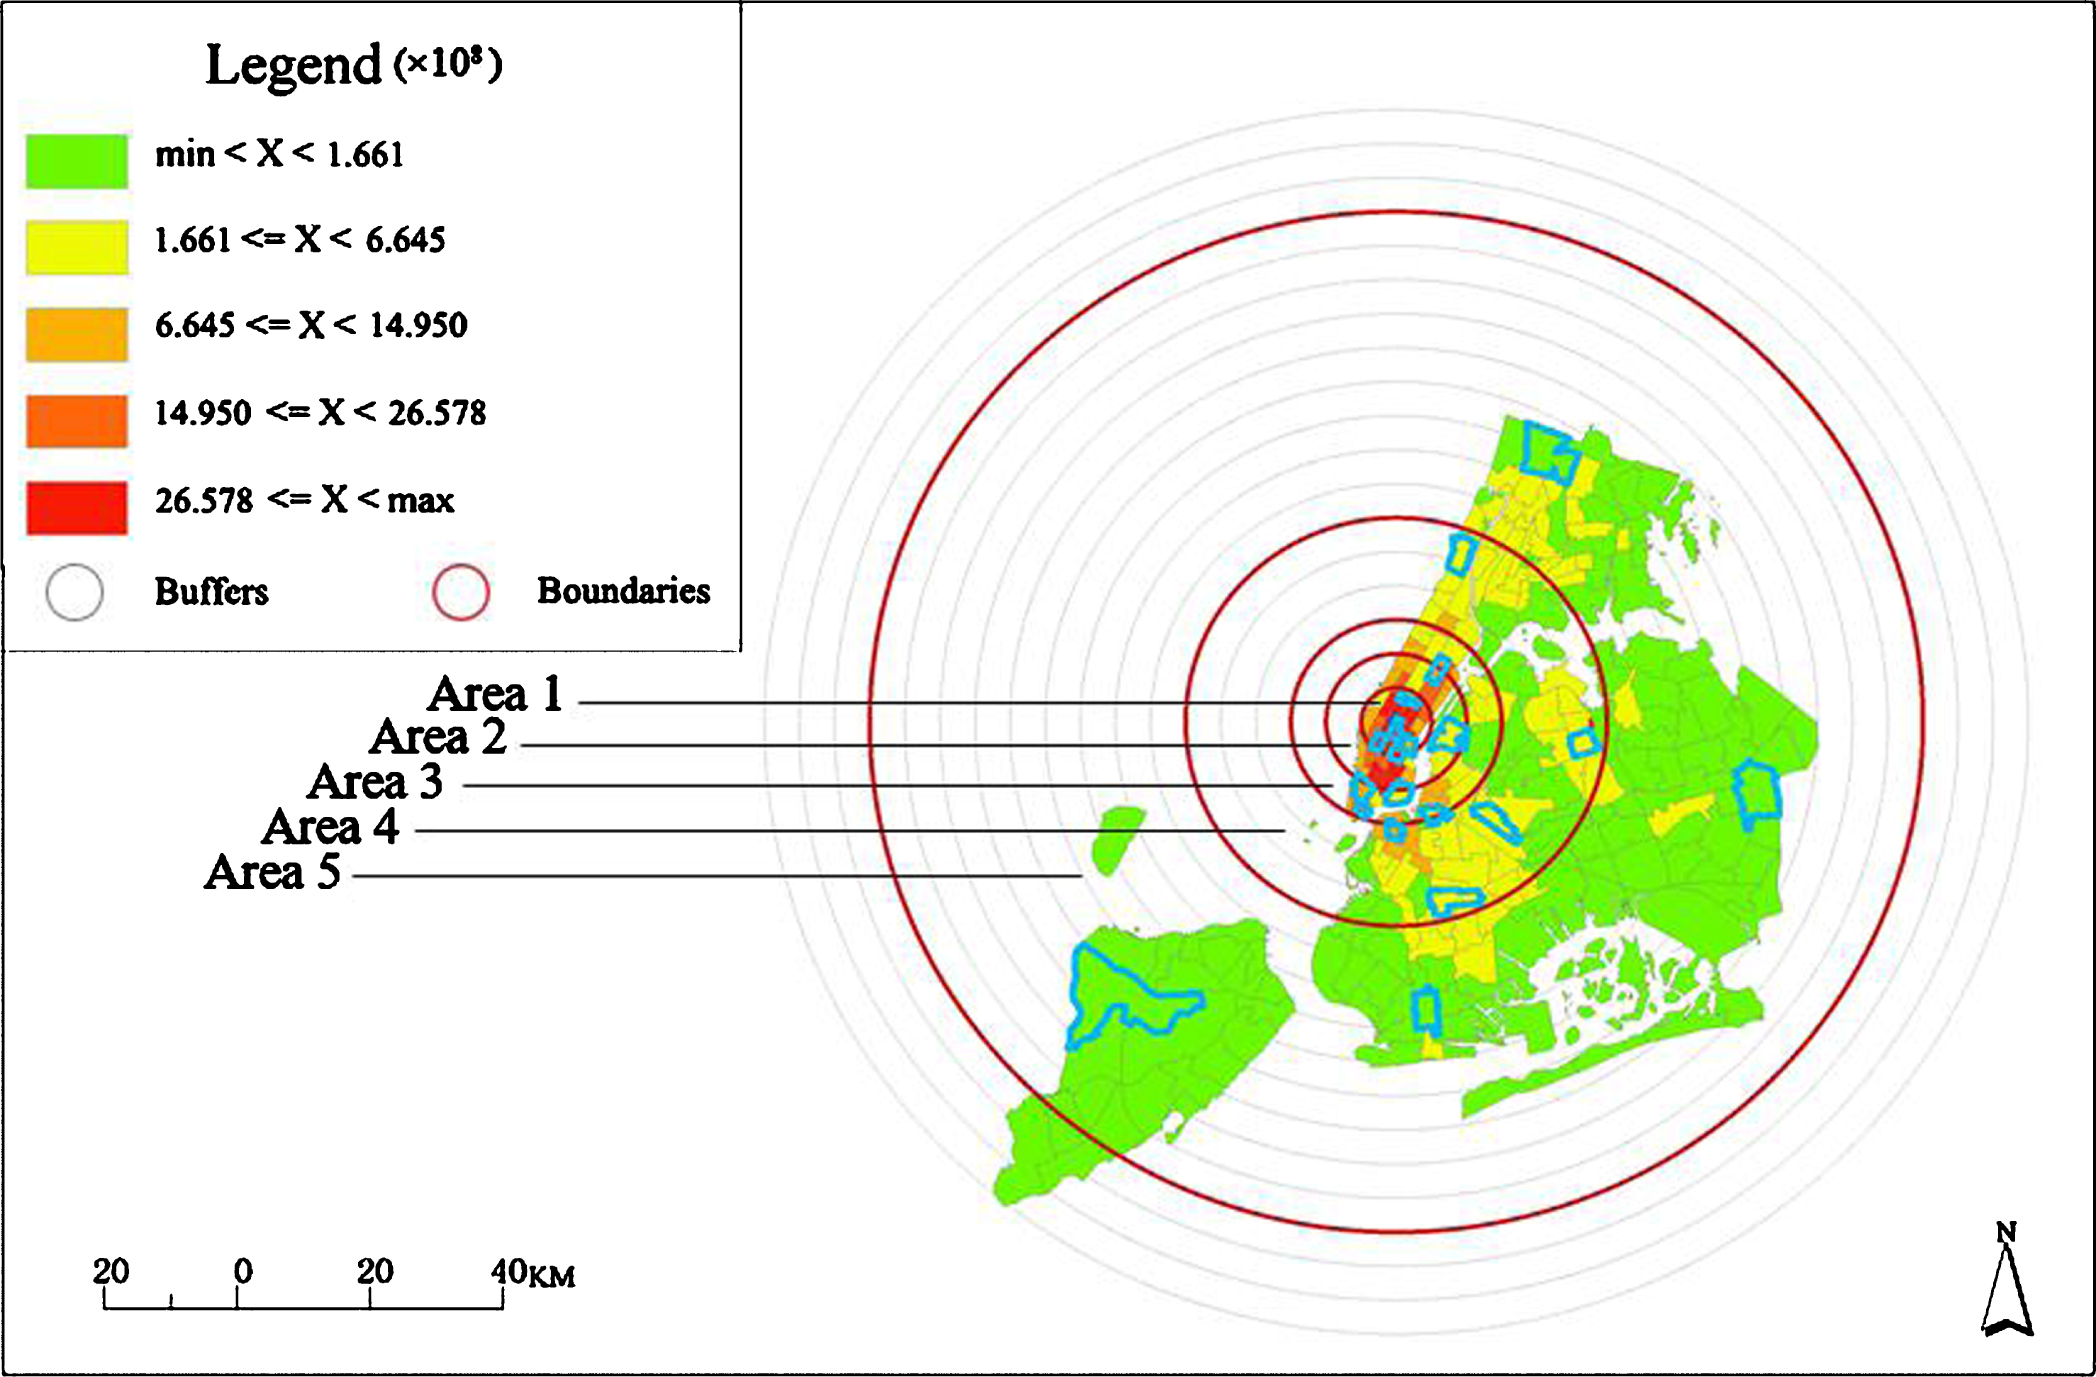
Regional division and representative area selection.
In this study, the prediction accuracies of different models were evaluated by using two error metrics (1) RMSE, and (2) MAPE. The RMSE measures the fluctuation of the error of the prediction model. The MAPE measures the difference between the predicted demand and the actual demand. They can be expressed by the following equation:
In addition, F1-score was used to evaluate the classification effect of the CART model. To use the F1-score for the evaluation of the multi-classification model, the metrics are calculated as follows:
Before establishing the CART tree, in each area (area 1 to area 5), the data of the four randomly selected sub-areas were merged, as shown in section 3.2.2. And the density data of 3 days was extracted for the time series autocorrelation test. Then we found the lag order is 6, which indicates the density of taxi boarding in the current time slot is related to the data during previous 6 time slots. So the boarding density data corresponding to the last three hours was used to predict the boarding density in the next time slot. The time series data was taken as the sample feature vector. After that, for each area (area 1 to area 5), the boarding density was divided into five grades according to its natural interval. The five grades from low to high correspond to the tags from 1 to 5 respectively. Each sample was tagged according to its density grade determined by calculating the average of the corresponding feature vector. For data split, 70% of the dataset was used for training, with the rest for the performance testing. Finally, five CART models were obtained.
After the CART tree was established, a KNN model was built for each leaf node according to the classification situation. The state-space of the model was two-dimensional, in which the x-axis was the current time series feature, and the y-axis was the data of the corresponding x-axis in the next time step. After obtaining the output data of the CART model, the samples in the same area of the same tag were merged as the input data of the KNN model. The ratio of training data to test data was still 7 : 3. After the models were established, cross-validation was used to select the optimal parameters of the model. Figure 7 shows the F1-score of CART model and the MAPE value of KNN model on training data and testing data in area 1.

Single linear interpolation curve of density in each ring.
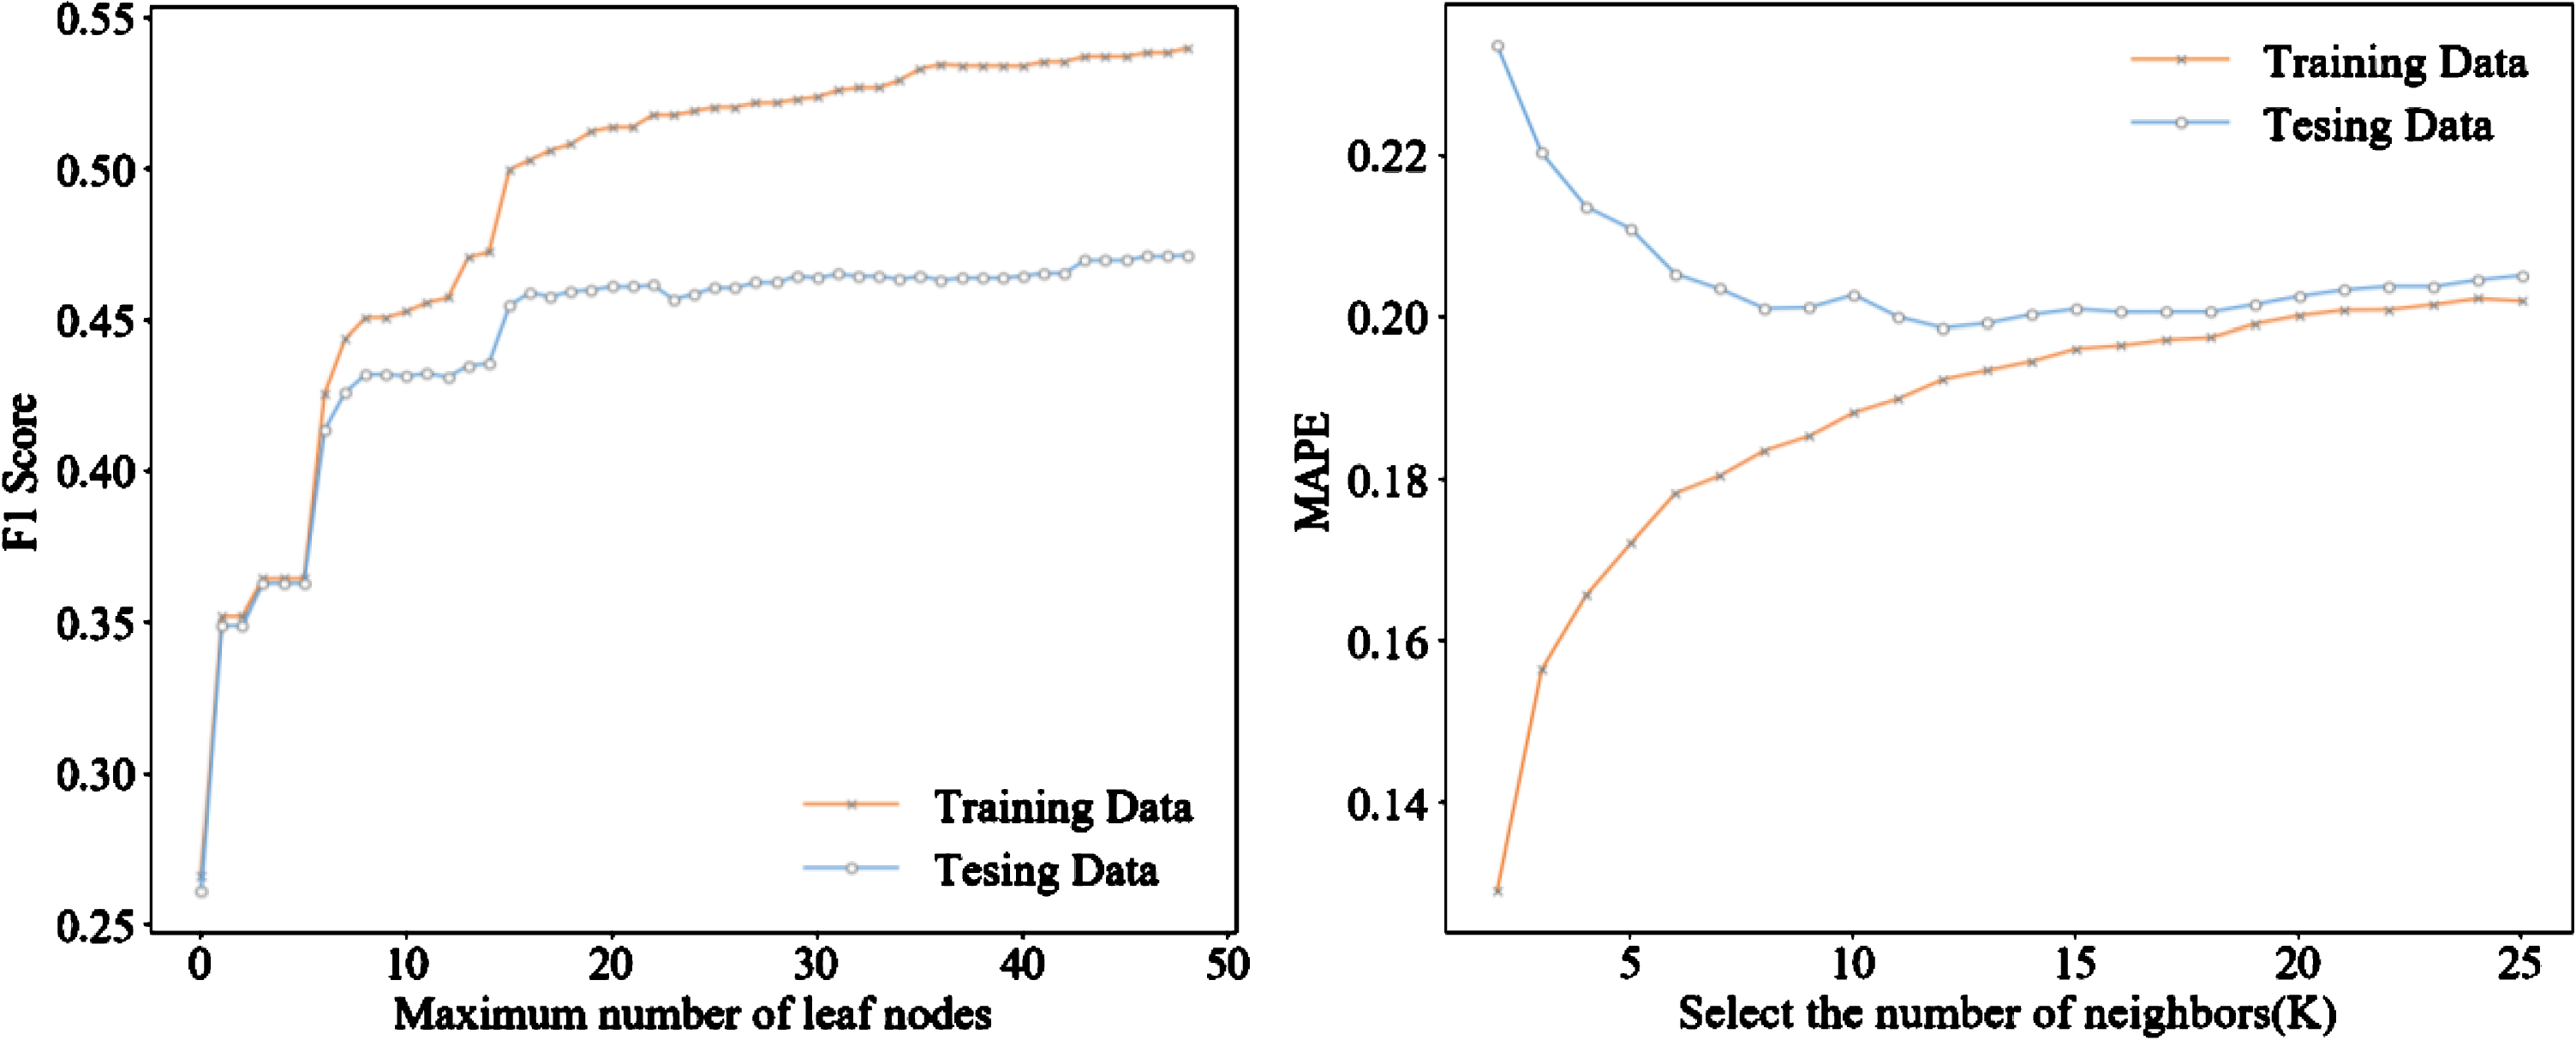
Ring area 1 Cross-validation optimal parameter selection.
Finally, 25 KNN models are obtained, as shown in Table 2. Naming rule of the model: the number of the area-the tag.
The optimal K value of each model
To evaluate the effect of the model, data for 20 constituencies in July was collected as the test dataset. The CART-KNN hybrid prediction model was compared with the traditional KNN model, the BP neural network model and the LSTM model. After cross-validation, the parameter settings of the three traditional models are determined as follows: the best K value of the traditional KNN model is 25, and the Manhattan distance is used as the distance function; the BP neural network uses a three-layer network, a tangent function, and the output layer function is a linear rectification function. The LSTM model uses Adam as the optimizers, mean squared error as the objective function, tanh as the activation function. The outout_dim is 1 and the batch size is 128. The result is shown in Fig. 8.

Comparison of the average accuracy of all regions of different models.
Figure 8 shows the prediction performance of different models. Compared with the traditional KNN, BP and LSTM models, the RMSE of the fused CART-KNN model is reduced by 93.52%, 93.22% and 94.67% respectively, while the MAPE is reduced by 85.12%, 41.56% and 41.41% respectively, which indicates that the predicted value of the CART-KNN model is closest to the true value and has small fluctuations in prediction errors. In other words, the prediction performance of CART-KNN is the best. It can be explained that the model parameters of the BP model, the KNN model, and the LSTM model are fixed. The same model is used for the entire time range of the study area, ignoring spatial factors and different periods on the forecast of demand density of taxi.
In order to test the prediction performance of each model for extreme situations, four sub-areas tagged with 1 or 2 are selected in area 5, as shown in section 3.2 and section 3.4. The samples in these four sub-areas have the smallest taxi demand density in space and time dimensions, which are taken as the test data. The test results are shown in Fig. 9.

Comparison of accuracy in extreme cases of different models; (a) area 5-1, (b) area 5-2.
Figure 9 presents the MAPE results when the traditional taxi traffic prediction model was globally fitted with fixed parameters. Compared with the traditional KNN and BP models, the MAPE of the fused CART-KNN model is reduced by 74.40% and 47.86% respectively in area 5-1(the number of the area-the tag, as shown in section 3.4), the value is reduced by 85.08% and 54.25% in area 5-2 respectively. It can be seen that the prediction accuracy of BP model and single KNN model for extreme areas is much worse than the proposed model. The temporal and spatial heterogeneity of taxi traffic is fully considered by the CART-KNN model, and its accuracy can be maintained at a high level for the prediction of extreme areas, which means the proposed model is more robust.
As mentioned in section 3.2.2, the boarding density data in 20 areas from 20 : 30 to 23 : 30 on July 31st was selected. And the model was used to predict and obtain the demand density data in the time slot from 23 : 30 to 24 : 00. In order to obtain the predicted value of other areas, the centroid of each selected area was got and ordinary Kriging interpolation was performed. Then we compare it with the true value after interpolation. The result is shown in Fig. 10. According to the visualization results of true values, all the study areas are divided into five areas, named as A, B, C, D and E. In area B and area D, the prediction effect of CART-KNN model is better than that of KNN model and BP model. In area A, area C and area E, the predicted results of the three models are all very close to the true values.

Comparison of model prediction visualization results with true values.
In general, the predicted values of each model are similar to the true values. The trend is gradually decreasing around Manhattan, New York. The prediction effects of the three models in areas with high and stable demand of taxi such as Manhattan are all satisfied. But for the peripheral area centered on Manhattan, the prediction of the CART-KNN model is closer to the true value.
To solve the problem that existing methods use single model to predict the global urban area traffic demand, resulting in low prediction accuracy, a fusion model combined CART model and KNN model was proposed in this study. In the developed model, the temporal and spatial heterogeneity of taxi demand to a certain extent are taken into consideration, which is distinguished from the conventional studies. The detailed conclusions are drawn as follows: In the spatial dimension, the entire tested area was divided into several sub-areas according to its density characteristics; in the time dimension, the CART tree combined with time series analysis is used to subdivide each sub-area into different subsets. And the KNN model is constructed separately, so that the prediction accuracy can be improved. In extreme circumstances, CART-KNN model selects parameters according to the time series characteristics of demand density and the spatial location of the region, so the model is much more robust. The MAPE values of three models (KNN, LSTM, BP and CART-KNN) are 70.38%, 17.84% 17.88%, 10.45% respectively. This means the prediction accuracy can be effectively improved by CART-KNN model. The RMSE of the fused CART-KNN model is reduced by 93.52%, 94.67% and 93.22% respectively, compared with the traditional KNN model and BP model. From the results, the prediction effect of the CART-KNN model is much more stable. The proposed model was designed for predicting the density of taxi boarding in half-hour advance, which can meet the requirements of taxi resource allocation and management in advance.
Although there are important discoveries revealed by these studies, there are also limitations: CART-KNN model is not perfect for the consideration of spatial consistency. The variation of taxi density in the annular region is ignored. The CART tree algorithm is easy to over fit the training set, resulting in poor generalization ability. The analysis of the dependence between each time slot is not deep enough. To some extent, the correlation between time series is ignored.
In the future, in order to better mine the characteristics of the data, the data need to be further divided into holidays and non-holidays. And a more applicable prediction model of taxi demand can be developed. The CART tree algorithm is easy to over fit the training set and is relatively difficult to find the optimal combination of parameters by traditional methods, resulting in poor generalization ability. Li et al. proposed the chaotic cloud quantum bats algorithm (CCQBA), which greatly improves the evolution mechanism, local search mechanism, mutation mechanism and other mechanisms of the bat algorithm. The convergence speed and solving precision as well as convergence efficiency of the CCQBA hybrid optimization algorithm have obvious improvement. Especially, when solving high-dimensional complex multimodal functions, the algorithm shows stronger global exploration and local search capacity [36]. So The CCQBA is expected to be used to optimize the parameters of CART tree algorithm and further improve the accuracy and stability of the CART-KNN model. In addition, in this research, each time slot is regarded as the same. However, during a day, some time slots have very obvious characteristics, such as commuting time. Thus, different parameters need to be selected according to the characteristics of different time slots in the future study.
Footnotes
Acknowledgment
The authors would like to thank the Taxi & Limousine Commission for providing FHV Trip Records.