
Abstract
In the existing high-order fuzzy logical relationship (FLR) based forecasting model, each FLR is used to describe the association between multiple premise observations and a consequent observation. Therefore, these FLRs concentrate on the one-step-ahead forecasting. In real applications, there exist another kind of association: the association between multiple premise observations and multiple consequent observations. For such association, the existing FLRs can’t express and ignored. To depict it, the high-order multi-point association FLR is raised in this study. The antecedent and consequent of a high-order multi-point association FLR are consisted of multiple observations. Thus, the proposed FLR reflects the influence of multiple premise observations on the multiple consequent observations, and can be applied for multi-step-ahead forecasting with no cumulative errors. On the basis of high-order multi-point association FLR, the high-order multi-point trend association FLR is constructed, it describes the trend association in time series. By using these two new kinds of FLRs, a fuzzy time series based multi-step-ahead forecasting model is established. In this model, the multi-point (trend) association FLRs effective in capturing the associations of time series and improving forecasting accuracy. The benefits of the proposed FLRs and the superior performance of the established forecasting model are demonstrated through the experimental analysis.
Keywords
Introduction
Multi-step-ahead time series forecasting is an important research topic, which has been proven in many applications. And, various models have been put forward for this topic, such as Neural Network, Support Vector Regression, Autoregressive Integrated Moving Average and so on.
Among these models, Neural Network is an intelligent forecasting method, which is good at describing the correlations in complex data [1, 2]; Support Vector Regression as an extension of Support Vector Machine for prediction, it has perfect theoretical basis [3, 4]; Autoregressive Integrated Moving Average is simple in form and widely applied [5, 6]. Even so, the existence of cumulative errors seriously affects their forecasting performance in multi-step-ahead forecasting. Moreover, these models are used to solve the numerical time series prediction, but cannot deal with the prediction, which relates linguistic values. In order to realize this kind of prediction and improve the forecasting performance, the fuzzy time series based multi-step-ahead forecasting is studied in this paper.
The fuzzy time series based forecasting model was proposed by Song and Chissom in 1993 [7, 8]. It has been used for forecasting in a number of fields, including energy [9], weather [10], economy [11], etc. For implementing the advantages of this kind of models in each field, various improvements have been proposed. Tai et al. improved the interval partition method by k-means algorithm [12] and information granule [13] in forecasting. Guney et al. established a new type of fuzzy logical relationship (FLR) used for forecasting [14]. Teoh et al. developed an inference system that weights FLR according to its frequency of occurrence [15]. Through these improvements, it can be seen that the construction of appropriate FLRs has a significant impact on prediction.
Fuzzy logical relationships play an important role in fuzzy time series based forecasting, and different kinds of FLRs will result in different forecasting results. The earlier forecasting models [10, 16] established one-order FLRs (F (t - 1) → F (t)), such FLRs reflect the influence of antecedent on the consequent, where the antecedent and consequent respective relate to a premise observation and a consequent observation. In [17], Cheng et al. distinguished the function of each one-order FLR in forecasting by similarity measures. Cai et al. applied the one-order FLRs for stock prediction [18]. Follow on, Surendra et al. [19, 20] proposed high-order FLRs (F (t - h) ⋯ F (t - 2) F (t - 1) → F (t)), this kind of FLRs is constructed from antecedent to consequent, while their antecedents relate to multiple premise observations. Therefore, the high-order FLRs can reflect the influence from the trend of premise observations on the consequent. Xian et al. combined the artificial fish swarm optimization algorithm to establish the high-order FLRs [21], and Bose et al. put forward a high-order FLR selection technique in prediction [22]. Both one-order FLRs and high-order FLRs are established on the given time series. Guan et al. proposed to construct the high-order FLRs on the trend time series of a given time series [23, 24], and Chen et al. mined the high-order trend FLRs on the fuzzy time series [25, 26]. These FLRs all describe the associations in time series well.
The high-order FLRs aforementioned are constructed from antecedent to consequent, they pay attention to the association between multiple premise observations and a consequent observation. However, there exits such a different kind of associations in real time series: the association between multiple premise observations and multiple consequent observations. For example, the association between high and low temperatures in a temperature time series is that the long-term high temperature will bring a short-term low temperature in summer. As for this association, the existing high-order FLRs cannot describe.
From the form of existing high-order FLRs (relate to a consequent observation), one can find that the forecasting based on them focuses on the one-step-ahead forecasting. If using these FLRs for multi-step-ahead prediction, the predictions are calculated by iterating one-step prediction. There exist cumulative errors. Furthermore, a situation is occurred often in forecasting process: no available fuzzy logical relationship. The reason for this situation is that the existing FLRs allow the prediction to be calculated only from the historical data at its closest moments, while neglect the role of non-closest historical data.
According to the above analyses, three problems of the existing high-order FLRs are found:
For solving the problems of the existing high-order FLRs, a new kind of FLR, high-order multi-point association fuzzy logical relationship, is raised. The antecedent and consequent of such kind of FLRs associate with a group of observations, thus they can capture the association between multiple premise observations and multiple consequent observations (the multi-point association), as well as this association in a temperature time series. More importantly, when forecasting from these FLRs, the first prediction result involves multiple observations at multiple moments, so the use of high-order multi-point association FLRs can reduce the cumulative errors of multi-step-ahead forecasting.
After comparing the new proposed FLRs with the existing FLRs, we can find that the high-order multi-point association FLR includes the existing high-order FLR. It indicates that the existing high-order FLR is a special case of high-order multi-point association FLR when its consequent relates to one observation.
On the basis of high-order multi-point association FLR, another kind of FLR is established, namely high-order multi-point trend association FLR. This type of FLRs can better reflect the influence from the trend of antecedent on that of consequent.
Using these two new kinds of FLRs, a fuzzy time series based multi-step-ahead forecasting model is built up. In this model, the proposed FLRs can not only describe the association ignored by the existing models, but also improve the forecasting accuracy of multi-step-ahead forecasting.
The main contributions of this paper can be summarized as follows: Two new kinds of fuzzy logical relationships are proposed
High-order multi-point association FLR is proposed, which depicts the association from multiple premise observations to multiple consequent observations.
High-order multi-point trend association FLR is proposed, which depicts the trend association between antecedent and consequent. A novel multi-step-ahead forecasting model is established
Based on the new proposed FLRs, a multi-step-ahead forecasting model is established. In this model, the multi-point (trend) association FLRs capture the associations in time series well and avoid the cumulate errors in forecasting.
The rest of this paper is organized as follows. Section 2 introduces some definitions about fuzzy time series and the framework of the existing high-order FLR based forecasting model. Section 3 gives the motivation and the definition of the new proposed FLRs. On the basis of these FLRs, a multi-step-ahead forecasting model is presented in Section 4. In order to express the superiority of the proposed FLRs and forecasting model, some experiments are analyzed in Section 5. The last section concludes this paper.
Preliminaries
After reviewing the developments of fuzzy logical relationship, some necessary definitions are given in this section. From these definitions, the framework of the existing high-order FLR based forecasting models is introduced. More details can refer to [27–30].
The basic concepts of fuzzy time series
The definition of fuzzy time series was proposed by Song and Chissom first [7, 8], which introduced in this section. Some other related concepts are also given here.
There are many kinds of fuzzy sets, the triangular fuzzy set A = [a, b, c] is adopted in this paper, whose membership function is
then this relationship is called a h-order fuzzy logical relationship, h = 1 and h ⩾ 2 (h ∈ Z+) will lead to one-order fuzzy logical relationship (one-order FLR) and high-order fuzzy logical relationship (high-order FLR) respectively.
If F (t - 3) = A i 3 , F (t - 2) = A i 2 , F (t - 1) = A i 1 , F (t) = A j , then high-order FLR F (t - 3) F (t - 2) F (t - 1) → F (t) can be rewritten as A i 3 A i 2 A i 1 → A j , where A i 1 , A i 2 , A i 3 and A j are the antecedent and consequent respectively; if the FLR A i 3 A i 2 A i 1 → A j appeared k times in fuzzy time series, then we express it as A i 3 A i 2 A i 1 → A j (k).
Figure 1 shows an example of h-order FLR with the form F (t - 3) F (t - 2) F (t - 1) → F (t), where h = 3 and F is a fuzzy time series. This FLR expresses the influence of the premise observations at moments (t - 3) , (t - 2) , (t - 1) on the consequent observation at moment t.
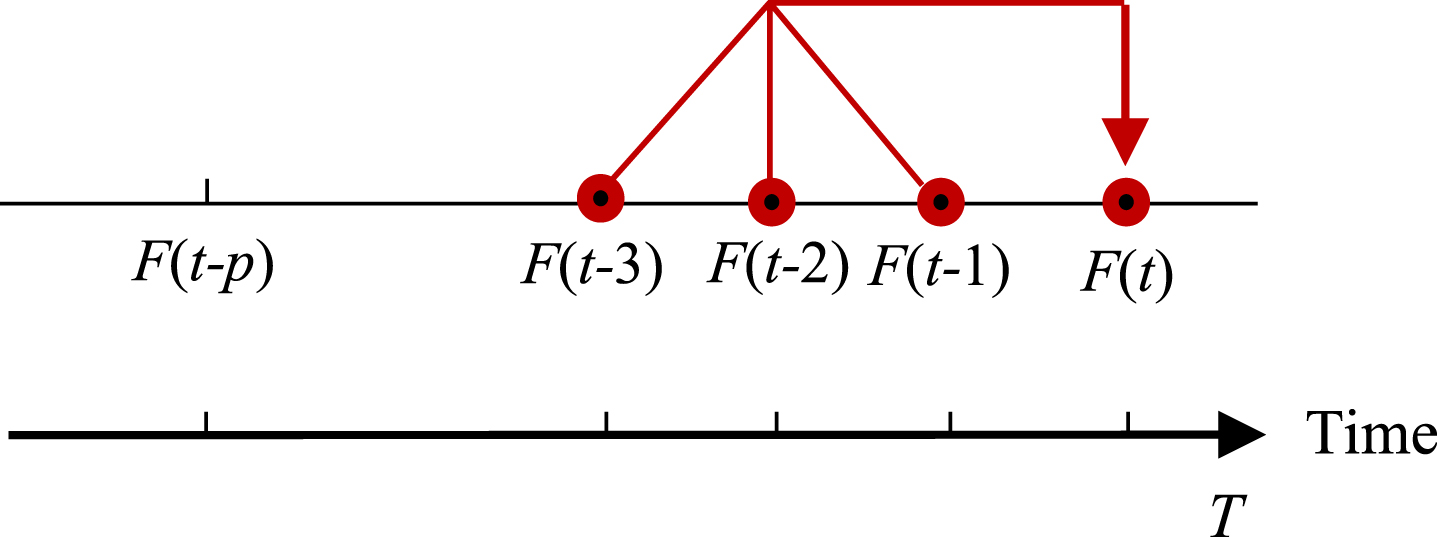
A three-order fuzzy logical relationship.
In this paper, Average forecasting error rate (AFER), Root mean square error (RMSE), and Mean absolute error (MAE) are applied to evaluate the forecasting quality and statistical significance of each model [31–35], whose functions are:
where x
i
is the actual value,
The framework of high-order fuzzy logical relationship based forecasting models
Based on the concepts given in Section 2.1, many high-order FLR based forecasting models [36, 37] were proposed. Their framework described as below:
High-order multi-point association fuzzy logical relationship
In view of the problems analyzed in Introduction, two kinds of fuzzy logical relationships are proposed in this section. The motivation for these FLRs is described in Section 3.1. For this motivation, the definitions of new proposed FLRs are given in Section 3.2.
The motivation of new kinds of fuzzy logical relationships
For explaining the motivation of two new kinds of FLRs, a prediction scenario is presented here. Suppose this forecasting is carried out on the fuzzy time series F = {F (t) |t = … , 0, 1, ⋯}, and a prediction is made at moment k. In the existing high-order FLR based forecasting models [38–40], the prediction at moment k is calculated from the historical values at moments (k - 1) , (k - 2) , ⋯ , (k - h), and the FLRs used for forecasting with the form:
From the form of FLR in (1), one can find that its antecedent and consequent are respective related to 5 premise observations at 5 moments and a consequent observation at a moment. Therefore, this kind of FLRs describes the association between multiple premise observations and a consequent observation. In real time series, another kind of association is widespread: the association between multiple premise observations and multiple consequent observations. For example, the association between the long-term raise and the short-term decline in a stock time series.
When forecasting with the FLR in (1), 5 premise observations should be examined whether they are matched with the 5 observations at moments (k - 1) , (k - 2) , ⋯ , (k - 5) one by one. If the 5 observations are matched, this FLR can be used as an available FLR, and a reasonable prediction can be made. However, due to the large number of premise observations of FLRs, it is difficult to match the 5 observations at 5 moments with the premise observations completely, then
In addition, since the FLR in (1) has a consequent observation, it focuses on the one-step-ahead prediction. When using it for multi-step-ahead predictions, which are calculated by iterating the one-step prediction. This process
To describe the association ignored by the existing models, and solve the problems encountered in forecasting, we propose to construct a new kind of FLRs. Examples as follows:
The consequent of FLRs in (2) and (3) relates to multiple observations at multiple moments. Therefore, they can describe the associations between multiple premise observations and multiple consequent observations that exist frequently in real time series.
Importantly, when implement the multi-step-ahead forecasting with these FLRs, the multi-step predictions are achieved from historical data, which have no cumulative errors. And, if there is no available FLR with the form of (2) for forecasting, the available FLRs may be found with the form of (3). Thus, the new kind of FLRs raises the possibility of finding the available FLRs in forecasting, so as to obtain the reasonable and accurate multi-step-ahead predictions.
Based on the FLRs in (2) and (3), another kind of FLRs is proposed, examples as
According to the above explanations, one can see that it is a necessary work to construct these two new kinds of FLRs in time series analysis. The definitions of them are given in Section 3.2.
Let the given time series be X ={ x1, x2, ⋯ , x n }, and its fuzzy time series be F = {F (t) |t = … , 0, 1, ⋯}.
In the existing high-order FLR based forecasting models [41, 42], each FLR is in the form F (t - 3) F (t - 2) F (t - 1) → F (t) (h = 3). Such FLRs pay attention to the influence from the premise observations on the only one consequent observation at the next moment in the last premise moment, i.e., moment t, and ignore that influence on the consequent observations at other moments, for example moments (t + 1) , (t + 2) and so on. In other words, the existing high-order FLRs neglect the association between multiple premise observations and a group of consequent observations. For well describing this association, the high-order multi-point association FLR is put forward as the following definition.
According to the order and the number of points of FLRs, the proposed high-order multi-point association FLR can be discussed from three cases:
A high-order multi-point association FLR is in the form F (t - 1) → F (t). Such a FLR is called one-order one-point association FLR, whose antecedent and consequent relate to an observation at a moment. In this case, the one-order one-point association FLR is also called one-order FLR in Definition 3.
A high-order multi-point association FLR is in the form F (t - h) ⋯ F (t - 2) F (t - 1) → F (t). Such a FLR is called h-order one-point association FLR, whose consequent relates to an observation at a moment. In this case, the h-order one-point association FLR is also called h-order FLR in Definition 3.
A high-order multi-point association FLR is in the form F (t - h) ⋯ F (t - 2) F (t - 1) → F (t) F (t + 1) ⋯ F (t + l). Such a FLR is called h-order (l + 1)-point association FLR, whose consequent relates to (l + 1) observations at (l + 1) moments.
Figure 2 shows an example of high-order multi-point association FLR with the form F (t - 4) F (t - 3) F (t - 2) F (t - 1) → F (t) F (t + 1) F (t + 2), where h = 4, (l + 1) = 3. This FLR reflects the influence of the premise observations at moments (t - 4) , (t - 3) , (t - 2) , (t - 1) on the consequent observations at moments t, (t + 1) , (t + 2). According to Definition 4, Fig. 1 shows a three-order one-point association FLR whose consequent relates to an observation at a moment. Where F is a fuzzy time series.

A four-order three-point association fuzzy logical relationship.
Based on the high-order multi-point association FLR, another kind of FLR is proposed, which describes the trend association in time series. Its definition is given as follows:
In [26], Chen et al. proposed trend association FLRs, whose consequent relates to an observation, so these FLRs reflect the influence of antecedent trend on the consequent. While the high-order multi-point trend association FLRs introduced in Definition 5 consider both antecedent trend and consequent trend. That is to say, the proposed high-order multi-point trend association FLR reflects the influence of antecedent trend on the consequent trend.
In this section, a multi-step-ahead forecasting model is put forward, i.e., the high-order multi-point association FLR based forecasting model. This model different from other existing models in the FLRs constructed for forecasting. Here, two kinds of FLRs are built up: one is high-order multi-point association FLR, which constructed from premise observations to consequent observations; another is high-order multi-point trend association FLR, which constructed on the high-order multi-point association FLRs. These FLRs character the association in time series well. More important, when using them for multi-step-ahead forecasting, the forecasting performance can be improved by reducing the cumulative errors and increasing the possibility of finding the available FLRs.
Through the proposed forecasting model, the predictions are calculated from the available high-order multi-point trend association FLRs defined as follows:
In Definition 6, the available multi-point trend association FLR is determined by the trend of antecedent A i h ⋯ A i 2 A i 1 , i.e., Δ i (h-1) ⋯ Δ i 2 Δ i 1 .
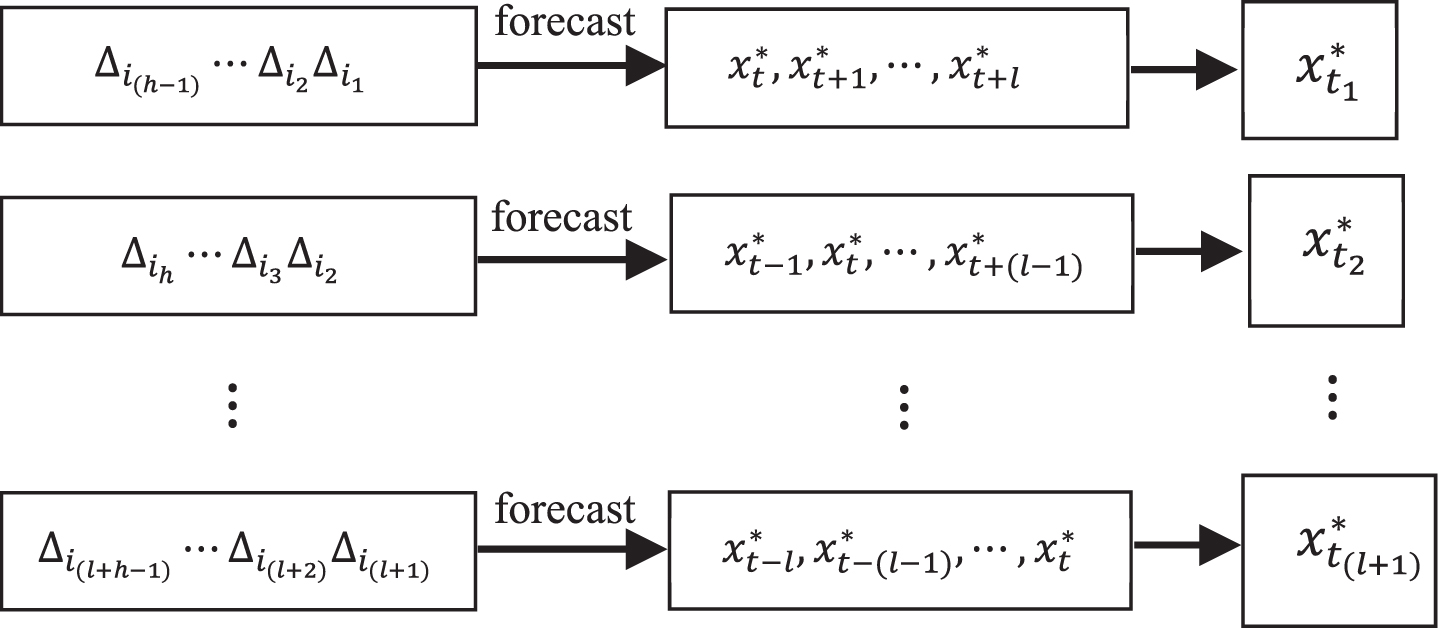
The proposed high-order multi-point trend association FLR based forecasting model is consisted of the following four parts (shown in Fig. 3): Transform the given time series to a fuzzy time series; Construct high-order multi-point association FLRs on the obtained fuzzy time series; Construct high-order multi-point trend association FLRs corresponding to the high-order multi-point association FLRs; Forecast from the available high-order multi-point trend association FLRs.
The forecasting by the proposed model on time series X ={ x1, x2, ⋯ , x m } is described as follows.

The flow chart of multi-point (trend) association FLR based forecasting model.
The above three steps constitute the first part of the proposed model, which the same as the first three steps of the existing high-order FLR based model [43].
From Steps 1-2, the universe of discourse of X is divided into k intervals, and (k + 1) triangular fuzzy sets are constructed on them. From Step 3, a fuzzy time series F ={ F (t) |t = … , 0, 1, 2, ⋯ } is got on X.
Next, we will construct FLRs onF and forecast from them.
Two kinds of FLRs are constructed: multi-point association FLRs and multi-point trend association FLRs. The constructions of them are introduced as below, where suppose the order and the number of points of FLRs are h and(l + 1) respectively.
According to Definition 4, a multi-point association FLR is in the formF (t - h) ⋯ F (t - 2) F (t - 1) → F (t) F (t + 1) ⋯ F (t + l).
According to Definition 5, the multi-point trend association FLR is constructed based on the multi-point association FLR obtained in Sub-step 4.1.
For a multi-point association FLR A i h ⋯ A i 2 A i 1 → A j 1 A j 2 ⋯ A j (l+1) , corresponding multi-point trend association FLR is Δ i (h-1) ⋯ Δ i 2 Δ i 1 → Δ j 1 Δ j 2 ⋯ Δ j (l+1) , where Δ i r = i r - i(r+1) (r = 1, 2, ⋯ , (h - 1)), Δ j 1 = j1 - i1, Δ j (u+1) = j(u+1) - j u (u = 1, 2, …, l).
Let R be the set of high-order multi-point trend association FLRs. Note that each FLR in R occurs no less than V times, which means R is a set of frequent multi-point trend association FLRs, where V is a frequent threshold given ahead.
Here, we take the forecasting of x t as an example.
From Step 4, two kinds of FLRs are constructed at the adjacent time periods. These FLRs have cross (es) on the consequent. For example, the following (l + 1) multi-point association FLRs have a cross F (t) in forecasting x
t
.
If F (t - r) = A
i
r
, F (t + u) = A
j
(u+1)
(r = 1, 2, ⋯, (h + l), u = 0, 1, 2, ⋯ , l), these (l + 1) multi-point association FLRs can be rewritten as
Based on the (l + 1) multi-point association FLRs in (4), (l + 1) multi-point trend association FLRs are obtained, shown in (5). These FLRs have a cross on the consequent, i.e., Δ
j
1
.
The forecasting of x
t
from the multi-point trend association FLRs in (5) should consider (l + 1) cases, and thus (l + 1) predictions can be calculated
The forecasting processes of x t .
Let A i p , A i (p+1) , ⋯ , A i (p+h-1) be the fuzzified values at moments (t - p) , (t - p - 1) , ⋯ , (t - p - (h - 1)) respectively. Thus, the trend of A i (p+h-1) ⋯ A i (p+1) A i p is Δ i (p+h-2) ⋯ Δ i (p+1) Δ i p . The available multi-point trend association FLR is determined by the trend Δ i (p+h-2) ⋯ Δ i (p+1) Δ i p .
According to Definition 6, NR available multi-point trend association FLRs found in R.
According to the value of NR, the prediction
Case 1: NR ≠ 0
Let the NR available multi-point trend association FLRs be
Case 2: NR = 0
This case indicates that no available multi-point trend association FLR for forecasting, and then
The final prediction
From the above steps, the predictions of other values can be calculated. Figure 5 compares the form of multi-step-ahead prediction of the existing model and the proposed model.
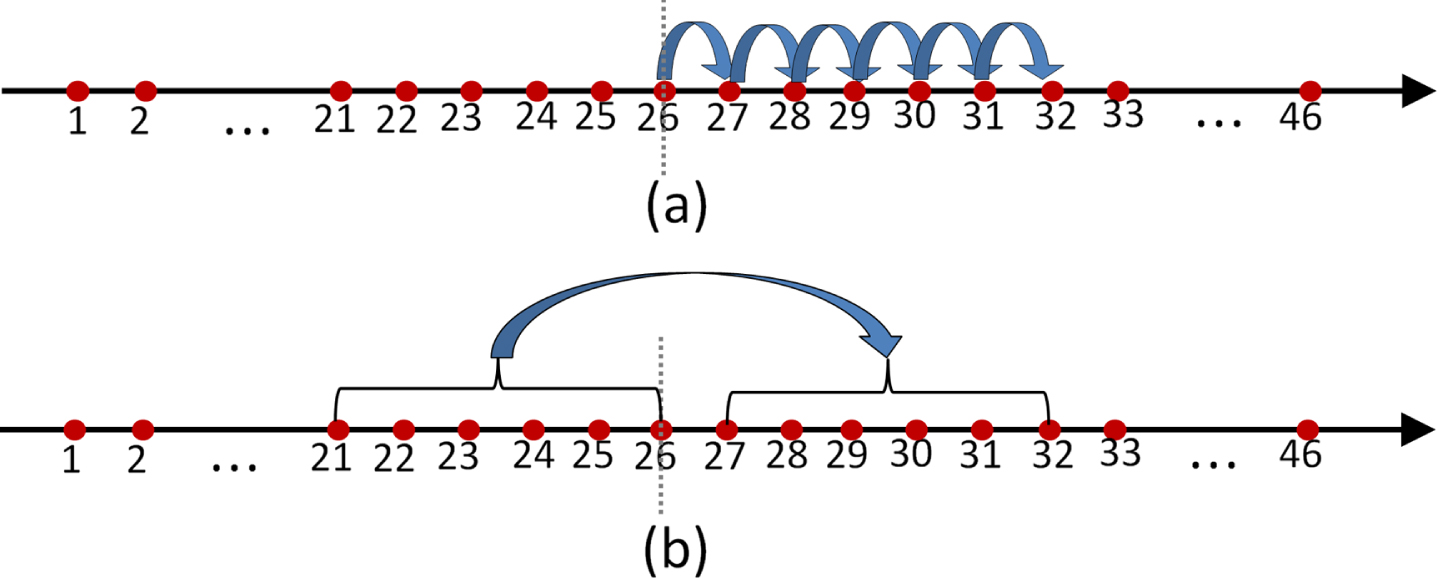
The form of multi-step-ahead forecasting of the existing model and the proposed model.
Figure 5 (a) shows the form of multi-step-ahead (6 steps ahead) forecasting for the existing model. It calculates the 6 steps predictions by iterating one step prediction, which brings the previous prediction errors into the next prediction;
Figure 5 (b) shows the form of multi-step-ahead forecasting for the proposed model. It uses 6 historical values (the values at moments 21-26) to predict 6 future values (the values at moments 27-32).
As can be seen in Fig. 5 that the prediction of our model can reduce the cumulate errors in multi-step-ahead forecasting. Therefore,
Four experiments are analyzed to verify the benefits of multi-point (trend) association FLRs and the superiority of multi-point (trend) association FLR based forecasting model in this section. Each experiment compares our proposed model with other 6 existing models: Chen’s model (2011) [26], Qiu’s model (2013) [44], Yang’s model (2017) [45], and three well-known multi-step-ahead forecasting models Support Vector Regression (SVR), Nonlinear Autoregressive Neural Networks (NAR) and Long Short-Term Memory Neural Network (LSTM). Through these comparisons, it can be found that the new proposed FLRs not only solve the problems occurred in the existing models, but also improve the forecasting accuracy.
Experiment on the synthetic time series
In order to express the forecasting process of the proposed model, an experiment is introduced detail here. This experiment carries out on a synthetic time series X ={ x1, x2, ⋯ , x121 } (shown in Fig. 6), which has various different trend characteristics. Worth noting that the first 91 data
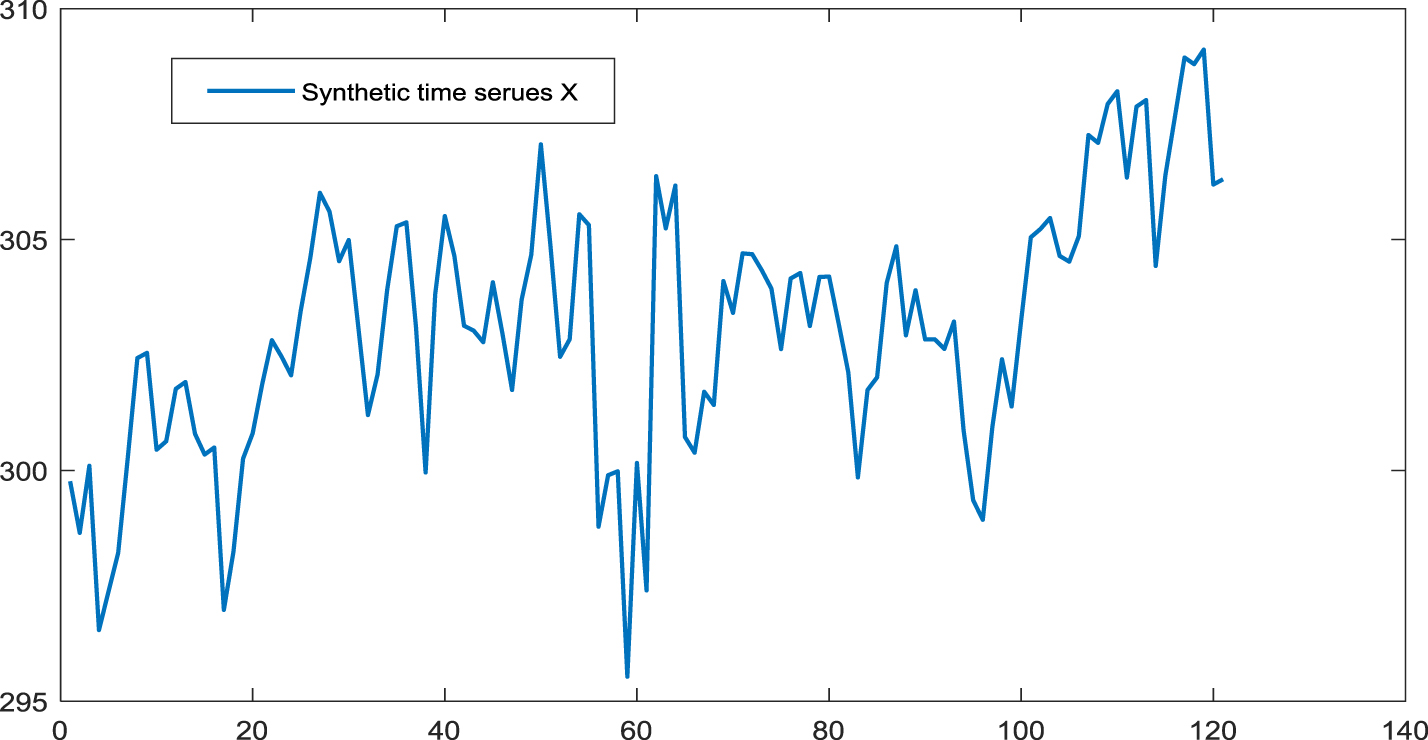
The synthetic time series X.
During experiment, the multi-point association FLRs are in the form F (t - 3) F (t - 2) F (t - 1) → F (t) F (t + 1) F (t + 2), i.e.,h = 3, (l + 1) = 3, corresponding multi-point trend association FLRs are in the form Δ i 2 Δ i 1 → Δ j 1 Δ j 2 Δ j 3 . The frequent threshold for these trend association FLRs is 3, it means that the number of occurrences of each high-order multi-point trend association FLR is more than or equal to 3.
Next, we take the forecasting of x99 as an example, the prediction
The fuzzifications of x96, x97, x98 are respective A3, A4, A4, and the trend of A3A4A4 is (1, 0).
According to (1, 0), 5 available multi-point trend association FLRs are mined: 1, 0 → 0, 0, 0 (5).
According to these available FLRs, the prediction
Through the same process, the predictions
The final prediction
In the same way, all the predictions of test dataset can be obtained. The forecasting performance of the proposed model and other existing models are analyzed from the following two sides:
The forecasting result in this paper is evaluated by the difference
Table 1 shows the d i s of each model. After comparing the last seven columns of this table, one can find that almost all the d i s of the proposed model are smaller than those of the existing models, thus the forecasting results of the proposed model are better than those of other 6 existing models.
Comparison of difference d
i
between the proposed model and other existing models on the synthetic time series
Comparison of difference d i between the proposed model and other existing models on the synthetic time series
In Table 1, the forecasting results of the proposed model are listed in the last column. By comparing the last column with the second column given by Chen’s model with the high-order trend FLRs, the better forecasting results of the proposed model state that the high-order multi-point trend association FLRs have more contribution to improving forecasting accuracy, which is realized by increasing the possibility of finding the available FLRs for forecasting. By comparing the last column with the third column given by Qiu’s model, which forecasts from high-order FLRs, we can find that consider the association between multiple premise observations and multiple consequent observations in time series forecasting is reasonable. The Yang’s model, SVR, NAR and LSTM are multi-step-ahead forecasting models, and they have cumulative errors in forecasting. After comparing the last five columns, the better forecasting performance of our model indicates that the multi-point (trend) association FLRs can improve forecasting performance by reducing cumulative errors.
The forecasting accuracy of each model is evaluated by AFER, RMSE and MAE indexes.
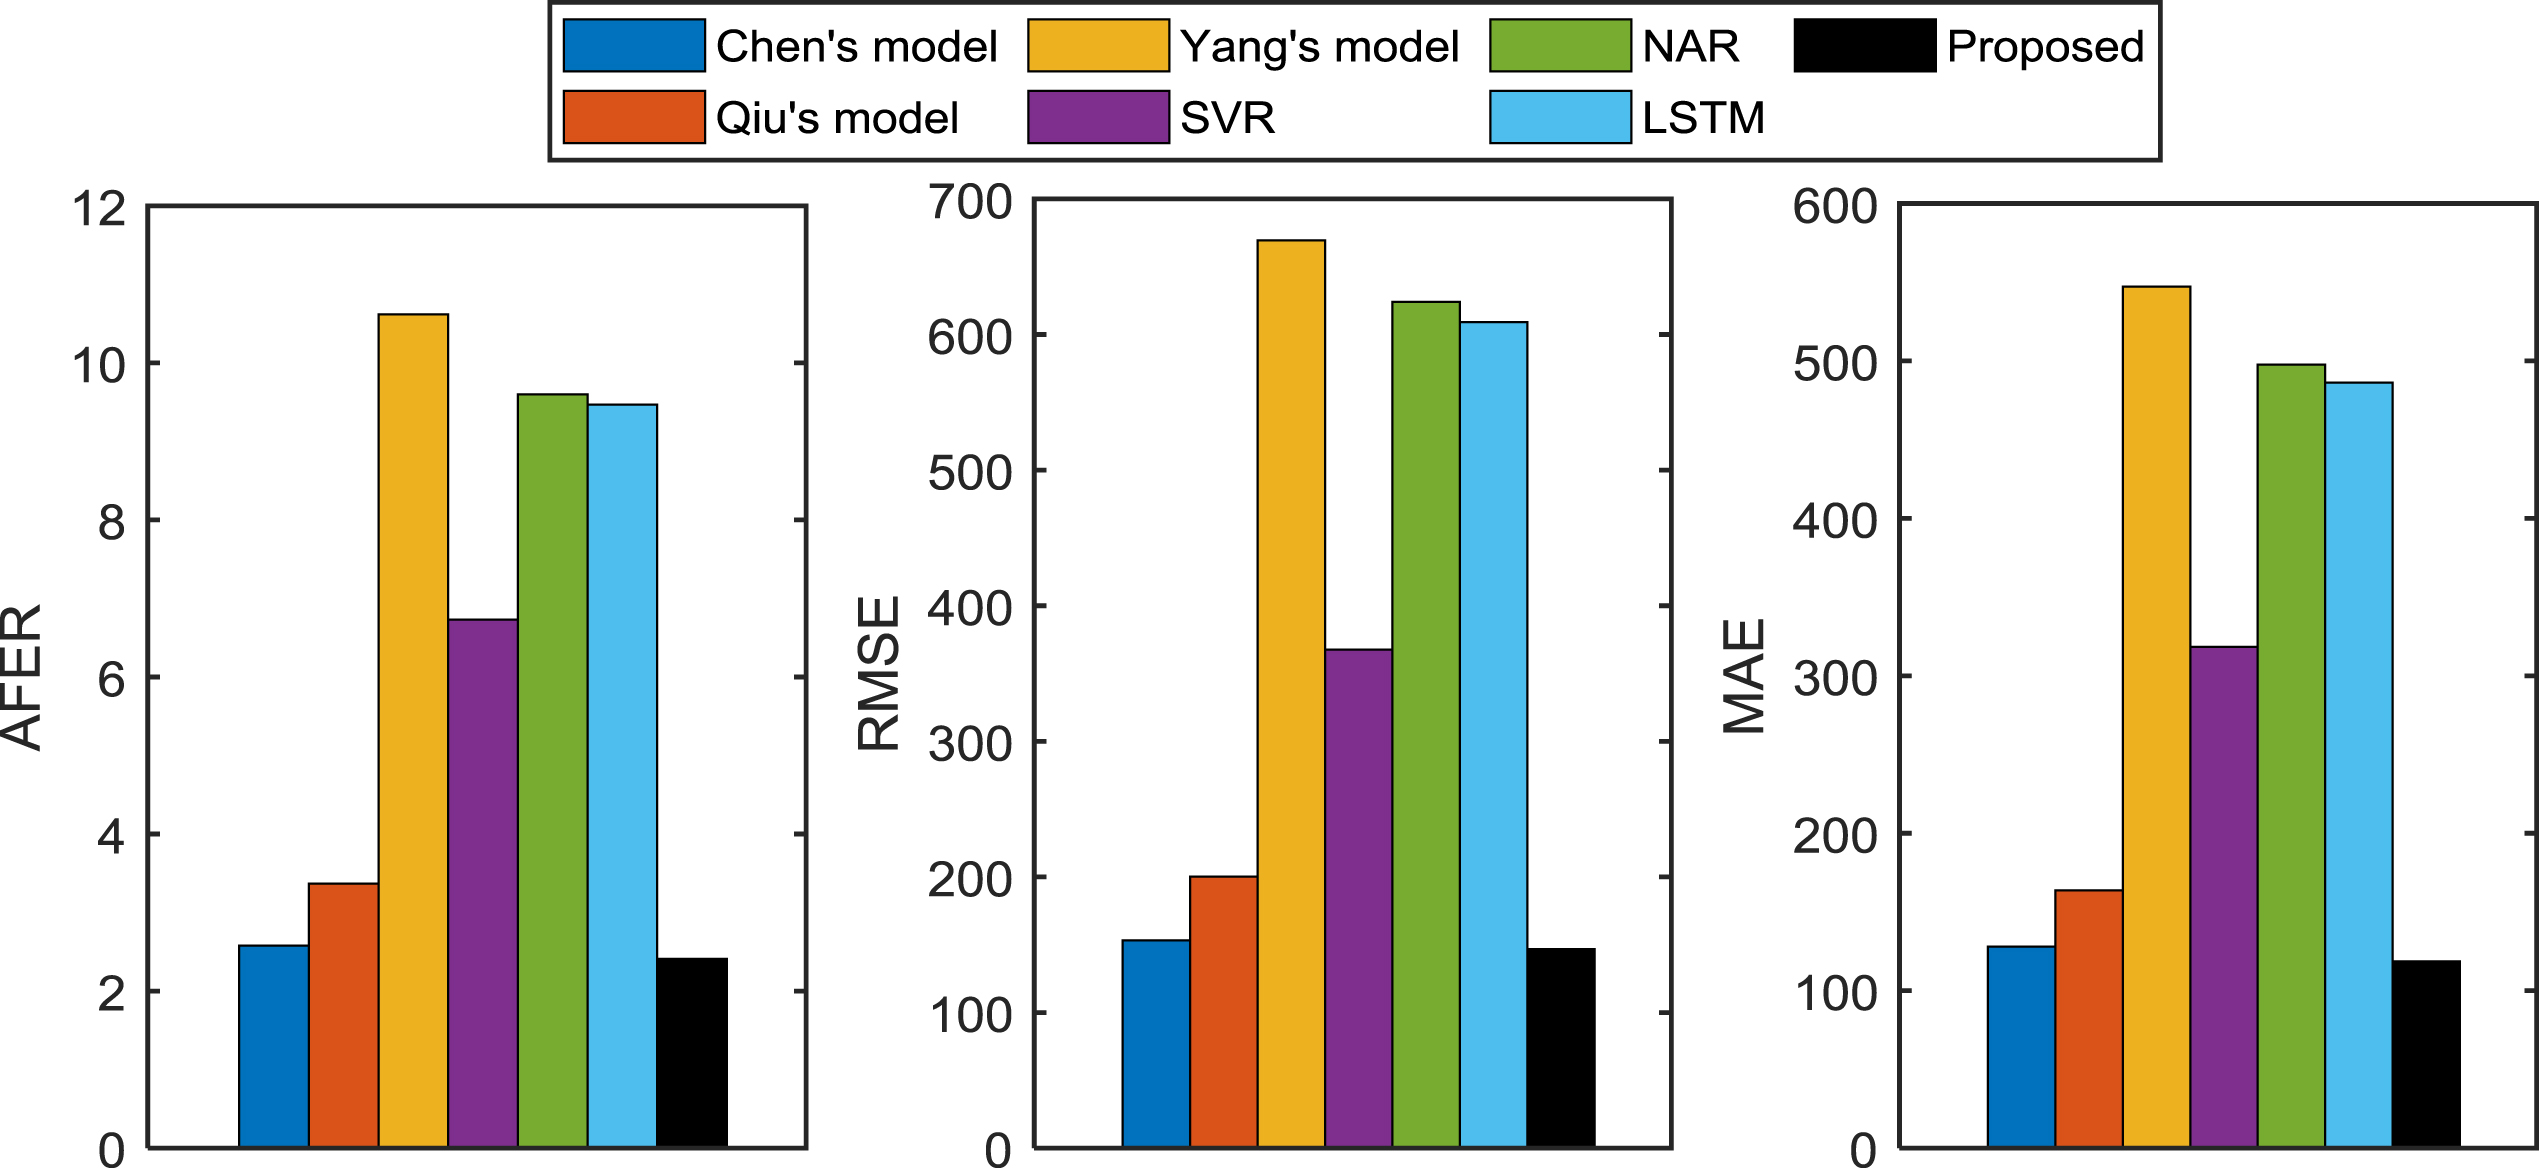
Table 2 shows the index values of the proposed model and other 6 existing models. In order to compare the values of each evaluation index clearly, Fig. 7 is drawn according to the results in Table 2, where Fig. 7 contains three figures: AFER-figure, RMSE-figure and MAE-figure.
Index values comparison between the proposed model and the existing models on the synthetic time series
Index values comparison between the proposed model and the existing models on the synthetic time series
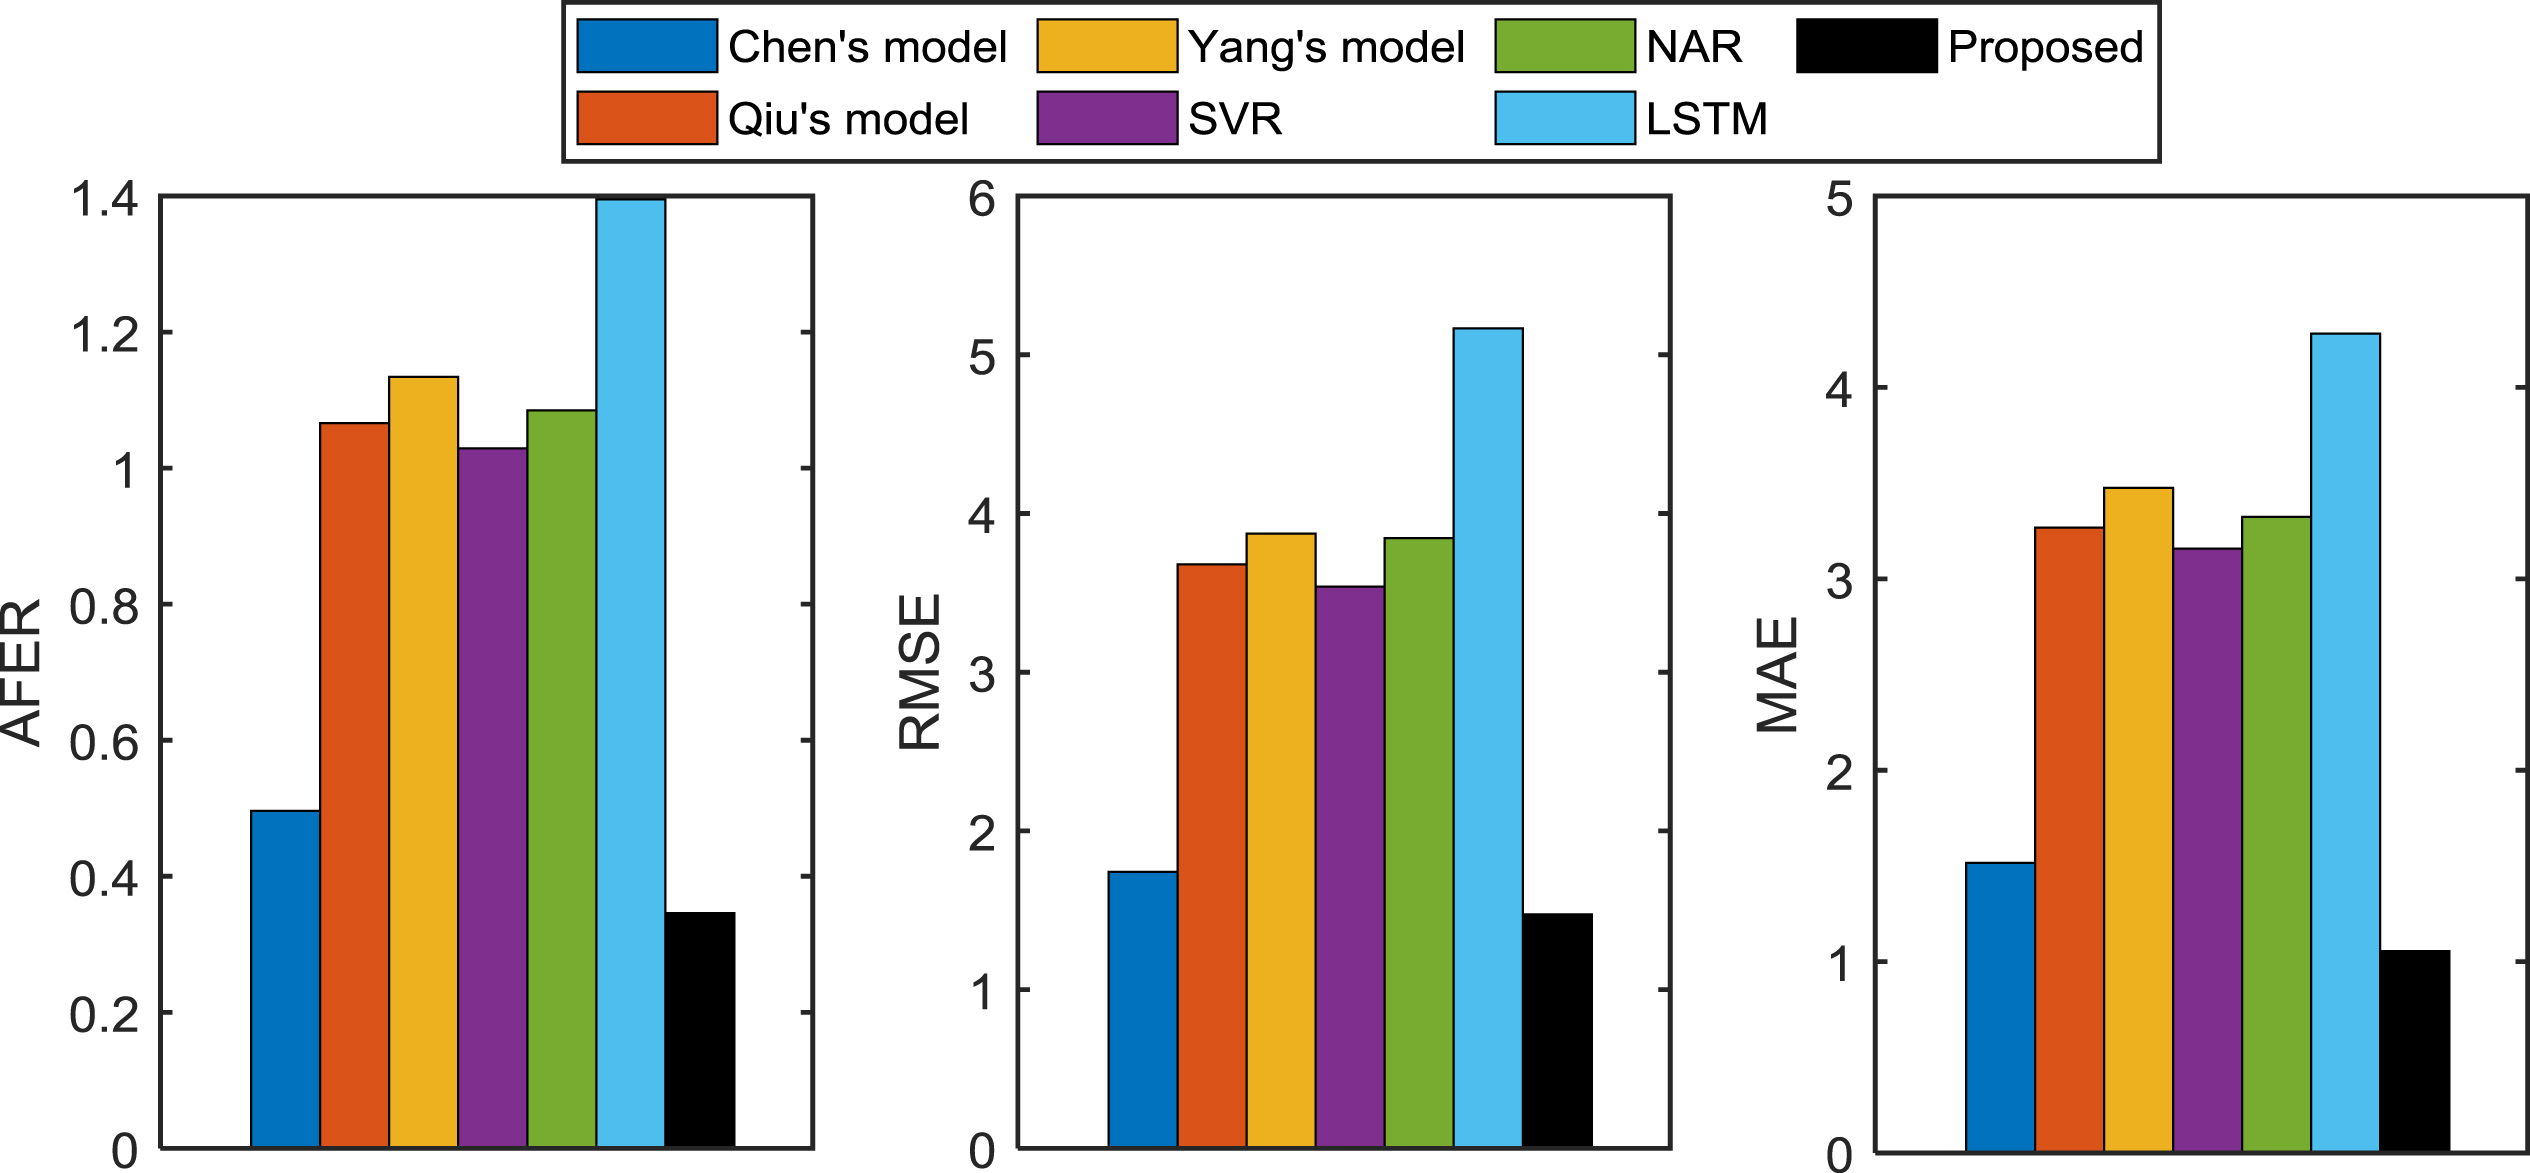
Index values comparison between the proposed model and the existing models on the synthetic time series.
After comparing the AFER values in AFER-figure, the RMSE values in RMSE-figure and the MAE values in MAE-figure, one can find that the value of each evaluation index of the proposed model is the smallest. It means that the forecasting accuracy of our model is better than other models.
From the above analyses, we can get a conclusion that the forecasting performance of the proposed model is better than the other 6 existing models.
This experiment is carried out on the Beijing temperature time series: the highest temperature from April 18, 2018 to August 30, 2019 (shown in Fig. 8, http://hz.zc12369.com/home/), which has multiple repeated trends. In the experiment, the ratio of training data to test data is 3 to 2, that is to say the first 300 data are used as training data, and the rest 200 data are used as test data.
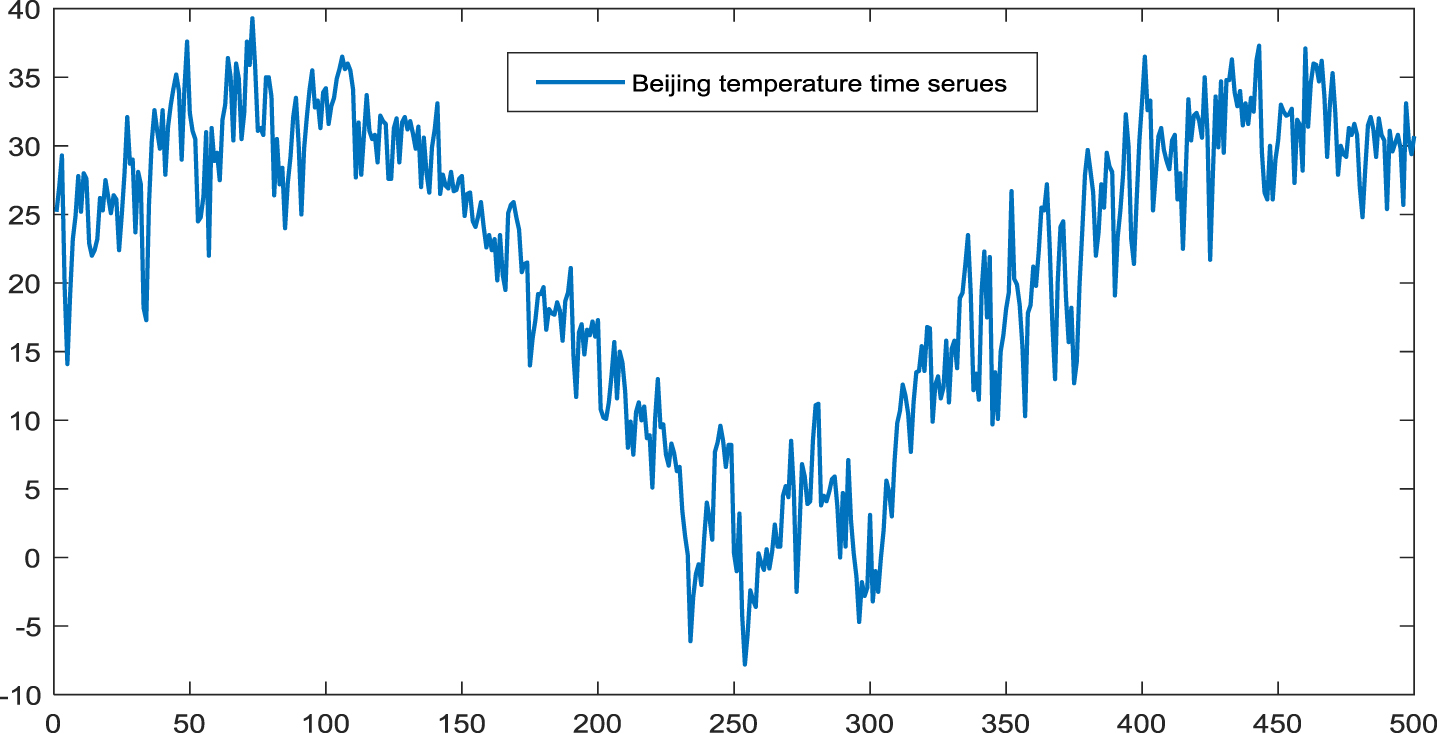
The Beijing temperature time series.
In real application, various number of steps want to be predicted. Therefore, we analysis the forecasting performance of the proposed model with different number of points here: (l + 1) = 2, 3, 4.
The AFER, RMSE and MAE values of the proposed model with different number of points of high-order multi-point association FLRs are listed in Table 3. From this table, we can find that the smallest AFER, RMSE and MAE values are got when (l + 1) =2.
Index values comparison of the proposed model under different number of points ls on Beijing temperature time series
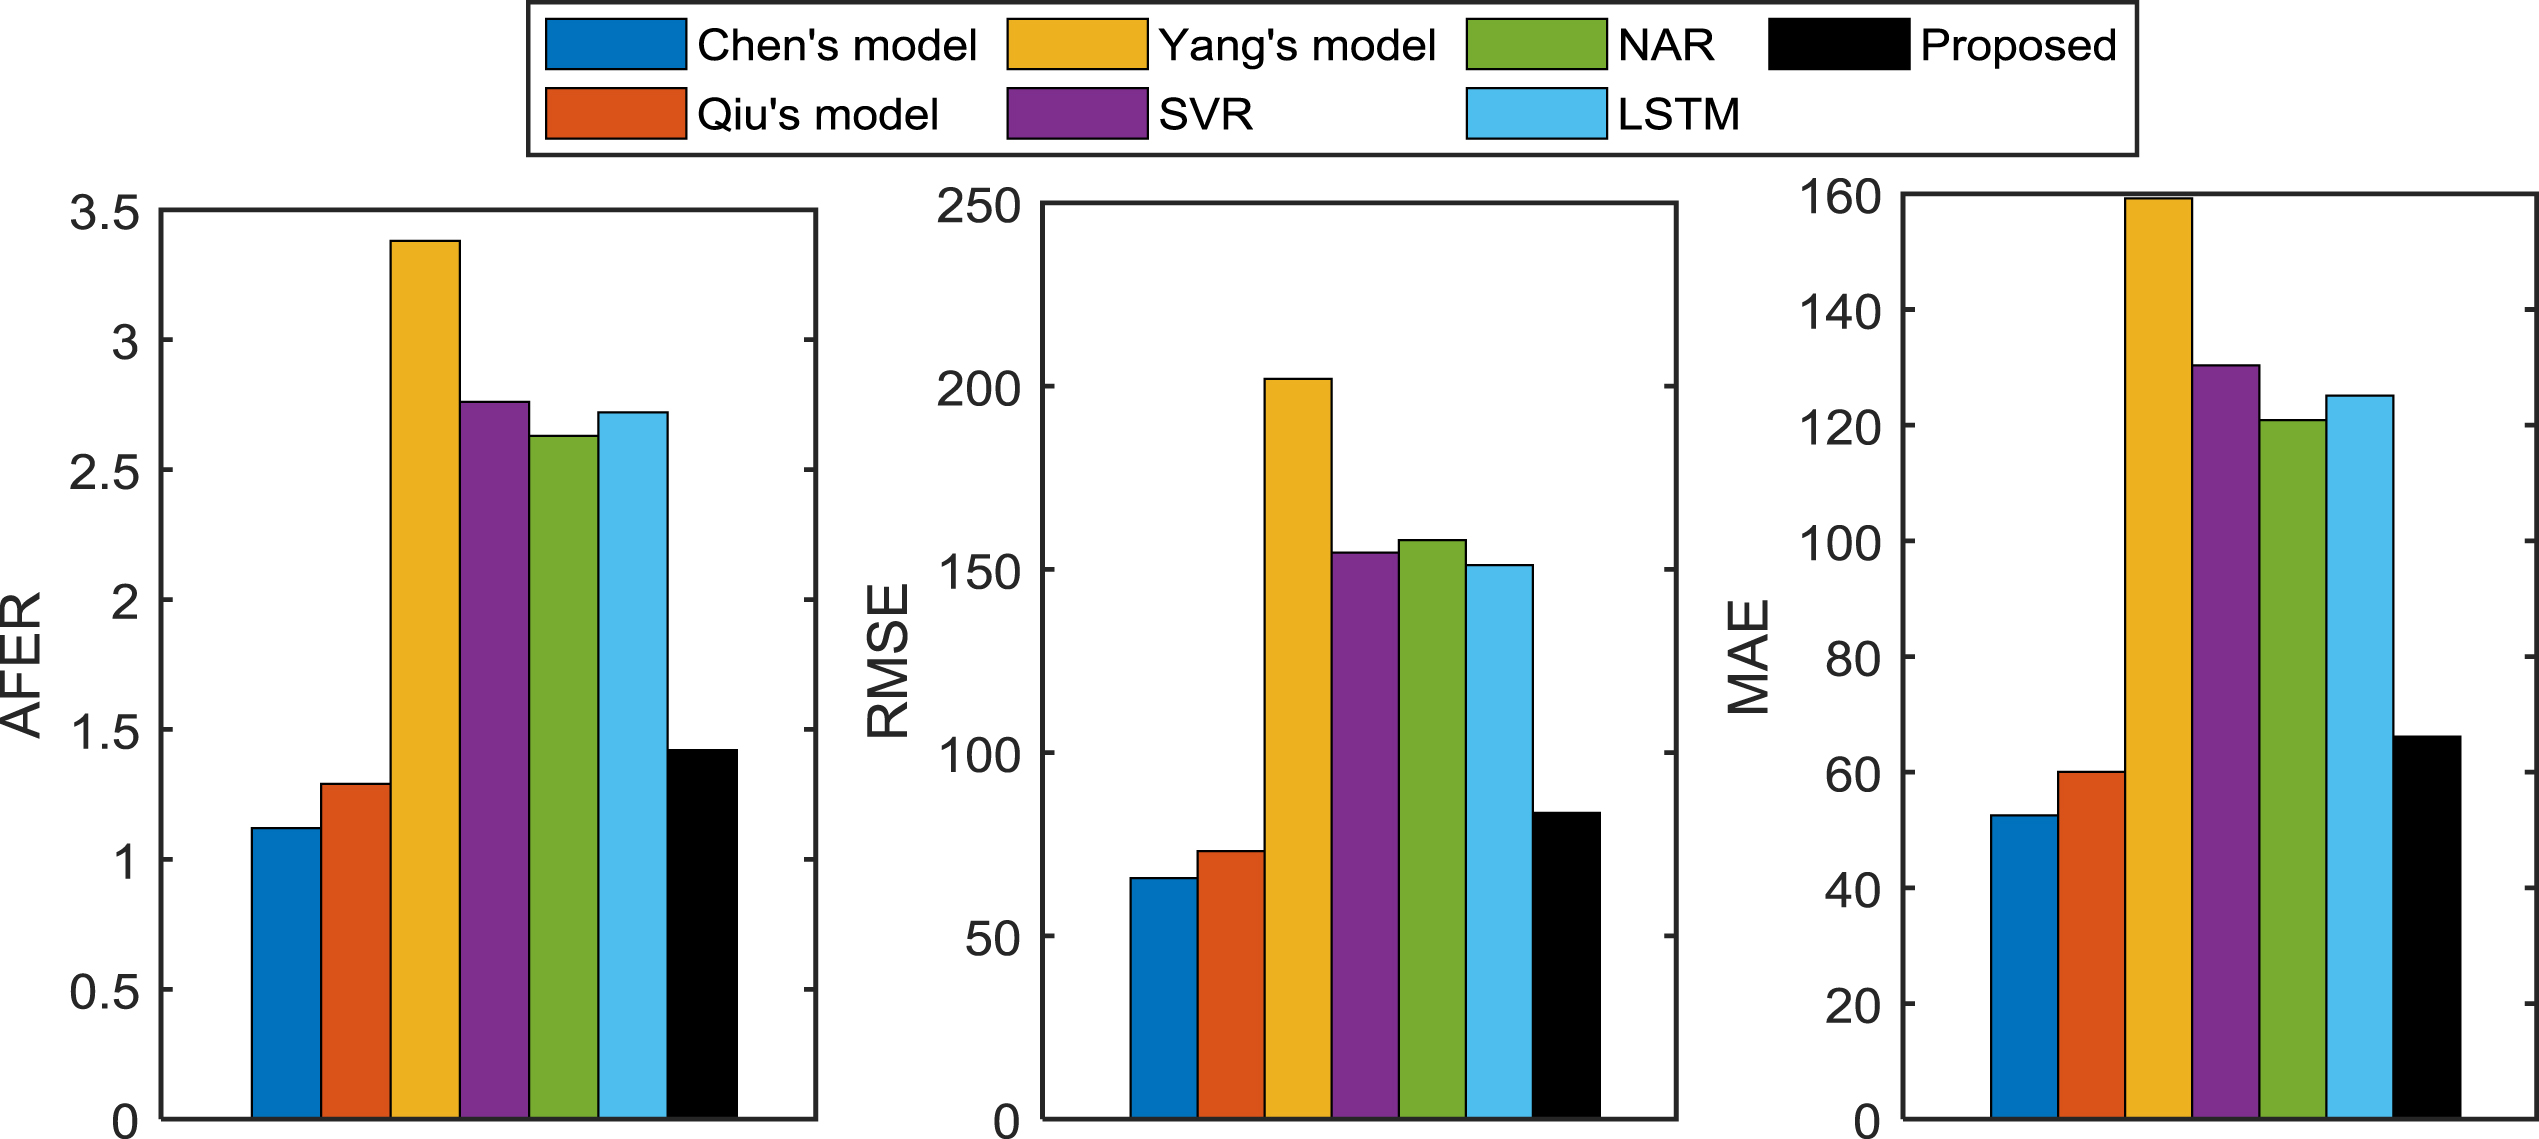
Table 4 lists the evaluation index values of other 6 models. For facilitate comparing the forecasting performance between the proposed models and other models, Fig. 9 is drawn according to the results in Table 3 and Table 4. In this figure, it’s obvious that the index values of our models are smaller than those of other 6 models. Therefore, the proposed model wins the best forecasting performance among these seven forecasting models.
Index values comparison between the proposed model and the existing models on Beijing temperature time series
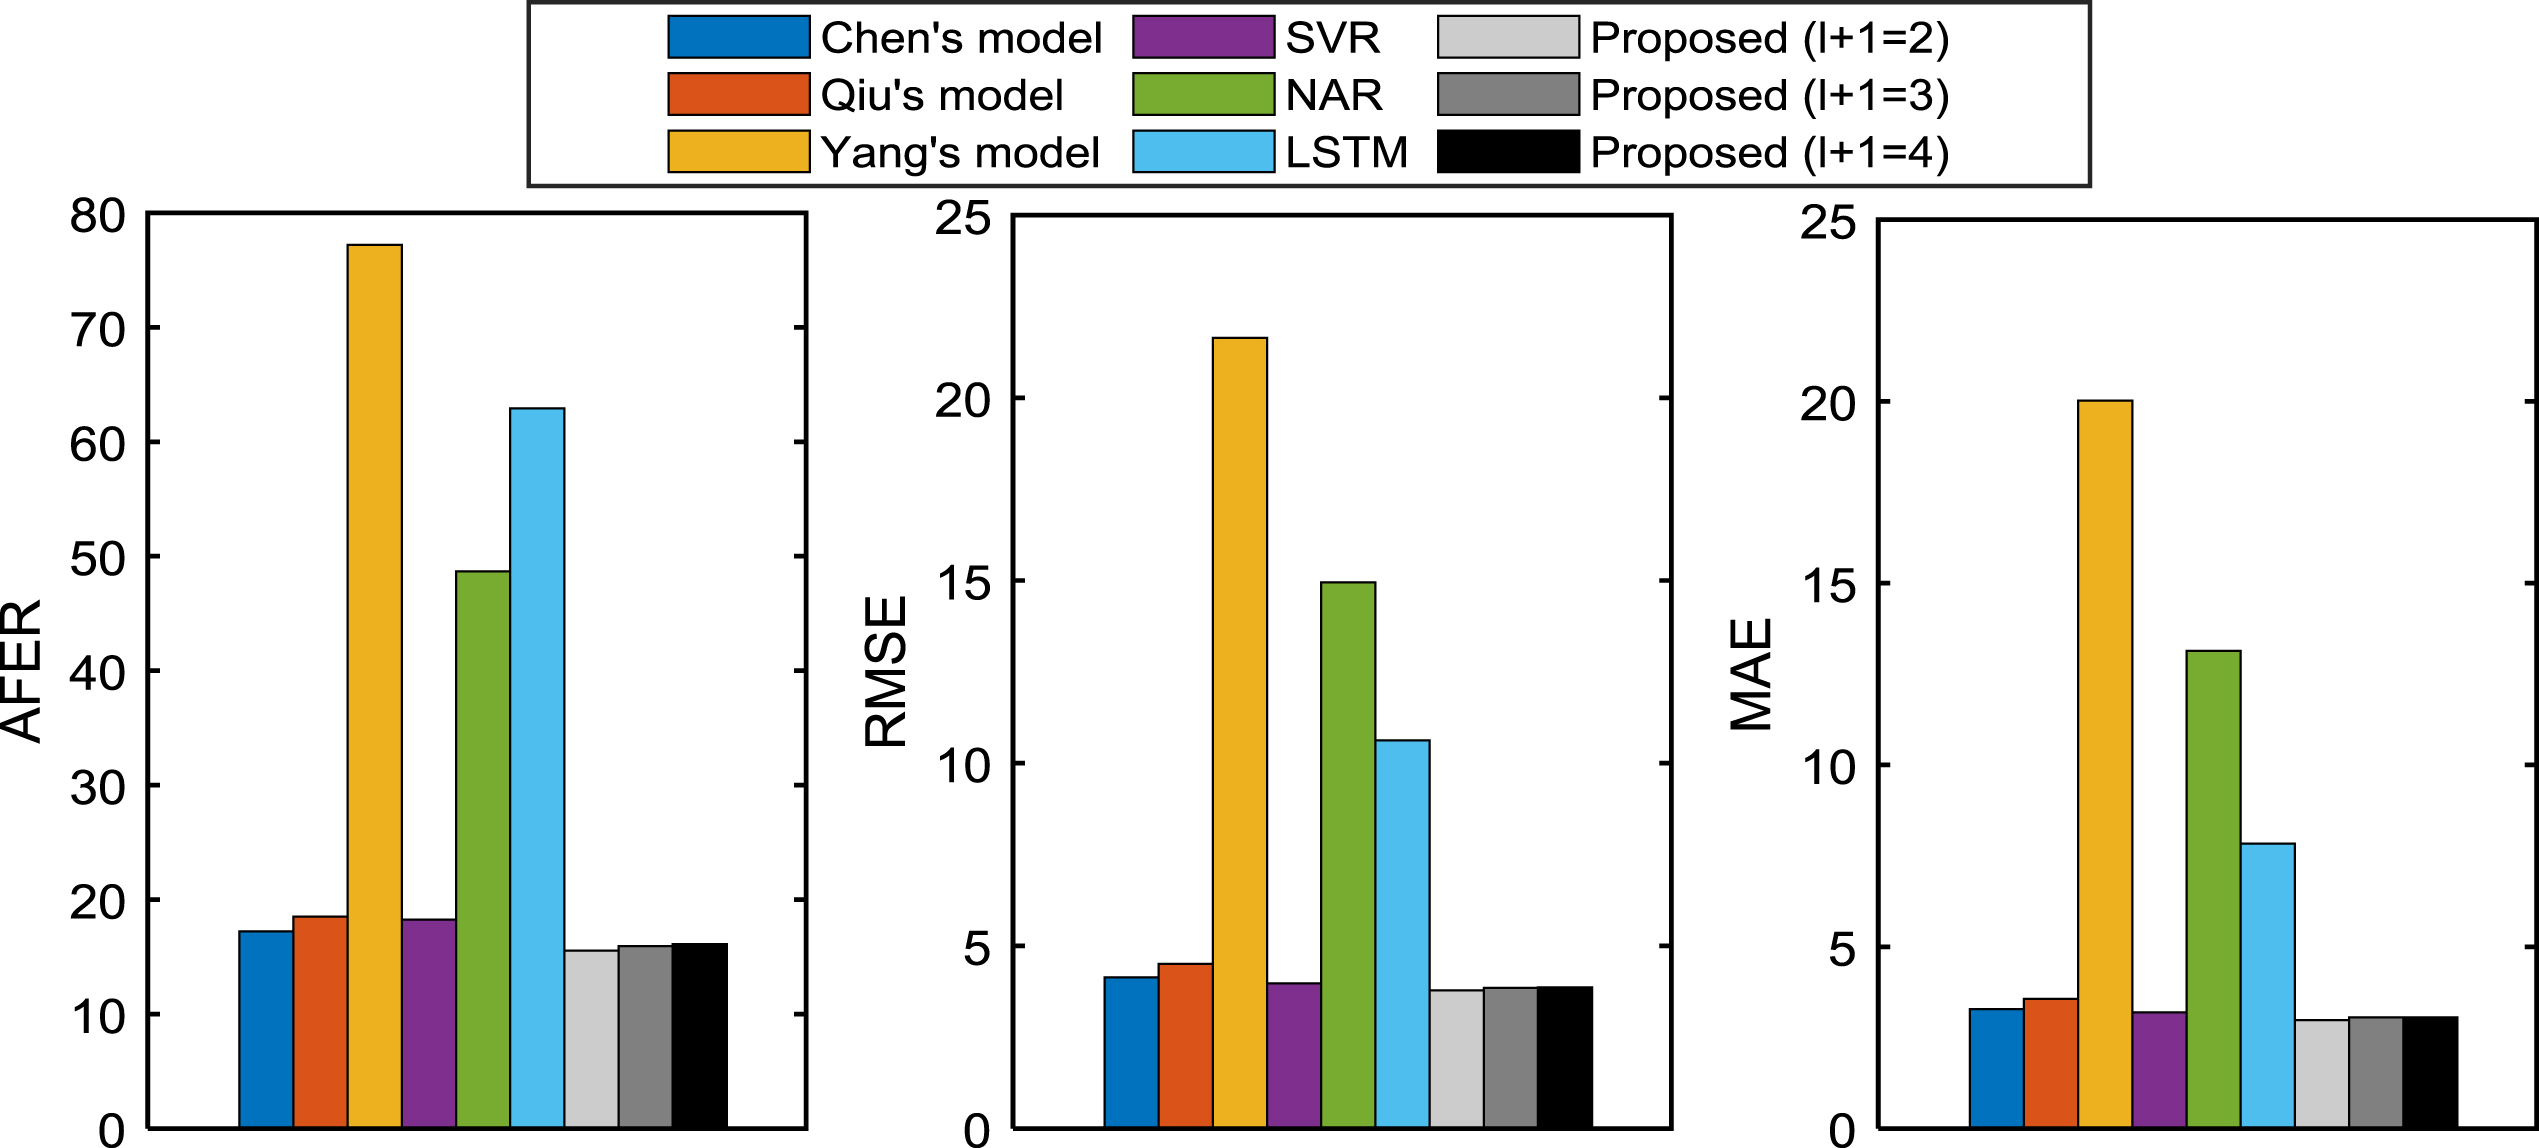
Index values comparison between the proposed model and the existing models on Beijing temperature time series.
Aim at revealing the superiority of the proposed model, an experiment is exhibited on the Hewlett-Packard stock price time series: the highest price in 2018 (shown in Fig. 10, https://finance.yahoo.com/quote/HPQ/). The main trend characteristic of this data is increasing first and then decreased.
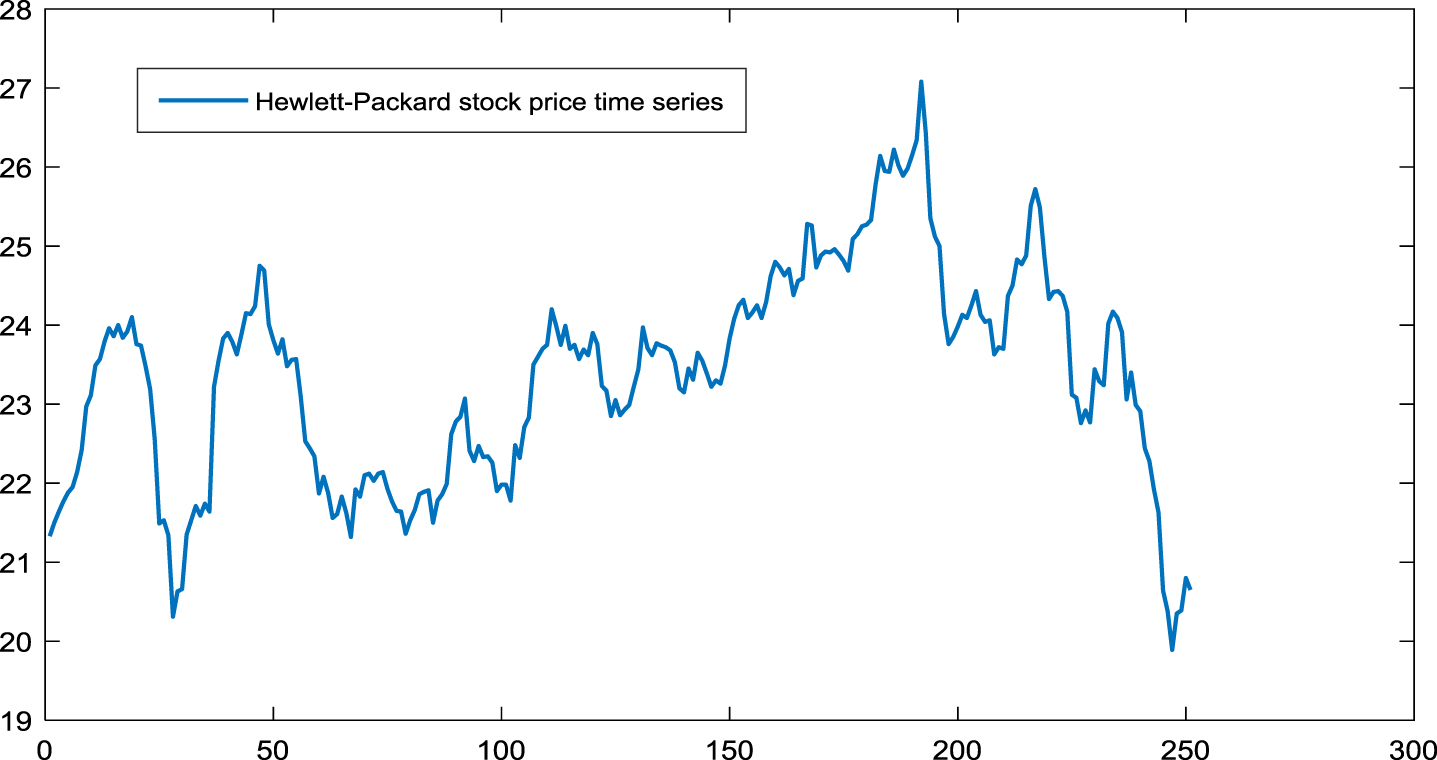
The Hewlett-Packard stock price time series.
In this experiment, the data of the first 10 months (from January to October) are used as training data, and the data of the last 2 months are test data. The multi-point association FLRs and multi-point trend association FLRs are respective in the form of F (t - 3) F (t - 2) F (t - 1) → F (t) F (t + 1) F (t + 2) F (t + 3) and Δ i 2 Δ i 1 → Δ j 1 Δ j 2 Δ j 3 Δ j 4 .
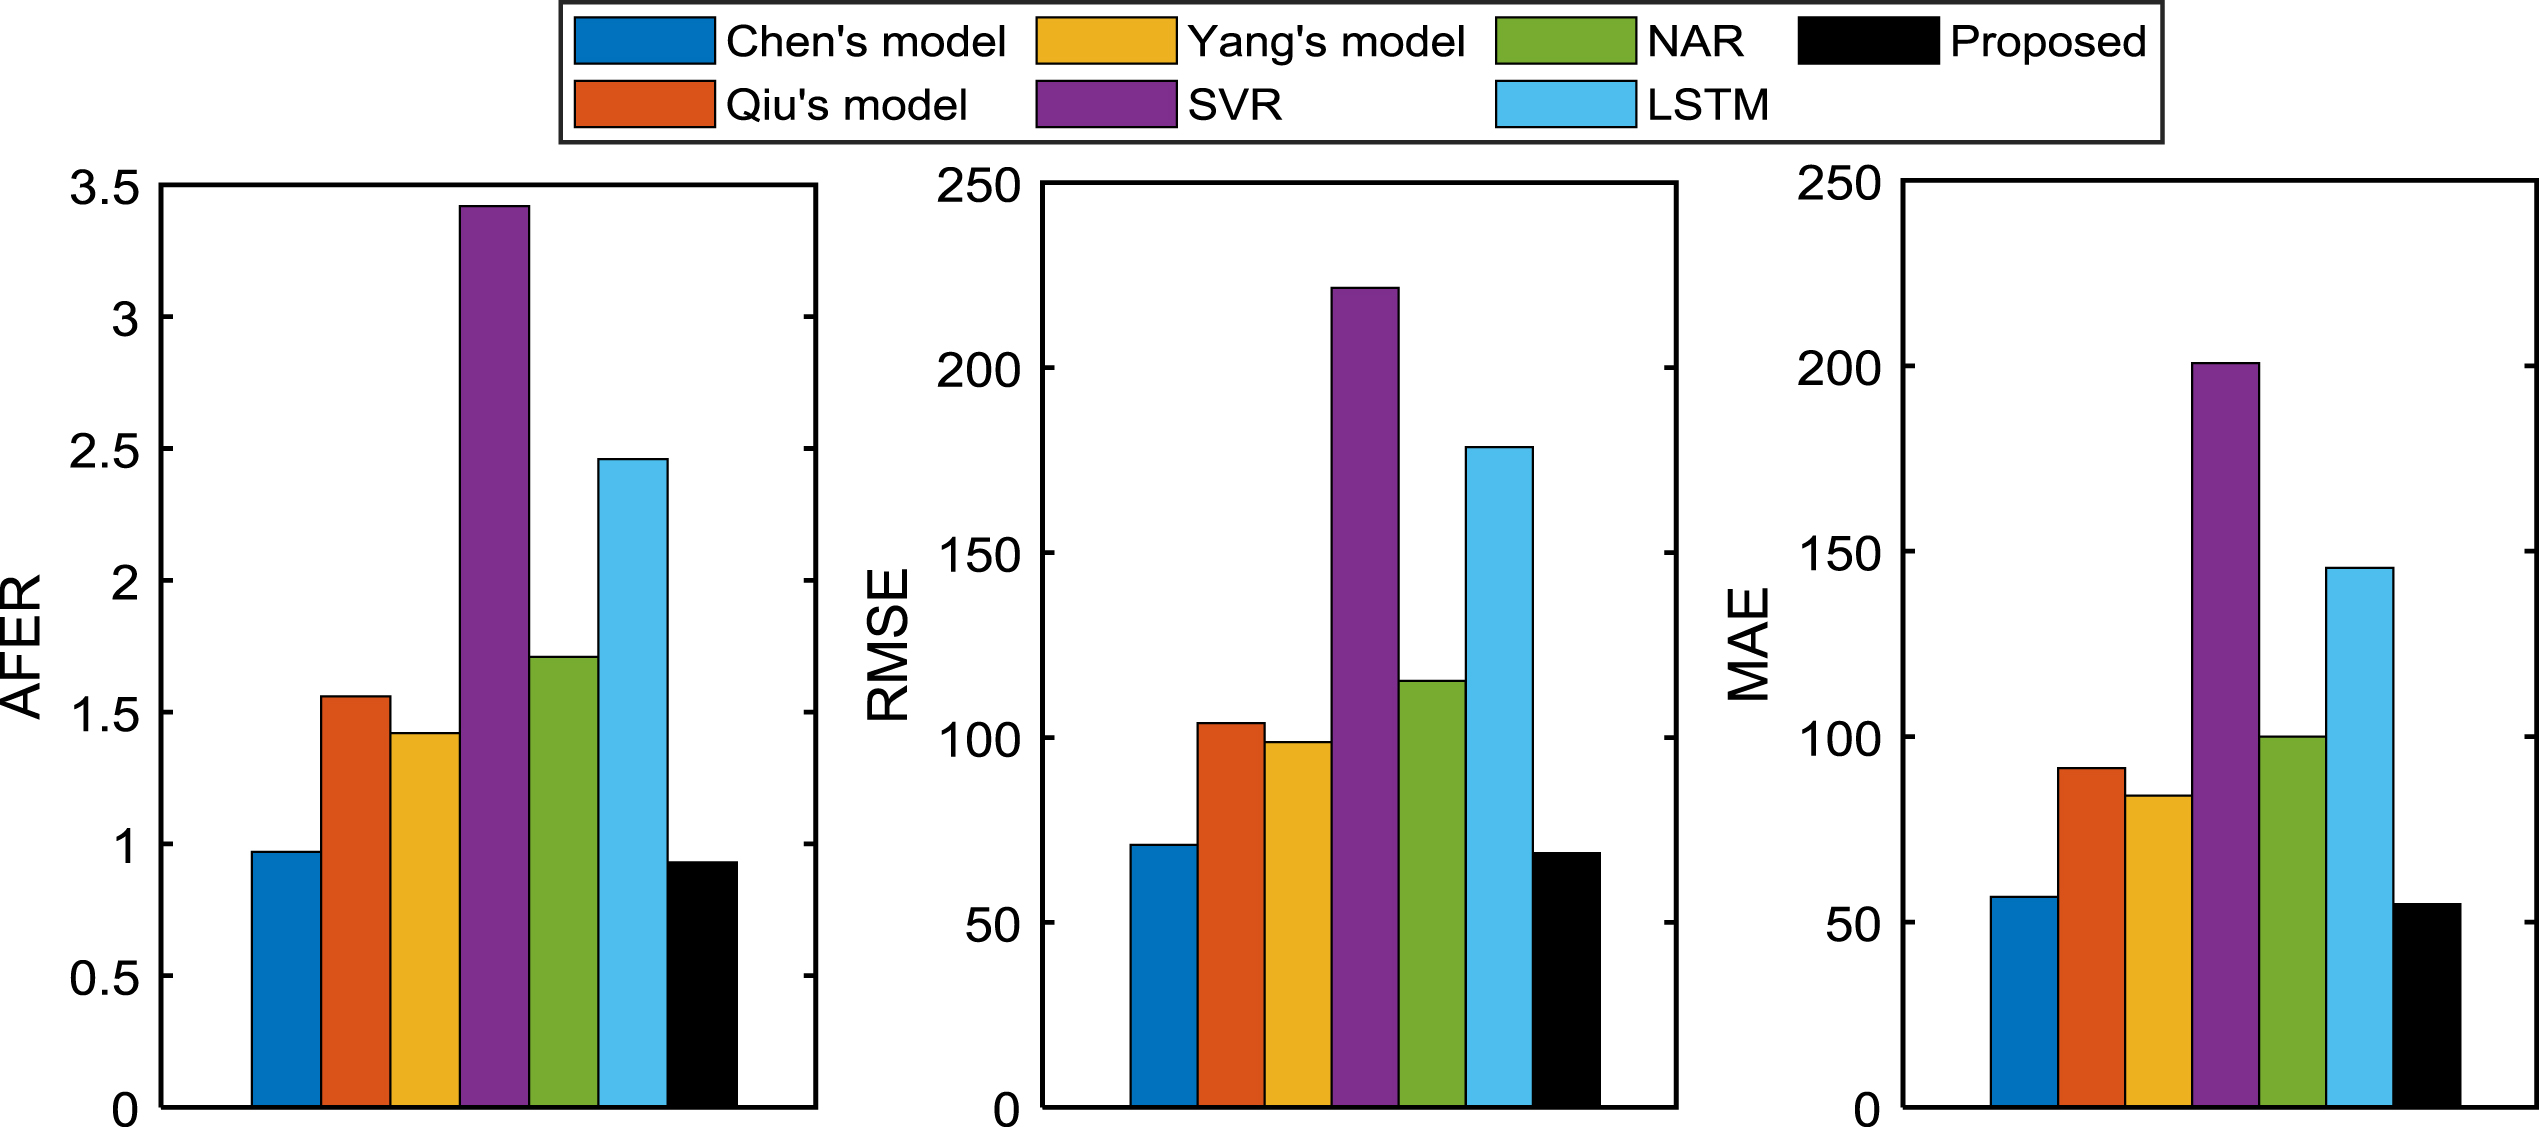
Table 5 expresses the index values of the proposed model and other existing models. In order to compare the forecasting accuracy of these seven models, Fig. 11 is got according to Table 5. After comparing these index values, it’s obvious that the multi-point association FLR based forecasting model obtains the smallest AFER, RMSE and MAE values.
Index values comparison between the proposed model and the existing models on Hewlett-Packard stock price time series

Index values comparison between the proposed model and the existing models on Hewlett-Packard stock price time series.
Five experiments are analyzed in this section. These experiments are carried out on the Taiwan stock index from 1999 to 2003: the open price [26].
The first experiment is made on the dataset of year 1999. During this experiment, the data from January to October are used as training data, and the data of the last 2 months are test data. The order and the number of points of FLRs are 3, i.e., h = 3 and (l + 1) = 3.
The second and the third experiments are respective carried out on the datasets of year 2000 and the dataset of year 2001 in the same manner as that in the dataset of year 1999.
About the fourth and the fifth experiments, they are carried out on the dataset of year 2002 and the dataset of year 2003 respectively. The multi-point association FLRs and multi-point trend association FLRs used in these experiments are respective in the form of F (t - 3) F (t - 2) F (t - 1) → F (t) F (t + 1) F (t + 2) F (t + 3) and Δ i 2 Δ i 1 → Δ j 1 Δ j 2 Δ j 3 Δ j 4 .
Table 6 lists the AFER, RMSE and MAE values of the proposed model and other 6 existing models, which obtained in the experiments on the Taiwan stock index time series for five years (from year 1999 to year 2003). According to these evaluation index values, Figs. 12–16 are drawn for comparing the forecasting performance of each model conveniently.
Index values comparison between the proposed model and the existing models on the five years time series (from 1999 to 2003)
Index values comparison between the proposed model and the existing models on the five years time series (from 1999 to 2003)

Index values comparison between the proposed model and the existing models on Taiwan stock index time series in 1999.

Index values comparison between the proposed model and the existing models on Taiwan stock index time series in 2000.
Index values comparison between the proposed model and the existing models on Taiwan stock index time series in 2001.
Index values comparison between the proposed model and the existing models on Taiwan stock index time series in 2002.
Index values comparison between the proposed model and the existing models on Taiwan stock index time series in 2003.
From the results shown in Figs. 12–16, the following conclusions are got: Taiwan stock index time series in 1999
By comparing the index values of our model with those of other models in Fig. 12, we can see that: the proposed model wins the best (the smallest) AFER, RMSE and MAE values on Taiwan stock index time series in 1999. Taiwan stock index time series in 2000, 2001 and 2003
From the forecasting performance on Taiwan stock index time series in 2000, 2001 and 2003 shown in Figs. 13, 16 respectively, the same conclusions as in Fig. 12 are obtained. Taiwan stock index time series in 2002
In Fig. 15, the AFER, RMSE and MAE values of Chen’s model are the smallest, and those of the proposed model are closer to Chen’s model.
The above conclusions indicate that the proposed forecasting model is superior to the other 6 models.
From the analyzes in Section 5, we come to three conclusions: The high-order multi-point (trend) association FLRs describe the association between multiple premise observations and multiple consequent observations in time series well; The high-order multi-point (trend) association FLRs can improve the forecasting performance by reducing the cumulative errors in multi-step-ahead forecasting; The high-order multi-point association FLR based forecasting model outperforms other 6 existing models.
Two new kinds of FLRs are proposed in this paper, namely high-order multi-point association FLRs and high-order multi-point trend association FLRs. Each of the former is constructed from multiple premise observations to multiple consequent observations, and each of the latter is constructed from the high-order multi-point association FLRs. These two kinds of FLRs describe the frequent associations existed in time series, and reflect the influence of antecedent trend on the consequent trend.
Using these proposed FLRs, we establish a novel multi-step-ahead forecasting model, the high-order multi-point (trend) association FLR based forecasting model. In this model, the multi-point association FLRs and the multi-point trend association FLRs describe the association of time series effectively. When implement the multi-step-ahead forecasting with this model, the high forecasting accuracy can be obtained by reducing the cumulative errors, it has been demonstrated in experimental study.
In this paper, we select the number of consequent observations (l + 1) in constructing high-order multi-point association FLRs randomly. In practice, (l + 1) is determined by the characters of time series. Moreover, the order of each FLR (h) also has a marked impact on forecasting. Therefore, for the sake of good forecasting performance, we will study how to get the optimal (l + 1) and h by considering the distribution of time series in future work.
Footnotes
Acknowledgment
This work is supported by the National Natural Science Foundation of China (No. 41961052, No. 61966039).