
Abstract
Internet of Things (IoT) services are directly deployed on resource-constrained smart devices. Smart devices are characteristic by spatial and temporal constraints and energy limitations. A single IoT service cannot meet the complex requirements of users, so multiple IoT services need to be combined to provide services to users. As more and more smart devices are deployed in IoT, how to select IoT services with lower energy consumption and better quality of service (QoS) for service composition becomes a challenging problem. Combined with the characteristics that the data information of IoT is closely related to geographical location, the GeoHash algorithm is used to locally screen services based on geographical location, so as to narrow the range of candidate services. For smart devices with energy constraints, this paper proposes a combined optimization model. The model considers not only the transmission energy consumption and switching energy consumption, but also the execution energy consumption when the device provides services. In order to balance QoS attributes and energy consumption, the composition problem is regarded as a multi-objective optimization problem and solved using a genetic algorithm (GA). The simulation results show that service composition scheme selected by this service composition optimization model has lower energy consumption and higher service quality.
Introduction
With the development of a new generation of technology, IoT has become the third wave of the information industry revolution [1]. IoT deploys a wide variety of smart devices and embedded sensors or actuators in different environments [2]. It makes the boundary between the physical and digital worlds increasingly blurred [3] and maximizes the communication between smart devices and the physical world. At present, production and life applications based on IoT have involved many fields, such as environmental monitoring, smart cities and industrial automation and agriculture [4]. Compared to traditional Web services, IoT can use sensor to identify and collect a large amount of information on sensing technology. This information can be transmitted through the Internet to provide real-time services [3]. In general, a smart device has significant limitations in function, computing power and storage capacity. Most smart devices need battery power, so the energy supply is also very limited. [4]. Therefore, functions provided by a smart device can barely meet complex needs of users. And multiple IoT services need to be combined according to a certain logical relationship to achieve specific goals.
With the development of the concept of services defining everything, smart devices are represented as IoT services [5]. Every function provided by a smart device is published to network as a service is an IoT service [6]. IoT can realize the sharing, interaction and service composition. Therefore, collaboration between smart devices can be simplified int a IoT service composition [7]. As shown in Fig. 1, this paper divides the IoT service framework into three layers. The first layer is smart device layer. Smart devices are described by name, energy value, spatial and temporal constraints, etc. Each device will provide one or more different IoT services; the second layer is service class layer. This layer encapsulates first layer of IoT services in different service classes according to their functions; the third layer is workflow layer. This layer obtains an abstract service combination sequence by parsing user requirement description documents. Then the corresponding service classes are connected along a fixed combination structure. Finally, the respective service classes are instantiated by discovering and selecting appropriate IoT services.

Three-layer architecture of IoT.
As the number of physical entities accessing network continues to increase, there are more and more IoT services with same or similar functions [8]. It is very important to choose the core services that best meet the needs of users. IoT services are deployed directly on smart devices with limited resources. Therefore, quality of service, temporal constraints, spatial constraints and energy consumption should be considered in IoT service composition. At present, there are a lot of literature on service composition in the environment of IoT. These literatures can be roughly divided into two categories: QoS based IoT service composition and energy consumption based IoT service composition. Firstly, QoS based IoT service composition is dedicated to find IoT services with optimal quality of service for combination. This kind of literature does not consider smart device energy consumption. Therefore, selected smart devices may be unable to provide services due to lack of energy. Most of literatures about IoT service composition based on energy consumption consider energy consumed by devices to transmit data in the process of equipment collaboration. Others also consider energy consumption of a single smart device when switching between two services in succession. At present, there is not much research on execution energy consumption of smart devices. Execution energy consumption is energy consumed by smart device itself when providing the corresponding IoT service. A smart device can provide multiple functions of IoT services, and different functions of services perform different energy consumption. In the service composition process, if execution energy consumption of devices is not considered, smart devices with excessive execution energy consumption may be selected to provide services. After smart device provides the service, it may be unable to provide other services due to low energy.
In order to solve the energy saving problem of service composition in IoT, a service composition optimization model is proposed in this paper. In this model, the transmission energy consumption, switching energy consumption and execution energy consumption are considered simultaneously. The execution time and throughput are taken as indicators to evaluate the QoS. The service composition sequence solved by genetic algorithm has lower energy consumption and better QoS.
The main contributions of this paper are summarized as follows: This paper distinguishes between two categories of services: concrete services and abstract services. A concrete service is an IoT service. It refers to a concrete service that can perform a specified function. An abstract service is a service class. It refers to a set of IoT services with similar functions, but they do not have the same QoS. Firstly, services provided by the smart devices are divided into service classes according to their functions. Then the corresponding abstract services and the initial set of candidate services for each abstract service are selected from user requirement description. Finally, the candidate service set is obtained by local filtering depending on the spatial constraints of smart devices; A service composition optimization model is proposed. The model considers execution energy consumption and switching energy consumption in addition to transmission energy consumption. It makes service consumption optimization model more complete. The QoS attribute and energy consumption of service are considered when building the composite model. This can avoid the failure of service quality to meet the needs of users and the failure of equipment to provide services due to low energy; Genetic algorithm is used to solve the combinatorial optimization model. The results show that IoT service composition scheme selected by this model has higher QoS and lower energy consumption.
The research of service composition and energy optimization in IoT is a new problem that spans many fields. Therefore, the research content is very rich. This paper mainly introduces the research status of QoS based IoT service composition, energy consumption based IoT service composition and QoS and energy consumption based IoT service composition in IoT environment. Specific research introductions are presented in tables, as shown in Table 1.
Research status
Research status
To sum up, relevant researches on QoS based IoT service composition only consider service quality without considering the impact of smart device energy consumption on composition results, which may lead to the failure of selected service due to the low residual energy of smart device providing service, resulting in the failure of service composition. Based on energy consumption of IoT service composition of related study, this kind of literature disadvantage is that the only considers energy consumption and ignore the influence of service quality to the composition, may lead to choose composition IoT service due to QoS does not meet the user requirements, such as choice of service very low energy consumption, but cost is much higher than the user can eventually make service portfolio failure; In the relevant research on IoT service composition based on QoS and energy consumption, the influence of QoS attribute value and energy consumption on the result of service composition is considered simultaneously. However, most literatures only consider transmission energy consumption required for data transmission between two devices when constructing energy consumption model. A few literatures considered transmission energy consumption and switching energy consumption required by the same smart device to continuously provide services of two different functions, but no literatures considered execution energy consumption of device itself when providing services.
In view of the current study, the problem of model building consideration is not enough comprehensive energy consumption, this paper proposes a combination optimization model, not only consider transfer of data between two devices needed for continuous transmission energy consumption and a single device provides two functions switching energy produced during different service, also considered smart devices produced the execution of energy consumption when providing service itself. Finally, the multi-objective optimization algorithm is used to search global optimization in the feasible service composition space.
Concept definition
In this paper, IoT services are classified into two categories: abstract services and concrete services. Concrete services are concrete, executable IoT services provided by smart devices. Abstract services, also known as service classes, are a set of concrete services with the same or similar functions. There are two types of attributes for concrete services: functional attributes and non-functional attributes. Functional attributes indicate the specific functionality provided by the service. Non-functional attributes include information such as the available energy of the smart device providing the service and QoS such as execution time, throughput, etc. In this paper, IoT service composition sequence is defined as abstract service combination sequence. It consists of a limited set of abstract services and a series of control processes. The abstract services are combined on the basis of the control processes, which leads to the service composition.
The abstract service is defined as shown in Equation (1).
Where AS i denotes the abstract service that can achieve the ith function in the abstract service combination sequence. CSi,j denotes the jth concrete service that can achieve this kind of function.
The concrete service is defined as shown in Equation (2).
Where CSi,j denotes the jth specific service that can achieve the ith function. QoS (CSi,j) denotes the value of QoS of the concrete service. Fun (CSi,j) denotes the functional attributes of this concrete service. It is represented by a custom triple Fun (CSi,j) = (Name, Desc, Class). Where Name denotes the name of the concrete service. Desc denotes the functional description of the concrete service. Class denotes the category to which the concrete service belongs. D (CSi,j) denotes the smart device that provides the concrete service. A smart device is represented by a custom five-tuple D (CSi,j) = (EA(D (CSi,j)) , TC (D (CSi,j)), SC (D (CSi,j)) , Loc(D (CSi,j)) , rad (D (CSi,j))). Where EA (D (CSi,j))denotes the remaining available energy of the smart device. TC (D (CSi,j)) denotes the time constraint of the device. SC (D (CSi,j)) is the spatial constraint of the device, Loc (D (CSi,j)) denotes the geographic location of the device. rad (D (CSi,j)) denotes the communication radius of the device. The spatial constraint is determined by the geographic location of the device and the communication radius.
An abstract service combination sequence is represented by a custom binary T = (AS s , TS s ). Where T denotes an abstract service combination sequence. AS s denotes a finite set of abstract services. TRs denotes a set of control structures, including sequential, parallel, branch and loop.
An example of an abstract service combination sequence given in this paper is shown in Fig. 2. Where start denotes the beginning, end denotes the end. AS1,AS2, etc. indicate abstract services, and each data indicates a sequence of abstract service combination.

Example of the abstract service composition sequence.
Among them, “,” denotes sequential structure, “()” denotes parallel structure, “&” denotes branch structure, and circular structure is not considered in this paper for the time being.
Unlike traditional Web services, IoT services are deployed directly on smart devices. These devices have limited computing power and storage capacity. And most devices are powered by batteries, which can run out of power at any time. Therefore, it is particularly important to choose IoT services that consume less energy for composition. Different smart devices have different CPU performance and have very different execution energy consumption when providing the same or similar functional IoT services. The lower execution energy consumption, has less impact on the overall IoT environment. When selecting IoT services for composition, smart devices with lower execution energy consumption should be selected to extend the lifetime of smart devices.
Execution energy consumption calculation
Execution energy consumption represents energy consumed by a smart device itself in providing a concrete service CSi,j. The CPU of a smart device mainly consists of two states, which are running state and idle state. If the CPU has a task to execute, it is in the running state, and if there is no task, it is in the idle state. Energy consumption when CPU is in operation is calculated as shown in Equation(3).
Where E cal (CSi,j) denotes the energy consumption of CPU of the smart device providing the service in running state. P cal (D (CSi,j)) denotes the power of CPU of this device in running state, i.e., running power of CPU. T cal (CSi,j) denotes the execution time of this concrete service.
Energy consumption when CPU is in idle state is calculated as shown in Equation (4).
Where E
idle
(CSi,j) denotes the energy consumption of CPU of this smart device providing the service in idle state, P
idle
(D (CSi,j)) denotes the power of CPU of this device in idle state, i.e., idle power of CPU. T
idle
(CSi,j) denotes the time the device is in idle state, which is calculated as shown in Equation (5).
Where T idle (CSi,j) indicates a time when a smart device providing that concrete service is idle during the composition. T all (T) indicates the time required to execute the entire composition of IoT services. T cal (CSi,j) indicates the execution time of this concrete service.
The total execution energy consumption is calculated as shown in Equation (6).
In an abstract combination sequence, two services are called adjacent services if execution of previous service is completed before the next service can be executed. Suppose an abstract service combination sequence is shown in Fig. 2. AS1 and AS2 are adjacent services; AS3 and AS4 are parallel structures and AS2 is executed at the end of execution, so that AS2, AS3 and AS2, AS4 are all adjacent services; AS5 and AS6 are branching structures and execute after the parallel structure (AS3, AS4). If the last service selected for execution is AS5, then AS3, AS5 and AS4, AS5 are adjacent services. In the process of combining IoT services, transmission energy consumption is generated when the devices providing adjacent services are two different smart devices. Transmission energy consumption is mainly energy consumption generated by data transmission between two smart devices, including sending energy consumption and receiving energy consumption. In this paper, the first-order radio model is used to calculate transmission energy consumption, which is often used in the field of wireless sensor networks.
Sending energy consumption is the energy consumed by a smart device providing a previous IoT service when transmitting data to a smart device providing the next service. Sending energy consumption is calculated as shown in Equation (7).
Where E elec (CSi,j) denotes energy required by current device to transmit unit packet, ɛ elec (CSi,j) is the energy required by transmitting amplifier to transmit unit packet, K is packet size by the current service CSi,j, n is the fading index, i.e., the signal of data in transmission grows with distance and weakening. The fading index in general wireless sensor networks takes as [2, 5], and d denotes distance between two smart devices. Distance is calculated as shown in Equation (8).
Where x (CSi,j) and x (CSi+1,j) are two adjacent services, CSi,j is a former concrete service. CSi+1,j is a latter concrete service, and sending energy is the energy consumed by the smart device providing the concrete service.
Receive energy consumption is the energy required by successor smart device to receive data and is calculated as shown in Equation (9).
The total transmission energy consumption is calculated as shown in Equation (10).
Switching energy consumption occurs when adjacent services in a composition of IoT services are provided by the same smart device. Switching energy consumption refers to a smart device that consumes some energy as it needs to adjust memory, clear cache, etc. during task switching when providing two services with different functions in succession. Switching energy consumption is calculated as shown in Equation (11).
Where E change (CSi,j) denotes switching energy consumption. T change (CSi,j) denotes time required for the device to switch services. P idle (D (CSi,j)) denotes idle power of smart device in the idle state.
The total energy consumption of candidate service
Where E (CSi,j) denotes energy consumed to provide the concrete service. E
cal
(CSi,j) denotes execution energy consumption, E
net
(CSi,j) denotes transmission energy consumption. E
change
(CSi,j) denotes switching energy consumption. the values of α and β are 0 or 1. If adjacent services in the combination are provided by a same smart device, α = 0, β = 1;if adjacent services in the combination are provided by a different smart device,α = 1, β = 0. To eliminate the magnitudes, E (CSi,j) is normalization and the normalization is calculated as shown in Equation (13).
Where E′ (CSi,j) denotes normalized energy consumption value. EA (D (CSi,j) denotes remaining available energy of a smart device providing the concrete service. E (CSi,j) denotes energy consumed to provide the concrete service.
If an IoT service composition consists of n abstract services, total energy consumption of this service composition is calculated as shown in Equation (14).
Where E (T) denotes energy consumption of an entire service composition. E (CSi,j) denotes total energy consumption of a selected concrete services capable of providing the ith abstract service function.
If each concrete service has x QoS attribute values, QoS for a concrete service in this paper is defined as shown in Equation (15).
Where QoS (CSi,j) denotes the QoS attribute value of the concrete service. qos k (CSi,j) denotes the kth QoS attribute value of the concrete service. QoS attributes of IoT services are divided into positive and negative attributes. Positive attributes are attributes positively related to service quality, and their higher values are more beneficial to service effectiveness, and common positive attributes include throughput, etc.; negative attributes are attributes negatively related to service quality, and their lower values are more beneficial to service effectiveness, and common negative attributes include execution time, etc. In order to eliminate the influence of different scales, QoS attribute values need to be normalized as shown in Equation (16).
Where qos k (CSi,j) is the actual value of the kth QoS attribute of concrete service CSi,j, qosk,max and qosk,min denote the maximum and minimum values of the kth attribute of all concrete services in the abstract service in which the concrete service is located, respectively, denotes the normalized value of the kth QoS attribute of the concrete service. After normalization of each QoS attribute value of the concrete service, the normalized quality of service of the concrete service is defined as shown in Equation (17).
If an IoT service composition consists of n abstract services, each with x QoS attribute values, the quality of service of an IoT service composition is defined as shown in Equation (18).
Where Q k denotes the total value of the kth QoS attribute in the composition.
Since QoS attributes are calculated differently under different combination structures, this paper gives different calculation methods for each QoS attribute under four workflows according to the characteristics of different QoS attributes, using execution time and throughput as examples, as shown in Table 2.
QoS calculation methods under four workflows
Where
The total QoS for IoT service composition is calculated as shown in Equation (19).
Where w k is the weight coefficient of the kth QoS attribute value, satisfying ∑ x k=1w k = 1. For quality attribute weights this paper uses an equal split to obtain.
A combinatorial optimization problem is a search for the optimal solution of an objective function in a discrete finite mathematical structure under a given set of constraints. The sub-objectives of a multi-objective optimization problem are not independent of each other, so it is not possible to make all sub-objectives reach the optimal value, but only to coordinate and balance among multiple sub-objectives, and eventually make each sub-objective as relatively optimal as possible. The multi-objective optimization problem can be represented as shown in Equation (20).
Where f n (x) is the objective to be optimised, F(x) is the objective function and F is the set of solutions that satisfy a particular constraint.
In this paper, IoT service combination problem is summarized as a multi-objective optimization problem, where the sub-objectives to be optimized are energy consumption and service quality respectively. Energy consumption is the minimization objective, and its calculation formula is shown in (18); QoS is the maximization objective, and its calculation formula is shown in (23). This leads to calculation of fitness function as shown in Equation (21).
Where w e and w q are weighting factors, both positive numbers greater than 0 and less than 1, indicating the percentage importance of energy consumption and service quality respectively, and w e + w q = 1. In this paper, fitness function is used as the objective function, and the larger objective function, the more optimal service composition.
IoT services are provided by energy-limited smart devices, and if selected smart devices are not energetic enough when performing service composition will lead to combination failure, so constraints of IoT service composition are shown in Equation (22).
The process of solving the IoT service composition optimization model
The process of solving IoT service composition optimization model is shown in Fig. 3.
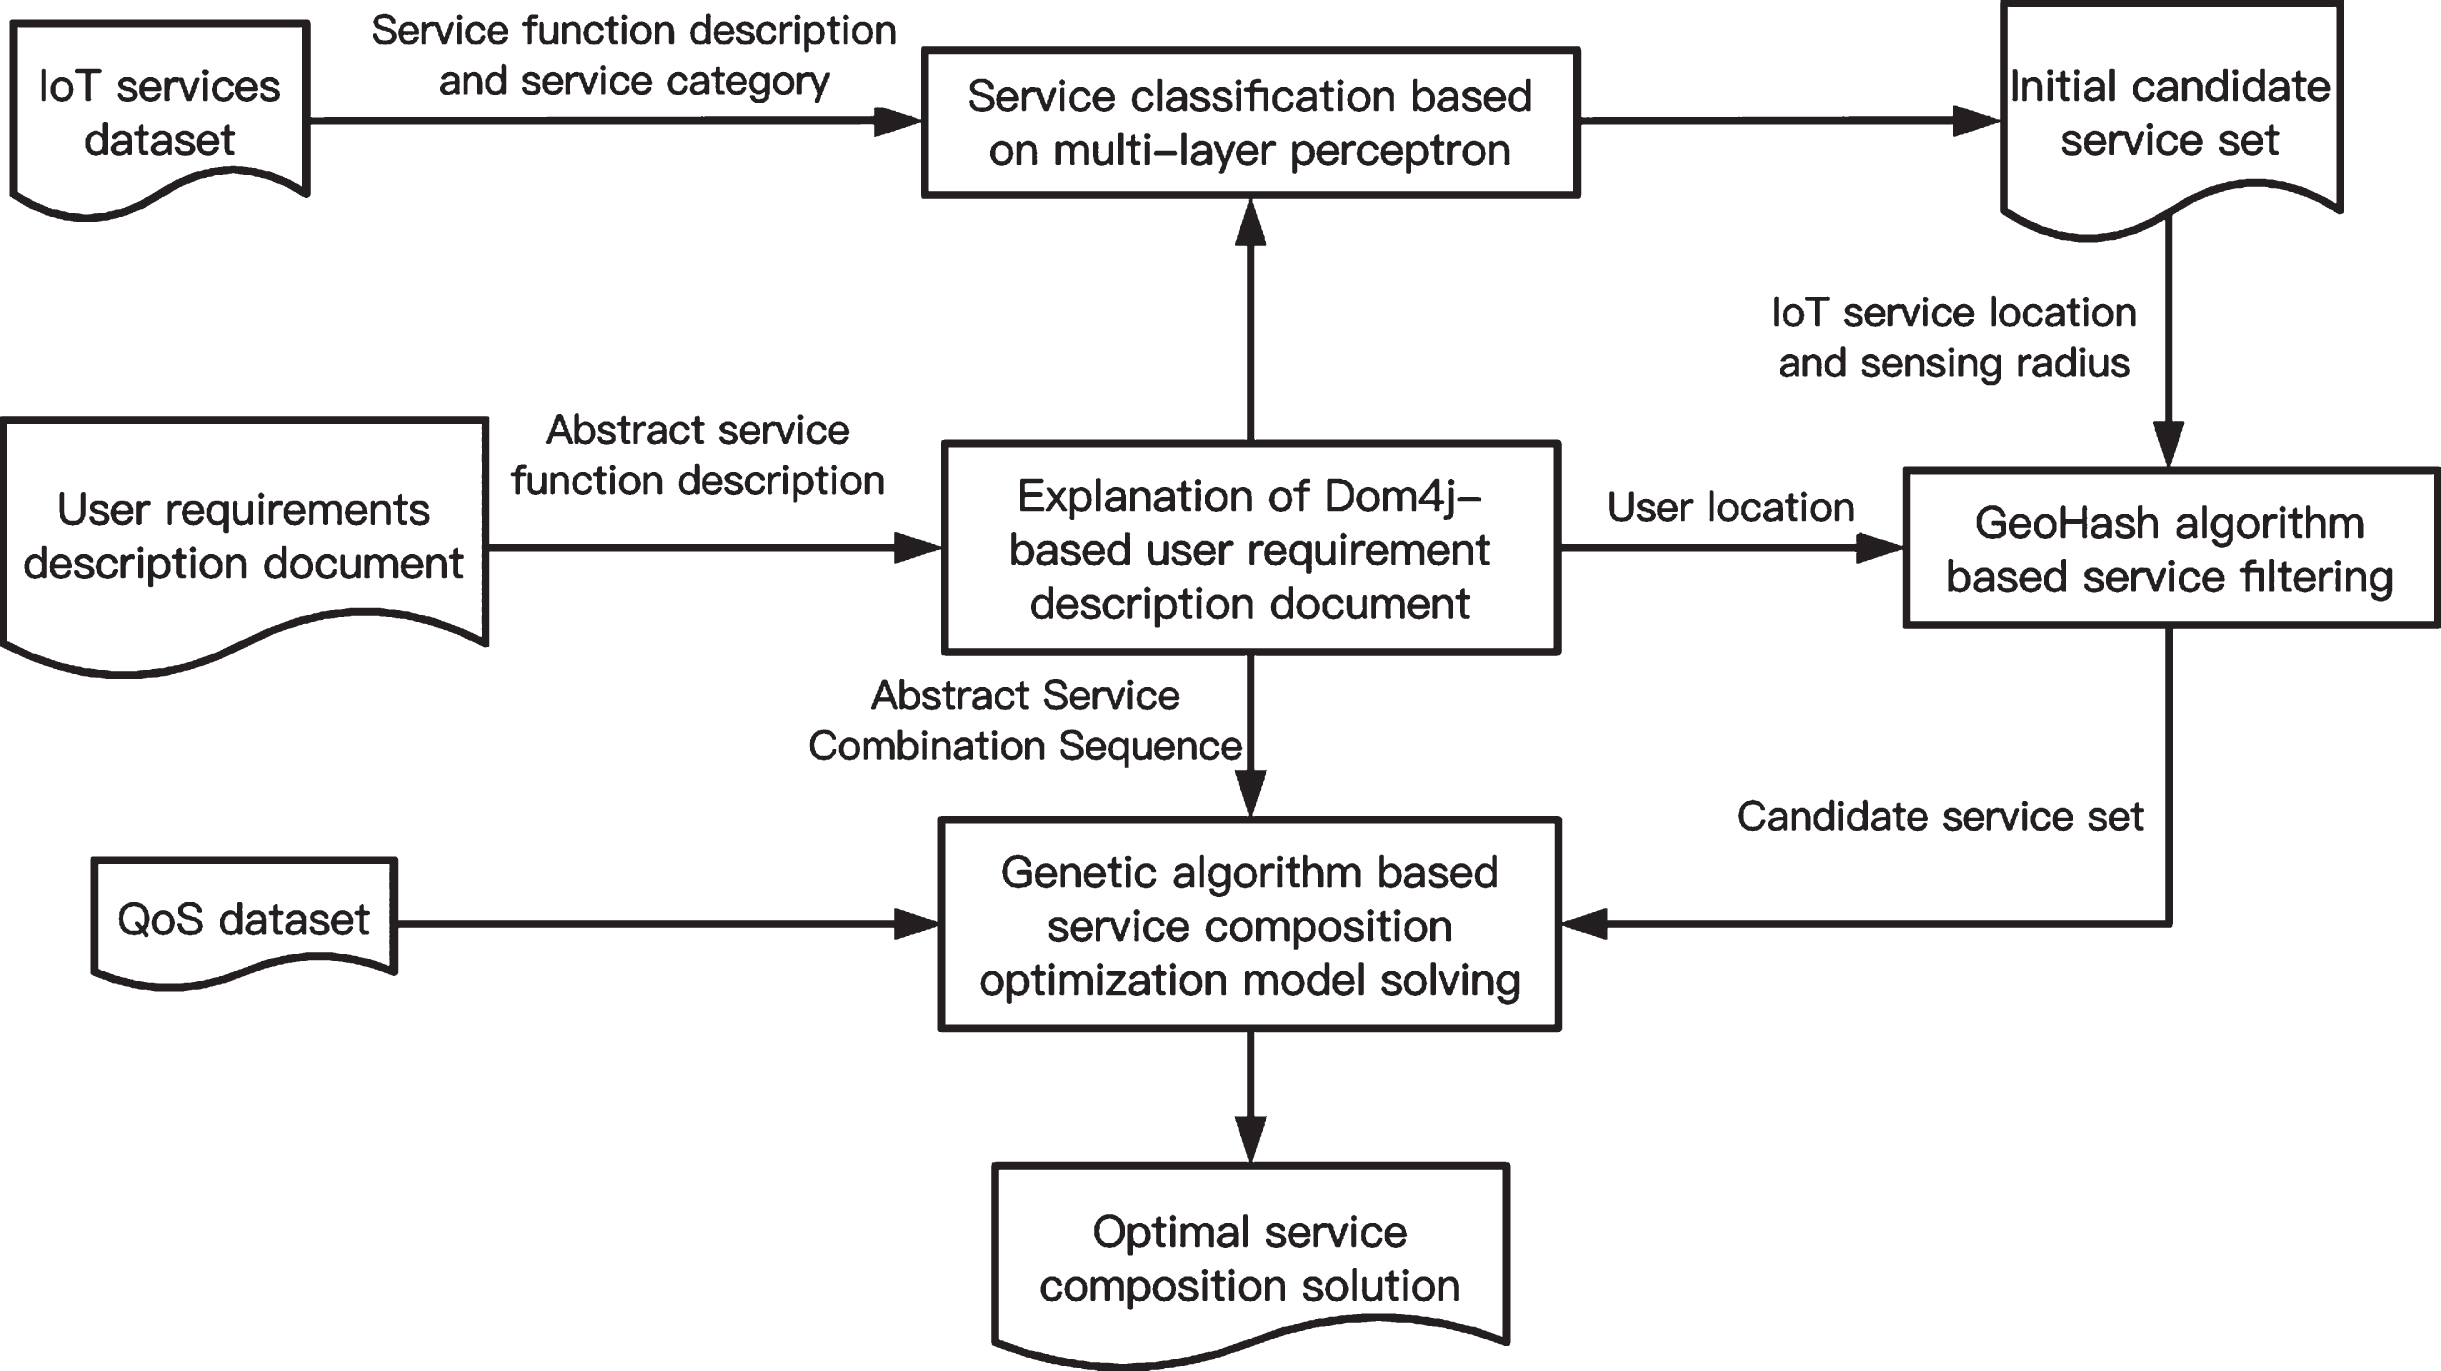
The process of solving the IoT service composition optimization model.
The solution process mainly includes Dom4J-based user requirement description document parsing, multi-layer perceptron-based service classification, GeoHash algorithm-based service filtering and genetic algorithm-based service combination optimization model solving. Among them, Dom4J-based user requirement description documents parsing parses XML formats user requirement description document; Service classification based on multi-layer perceptron puts service function description and service category information in IoT service dataset into multi-layer perceptron for training to obtain service classification model. Then, service function description parsed from user requirements description document is put into service classification model to get service category. According to service category, the initial candidate service set is determined; Service selection based on GeoHash algorithm is to select candidate services according to geographical location. The algorithm encodes geographic location of users and geographic location of smart devices providing IoT services. The algorithm will automatically partition the coding region, and delete services that don’t meet the spatial constraints. Finally, IoT services that can provide accurate service data for users are selected; Genetic algorithm-based service composition optimization model solving step uses GA and solves the IoT service composition optimization model based on abstract service combination sequence, candidate service set and QoS attributes.
An abstract service combination sequence T consists of several logically related abstract services AS i , a workflow consisting of multiple sub-tasks obtained by parsing user requirement description document. Resulting sequence of abstract service composition allows for the selection of candidate services. In this paper, user requirement description document is represented as an XML document describing requirements and the structure of composition.
XML document tags are shown in Table 3. In this paper, Dom4 j is used to parse XML document to obtain the functional description of services required by user and the abstract service combination sequence.
Requirements description document labels
Requirements description document labels
The specific implementation process of generating abstract service combination sequence is: first read user requirement description document, find the start node and read it, read next node of start node, determine whether node is final node according to the next attribute, if it is not final node set the node as the current node, and save the node to the abstract service combination sequence, then according to the current node’s chain then according to the current node’s chain property and next property to find the remaining nodes in turn, until the final node that the node’s next property is empty, so that the user can get an abstract service combination sequence of demand, the implementation process is shown in Fig. 4.
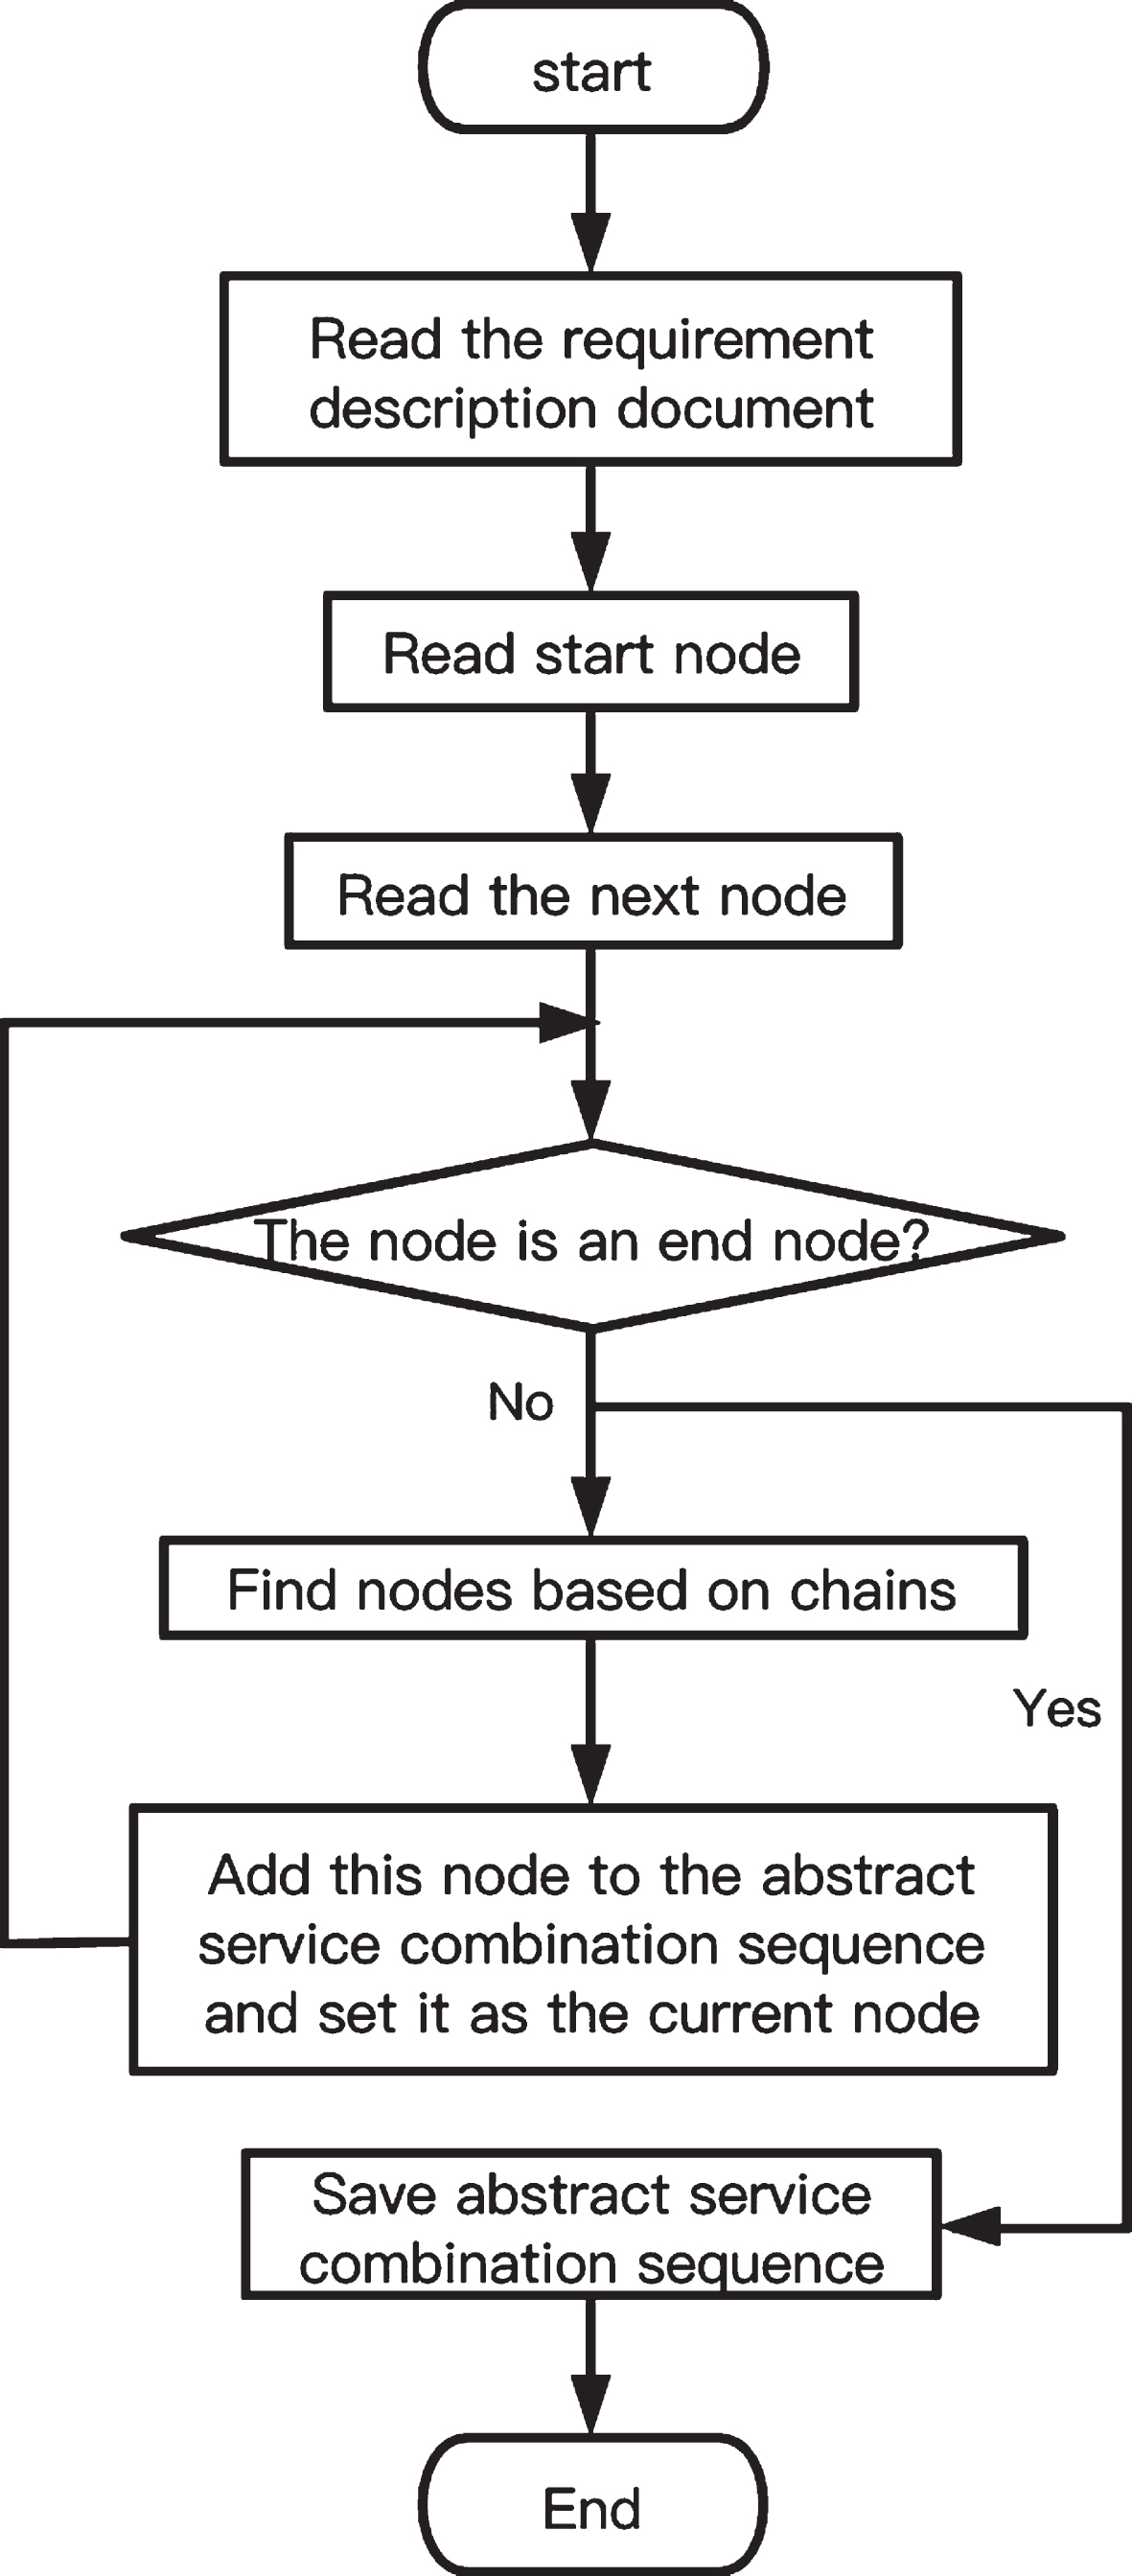
Abstract service combination sequence generation process.
Taking smart agriculture as an example, the user requirements description document contains the following functions: test food freshness S1, start harvesting mode S2, test soil moisture and temperature S3, start watering truck S4, start constant temperature mode S5, test soil pest mode S6, start insecticide lamp S7. The specific steps are: first test the freshness of the food in the soil, depending on its maturity choose to start the harvesting mode or test the soil temperature and humidity. After testing the soil temperature and humidity you can start the watering and soil thermostat mode, finally turn on the test soil pest mode and according to the information obtained about pests start the insecticide lamp to repel pests. A user requirements description document in XML format is shown in Fig. 5.
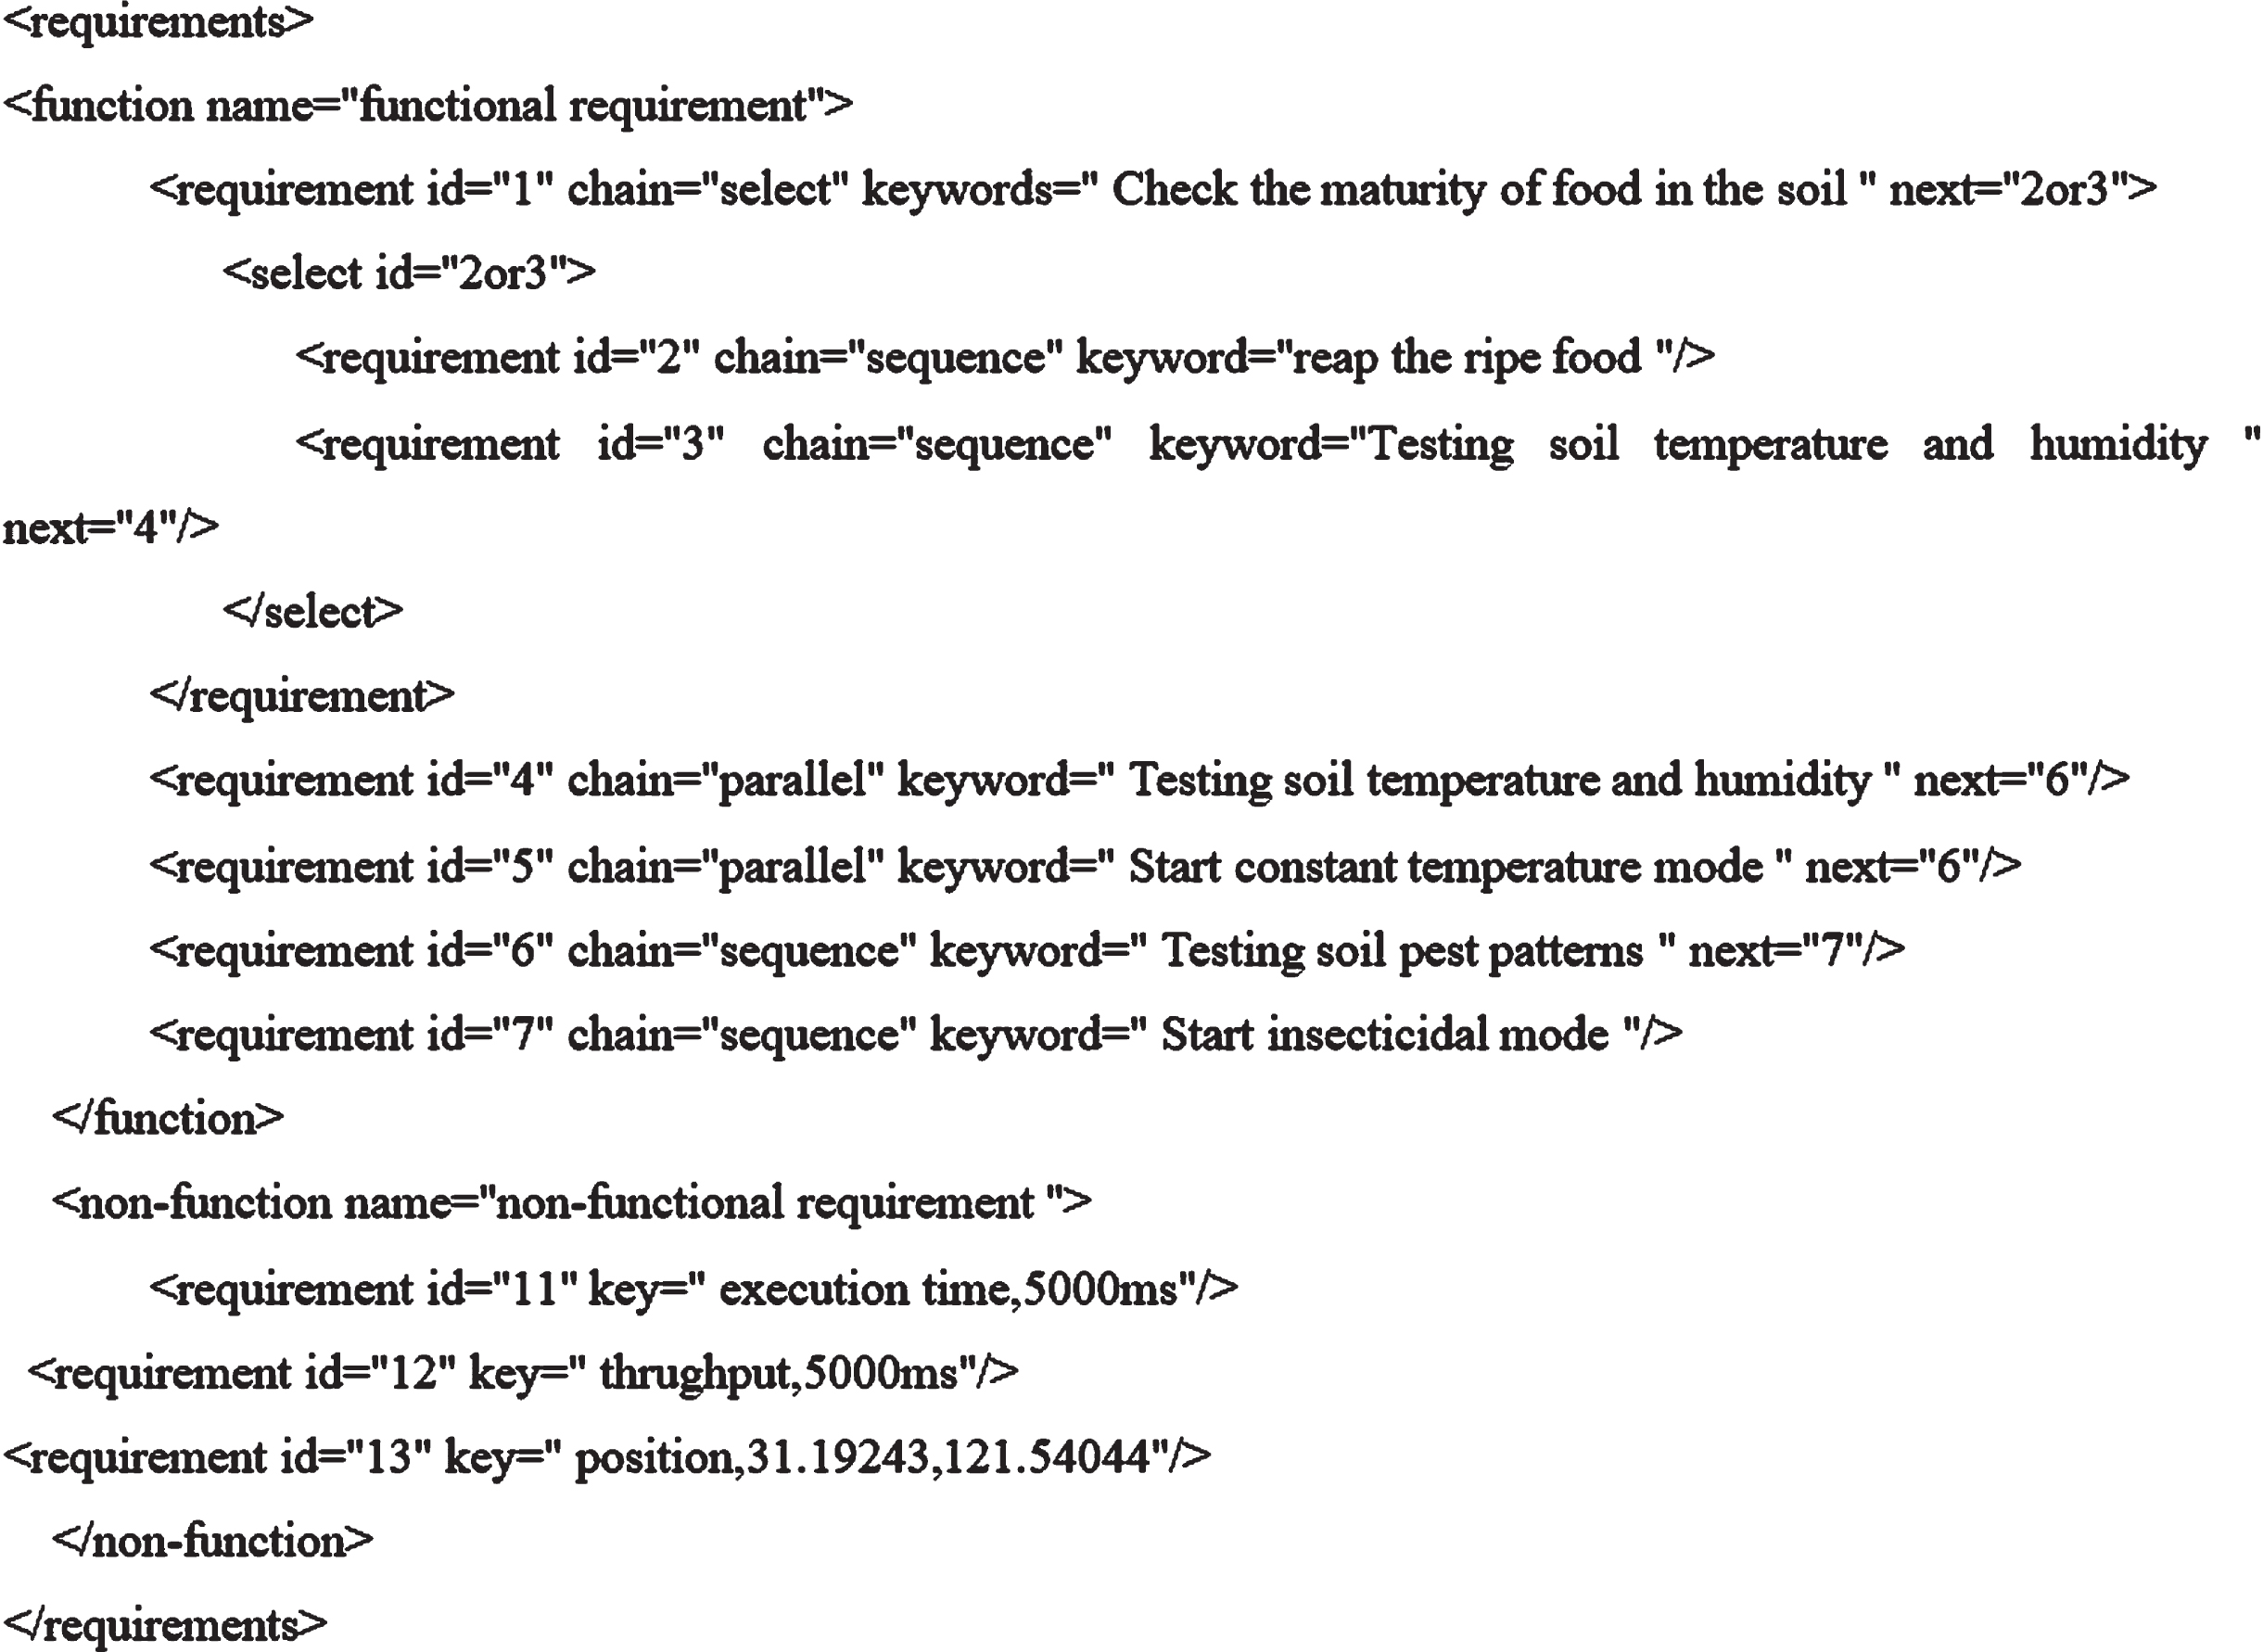
Example of user requirements description document.
An abstract service combination sequence obtained after requirements description document has been parsed based on Dom4 j is shown in Fig. 6.

Abstract service combination sequence.
In order to narrow down the search scope of candidate services to improve the efficiency of service composition solving, after obtaining the abstract service combination sequence T, a service selection is performed on the set of services to remove candidate services that cannot provide these functions based on the function descriptions of the multiple abstract services obtained, which is the keyword attribute in the <requirement>tag mentioned in 4.2.
In this paper, functional description of service in the service set is defined as X ={ x1, …, x
i
, …, x
l
}, l is the length of functional description text, and the word vector is modelled using the skip-gram model of the word2vec algorithm for functional description of service in the service set to obtain the word vector e
i
, which is calculated as Equation (23) is shown.
Where w e is the randomly initialised embedding matrix.
The obtained word vector E ={ e1, …, e i , …, e l } is fed into a multi-layer perceptron for training to obtain a service classification model. The layers of a multilayer perceptron are fully connected to each other. A multilayer perceptron can consist of many hidden layers in between, in addition to the input and output layers, and the simplest MLP contains only one hidden layer, which is a three-layer structure as shown in Fig. 7.

Three-layer structure of a multi-layer perceptron.
By passing the word vector E into the input layer, the hidden layer is shown in Equation (24).
Where w
m
is the weight, b
m
is the bias and f is the activation function. In this paper, we use the sigmoid function as the activation function, as shown in Equation (25).
The hidden layer to the output layer can be seen as a multi-category logistic regression, or softmax regression, so the output of the output layer is shown in Equation (26).
Where y is the output of the hidden layer f (w m E + b m ).
Trained service classification model can thus be obtained. After obtaining the model, functional description of each abstract service in an abstract service combination sequence is input into model separately to obtain the service classification of these abstract services, and the candidate services in this service classification are used as the initial set of candidate services for abstract services.
The accuracy of data provided by IoT is closely related to its geographical location. If smart devices providing services are too far away from users, the data accuracy will be poor. Therefore, before IoT service composition, IoT services that cannot provide accurate data should be deleted according to geographical location.
Geohash algorithm is a longitude latitude geocoding method proposed by Gustavo Niemeyer. It divides the earth’s surface alternately along the direction of longitude and dimension, encodes the two-dimensional longitude and latitude into one-dimensional string, and partition the geographical location. With (N39° 55′41′′,E116° 23′22′′) as an example. The process of geohash coding is as follows: longitude and latitude are processed by dichotomy, with the middle as the boundary, if the middle is greater than or equal to 1, otherwise 0. The whole process of recursive evaluation, finally longitude and latitude each get a string of binary code. The binary code for longitude is 1101001011. And the binary code for dimension is 1011100011. The binary codes for latitude and longitude can be interleaved to obtain 11100 11101 00100 01111, as shown in Fig. 8.
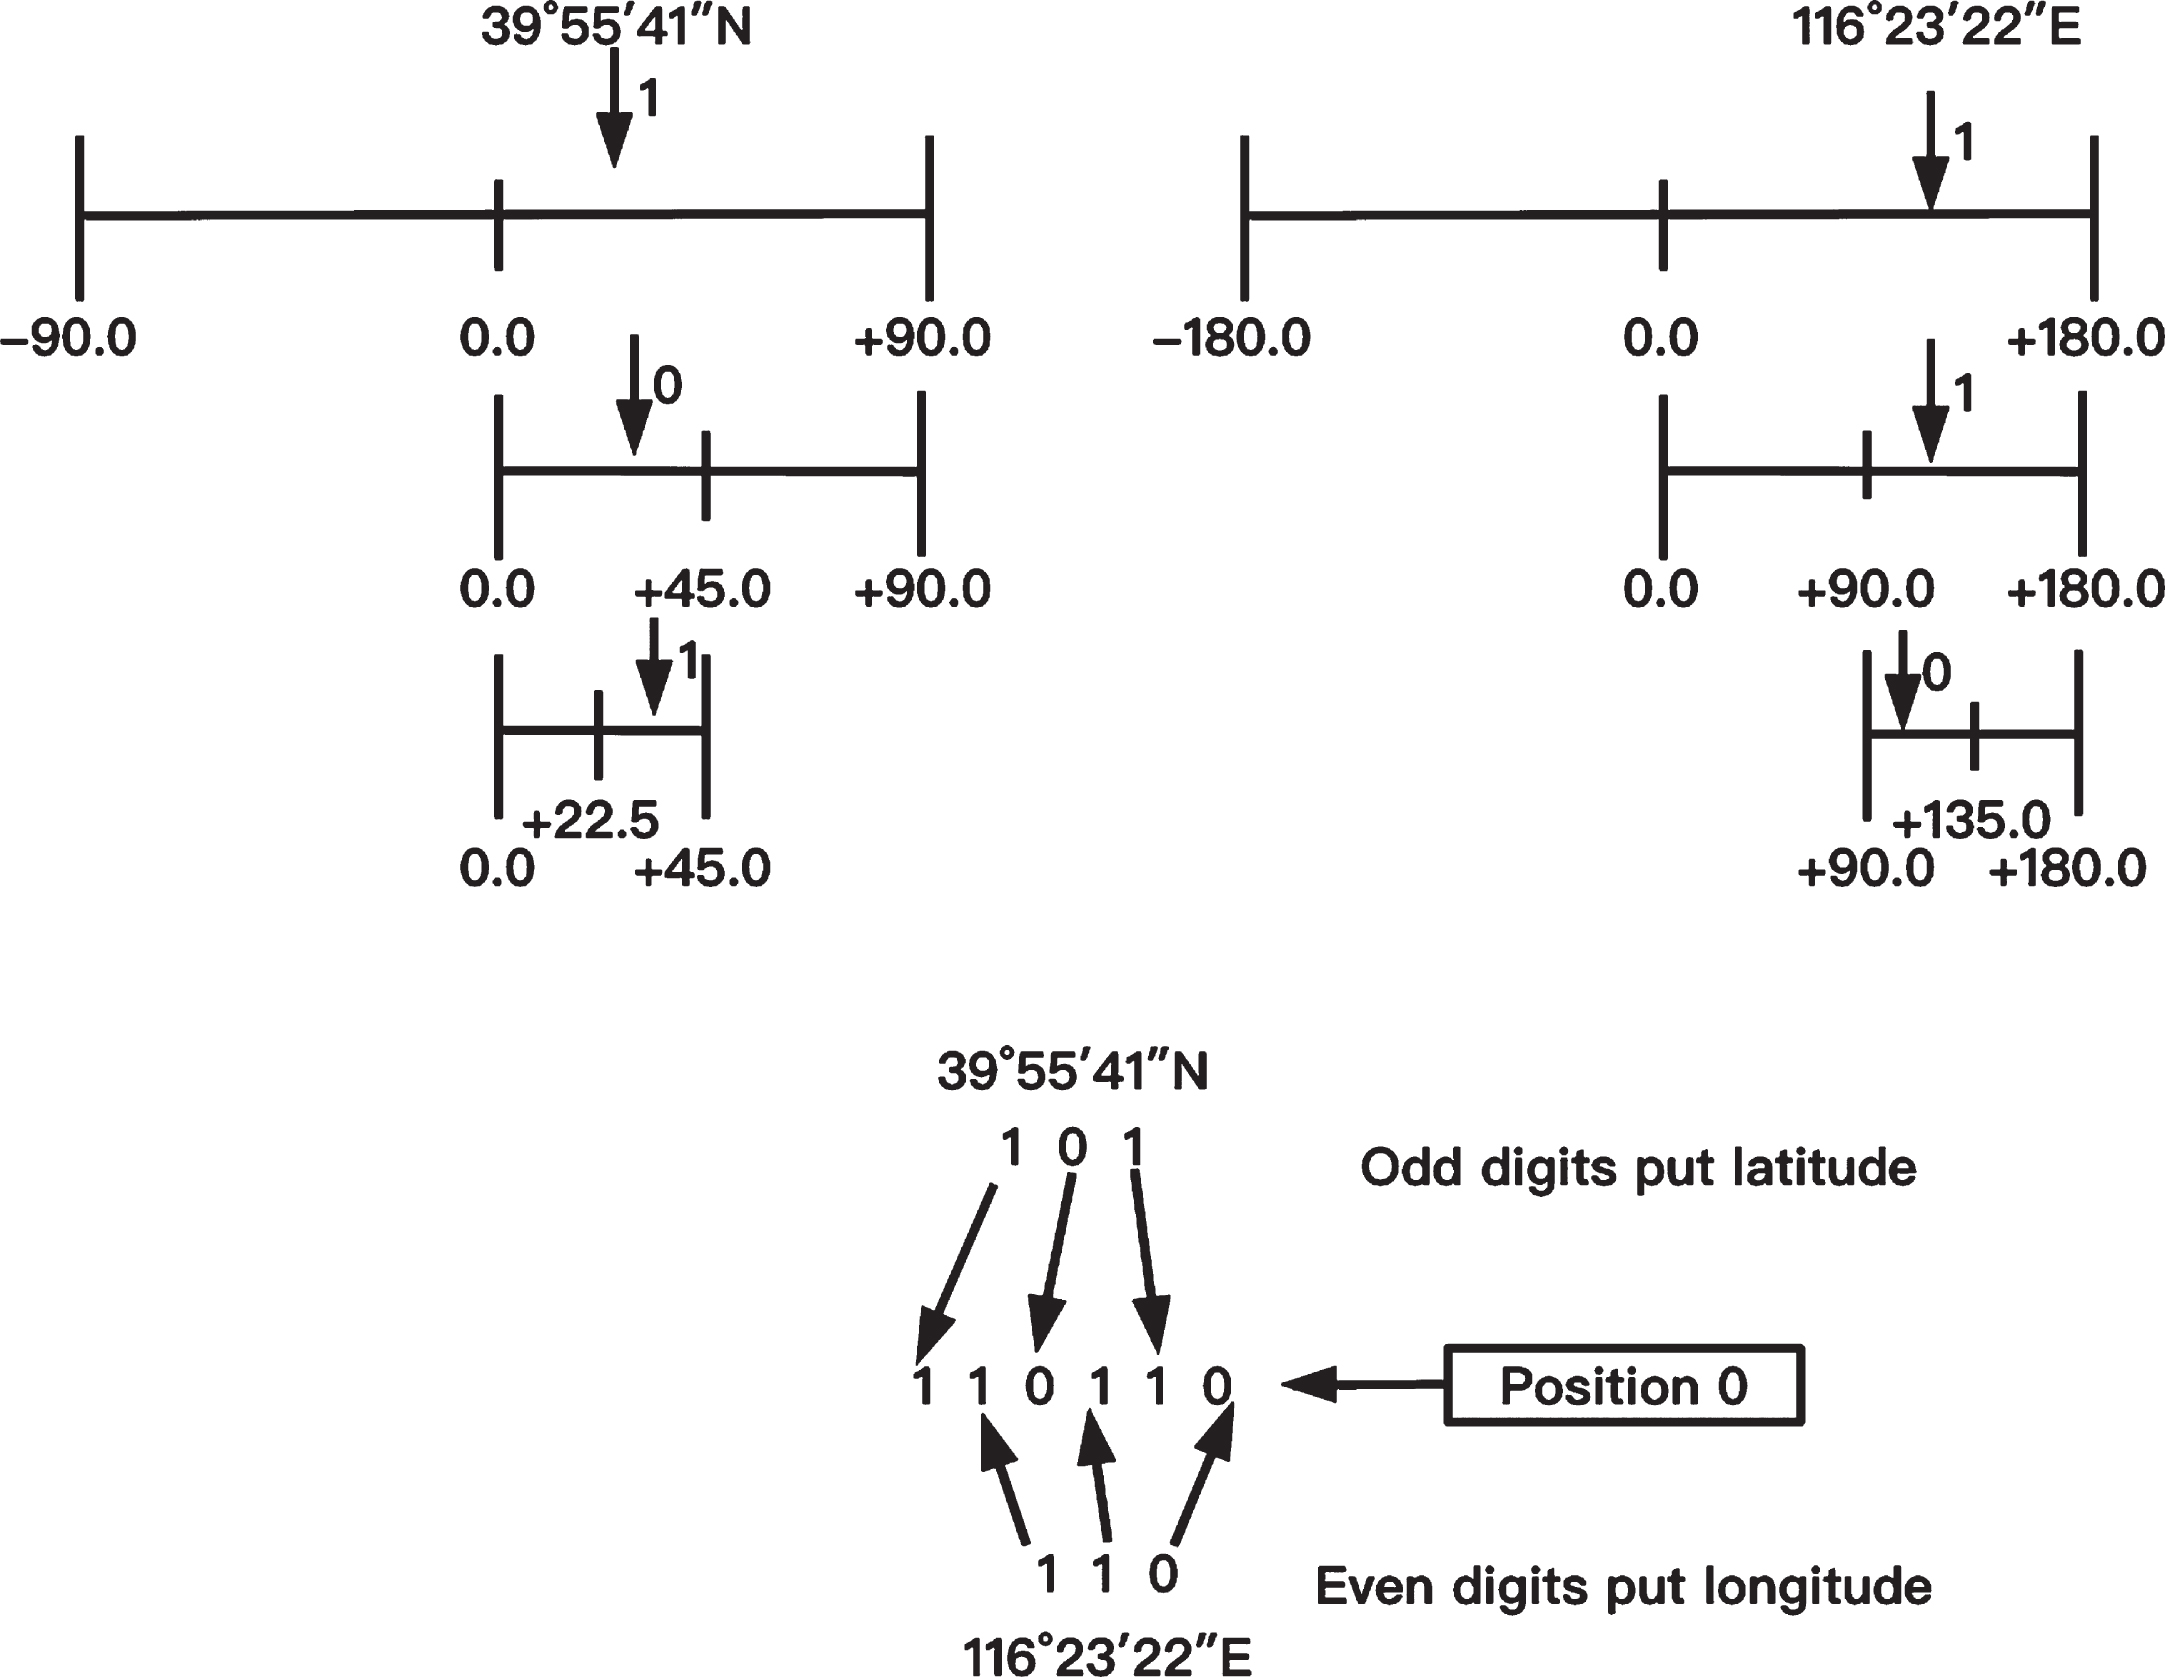
GeoHash encoding method.
In order to store concisely, the 32 letters 0–9, b-z (remove a,i,l,o) are used for Base32 encoding, the length of the string corresponds to the location accuracy, the closer the strings indicate the closer the distance, the encoding length is controlled on demand, base32 coding/decoding table is shown in Table 4. Base32 encoding is carried out in groups of 5 bits, and GeoHash value that can be obtained from the above binary encoding is wx4 g.
Base32 codec/decoder table
In this paper, GeoHash algorithm is used to encode geographical location of each specific service into a one-dimensional string, which is stored in the dataset as the location information of specific service, and then IoT services that do not meet the location criteria in the initial candidate service set are removed according to GeoHash value of user, to further reduce the number of concrete services.
GA obtains optimal solution by simulating the process of biological evolution in nature. In this paper, service is encoded by real numbers and relative optimal solution is obtained according to obtained abstract service combination sequence. The algorithm mainly includes four steps: encoding, selection, crossover and mutation. The pseudocodes solved by service composition optimization model for IoT based on GA are shown in Algorithm 1.
After generating the initial population, fitness function values for all chromosomes and retaining the chromosomes with the largest fitness function values to the next generation (row 2); using roulette selection to obtain the remaining chromosomes (row 4) and all new chromosomes into the next generation; using single point crossover and variation (row 7) to evolve the chromosomes in the population; repeating the above process until the end of the iteration to finally select the fitness function The chromosome with the largest fitness function was selected as the optimal service composition.
Simulation experiments
The experimental parameters for IoT service energy consumption in this paper are set as shown in Table 5, and the data simulation process is referenced in the literature [6, 25]. Service function descriptions, service classes, service location information and service QoS attribute values used in the experiments were obtained from the programmableWeb dataset and the WS-Dream dataset. In this paper, more than 20,000 services were randomly deployed on 4,000 smart devices. Assuming that each smart device can encapsulate 1 to 10 services, the initial energy of each smart device was set to 0.5J in this experiment. The spatial constraint of the smart devices was determined by their geographical location and communication range, and the communication radius was set to 70 m in this experiment.
Experimental parameter settings
Experimental parameter settings
(1) GA algorithm parameter selection
In this paper, the impact of the parameters of GA algorithm on the optimization process is analyzed, and the influence of population size, crossover operator and mutation operator on the optimization process is analyzed. Figure 9 shows the impact of population size on the performance of GA. In the process of solving the composition optimization model, this paper solved the model for populations of 10, 20, 30, 40, 50 and 60 respectively, and determined the optimal population size through the curve of the optimization process. Figure 10 shows the influence of crossover operator on the performance of GA. In this paper, crossover operators are 0.4, 0.5, 0.6, 0.7, 0.8 and 0.9 for comparison. Figure 11 shows the influence of crossover operator on the performance of GA. In this paper, crossover operators are 0.02, 0.04, 0.60, 0.08 and 0.1 for comparison.
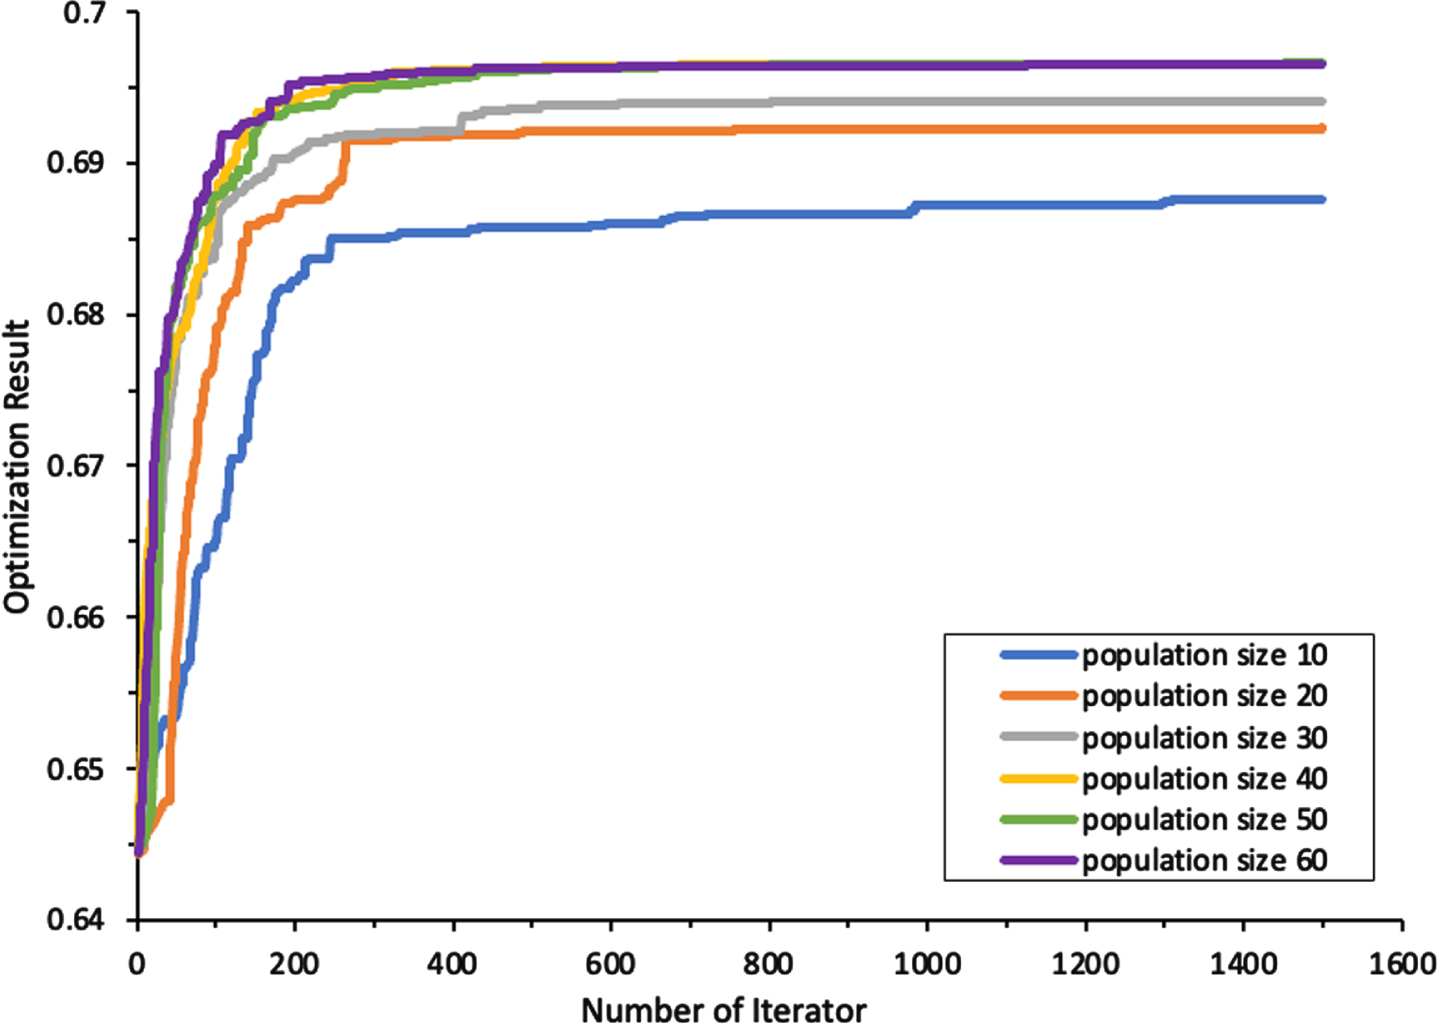
Effects of different population sizes on optimization results.

Influence of different crossover operators on optimization results.
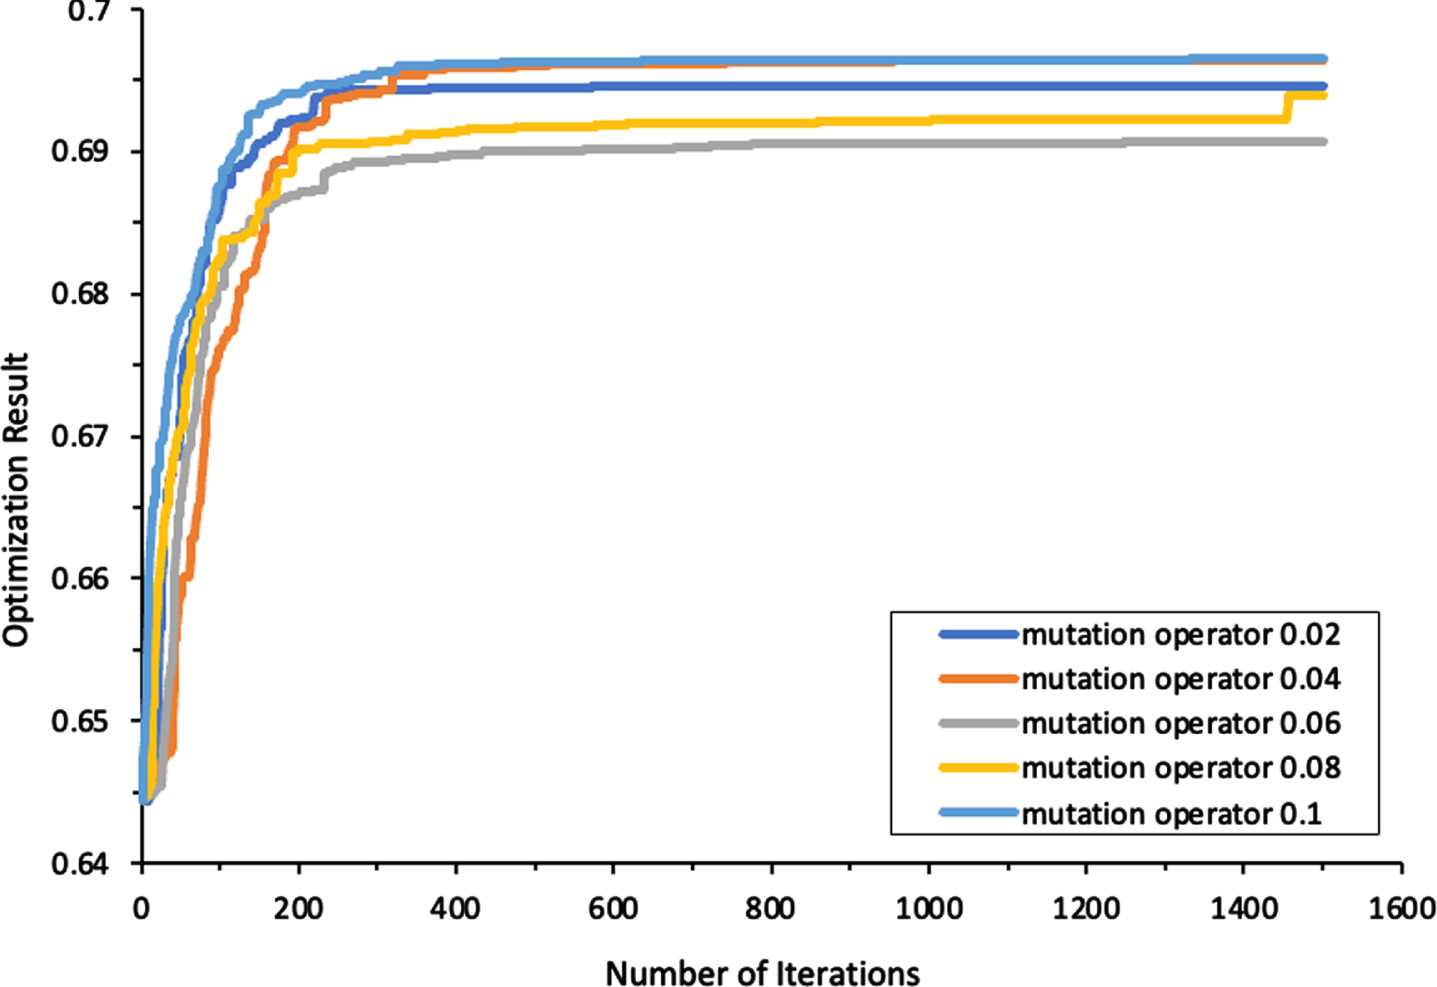
Influence of different mutation operators on optimization results.
As shown in Fig. 9, when the population size is between 10 and 40, the optimization result is better with the increase of population size. When the population size reaches 40, the optimization result does not increase with the population size. In GA, the population size increases, but computation amount also increases significantly although the diversity of the population is improved. The optimization results of different population sizes were compared. Finally, the population size of 40 is selected in this paper experiment.
As shown in Fig. 10, with the increase of crossover operator, the optimization result gradually becomes better. In GA, the larger crossover operator is, the faster new structure is introduced into population, and the loss rate of acquired good gene structure is correspondingly higher. By comparing optimization process of different crossover operators, it can be concluded that when crossover operator is 0.8, optimal solution of model can be searched. Therefore, crossover operator 0.8 is selected in this experiment.
As shown in Fig. 11, when mutation operator is 0.04 and 0.1, the optimization result is relatively good. In general, the value of mutation probability is small, so as to prevent the offspring of an individual from being too different from its father after mutation. Therefore, mutation operator 0.04 is selected in this paper.
(2) Algorithm performance comparison
In this paper, performance of ant colony algorithm (ACO), particle swarm optimization algorithm (PSO) and proposed method is compared through the change of objective function value and execute time. Figure 12(a). shows execute time of different algorithms under different number of candidate services, including service composition of 5 service classes. The number of candidate services of each service class ranges from 100 to 500 respectively. Each group of experiments is run for 100 times, and the average value is taken as experimental result. Figure 12(b) shows execute time of different algorithms under different number of tasks, in which the number of tasks ranges from 5 to 25 respectively. Each task corresponds to an abstract service, and the number of candidate services for each abstract service is 100. Each group of experiments is run for 100 times, and average value is taken as experimental result.
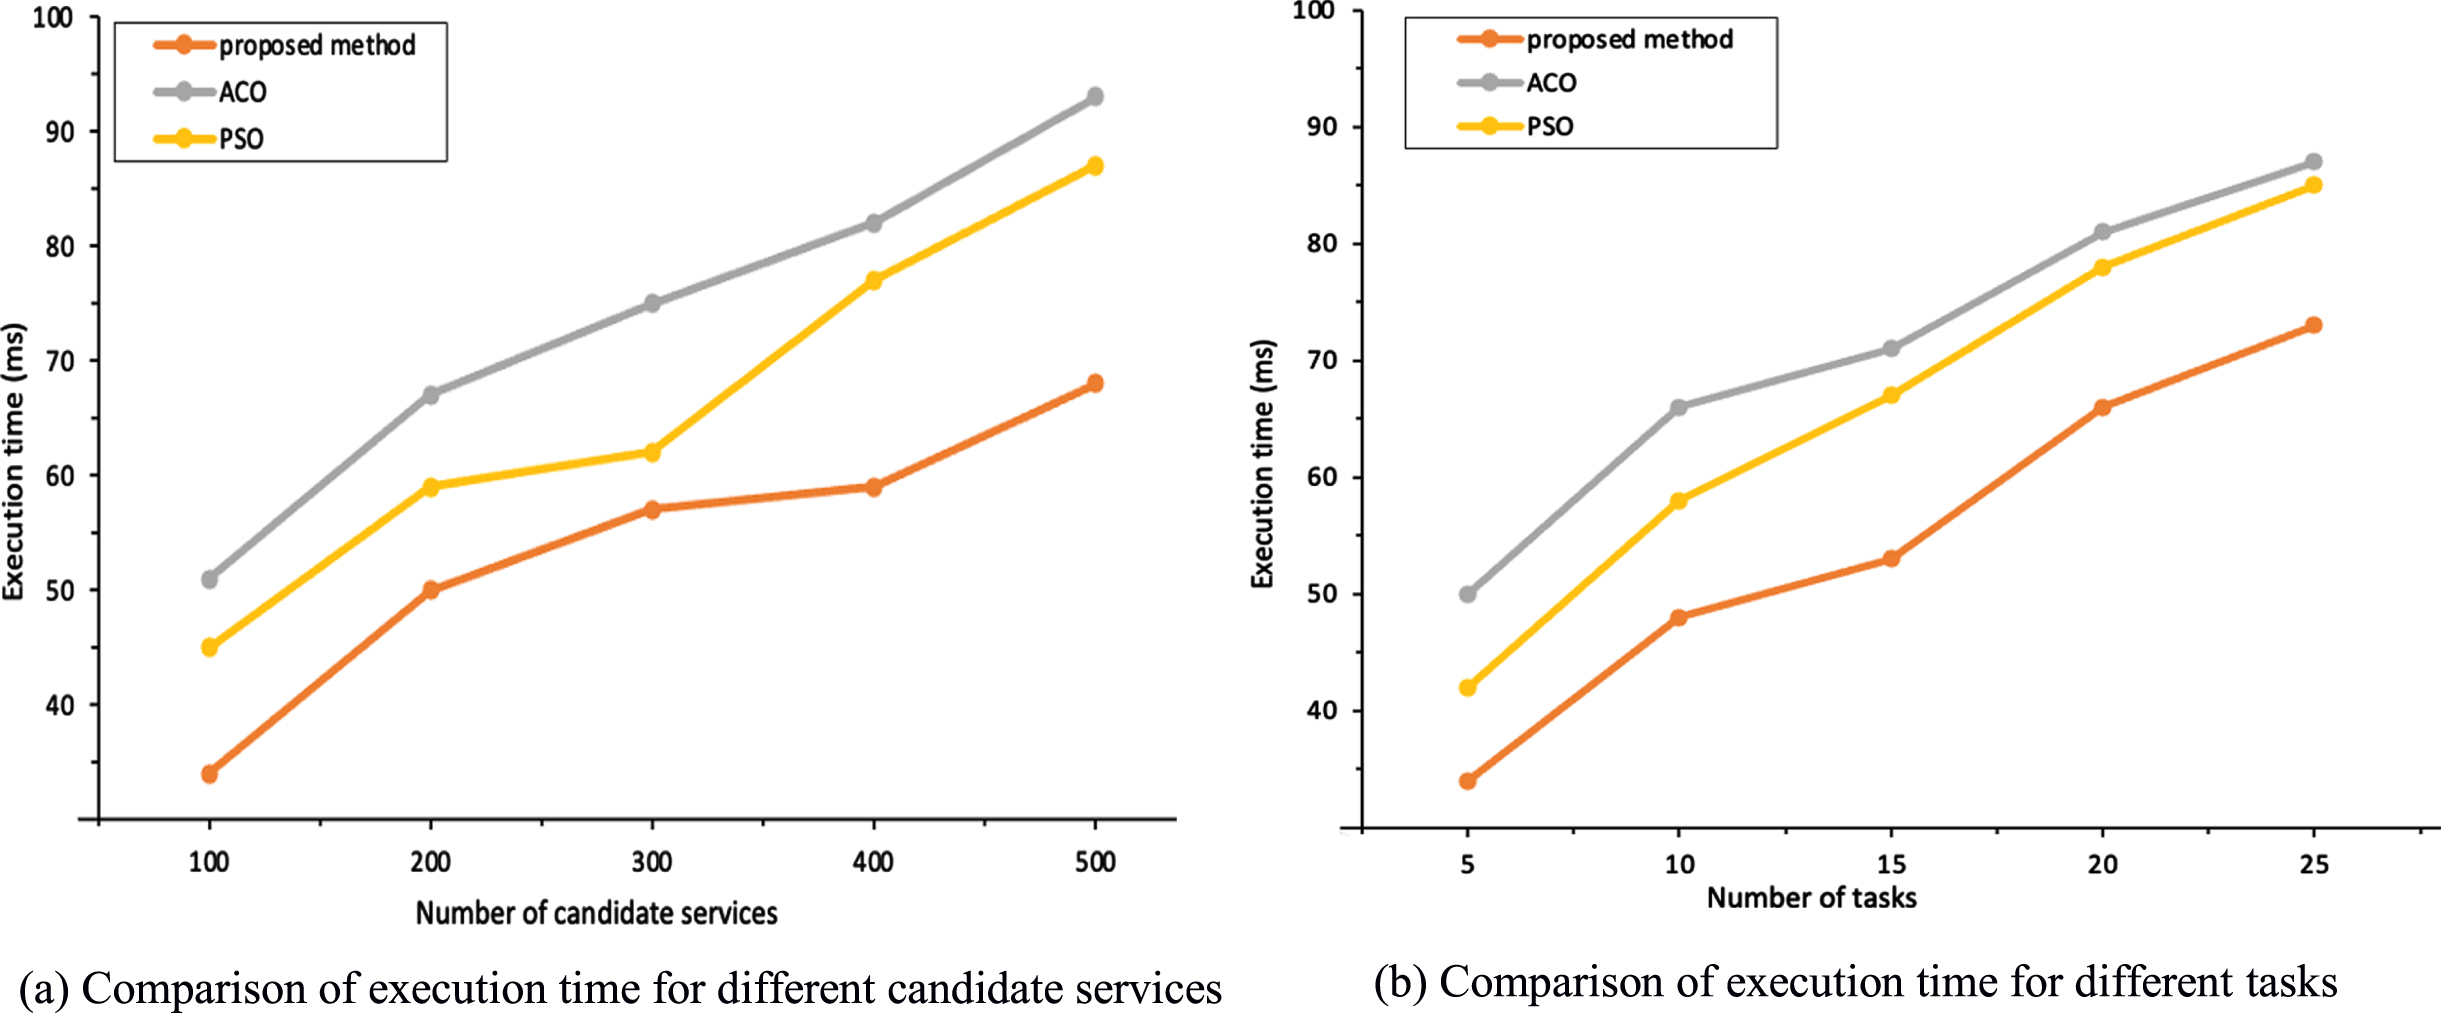
Execution time comparison.
As shown in Fig. 12(a), execution time of PSO algorithm and ACO algorithm is relatively long, and execution time of PSO algorithm is smaller than ACO algorithm. When the number of candidate services is less than 400, time of the method in this paper increases slowly; when the number of candidate services is greater than 400, execution time of the method in this paper increases significantly. As shown in Fig. 12(b), as the number of tasks increases, the execution time of each service composition method increases to varying degrees. ACO algorithm and PSO algorithm have relatively long execution time, and execution time of this method is obviously lower than other methods.
Table 6 shows the changes of objective function values of different algorithms under different number of tasks, in which the number of tasks ranges from 5 to 25 respectively. Each task corresponds to an abstract service, and the number of candidate services for each abstract service is 100. Each group of experiments is run for 100 times, and the average value is taken as the experimental result. As shown in Table 6, the objective function value of this method is relatively higher, among which ACO algorithm has the lowest objective function value.
Objective function comparison under different number of tasks
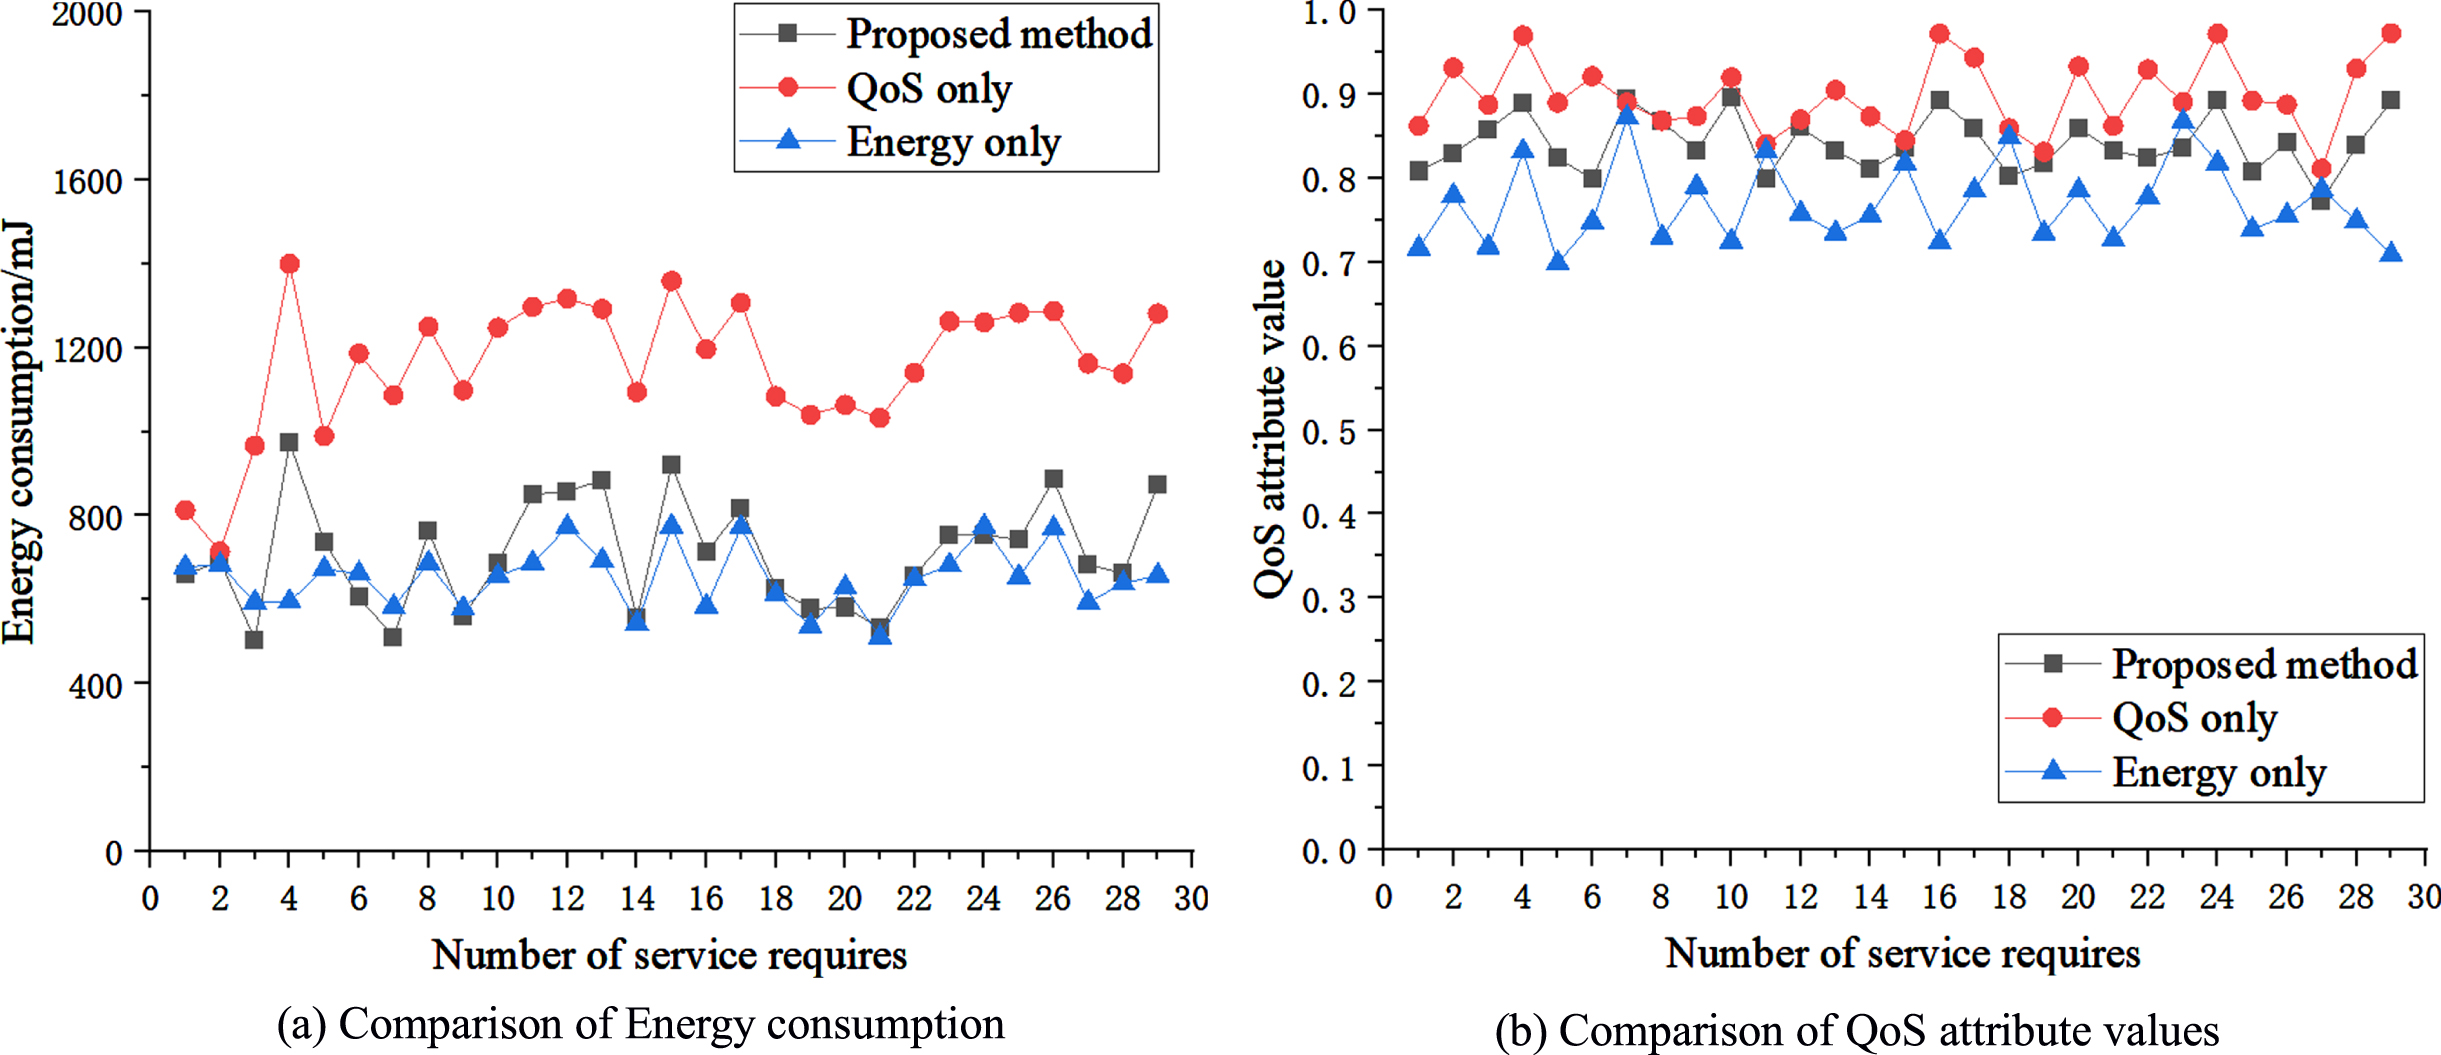
(3) Comparison of service composition energy consumption and QoS attribute values
In this paper, the experiments are based on abstract service combination sequence described in 4.2 using genetic algorithm to solve IoT service composition model, and algorithm is run for 100 times with 500 iterations respectively to obtain the results. From Fig. 13(a), it can be seen that the highest energy consumption of service composition is selected by the composition model considering only values of QoS attributes, and energy consumption of service composition selected by method of this paper is slightly higher than that of service composition selected by composition model considering only energy consumption; As shown in Fig. 13(b), service quality of service composition selected by the composition model considering only energy consumption is the lowest, and service quality of service composition selected through this paper is slightly lower than that of service composition selected by composition model considering only the values of QoS attributes. From Fig. 13, service composition selected by the method in this paper can balance energy consumption and service quality, so that energy consumption and service quality of selected IoT services can be maintained relatively well.
Comparison of the method in this paper with energy consumption only and QoS value only.
The composition optimization model of this paper was compared with composition optimization model proposed by references [15, 28] et al. under different number of tasks, and the number of tasks was set to 5, 10, 15, 20, and 25, and each group of experiments was executed 50 times on GA with 100 iterations, respectively, and the average fitness function values obtained are shown in Table 7. As can be seen from Table 6, fitness function values of the method in this paper are higher than those of references [15, 28], i.e., IoT service composition sequences selected according to the method in this paper have better performance.
Comparison of the fitness function with different number of tasks
The composition optimization model in this paper was compared with composition optimization model proposed by references [15, 28] et al. under different number of tasks by setting the number of tasks to 5, 10, 15, 20, and 25, and each group of experiments was executed 50 times on GA with 100 iterations, respectively, and the average energy consumption and average QoS attribute values were taken for comparison, and the experimental results are shown in Fig. 14 shows.
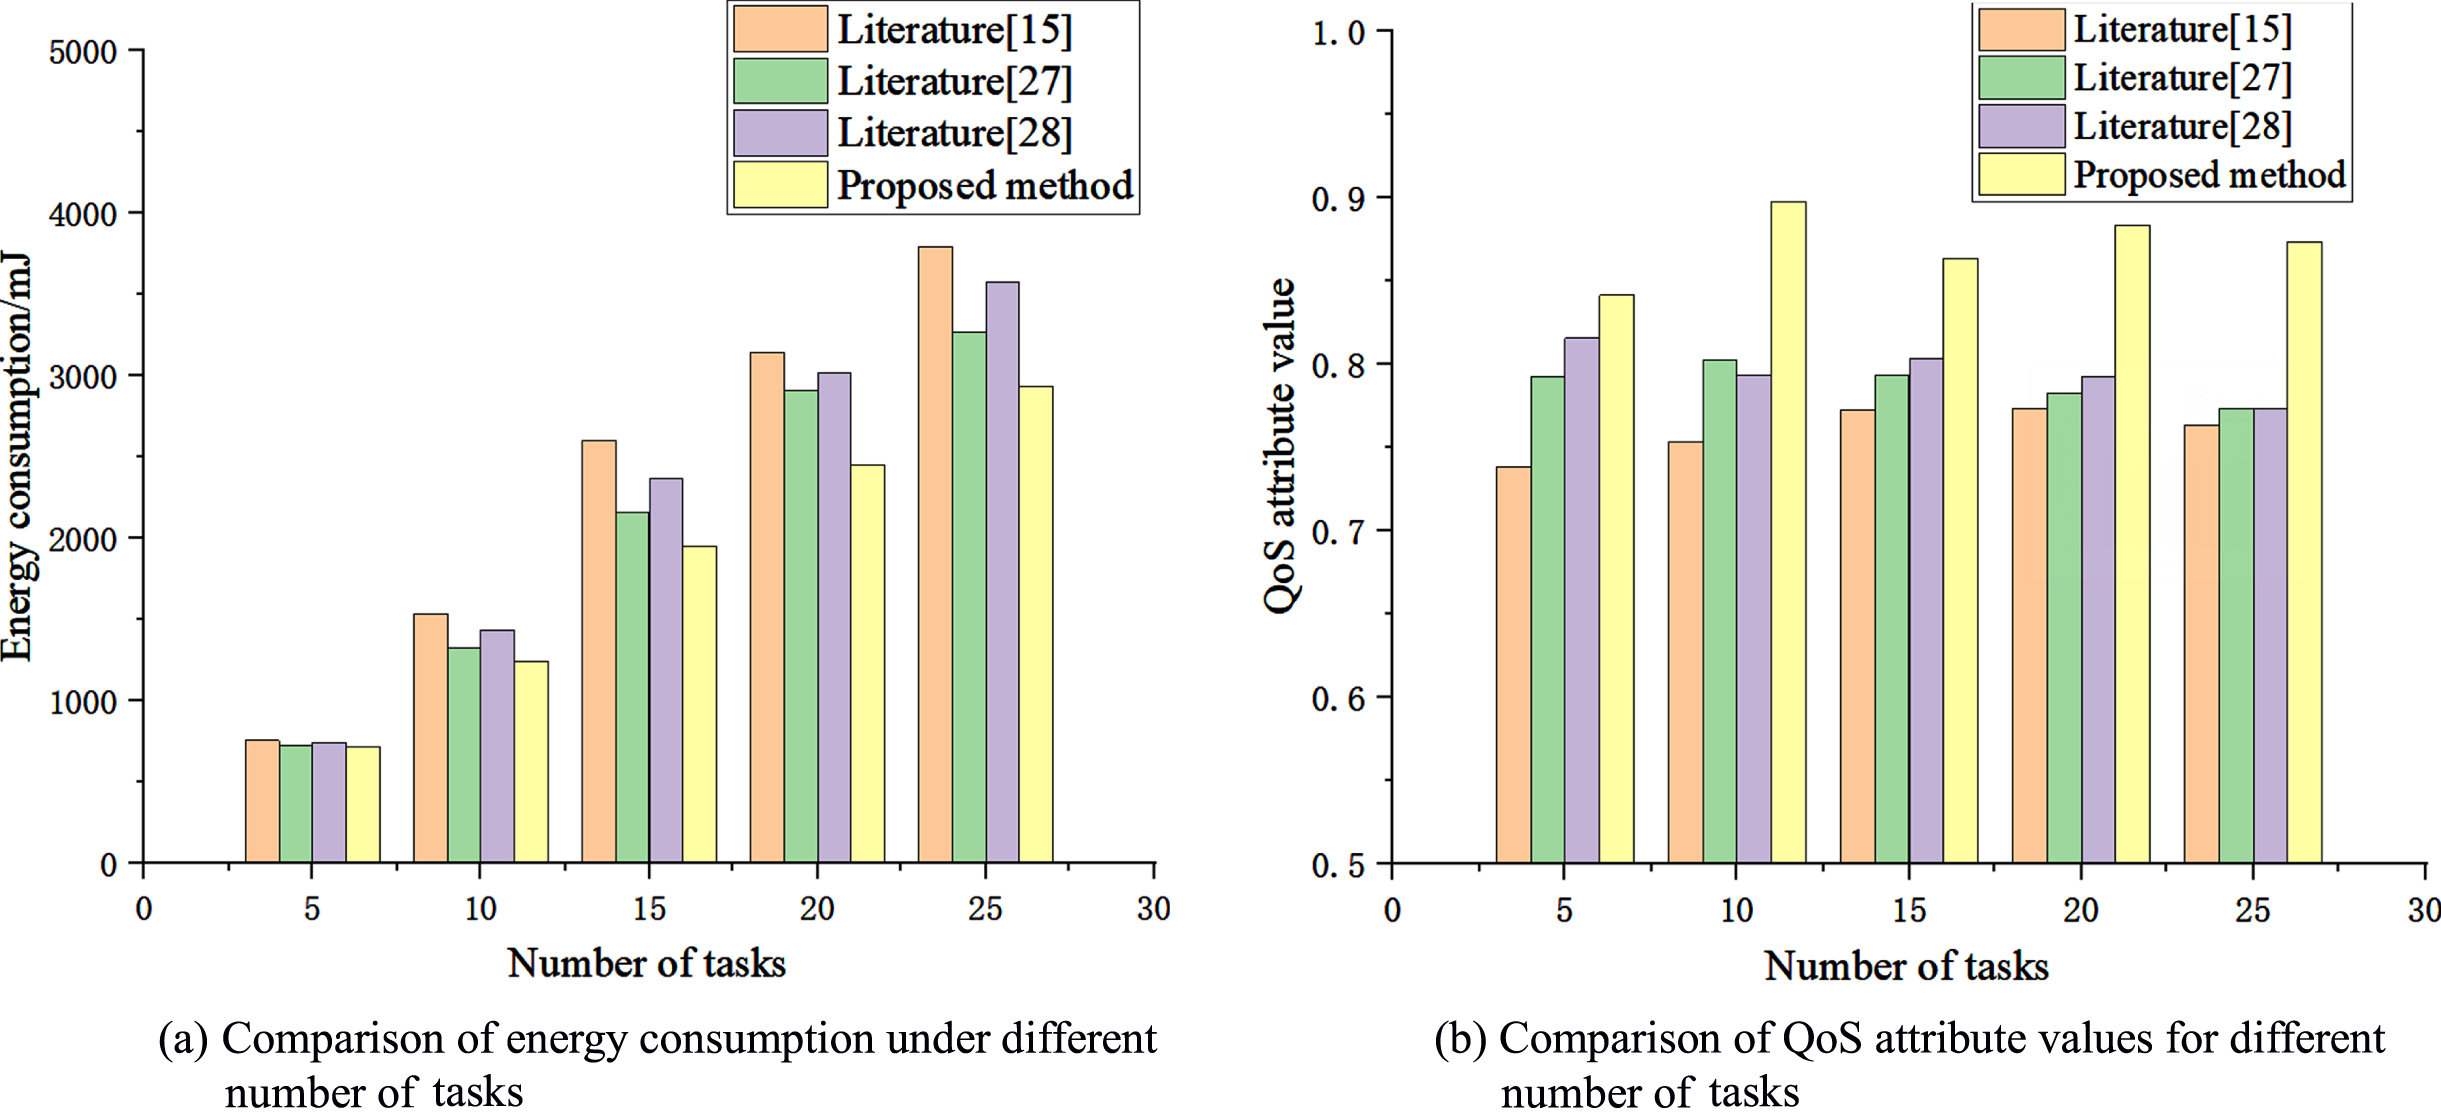
Comparison of energy consumption and QoS attribute values for different number of tasks.
As can be seen from Fig. 14(a), composition of IoT services selected according to the method of this paper is lower compared to other references, and this advantage becomes more evident as the number of tasks increases. It can be obtained that energy consumption of selected services is lower after considering execution energy consumption of devices. From Fig. 14(b), composition of IoT services selected according to the method of this paper has higher values of QoS attributes and better meets non-functional requirements of users.
From Table 7 and Fig. 14, the combination of IoT services selected by the method in this paper not only has the highest value of fitness function, but also can engage in lower and higher values of QoS attributes, thus selecting a combination with better performance.
IoT services are directly deployed on smart devices with characteristics such as space-time constraints and spatial constraints. A single IoT service cannot meet complex requirements of users. Therefore, multiple IoT services need to be combined to fulfill users’ complex requirements. With the development of IoT, there are more and more IoT services that can provide same or similar functions. It is very important to select IoT services with lower energy consumption and higher service quality for composition. In order to reduce energy consumption of IoT service composition and improve user satisfaction, this paper focuses on IoT service composition optimization model construction and solution of IoT service composition. Among them, IoT service composition optimization model considers both energy consumption and QoS values, firstly, energy consumption calculation of IoT service composition is carried out, in which execution energy consumption, transmission energy consumption and switching energy consumption are considered, then QoS calculation is carried out, and finally, composition optimization model is constructed. IoT service composition optimization model is solved by first parsing user requirement description document based on Dom4J, classifying services and finding candidate set of services using a multilayer perceptron. Then GeoHash algorithm is used to filter IoT services based on geographic location. Finally, service composition optimization model is solved using genetic algorithm. The experimental results show that IoT service composition selected using this paper have lower energy consumption and higher service quality. Service composition in IoT environment has a broad application prospect.
At present, IoT has been applied in numerous fields, such as intelligent transportation, intelligent medical care, intelligent agriculture and environmental monitoring. With the development of IoT, the number of smart devices connected to the network is increasing, and there are more and more IoT services that can provide same or similar functions. The composition optimization model proposed in this paper can select IoT services with less energy consumption and higher service quality among many IoT services with similar functions for service combination, which not only reduces energy consumption but also improves user satisfaction. The combination optimization model of IoT services proposed in this paper is of practical significance.
Footnotes
Acknowledgment
This work is supported by the National Key R&D Program of China (Grant No. 2018YFB1601502) and the LiaoNing Revitalization Talents Program (Grant No. XLYC1902071).