
Abstract
It is a common practice for organisation to carry out assessment exercises regarding performance of their organisational activities and processes. This paper assesses the market performance of five agro-processed crops at Sustainable Agriculture Tanzania (SAT) against some criteria. Experts at SAT supplied useful information by responding through a questionnaire. The fuzzy TOPSIS model was applied in the methodology to rank the processed products. For the sake of comparing results, the fuzzy analytical hierarchy process (AHP) model was also applied to rank the products. It was found that three products maintained their positions in the two models while the other two products (alternatives) exchanged their positions. It was further suggested that more efforts have to go for lower market performing products by looking upon means to improve on their corresponding low weight criteria/sub-criteria.
Keywords
Introduction
Decision making is the process of obtaining or identifying the best alternative from a set of feasible alternatives [1]. It is pointed out that decisions include judgements on the available information [2]. It involves scientific approaches [3]. Identifying the best performing option from different alternatives each on several criteria is termed as multi-criteria decision making (MCDM) problem. “MCDM is considered as a sophisticated decision making tool involving both quantitative and qualitative factors” [4]. It is widely applied for mathematical optimisation in various fields requiring decision making [5]. Besides making choices of the best performing alternatives from among a finite set of decision alternatives, MCDM problems are usually in terms of multiple and so often with conflicting criteria [6, 7]. Also [8] pointed out that it is not easy to get a better alternative from a set of alternatives. MCDM methods are very much effective in many fields which require decision making [9].
Fuzzy
In fuzzy TOPSIS, all ratings and importance weights are defined by means of linguistic variables which in turn each variable is associated with a fuzzy number [17] as opposed to classical TOPSIS that uses known crisp values [18]. MCDM with crisp values does not capture the imprecision and vagueness particularly from the human judgement and preferences [19]. [20] added that linguistic terms evaluation often have intangible and inherently imprecise data when crisp values are used. So, MCDM method in the fuzzy environment was used. Also, [9] added that MCDM methods have been used by researchers in agriculture to support decision making. As part of methodology, the fuzzy TOPSIS method and triangular fuzzy numbers were used because of the ideal solutions it gives [21]. The results found by fuzzy TOPSIS method were compared with results by
Data were provided by Sustainable Agriculture Tanzania (SAT) a non-governmental organisation with its headquarter in Morogoro municipality, Tanzania. The organisation seeks to address the existing social and environmental problems by having a sustainable agriculture in Tanzania. The organisation also advocates organic farming that is a farming practice without use of chemical fertilizers, pesticides or genetically modified organisms [26]. Yadav et al. [27] defined organic farming as a system of agriculture that neither uses synthetic fertilizers nor pesticides nor growth regulators nor livestock feed additives.
In collaboration with other partners, SAT also disseminates proper knowledge to small scale farmers in order to transform farming practices in Tanzania through a training centre it owns [28]. Besides working with farmers, SAT does agro-processing for food products in some of the produce from their farmers. Food processing plays a big role in economic development especially in developing countries like Tanzania [29]. The organisation owns a shop for selling part/all of the processed products. The products were doing well in the market yet observation revealed that still there was a room to improve more market performance of the products. Massive production of agro-processed products requires agro-industry.
Broadly, agro-industry refers to the establishment of enterprises and supply chains for developing, transforming and distributing specific inputs and products in the agricultural sector. A narrower definition portrays agro-industry as the sum of post-harvest activities involved in the transformation, preservation and preparation of agricultural products for intermediate or final consumption [30]. Agro-industry provides means of converting row food and/or agricultural materials into value added products which in due process, generate employment and higher income and hence contribute to poverty alleviation vis-à-vis socio-economic development [31].
This study assessed performance of agro-processed products at SAT branding, delivery and protection of the processed product; payment and acquisition technology and uniqueness of the employed technology; target market and market competition; customer willingness to pay, heterogeneity and demand for the products as they were scrutinised in [32].
As it is seen in the case study section, four criteria; product, technology, marketing and customer were used. Each criterion carried with it sub-criteria to narrow it down. Brand (one of sub-criterion in product) is a logo that has unique design, name, term, sign, symbol, word or a combination of them [33]. It identifies goods or services of a seller or group of sellers from those of other sellers [33]. Thus, branding is the process of creating brand that identifies itself from other products or services. “Brands are clusters of functional and emotional values which promise stakeholders unique experiences” [33]. Thus brand creates relationship with customers and consumers. It builds a kind of image in the customers’ mind [34]. It is the centre of which business processes and procedures function [35].
Appropriate technology is a very important factor/criterion in the growth of agro-processing industry [36]. In a review of the challenges affecting the agro-processing sector in Tanzania, It is shown that technology is one of the key factors in the sector [37]. But also it is a challenging task to the management and since it is not an easy task to get the right technology [38]. [29] pointed out that poor technology is among the challenges facing agro-processing industry in Tanzania. Inter alia, technology in agro-processing includes; processing itself, packaging, means of payment and delivery of products or services to customers.
In business, goods or services have to be delivered to the market or customers. Thus one should consider the issue of marketing in the business. In marketing goods and services, customers’ needs have to come first [39]. Marketing starts with identifying consumers’ or customers’ needs and then plan for production of goods and services or brands that will satisfy the customers’ needs [40]. [41] defined marketing as “an organisational function and a set of processes for creating, communicating, and delivering value to customers and for managing customer relationships in ways that benefit the organisation and its stakeholders”. Also marketing was defined as “performance of all business activities involved in the flow of goods and services from the point of initial production until they are in the hands of ultimate consumer” [42]. From these definitions, the key issue in marketing is the relationship between goods producers or service providers in one hand and consumers in another hand or more precisely sellers and buyers. In Tanzania, production and marketing of organic products is still at its beginning and there are factors that impede rapid growth of the sub-sector including consumption of the products [43].
The main goal of this paper is to assess performance of agro-processed products at SAT Morogoro, Tanzania in order to guide in the decision processes. Together with the introduction section, the rest of the paper is organised as follows; the methodology section that explains the fuzzy TOPSIS and fuzzy AHP methods, a case study section that comprises of data collection and presentation, data analysis and interpretation of results. A references section comes after the conclusion and recommendations section.
Methodology
The fuzzy TOPSIS method
For the sake of this study, the fuzzy TOPSIS method was divided into ten steps as follows;
Step 1: Formulation of a decision making committee
A committee D ={ D1, D2, ⋯ , D K } of K decision makers who are experts in the area of interest was formed.
Step 2: Criteria and alternatives
A set C ={ C1, C2, ⋯ , Cn } of n evaluation criteria and a set A ={ A1, A2, ⋯ , An } of m alternatives under study were identified.
Step 3: Formulation of linguistic variables
Choose appropriate linguistic variables for assigning the importance weight of each criterion and for rating of each alternative.
Step 4: Aggregation of weights of criteria and alternative ratings
The importance weights assigned by the individual experts are aggregated for each criterion to get an aggregated fuzzy weight
Suppose
Then, the aggregated fuzzy weight for criterion j is
Thus, for all criteria,
Similarly, the decision makers (experts) were pooled together to come up with the aggregated fuzzy rating
Let
Step 5: Construction of fuzzy decision matrix and normalised fuzzy decision matrix
All
The fuzzy decision matrix is normalised so that
•Each entry of the normalised triangular fuzzy numbers belongs to [0, 1],
•The linear scale transformation makes criteria scales into comparable numerical quantities for alternative ratings (Vafaei et al., 2018).
The normalised fuzzy decision as given by Saghafian (2005) is a m × n matrix given by
If C j . is a benefit criterion then,
If C j is a cost criterion then,
Step 6: Construction of Weighted Normalised Fuzzy Decision Matrix
The importance weight of each criterion is now considered. The weighted normalized decision matrix is given in matrix form as
Step 7: Determination of the Fuzzy Positive Ideal Solution (FPIS, A*) and Fuzzy Negative Ideal Solution (FNIS, A-)
By Soufi et al. (2015), FPIS is the alternative that one would want. It maximizes the benefit criteria while minimizing the cost criteria. The FNIS does the reverse.
Let
Step 8: Calculation of the distances d (Ai, A*) and d (Ai, A-) for each criterion
Ai is in the weighted normalized fuzzy decision matrix. Thus,
Step 9: Calculation of the Closeness Coefficient CCi of Each alternative
Step 10: Determine the Ranking Order of the Alternatives
The ranking is performed according to the closeness coefficients CC i . The highest CC i value gives the highest rank and corresponds to the best choice among/between alternatives.
By Ayhan (2013) procedure, fuzzy AHP method falls under two main steps; Determination of weights of criteria based on the goal, Determination of weights of alternatives according to the given criteria.
Determination of Weights of Criteria wj
Some simple steps are needed in the determination of criteria weights:
Step 1: Pair wise comparison of criteria with respect to the goal
Every expert (decision maker) was asked to compare one criterion to another, be it on the importance or any other preference. This was done via given linguistic terms. Each linguistic term was associated with a fuzzy number.
Suppose a positive fuzzy number
The pairwise comparison matrix contributed by the k
th
decision maker is thus given by:
The individual pairwise comparison matrices contributed by K decision makers are aggregated to come up with one matrix. In this study, the overall matrix
In such a case (for more than one decision maker),
Step 2: Determination of the geometric mean from the fuzzy comparison matrix
By Ayhan (2013), the geometric mean of fuzzy comparisons is obtained by
Step 3: Determination of the fuzzy weight of each criterion
Sub-Step 3a: Summation of
The
Sub-step 3b: Determine s-1
Suppose s = (a, b, c), then
Sub-step 3c: Determine the fuzzy weight
Each geometric mean
Step 4: Defuzzification of
Since
Step 5: Normalisation of Mj
Mjs were normalised such that wj ∈ [0, 1] and
Same procedure could be applied if there could be sub-criteria.
The procedure for determining weights of alternatives is the same as for criteria weights. The difference is that for each criterion or sub-criterion (if any), a pair wise comparison matrix of alternatives is formed. Decision makers’ preferences are done based on that criterion or sub-criterion. For n given criteria or sub-criteria, there are n pair wise comparison matrices. Each matrix takes same steps as for criteria weights.
Then, sums of products for weight of alternative and the respective criterion and sub-criterion are determined for each alternative. The alternative with highest score (sum) is the best preferred alternative.
Suppose there are K sub-criteria altogether, let
for each fixed i, i = 1, 2, ⋯ , m.
In the exercise to assess the performance of processed crops at SAT, a set of four main criteria C ={ C1, C2, C3, C4 } was identified. These are; product itself, technology, marketing and customer in the order of set C. Under the product criterion; three sub-criteria were formulated as branding c11, delivery c12, and patent protection c13. Product payment and acquisition c21 and technology uniqueness c22 are sub-criteria of technology. The sub-criteria of marketing are target markets c31 and market competition c32. Under the criterion customer, three sub-criteria were formulated as customer willingness to pay c41, customer heterogeneity c42 and customer demand c43.
The alternatives for this study were the set of processed crops A ={ A1, A2, A3, A4, A5 }. These are the processed beans, maize, sunflower seeds, Rosella, and rice at SAT in the order of set A. A committee of three decision makers who are experts at SAT and in the area of interest DM ={ D1, D2, D3 } was formed.
Table 1 gives description of the intended meaning of each sub-criterion under this exercise.
Description of evaluation sub-criteria for each criterion
Description of evaluation sub-criteria for each criterion
Figure 1 shows the MCDM problem structure on performance of processed products of crops at Sustainable Agriculture Tanzania (SAT) in Morogoro.
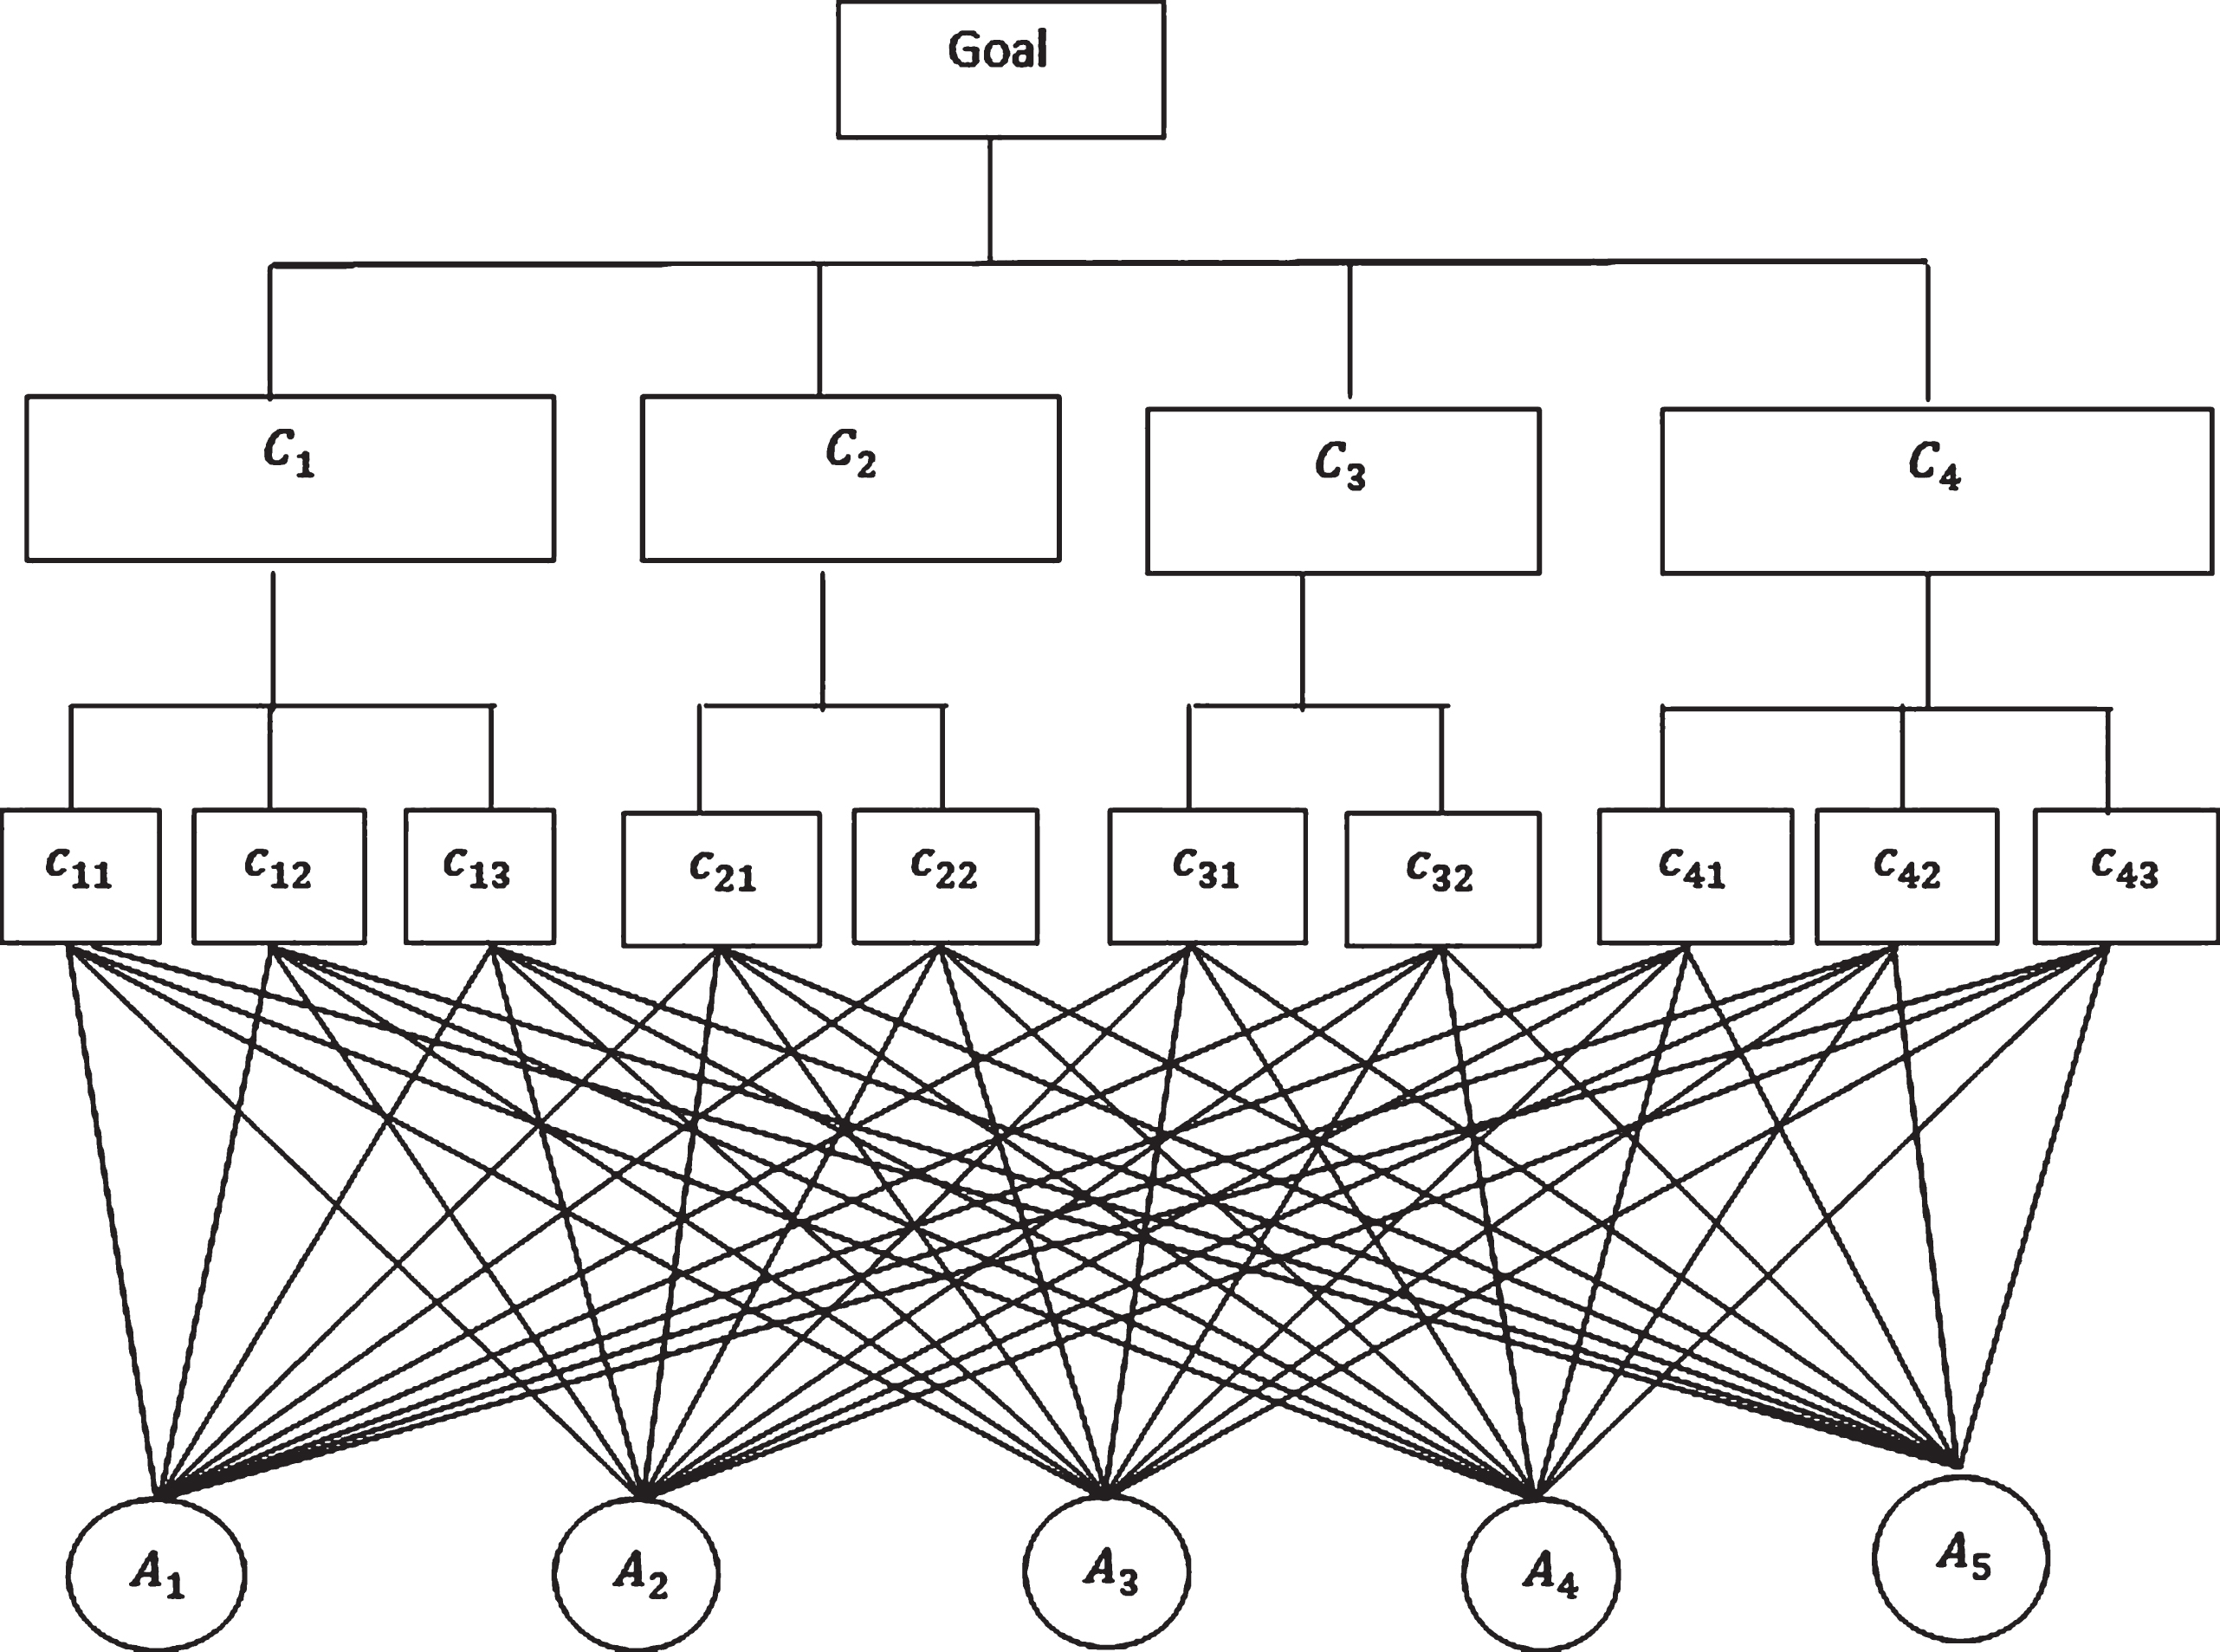
MCDM problem structure.
For fuzzy TOPSIS
A set of three decision makers DM ={ D1, D2, D3 } was used to assign the importance weight of sub-attributes with respect to each main attribute. The decision makers were experts in agriculture and specifically in agro-processing.
Tables 2 3 give some linguistic variables and the corresponding triangular fuzzy numbers to be used in fuzzy TOPSIS model.
Linguistic variables for importance weight of each criterion/sub-criteria
Linguistic variables for importance weight of each criterion/sub-criteria
Linguistic variables for rating the alternatives against criteria
MP = (2,4,6) and F = (4,6,8) were for intermediate values Medium Poor and Fair respectively.
Table 4 shows the importance weight assigned by each expert on each sub-criterion by using the linguistic variable shown in Table 2 for the given criteria. Table 5 shows ratings of alternative by the experts obtained by using the linguistic variables given in Table 3.
Decision makers’ assignment of the importance weight of sub-criteria
Rating of alternatives (processed crops)
When at the field, data were collected for comparison purpose. The criteria/sub-criteria were pairwise compared to each other via linguistic scale shown in Table 6.
Linguistic variables for weight comparison of pairs of criteria/sub-criteria
Linguistic variables for weight comparison of pairs of criteria/sub-criteria
From Table 7 that shows experts comparisons between criteria, a linguistic pairwise comparison matrix for the criteria was formed as shown in Table 8.
Pairwise importance weight comparison of criteria on goal
Linguistic pairwise comparison matrix of criteria on goal
Also sub-criteria for each criterion were pairwise compared to each other.
Table 9 is the comparison of sub-criteria for criterion ’product’. Likewise, the linguistic comparison matrix for these sub-criteria was done as for the criteria.
Pairwise importance weight comparison of sub-criteria on criterion ’product’
Similarly, pairwise comparisons of sub-criteria for other criteria; technology, marketing and customer were made.
Also the alternatives were pairwise compared on each sub-criterion.
Table 10 is the pairwise comparison of alternatives with regard to sub-criterion ’branding’. The same means of data collection was applied for other sub-criteria.
Pairwise comparison of alternatives based on sub-criterion c11
c11- Branding.
Aggregation of experts’ assessment of the importance weights of sub- criteria
By Table 2 and Table 4 and the sub-criteria branding; VI ≡ (0.7, 0.9, 0.9), I ≡ (0.5, 0.7, 0.9) and VI ≡ (0.7, 0.9, 0.9).
Thus, importance weight of sub-criterion ‘branding’ is given by
It implies that
By similar procedure, fuzzy numbers
Aggregated importance weights of expert’s assessments on criteria/sub-criteria
Aggregated importance weights of expert’s assessments on criteria/sub-criteria
As an example, entry
The decision matrix
The decision matrix
Hence,
Since none of the criteria is a cost criterion, Equation (1) was applied.
Consider the fuzzy numbers along C1 in Table 12. The set of third entries along C1 is {9, 9, 9, 9, 9} and
The normalised decision matrix
The normalised decision matrix
Consider
from Table 11 and the matrix in Table 13. The weighted normalised matrix
and
Other
The weighted normalised decision matrix
The weighted normalised decision matrix
For FPIS,
Hence, for j = 1;
By similar procedure,
Hence,
For FNIS,
Thus,
Therefore,
Calculations of distances d (A i , A*) and d (A i , A-)
For FPIS,
Similar procedure was used to obtain other entries in Table 15.
Distances between alternatives and FPIS
Distances between alternatives and FPIS
For FNIS,
Distances between alternatives and FNIS
Data analysis by fuzzy AHP model
Using the linguistic scale of Table 6 and Equation (3), the comparisons of criteria by experts in Table 8 were aggregated and the results are shown in Table 18.
The aggregated pairwise comparison matrix of criteria on goal
The aggregated pairwise comparison matrix of criteria on goal
Then the fuzzy geometric means
In the same manner, other
Criteria geometric means and others
The resulting s-1 (the inverse of Equation (5)) was then written in increasing order (s-1 = (l, m, u) = (0.1832, 0.2391, 0.2705)) to make sense for a triangular fuzzy number before multiplying it with each
Then M i and N i (≡ w j , i, j = 1, 2, 3, 4) were determined by applying Equations (7) respectively. All results are found in Table 19.
Thus the crisp weights of criteria are;
Similar procedure was applied to determine the relative weights for sub-criteria and relative weights of alternatives with respect to each sub-criterion. The results of the calculated values are shown in Table 20.
Computed relative weights of sub-criteria and alternatives
Then, using entries of Table 19 (rightmost column) and Table 20, the overall score of each alternative was computed by Equation (8) and the results are shown in Table 21.
Computed scores of alternatives
Upon looking at the closeness coefficients CC i column of Table 17, it was found that CC3 > CC2 > CC5 > CC1 > CC4. This guided ranking of alternatives (processed crops) in Table 17. The higher the value of CC i , the better the choice or option.
Calculated closeness coefficients CC
i
Calculated closeness coefficients CC i
One can defuzzify the aggregated importance weights of criteria in Table 11 (not a step of fuzzy TOPSIS method) in order to easily visualise the importance weights of criteria.
By centre of area method, each
Results of all these are in Table 22.
Defuzzified importance weights w j of criteria
According to aggregation procedure applied in the whole process, it was observed that crisp weights of criteria do not differ much from one another but more weight went to the product criterion (0.2617) and less weight to customer criterion (0.2212) as seen in Table 22.
A comparison of the results (Table 19) by fuzzy AHP showed that more weight went to technology criterion (0.3265) and less weight also to customer criterion (0.1527) (Fig. 2).
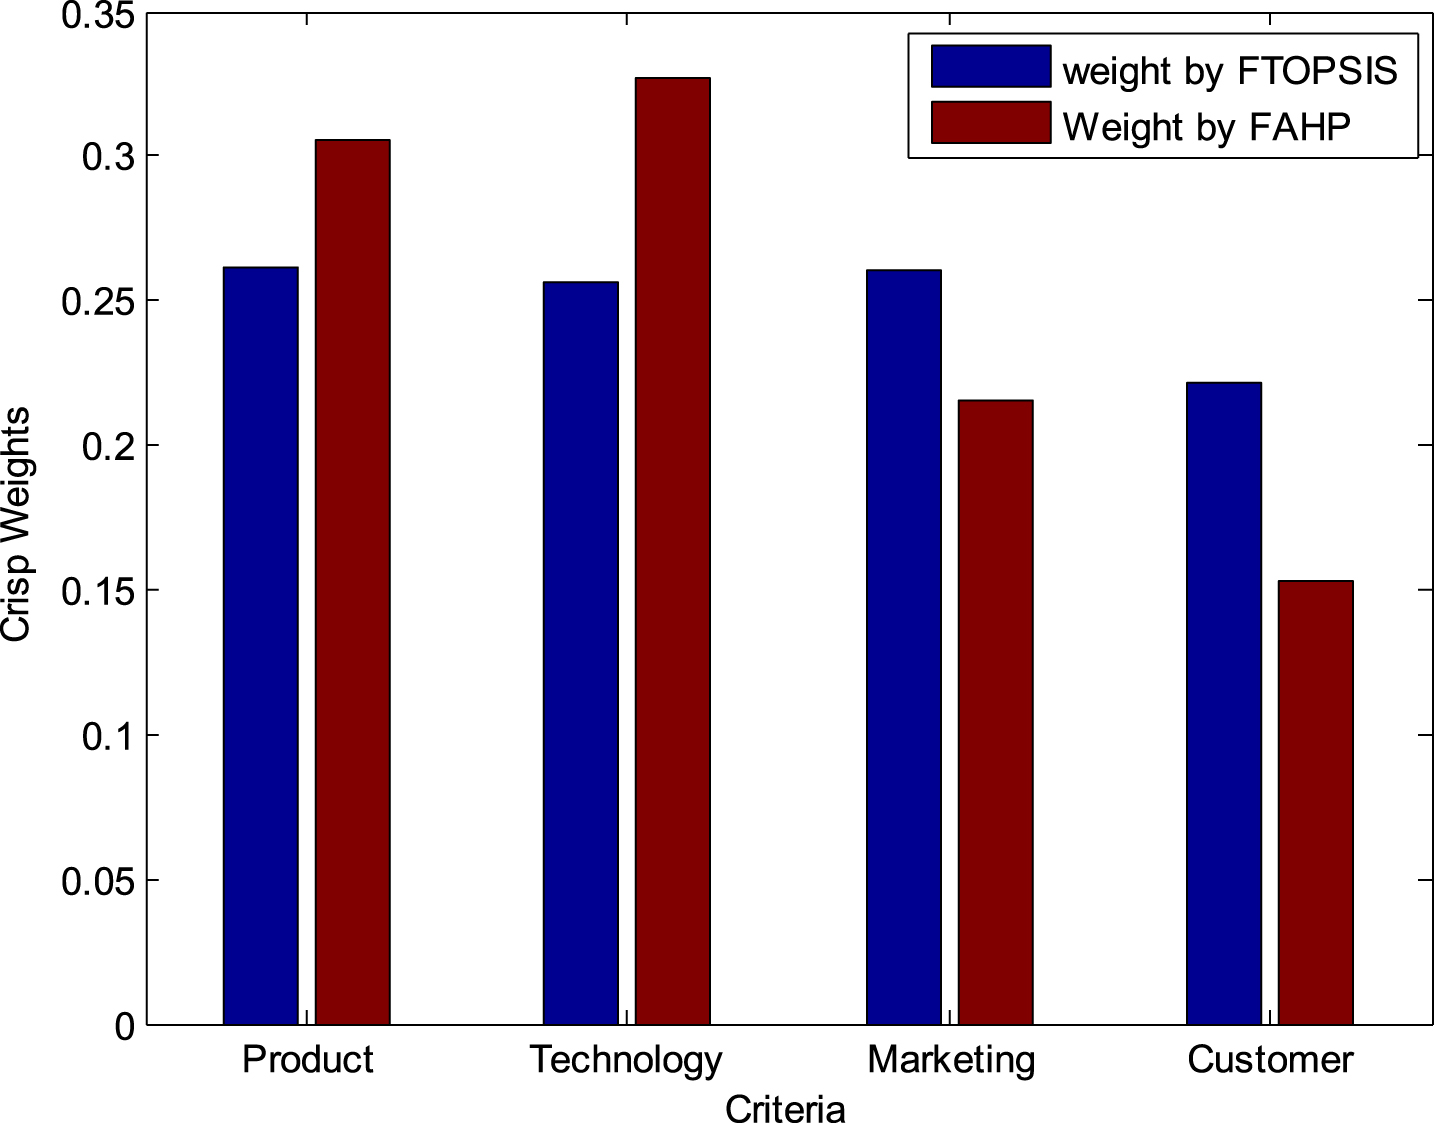
Comparison of weights obtained by FTOPSIS method against FAHP method.
The ranking of alternatives was compared also by fuzzy AHP and it was guided by the total scores (Table 21) of the alternatives; TscoreA3 > TscoreA2 > TscoreA1 > TscoreA5 > TscoreA4 (Fig. 3).
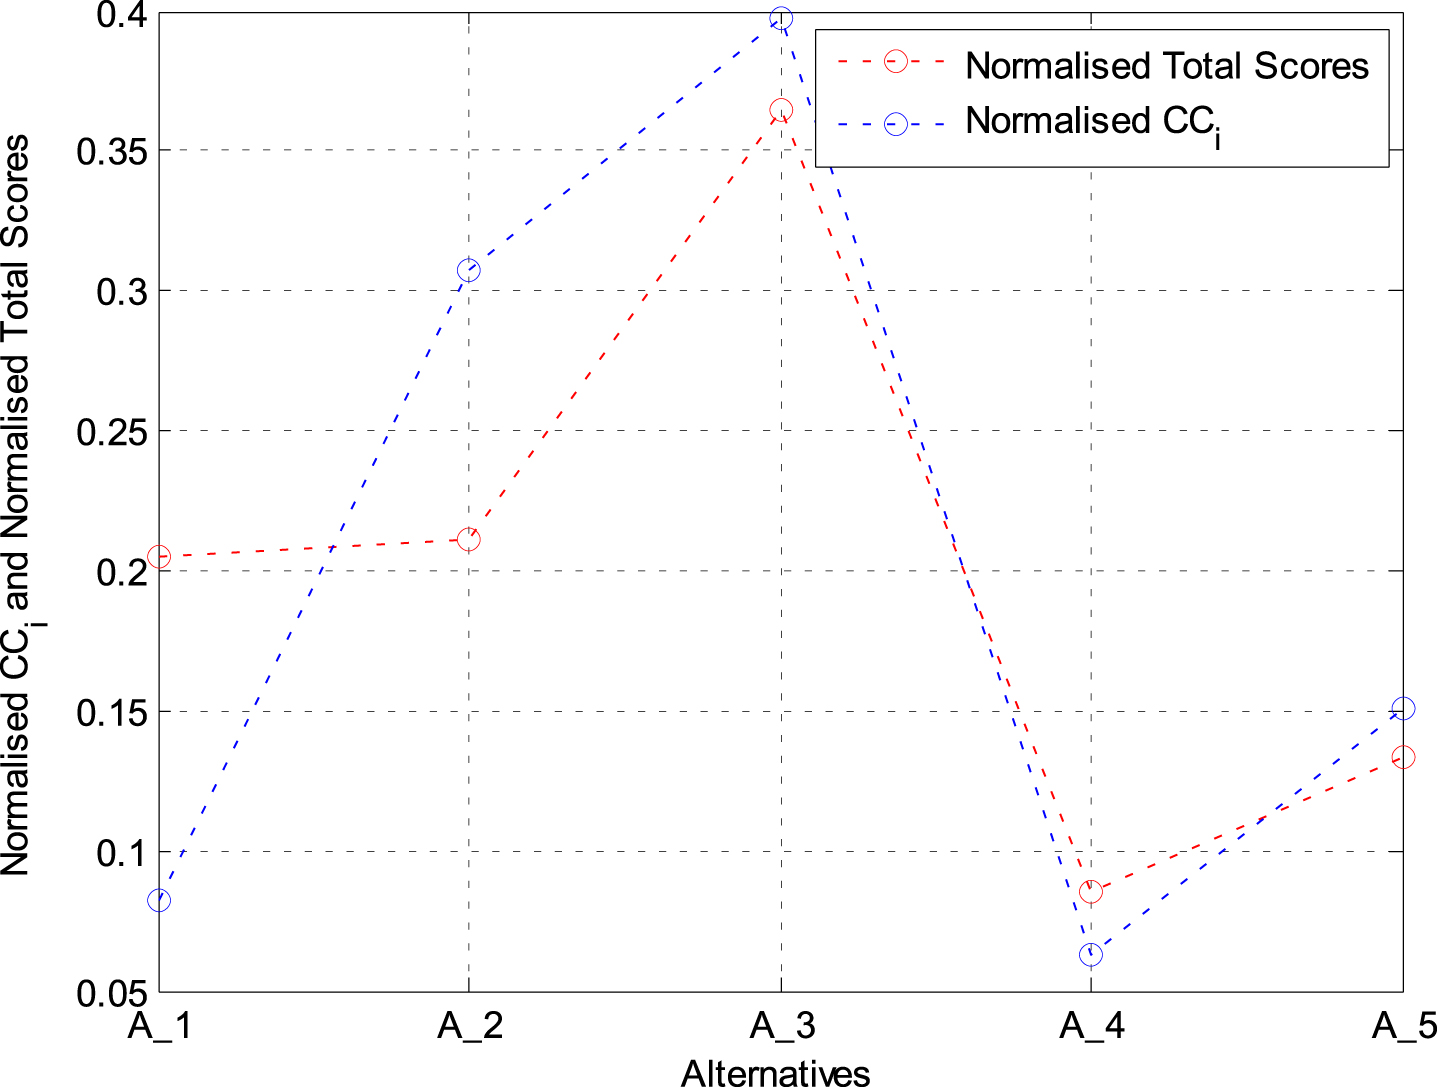
Comparison of CC i obtained by FTOPSIS method against total scores by FAHP method.
The main goal of this study was to assess the market performance of processed products of crops at Sustainable Agriculture Tanzania (SAT) in Morogoro in order to assist in decision making process of the organisation.
According to the results by fuzzy TOPSIS model in Table 17, the CC i of the alternatives were such that A3 > A2 > A5 > A1 > A4. This means that according to the criteria product, technology, marketing and customer as they were defined by their sub-criteria for each criterion, the processed product of the crop sunflower seeds performed better than the rest of the other four processed products of the crops beans, maize, rosella and rice.
As a general remark, the sunflower seeds processed product performed best followed by processed maize, processed rice and then processed beans. The product of the processed rosella performed in the lowest position.
Results by fuzzy TOPSIS model were compared by results of fuzzy AHP model. It was found that, processed products from sunflower seeds, maize and rosella retained their ranks while beans and rice exchanged positions (Fig. 4).

Comparison of ranks obtained by FTOPSIS model against FAHP model.
Four criteria with ten sub-criteria altogether were considered and applied in evaluating performance of the products of processed crops. SAT may work out on products that performed lower in the market by looking at their corresponding weights of criteria/sub-criteria.
Similar studies may be conducted by considering other different criteria deemed useful to improve performance of same products. The study too may be replicated for other agro-processed products at SAT or elsewhere.
Footnotes
Acknowledgments
Thanks to my supervisors; Prof. Valentina E. Balas, Department of Automation and Applied Informatics, Aurel Vlaicu University of Arad, Romania and Dr. David Koloseni, Department of Mathematics, University of Dar es Salaam, Tanzania for their assistance with particular techniques, methodologies, and comments that greatly improved the manuscript. Thanks to Madam Janet, the managing director and the management of SAT in general for the warm welcome to work with their organisation.