
Abstract
Person re-identification identify a specific person in surveillance network by similarity measurement between images of different camera views. However, existing metric learning based methods suffer from over-fitting problem. To solve this problem, a resampled linear discriminant analysis (LDA) method was proposed based on the statistical and topological characteristics of pedestrian images. This method utilized the k-nearest neighbours to form potential positive sample pairs. The potential positive pairs are used to improve the metric model and generalize the metric model to the test data. By minimizing the inter-class divergence of potential positive sample pairs, a semi-supervised re-sampling LDA person re-identification algorithm was established. It was then tested on the VIPeR, CUHK01 and Market 1501datasets. The results show that the proposed method achieves the best performance compared to some available methods. Especially, the proposed method outplays the best comparison method by 0.6% and 5.76% at rank-1 identification rate on the VIPeR and CUHK01 datasets respectively. At the same time, the improved LDA algorithm has improved the rank-1 identification accuracy of traditional LDA method by 9.36% and 32.11% on these two datasets respectively. Besides, the proposed method is limited to Market-1501 dataset when the test data is of large size.
Introduction
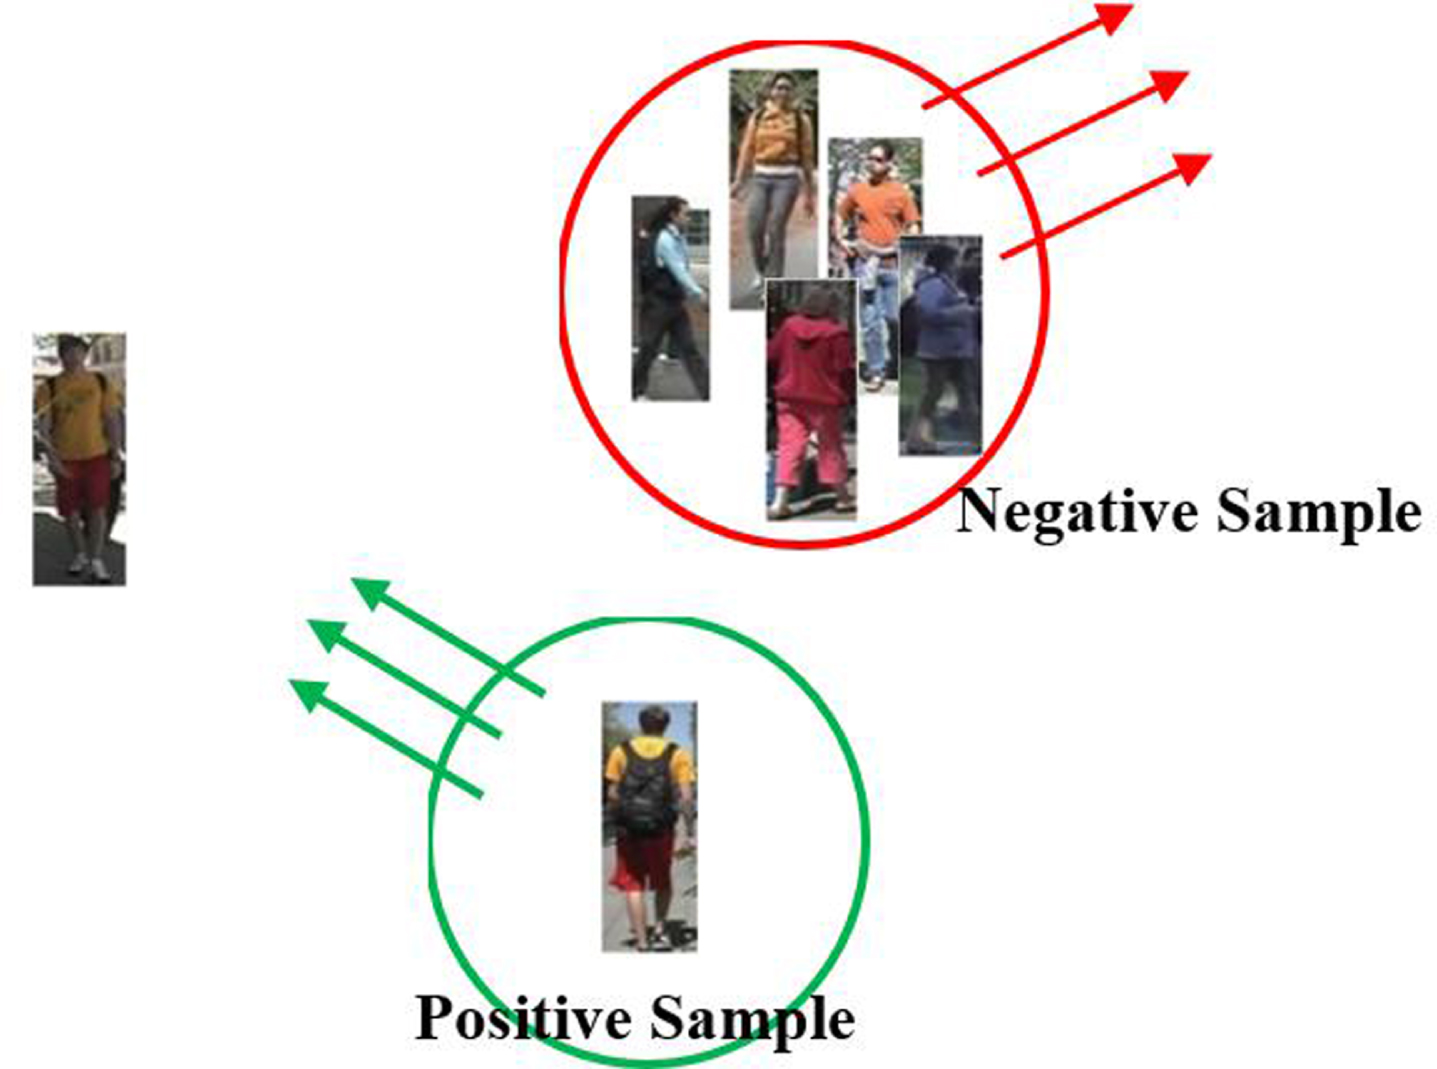
With the rapid development of computer vision technology and the construction of video surveillance networks, the technology of person re-identification, as an emerging hot topic, has attracted more and more researchers to invest efforts on it [1–5]. In fact, the task of re-identification of pedestrians is to identify pedestrians who appear in different locations or at different times in non-overlapping surveillance networks. Compared with traditional image recognition tasks, the appearance features of pedestrian images captured by suffer from drastic variations caused by multiple factors such as light, posture, shooting angle and background changes et al. [2, 3]. Its application scenarios are more complex, as shown in Fig. 1, existing metric learning based methods learn a similarity measurement model by enforcing the positive samples close to the test individual and the negative samples far away the test individual. However, the negative pairs are different from degree of similarity to the test individual. Existing metric leaning based methods should take the degree of similarity of negative samples into consideration. Otherwise, the metric subspace will be curved and weak in similarity measurement.
Metric learning for person re-identification.
Person re-identification mainly includes 3 steps: feature extraction, metric model training and similarity measurement. Finally, an image feature expression model with strong discrimination and robustness are obtained. Feature extraction is the key point of person re-identification task. Because the image resolution of a pedestrian is low, traditional methods based on pose and face recognition cannot be applied to person re-identification task. Instead, the color and texture information of the image is used to build a feature model. Traditional color and texture feature extraction techniques, such as LBP, Gabror operator, Schmid operator, and color histogram, have been widely used in early person re-identification research. However, these traditional handcrafted features have poor robustness, resulting in a very low recognition rate. Zhang et al. [4] proposed a feature model based on the Codebook method, which converts image pixel features into visual vocabulary features. It effectively improves the robustness of features. On the basis of salient color names based color descriptor (SCNCD), Yang Y et al. [6] proposed to describe the human re-identification problem as a color distribution matching problem. This method significantly improved the recognition accuracy of person re-identification. Liao et al. [7] proposed a local maximum occurrence (LOMO) feature representation method, which combines the color feature and texture feature of the image, and effectively improved the state-of-the-art rank-1 identification rates recognition rate on the person re-identification dataset.
Although people have proposed effective and improved appearance feature models for person re-identification tasks for many years, the accuracy of person re-identification is still at a low level due to the complexity of the dramatic changes in the appearance of pedestrians during the process of crossing the camera views. In order to overcome the interference of these factors, a person re-identification method based on transformation has been proposed. Person re-identification methods based on image brightness transfer functions (brightness transfer functions) [8, 9] solve the interference caused by changes in light brightness in the external environment by constraining the cumulative histogram of image brightness of the same target. However, in real life, the changes in the light environment of pedestrian images are irregular. Human body structure information is another important content of pedestrian images. The use of human body structure information can effectively reduce the drastic changes in appearance features caused by the misalignment of human body structure [10]. Considering the symmetry of the human body structure, Franzen et al. [11] proposed the Symmetry-Driven Accumulation of Local Features (SDALF) model to extract the features of human body. However, the improved person re-identification algorithm based on the transformation model has very limited improvement in the recognition accuracy, and the complex high-dimensional features also have higher requirements for the measurement model. Therefore, in the follow-up research work, the establishment of similarity distance measurement model has received extensive attention, and researchers have carried out in-depth research on the person re-identification algorithm based on the metric model.
Through the research of pedestrian re-identification algorithms based on metric learning, many algorithms have been proposed, such as RDC [12], ITML [13], KISSME [14], XQDA [7], and NFST [15]. The RDC algorithm is a person re-identification algorithm based on the metric projection space method proposed by Zheng et al. This method learns a projection subspace so that the distance between the positive sample pair is smaller than the distance of the negative sample in this subspace. In the RDC algorithm, the pedestrian re-identification problem is transformed into a relative distance comparison problem, and an optimization objective function is established, meanwhile, through derivation, an iterative optimization projection space solution method is designed. In addition, Zheng et al. proposed the PRDC algorithm by improving the RDC algorithm through a probability model based on the RDC algorithm, which effectively enhanced the recognition accuracy. M. Kostinger et al. [14] established a metric model for person re-identification from the perspective of the overall distribution of positive and negative samples. The algorithm assumes that the populations of positive and negative samples obey normal distributions with different parameters, and establishes a probability model for the distribution of positive samples and negative samples. Then, according to the probability density functions of the two distributions, a statistical inference model is established to learn the distance measurement model for person recognition. From the perspective of statistical inference, Du Yuning et al. [16] proposed a new person re-identification algorithm based on statistical inference, and under the verification of sample training experiments, the performance of this algorithm is better than the existing pedestrian recognition algorithms. Combining the two ideas of the projection subspace learning method and the Mahalanobis distance learning method, Liao et al. proposed a novel method which learned a Mahalanobis distance in the projection space for person recognition.They first learned a.
Qi Ji [17] et al. proposed a metric learning algorithm based on the distance between geometries on the basis of the existing metric model algorithm research. The algorithm started from the appearance features of the sample and combines the RDC algorithm to improve the measurement model. Through a large number of comparative experiments, the effectiveness of the algorithm is verified. Chen Feng [18] and others introduced the idea of semi-supervision to improve KISSME. It established an unlabeled training dataset to generate potential image pairs which then used to for unsupervised weight learning for metric model of KISSME method. Zhang et al. [15] proposed to solve the problem of person re-identification by learning the discriminative zero space of training samples, and the NFST algorithm model adopted would be relatively simple. It learned a projection subspace by which the samples of each class collapsed to a point. The NFST method learned the projection pattern by enforce within-class scatter equal to zero in the subspace. At the same time, the NFST algorithm was nucleated to further improve the recognition accuracy of the algorithm. Using the feature fusion method, the accuracy of person re-identification has been greatly improved. Although through years of research, the identification accuracy of the person re-identification method based on metric learning has been significantly improved, but in practice, the appearance features of pedestrians crossing the camera views are very complicated, and the overall sample size is huge. The existing data contains only a small part of the feature changes, so that the metric model learned from the training sample overfits the training data, resulting in unsatisfactory measurement results of the test data.
Deep learning based methods are now the mainstream algorithm for person re-identification. It reaches great identification accuracy on this task and many methods have been proposed [17, 18]. However, the deep learning based method requires a lot of training data which needs a lot of manpower to label. In this paper, we study the metric learning based methods and try to design a metric learning based method to catch up with the performance of deep learning models.
In this paper, based on the existing research results, the person re-identification algorithm based on metric learning is studied. Aiming at the over-fitting problem in person re-identification task, an improved algorithm is proposed, and a metric learning model with stronger generalization ability is designed. The main contributions of the algorithm in this paper are as follows:
Based on the linear discriminant analysis algorithm, a metric projection space learning algorithm with strong discrimination ability is proposed. This method establishes the objective function and solves the projection matrix by constraining the positive sample pair divergence to be smaller than the negative sample pair divergence; The semi-supervised learning algorithm is introduced, and a semi-supervised linear discriminant analysis metric learning method is proposed. Different from the existing metric learning method, this method improves the learning of the projection matrix through the semi-supervised learning method, and enhances the generalization ability of the algorithm; Through the tests on VIPeR, CUHK01 and Market1501 two public datasets, the effectiveness of the proposed method and the reliability of the recognition accuracy are fully verified, which provides a useful reference for similar research.
Basic model of pedestrian re-identification
The main content of the research on pedestrian re-identification is to match the pedestrian images captured by different cameras. Given data sets
Next, we calculate the similarity between image sample pairs by defining a metric model. The measurement model defined in this paper is shown in Equation (1):
Let
Where
As shown in Equation (2), the purpose of the metric learning model is to learn the distance metric function d
Linear discriminant analysis is a classic metric learning method for metric learning. The idea of this algorithm is to project the sample data from the high-dimensional original feature space to the feature subspace with stronger discrimination power. The algorithm uses the prior information of the sample category label to extract it from the original feature space to achieve feature dimension reduction.
Given the pedestrian sample set {
Where S
b
represents the inter-class divergence and S
w
represents the intra-class divergence.
According to the definition of the inter-class divergence in Equation (4), it can be seen that the inter-class divergence reflects the difference between different classes of the population, and the intra-class divergence reflects the difference between the same class. According to the distribution hypothesis of the positive sample to the population and the negative sample population in the literature [7], it can be known that Ω
p
and Ω
n
respectively obey the zero-mean Gaussian distribution with different parameters, and
Based on the distribution assumption in the literature [7], using the above method to establish the optimization model of projection space learning, the positive and negative samples obtained by Equation (6) have a divergence of 0 for the population, and the population of positive and negative samples is as small as possible. It is contradictory to the optimization goal. Therefore, this paper establishes a metric learning model by minimizing the overall distribution divergence of positive samples and maximizing the overall divergence of negative samples. First, define the calculation method of the overall divergence of positive and negative samples as shown in Equation (7):
Aiming at the problem of person re-identification, the purpose of the metric learning model is to make the original sample, in the metric projection space, the population of positive samples as small as possible, and the population of negative samples as large as possible. According to Equation (7), the divergence expression of the population of positive and negative samples in the projection space is obtained, as shown in Equation (8):
According to the idea of linear discriminant analysis algorithm, construct the Fisher discriminant criterion function, as shown in Equation (9):
For the Fisher discriminant function in the above Equation (9), we can clearly see that the goal of the optimization model is to calculate the projection subspace so that the numerator
The existing person re-identification method learns a metric projection space or Mahalanobis distance through a supervised metric learning model, thereby learning a metric subspace with stronger discriminative ability. However, due to the dramatic changes in the appearance characteristics of the person re-identification sample image and the problem of small samples, the generalization ability of the commonly obtained metric model is weak, that is, the performance of the training data and the test data in the metric space is quite different. In response to this problem, this chapter proposes a person re-identification metric model based on improved linear discriminant analysis.
The linear discriminant analysis algorithm establishes a metric learning model for the person re-identification problem. It converts the Fisher discriminant criterion function into a solvable objective function by constraining the positive sample to the minimum overall divergence. However, due to the small sample problem, the sample feature becomes a high-dimensional vector, which makes the above optimization model an under-determined problem, which makes the metric model after training over-fitting. Literature [18] improves the discriminative power of the model by adding unlabeled training samples, but it does not enhance the generalization ability of the model. This article focuses on studying a semi-supervised metric learning method to improve the metric model to improve the generalization ability of the final metric model.
Given
Where and respectively represent the divergence of the positive and negative samples of the test sample. According to the expression of Equation (10), it can be seen that the improved metric learning model increases the generalization ability of the model by restricting the overall divergence of the positive and negative samples of the test data.
However, the label information of the test data is unknown, and and cannot be calculated. Therefore, this paper adopts a semi-supervised learning method to solve the above-mentioned metric model through stepwise optimization. Proceed as follows:
According to the training samples, calculate the initial metric model, that is, use the Lagrange multiplier method to solve Equation (10), then:
Taking the derivative of the above formula, we get:
Let the derivative in Equation (13) be equal to 0, then:
Therefore, the solution of the optimization problem in Equation (10) could be found by solving the eigenvalue problem in Equation (15):
Solve the eigenvalue problem in the above Equation (15) to obtain the eigenvector (
Calculate the positive and negative sample divergence of unlabeled data. The formula for ,
For the test data, the intra-class divergence of positive and negative samples is estimated by the k-nearest neighbor relationship of the samples in the metric subspace. In the metric subspace, the k-nearest neighbor similar samples of the sample to be identified are used to obtain the preliminary identification result. However, the model has an overfitting problem to the training samples and poor generalization ability. In this paper, the semi-supervised learning method is used to roughly estimate the divergence of positive and negative samples of unlabeled data, and the metric model is revised by the estimated value of the overall divergence of positive and negative samples.
Through the calculation in Equation (16), an approximate estimation of the overall divergence of positive and negative samples of unlabeled data is obtained. Similarly, using Lagrange multiplier method to solve Equation (11), we get:
Therefore, model (18) is transformed into the solution of the following eigenvalue problems:
By solving the eigenvalue problem in Equation (19), the metric space projection matrix of the improved algorithm is obtained.
Through the above steps, the person re-identification algorithm modeling based on the improved linear discriminant analysis method is completed. It can be seen from the modeling process that this paper uses a semi-supervised learning method to estimate the divergence of the positive and negative sample population of unlabeled data, and then uses the divergence of the positive and negative samples of unlabeled data to improve the projection space of the metric model.
This paper designs an improved linear discriminant analysis method for person re-identification.Our method firstly learns the initial metric projection space based on the linear discriminant analysis algorithm in the training sample set. Then, the semi-supervised learning method is used to estimate the overall divergence of positive and negative samples of unlabeled data in the metric projection space. The calculation process is shown in Table 1.
Algorithm calculation process of this paper
Datasets and parameter settings
In order to verify the effectiveness of the algorithm in this paper, we select VIPeR[3], CUHK01, and Market1501 person re-identification datasets for model test. Among them, VIPeR is the most widely used algorithm accuracy test data set. It contains 1264 images of 632 people. Each pedestrian has and only one image in each monitoring scene. The image size is normalized to 128×48 pixels. The CUHK01 dataset is larger than VIPeR and is a multi-shot dataset. Each pedestrian contains 2 images in the same surveillance scene. The dataset has 3884 images of 971 pedestrians.
This article is based on Matlab software to program the algorithm. The hardware environment is: PC (Intel i3-2130 3.40GHz CPU, memory 4 GB, hard disk 512GB).
Evaluation index
To evaluate the accuracy of the person re-identification algorithm, this paper uses the CMC cumulative accuracy curve [5, 7] as the evaluation method of the recognition accuracy. The CMC curve sorts the measured distance of the samples from small to large, and calculates the ratio of the number of correct recognition results to the total number of samples to be recognized among the recognition results ranked in the first l. The calculation formula is as follows:
Among them, l is the order of the recognition results and rank (d i ) < l represents the ratio of the correct samples ranked first l-1 in the recognition results to the total samples to be recognized. N represents the total number of samples to be identified. uppercaseexpandafterromannumeral2 (·)is a sign function which indicates whether the recognition result d i is ranked in the top l, and the function value is 0 or 1.
In order to further verify the effectiveness and robustness of the algorithm in this paper, the recognition accuracy of the algorithm was tested under different training sample sizes. The results are shown in Fig. 2.

Comparison of algorithm identification accuracy under different number of training samples. P denotes the size of data used for model training.
In Fig. 2, the abscissa represents the identification accuracy under different training sample sizes, and the ordinate represents the identification rate. It can be seen from Fig. 2 that the algorithm in this paper has excellent performance under different training sample sizes, and all have reached the optimal recognition results. Meanwhile, the algorithm in this paper is very robust to changes in the size of training samples. When the number of training individuals is reduced from 485 to 250, the recognition accuracy is only slightly reduced. Only when the number of training individuals is reduced to 100, the recognition accuracy decreases significantly due to too few samples.
Moreover, the sensitiveness of the proposed method on k values is analysed. The identification results under different k values are displayed in Fig. 3. As shown in this figure, the identification rates of rank-1, rank-5, rank-10, and rank-20 are displayed in this figure. According to the results, the proposed method reaches the best performance when k = 4.

Identification rates under different k values. k denotes number of k-nearest neighbour.
In order to ensure the fairness of the comparison test results, this paper adopts a standard experimental procedure, randomly divides the data set to generate training samples and test samples, and tests the recognition accuracy of the algorithm under the same training scale. At the same time, in order to ensure the validity of the statistical results, 10 independent repeated tests were performed, and the average accuracy was calculated as the final recognition result.
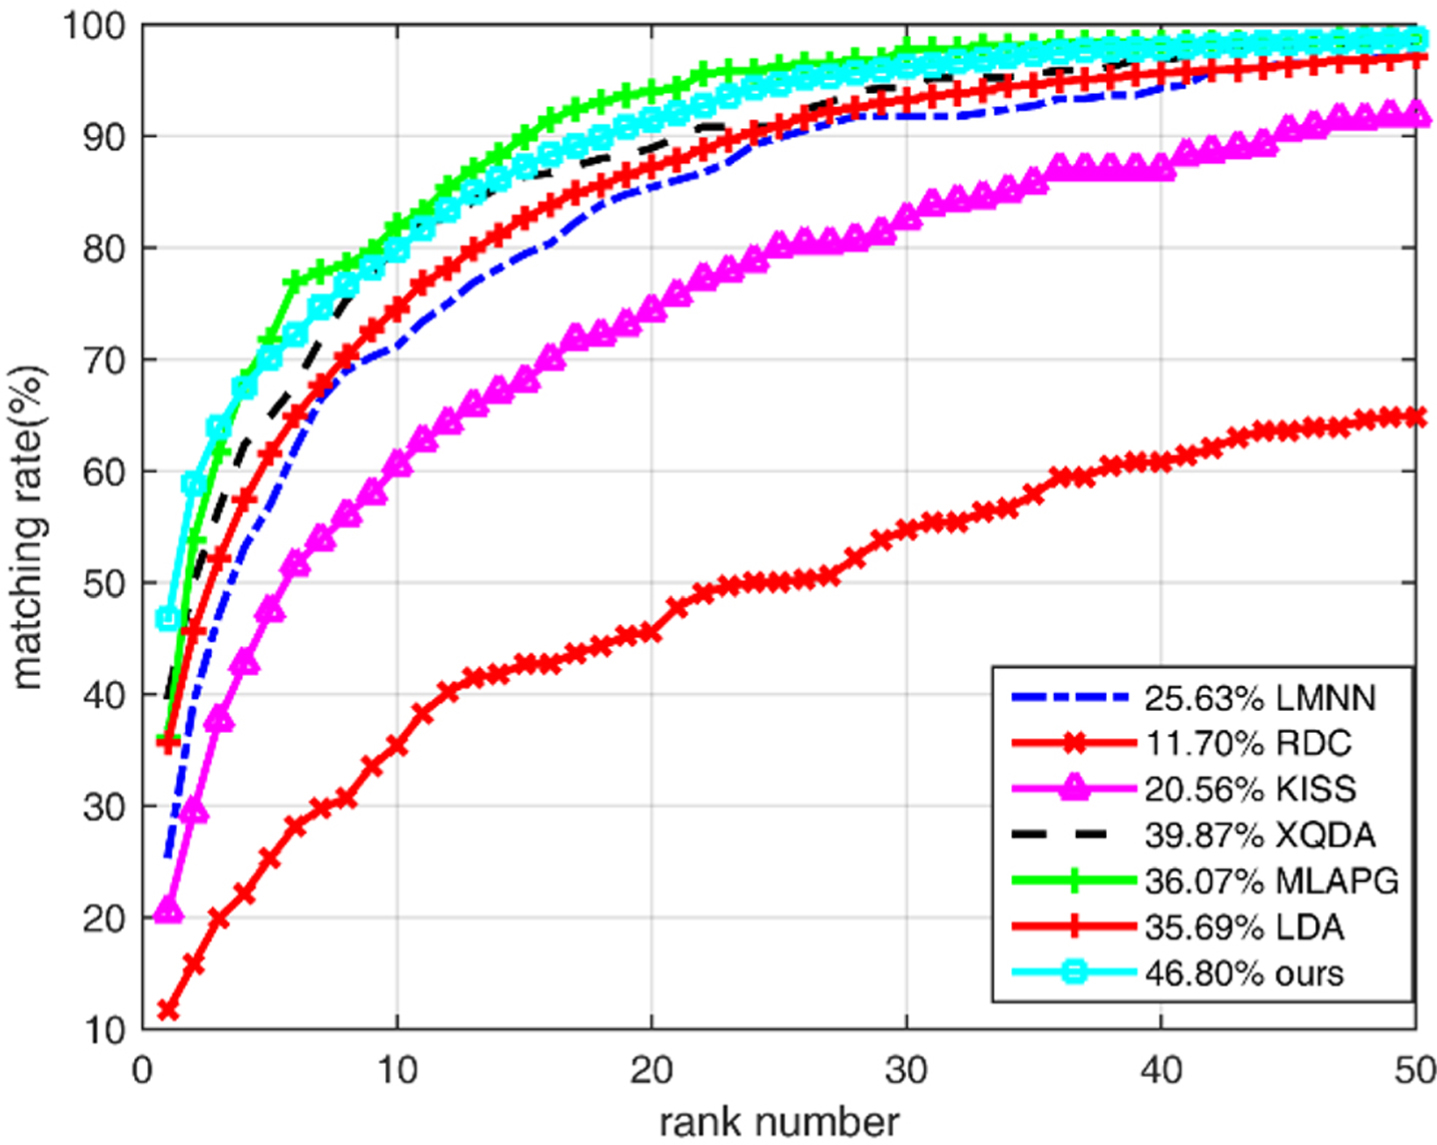
As shown in Table 2 and Fig. 4, for the comparison test results of the proposed method on the VIPeR dataset, the CMC curves of different algorithms of the recognition accuracy of rank-1, rank-5, rank-10, and rank-20 are displayed. p = 316 is the size of training data, which means that there 316 individuals are used for metric model training.
Comparison of algorithm recognition accuracy.
Comparison results on VIPeR
Experimental results show that the proposed method in this paper has achieved a high recognition accuracy. Compared with the state-of-the-art person re-identification algorithm, the recognition accuracy of the algorithm in this paper has been significantly improved, especially in the recognition accuracy of rank-1. Compared with the best comparison algorithm, the algorithm improves 0.60%. At the same time, the improved LDA algorithm improves the recognition accuracy by 9.36% compared with the LDA model. As for the rank-5, rank-10, and rank-20 identification rate, the proposed method also achieved the best or close to the best recognition accuracy.
In addition, Table 3 shows the comparison experiment results of the recognition accuracy of the proposed method on the CUHK01 dataset with XQDA [7], NFST [15], MLAPG [19], and Improved Deep [20]. p = 485 is the size of training data of CUHK01 dataset. It can be seen from the table that the proposed method has a very excellent performance. In addition, it is worth noting that, compared with the LDA person re-identification algorithm, the improved algorithm proposed in this paper has greatly improved the recognition accuracy. It can be seen that the algorithm in this paper is effective in improving the baseline LDA method. It outplays LDA by 32.11% at rank-1.
Comparison experiment recognition accuracy statistics table (CUHK01)
Comparison experiment recognition accuracy statistics table (CUHK01)
Besides, more experiments were conduct on the Market-1501 dataset to further prove the effectiveness of the proposed method. We repeated the experiments 10 times and the average identification rates are used for performance evaluation.
We first set test data size to 100 and the comparison experiment results of the proposed method on the Market-1501 dataset are presented in Table 4. Many state-of-the-art models are selected to compare with our method. The comparative results indicate that the algorithm in this paper has a very excellent performance, reaching the second accuracy. The proposed method reaches 91.12%, 96.97%, 98.69%, and 99.79% identification rate at rank-1, rank-5, rank-10 and rank-20 respectively. In addition, it is worth noting that the proposed method reaches the same level of identification accuracy as the deep learning models. It can be seen that the algorithm in this paper is effective in improving the metric learning based method.
Comparison experiment recognition accuracy statistics table (Market-1501)
Comparison experiment recognition accuracy statistics table (Market-1501)
Moreover, we set the test data size to 100 and 750 to test the proposed method under different training sizes and the comparison experiment results are displayed in Figs. 5 and 6 . As shown in these two figures, the proposed method is of low accuracy when the test size is large. This is because the improvement of the proposed method is based on the k-nearest neighbours for positive sample pairs estimation. There is a big error between estimation of overall divergence of positive samples and the ground truth. Therefore, the proposed method is limited when the test sample is large.
Identification rate on Market-1501(test size=100).
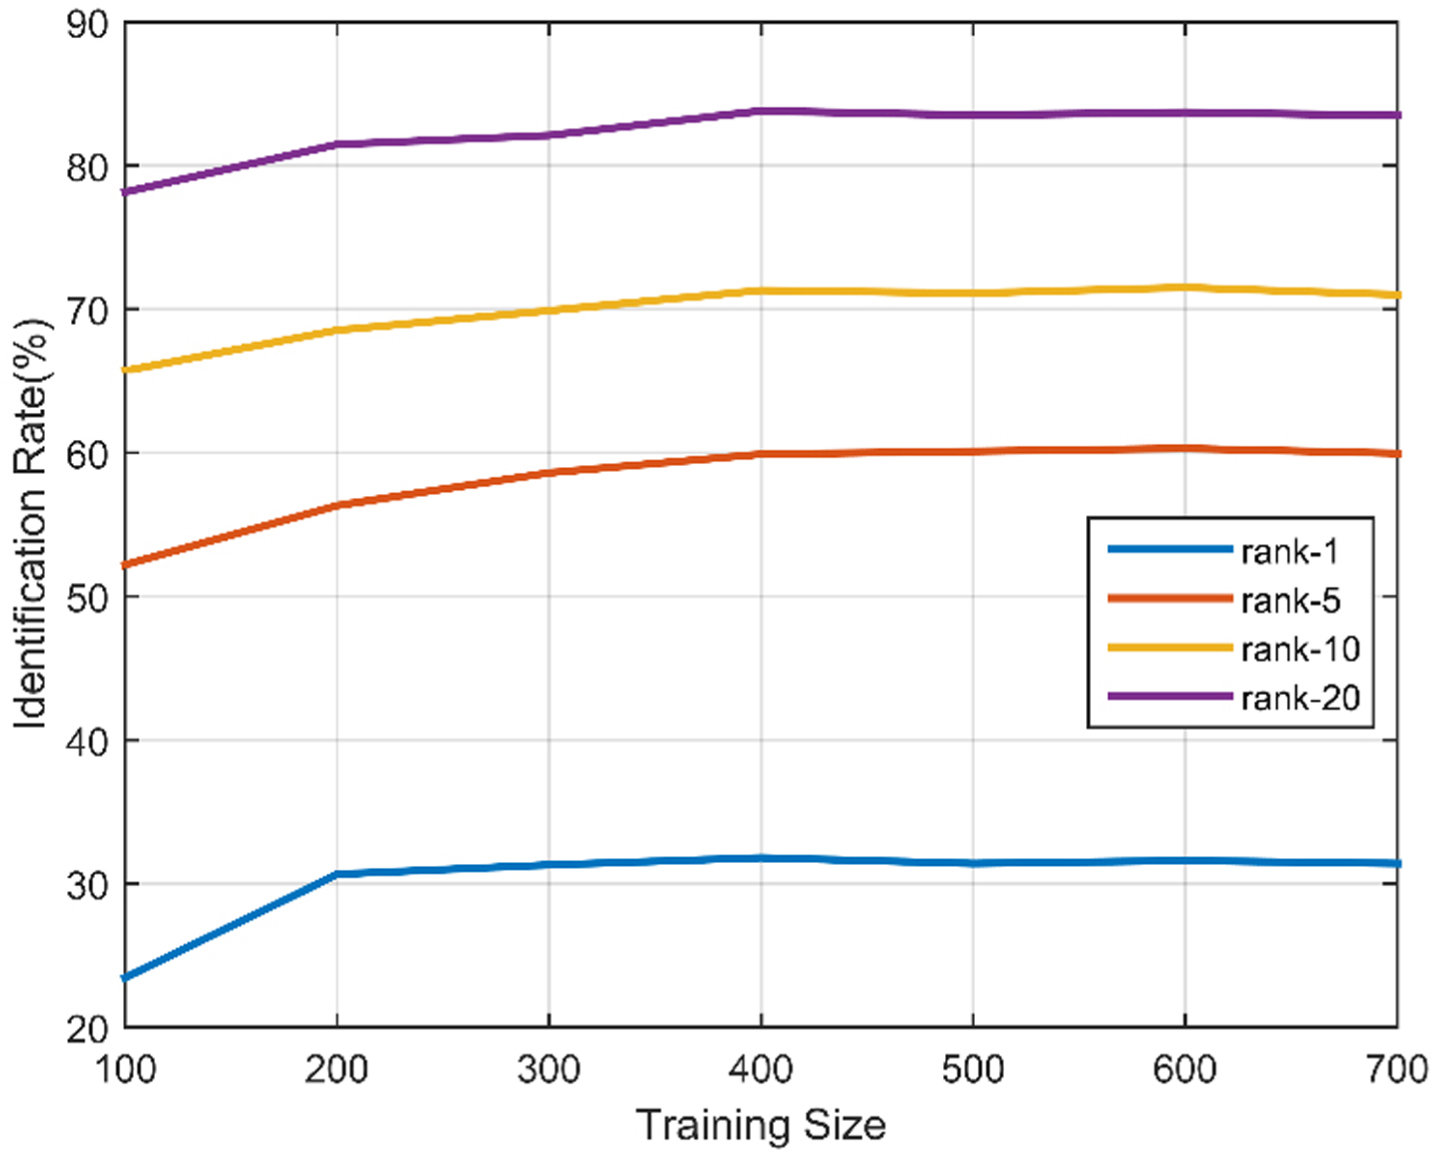
Identification rate on Market-1501(test size=750).
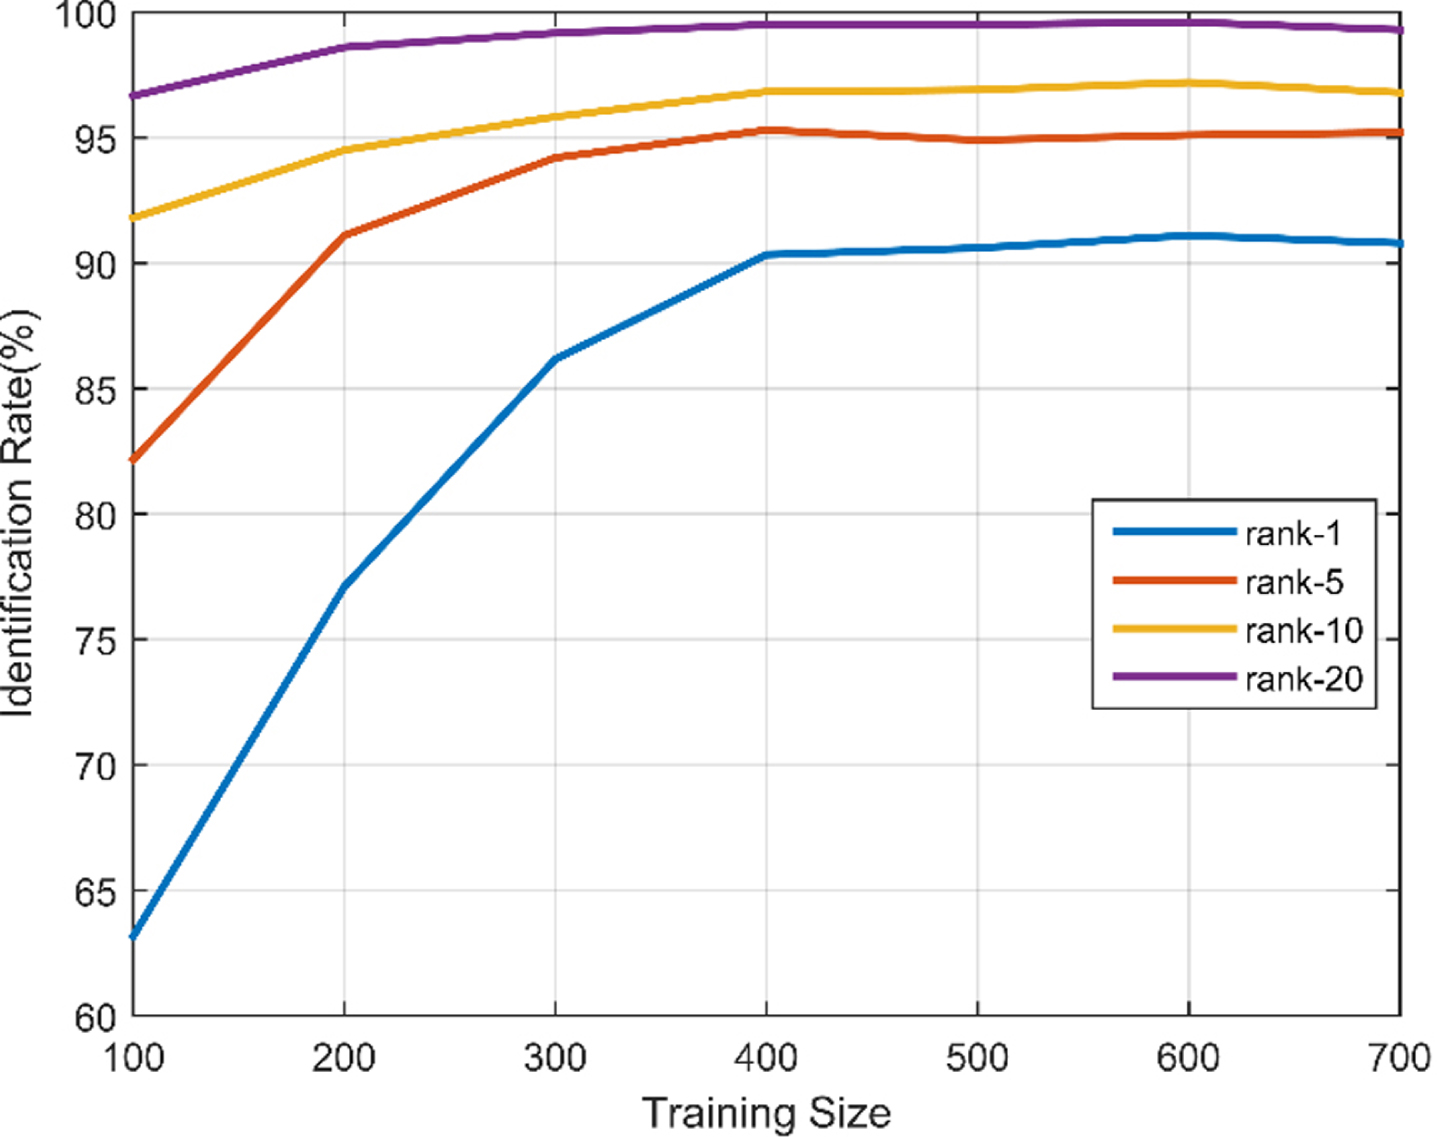
In order to further demonstrate the effectiveness of the proposed method, we test the proposed method over different training size on VIPeR dataset. The performance of the proposed method over different training size is displayed in Table 5. As shown in this table, the proposed method reaches superior performance on robustness of training size. When training size decreases, the identification accuracy of our method decreases slightly.
As we know, the deep learning based methods need big size of training data. It cost much time and human resources to label training samples for deep learning model training. While the proposed method need only a small size of samples to reach a good performance. Besides, the proposed method also provides a novel way for improvement of the metric learning based methods.
Comparison results on VIPeR under different training size
Comparison results on VIPeR under different training size
In this section, the time complexity of our method is analysed. According to the method introduced in section 2 and section 3, the time complexity of our method is mainly related to the solution of the eigenvalue problem in formula (19). Therefore, the time complexity of our method is
Pros and Cons
In this paper, we design a novel method of similarity measurement for person re-identification. The pros and cons are summarized as follows:
Our method proposed a simple approach to improve existing metric learning based methods. It improves existing methods by resampling similar samples from the nearest neighbors and retraining the metric model. Our method provides a generalized approach which could be promote to methods. Besides, our method solves person re-identification problem from a novel angle that the similar negative samples should be closer to the test individual than the dissimilar negative samples.
However, the shortcoming of the proposed method is that it needs to re-training the metric model for test data. While, most metric learning based methods only train the models on training data. The test data is measured by the model with parameters trained on training data.
Conclusion
Person re-identification is a key and difficult points in the field of computer vision research. Due to the complexity of the application scenario and the drastic changes in image features, the current person re-identification algorithms are still far from practical applications. In response to the above problems, this paper proposes a sampling method based on the normality of sample characteristics. According to the normal characteristics of paired samples from multiple perspectives of pedestrians, a linear discriminant analysis (LDA) algorithm is established. And a new generalized algorithm of pedestrian re-identification is proposed by weighting the results of generalized model and LDA model. The effectiveness, accuracy, and robustness of this algorithm are proved by the comparison with algorithms such as ITML, LMNN, RDC, MVSLDDL, KISSME, XQDA, and MLAPG. Especially in the recognition accuracy of rank-1, compared with the baseline method, LDA, the proposed algorithm improved by 9.36% and 32.11% in the VIPeR and CUHK01 datasets respectively. It also reaches the second identification accuracy on Market-1501 dataset. It is worth noting that, the proposed method is limited to the accuracy of k-nearest neighbours. The proposed method provides a new thought for similarity measurement.
Footnotes
Acknowledgment
The project supported by Scientific Research Project of Hubei Province Department of Education (Q20201601), This work was finished at Wuhan Polytechnic University, Wuhan.
Data Availablity Statement
Research data are not shared.