
Abstract
Convolutional neural networks (CNNs) have made significant progress in the field of cloud detection in remote sensing images thanks to their powerful feature representation capabilities. Existing methods typically aggregate low-level features containing details and high-level features containing semantics to make full use of both features to accurately detect cloud regions. However, CNNs are still limited in their ability to reason about the relationships between features, while not being able to model context well. To overcome this problem, this paper designs a novel feature interaction graph convolutional network model that extends the feature fusion process of convolutional neural networks from Euclidean space to non-Euclidean space. The algorithm consists of three main components: remote sensing image feature extraction, feature interaction graph reasoning, and high-resolution feature recovery. The algorithm constructs a feature interaction graph reasoning (FIGR) module to fully interact with low-level and high-level features and then uses a residual graph convolutional network to infer feature higher-order relationships. The network model effectively alleviates the problem of a semantic divide in the feature fusion process, allowing the aggregated features to fuse valuable details and semantic information. The algorithm is designed to better detect clouds with complex cloud layers in remote sensing images with complex cloud shape, size, thickness, and cloud-snow coexistence. Validated on publicly available 38-Cloud and SPARCS datasets and the paper’s own Landsat-8 cloud detection dataset with higher spatial resolution, the proposed method achieves competitive performance under different evaluation metrics. Code is available at https://github.com/HaiLei-Fly/CloudGraph.
Keywords
Introduction
Optical remote sensing imagery plays an important role in weather forecasting, environmental monitoring, agriculture, and the military [1]. However, about 66% of the Earth’s surface is covered by clouds [2], thus affecting post-processing such as classification and segmentation of remote sensing images, which may mislead the analysis of remote sensing images. Therefore, accurate identification of cloud regions is of great importance for the application of optical remote sensing images.
Over the years, researchers have proposed a large number of cloud detection methods for remote sensing images, which can be broadly classified into two categories: threshold-based methods and statistical-based methods. The best known threshold-based cloud detection algorithms are function of mask (FMask) [3] and automated cloud-cover assessment (ACCA) [4], which require constant optimization of the choice of thresholds. Statistical-based methods use statistical learning algorithms to classify pixels based on manual features designed for image texture, color, and geometry [5]. Due to the diversity of remotely sensed image environments, these methods have limited practical application scenarios. Remote sensing image preview images contain R, G, and B bands for fast cloud detection, and researchers have already used remote sensing preview images for cloud detection tasks, and methods such as CDNet [6] and CDNetV2 [7] have achieved good results. To further improve cloud detection accuracy, this paper will design more powerful feature descriptions and detection networks.
With the development of deep learning-based image segmentation algorithms, convolutional neural networks (CNNs) have made significant progress in cloud detection with their powerful representation learning capabilities. Most existing cloud detection models use symmetric or asymmetric coding and decoding network structures, and methods such as Cloud-Net [8] and Cloud-Net+ [9] have achieved good detection results using convolutional neural networks. Due to the complexity of cloud shape size and sparsity and background, the remote sensing image features extracted by convolutional networks need to be fully utilized to improve cloud detection accuracy. Hou et al. [10] experimentally demonstrated that low-level features extracted by convolutional neural networks contain more spatial detail information, such as texture, boundaries, and spatial structure; high-level features contain rich semantic information. Pu et al. [11] proposed a high-precision cloud detection network, which uses a DenseNet network as the feature extraction backbone, combined with a global self-attentive module and a spatial pyramid pooling module to extract deep semantic features. Peng et al. [12] first explored the relationship between receptive field size and cloud detection network performance by introducing theoretical receptive field (TRF) and effective receptive field (ERF) to measure the receptive field size of different networks and performing cloud detection on Landsat8 OLI data. Simply fusing the two features using CNN is not sufficient to learn the higher-order relationships between the features, while the fusion process introduces noisy features that affect the detection accuracy of cloud regions.
An emerging network architecture, graph convolutional neural networks (GCNs) [13], which can efficiently process graph-structured data by modeling the relationships between graph vertices, has recently revolutionized deep representation learning by incorporating graph computation into a deep learning framework and has benefited many computer vision tasks such as action recognition [14], text detection [15], image segmentation [16] and hyperspectral image classification [17]. The multi-level feature fusion process, which should be performed via non-Euclidean data forms, alleviates the semantic divide problem. Thus, GCNs can be naturally used for remote sensing image cloud detection tasks to accomplish feature fusion and context modeling work.
In this paper, we make the first attempt to build a model based on GCNs, i.e. feature interaction graph convolutional networks, for remote sensing image cloud detection. In this paper, we first extract multi-scale image features using a CNNs-based encoder and generate a feature node graph based on feature region similarity. The proposed feature interaction graph reasoning (FIGR) module is then used to fully interact with the low-level and high-level feature node graphs to reason about feature higher-order relationships. FIGR has a well-designed interaction architecture that enhances the interaction and fusion between features. Unlike existing CNNs-based approaches that simply fuse low-level and high-level features from the encoder, FIGR accurately fuses low-level and high-level features by reasoning about the detailed and semantic features between complementary relationships, precisely representing the valuable information from both sets of features in a collaborative enhancement. Finally, the high-resolution feature recovery (HRFR) component further fuses the augmented low-level and high-level features to output the cloud regions predicted by the network. In this paper, the effectiveness of Cloud-Graph is demonstrated through extensive experiments on the self-built CHLandast-8, open-source 38-Cloud and SPARCS datasets, using different evaluation metrics to assess the proposed algorithm and comparison algorithms. Furthermore, the proposed algorithms are efficient, running at approximately 50 FPS on a single NVIDIA RTX 3060 GPU. More specifically, the main contributions of this paper can be summarized as follows: A new graph-based cloud detection method for remote sensing images is proposed, which, the first time, attempts to use graph based technology for cloud detection with the using of residual graph convolution to infer higher-order relationships between low-level and high-level features, to better model contextual features, and to accurately detect cloud regions. A well-designed feature interaction graph reasoning (FIGR) module is presented, which effectively alleviates the problem of semantic gaps in the feature fusion process, enabling aggregated features to fuse valuable details and semantic information while filtering out noisy features. A new high-resolution dataset for remote sensing imagery cloud detection is established, which includes 64 full scenes collected by Landsat-8 satellites from different regions of China from January to December 2021, as well as manually labeled cloud Masks. This open source dataset can help researchers to train and evaluate cloud detection algorithms and to promote research on cloud detection.
Related works
Remote sensing image cloud detection
Over the years, researchers have proposed many cloud detection methods for remote sensing images. Among them, the threshold method is a relatively mature cloud detection method. Zhu et al. [3] proposed Fmask, which uses a decision tree to label each pixel as cloud or non-cloud, and in each branch of the decision tree, a decision is given based on a threshold function. Irish et al. [4] designed the automated cloud-cover assessment (ACCA) algorithm, which also constructs a decision tree for cloud detection. The same decision tree is constructed for cloud detection. Although threshold-based cloud detection methods have achieved some success, most are not generalizable and require continuous optimization of the choice of thresholds.
In recent years, cloud detection methods based on convolutional neural networks (CNNs) have been gradually proposed. Inspired by semantic segmentation, cloud detection based on fully convolutional neural networks (FCNs) [18] has achieved remarkable results. Zeng et al. [19] used FCN-8 S directly for Landsat-8 satellite image cloud detection, but the segmentation was not accurate. Some recent work has mainly used encoder-decoder structures, such as UNet [20] and SEGNet [21], as architectures for cloud detection. Mohajerani et al. [8] used local and global features from the whole scene to design the end-to-end cloud detection network Cloud-Net. Yang et al. [6] proposed a cloud detection neural network CDNet with an encoder-decoder structure, a feature pyramid module, and a boundary refinement. To further investigate cloud detection in remote sensing images with cloud-snow coexistence, Guo et al. [7] proposed a new cloud detection neural network CDNetV2, designing adaptive feature fusion module and advanced semantic information guided flow module. Hu et al. [22] proposed a deep learning model CDUNet for cloud detection, refining the division boundary of cloud layers to obtain their spatial. He et al. [23] proposed a lightweight network (DABNet) to achieve high accuracy detection of complex clouds. Lu et al. [24] proposed a two-branch model consisting of Transformer and convolutional networks to extract semantic and spatial detail information of images respectively to solve the problem of false detection and missed detection. Zhang et al. [25] proposed a cloud detection framework combining CNN and Transformer to achieve high-precision cloud detection of optical remote sensing images. However, existing cloud detection methods based on convolutional neural networks still suffer from the problem of semantic gaps in the feature fusion process and do not perform contextual modeling well, leading to false and missed detection problems in predicting cloud regions.
Multi-level feature integration
Several works for dense prediction tasks demonstrate that features from multiple layers facilitate the generation of better predictions [26]. Zhao et al. [27] proposed a pyramidal feature attention network to enhance high-level semantic features and low-level spatial structure features. Zhang et al. [28] proposed a feature aggregation framework that integrates multi-level CNN features at different resolutions. Pang et al. [29] proposed an ensemble interaction module to integrate features from adjacent layers. Ma et al. [30] proposed a pyramidal feature shrinkage network, which aggregates neighboring feature nodes in pairs by shrinking layer by layer. The same researchers use multi-layer feature fusion strategies for remote sensing image cloud detection tasks. Wang et al. [31] proposed a cloud detection network ABNet, in which a full-scale feature fusion model can optimize features and recover spatial information by integrating features at each scale, and a boundary point prediction module further corrects cloud boundary information by classifying cloud boundary points. Guo et al. [32] proposed a lightweight cloud detection framework based on deep learning is designed with a multi-feature fusion strategy that extracts learnable artificial and convolutional features from visible and near-infrared bands, uses a lightweight fully convolutional neural network ClouDet with an expansive convolutional module to extract multi-scale contextual information, and progressively recovers segmentation results of the same size as the input image. Zhao et al. [33] designed a new cloud detection network, DMNet, which contains a dense feature enhancement module (DFEM) and a multi-scale context fusion spatial attention module (MCFSAM) for cloud detection of GF-1 WFV data. The above different CNN-based multi-level feature fusion strategies aim to alleviate the problem of a semantic divide between feature levels and to better aggregate features. However, due to the inherent shortcomings of CNN, multi-level feature fusion is still problematic, leading to the introduction of a large number of redundant features into the fusion process, while failing to fully fuse valuable features.
Graph convolutional networks
Graph Neural Networks (GNNs) are models that capture graph dependencies by passing messages between the nodes of a graph, and unlike standard neural networks, GNNs can represent information from their neighborhoods at arbitrary depths [34]. Graph Convolutional Neural Networks (GCNs) are variants of GNNs that aim to extend convolution to the graph domain. In recent years, various graph convolutional neural network-based models have been proposed for different applications. Some typical applications in computer vision include 3D pose estimation [35], zero-shot learning [36], point cloud classification and segmentation [37], etc. Luo et al. [38] introduce cascaded graph models to exploit multi-scale, cross-modal information for salient target detection. Zhang et al. [39] propose a new adaptive graph convolutional network with attention graph clustering for collaborative salient target detection. Hong et al. [40] develop a new miniGCNs for hyperspectral image classification. Zhao et al. [41] proposed graph feature pyramid networks to enhance multi-scale features from convolutional feature pyramid networks for target detection. Zhai et al. [42] designed a new mutual graph learning model to extend the traditional mutual graph learning idea to the graph domain to accomplish the task of camouflaged target detection. Wu et al. [43] introduced a bidirectional graph inference network to embed the graph structure into the traditional panoramic segmentation network to mine the intra- and inter-modal relationships between foreground and background classes. For remote sensing image cloud detection, this paper designs a graph-based feature interaction graph inference module to fully infer low-level and high-level features, which can better learn image feature representation to overcome the multiple challenges of CNN-based methods.
Method
At the heart of Cloud-Graph is the use of the feature interaction graph reasoning (FIGR) module to reason about the relationships between low-level and high-level features in order to fully fuse detailed and semantic features. In this section, an overview of the feature interaction graph convolutional network architecture proposed in this paper is given first. Then, the construction process of the FIGR module is described in detail. Finally, the implementation details of the model are presented.
Problem formulation
The remote sensing image cloud detection task is to predict a cloud region image
Network overview
The Cloud-Graph network architecture is shown in Fig. 1 and consists of three main components: image feature extraction (IFE), feature interaction graph reasoning (FIGR), and high-resolution feature recovery (HRFR).

The overall architecture of the Cloud-Graph network. The network consists of three main components: image feature extraction, feature interaction graph reasoning, and feature recovery.
IFE: This paper uses the ResNet-50 backbone network to extract image multi-scale features. Given an input image
FIGR: This paper begins by mapping F
L
and F
H
to non-Euclidean spaces via the graph projection operation fGproj (·), generating a low-level feature map

Graph node composition. Node generation principle: similar feature areas converge into graph nodes.
HRFR: This paper uses element summation and feature cascade operations to fuse
This section details image feature extraction (IFE), feature interaction graph reasoning (FIGR) and high-resolution feature recovery (HRFR).
Image feature extraction (IFE). fIFE (·) takes the RGB preview image of a remotely sensed image as input and generates a mapping of image low-level features and high-level features, i.e. F
L
and F
H
. Specifically, given the input image
Feature interaction graph reasoning (FIGR). FIGR aims to fully interact low-level features with high-level features to reason about the higher-order relationships between the two sets of features and to alleviate the semantic gap problem in the feature fusion process. It consists of four operations: (1) graph projection fGproj (·) (2) feature interaction fFI (·) (3) graph inference fGR (·) (4) graph reprojection fRproj (·).
(1) Graph projection fGproj (·). In this paper, some pixels with similar features are clustered to the same node, i.e. similar feature node aggregation, as shown in Fig. 2. Following [44], fGproj (·) is parameterized by
Further calculating the graph node features
(2) Feature interaction fFI (·). fFI (·) models the interaction between low-level feature graphs and high-level feature graphs, guiding inter-graph messaging from

Feature interaction model. High-level feature graphs pass messages to low-level feature graphs.
Low-level feature graphs passing messages to high-level feature graphs, as shown in Fig. 4. Transform
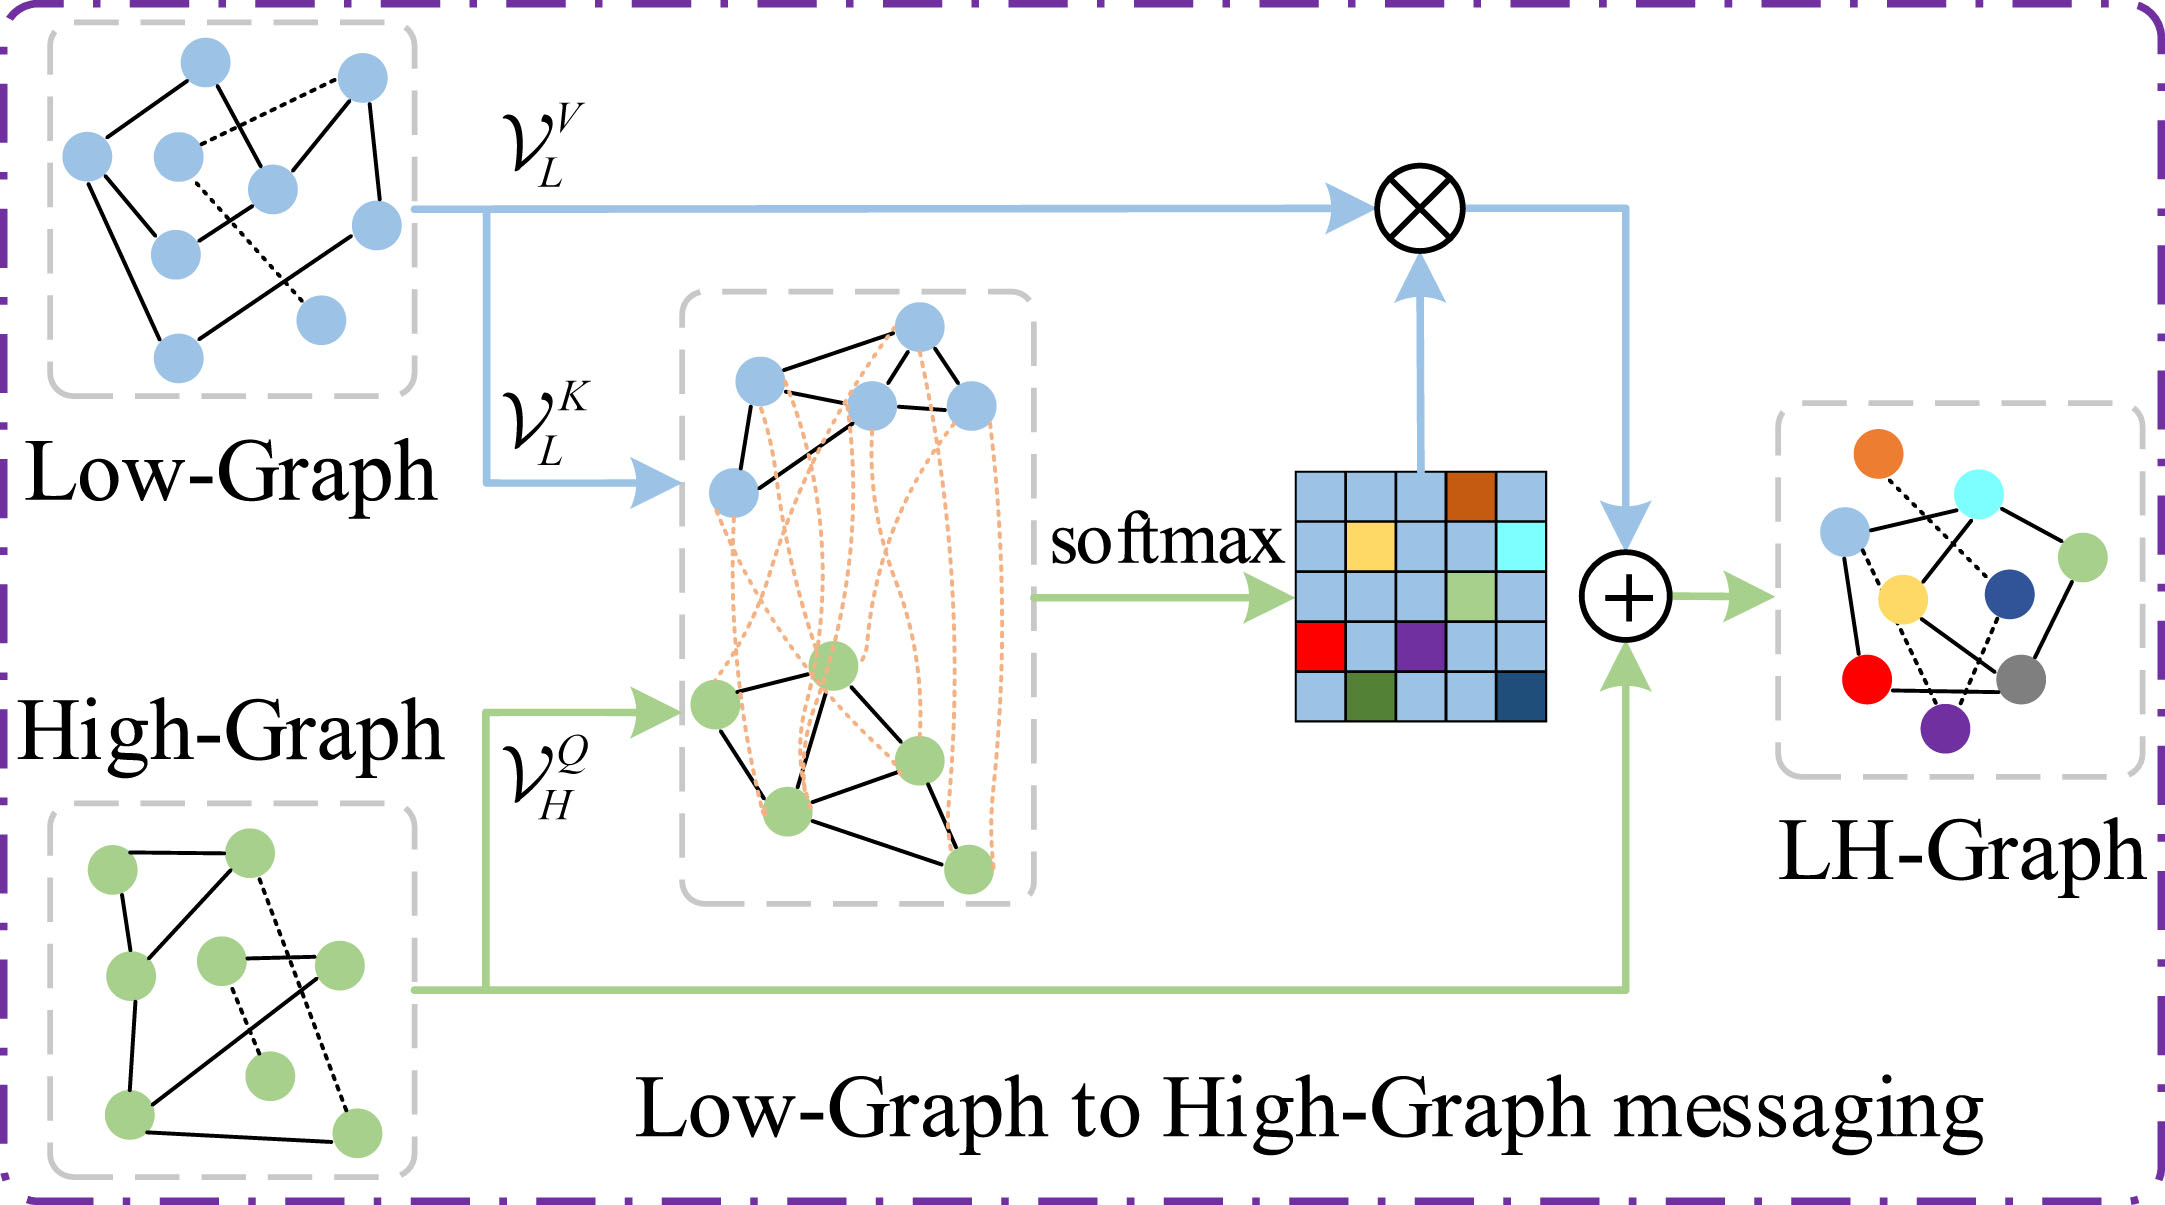
Feature interaction model. Low-level feature graphs pass messages to high-level feature graphs.
After that, the paper completes the transfer of semantic information from
(3) Graph reasoning fGR (·). After the feature interaction is completed, the intra-graph inference is performed on
(4) Graph reprojection fRproj (·). The enhanced feature graphs
High-resolution feature recovery (HRFR). fHRFR (·) inputs feature fused by feature cascading and element addition and output the cloud regions predicted by the network, calculated as follows:
In this paper, ResNet-50 [48], which was pre-trained on ImageNet [47], was used as the backbone, and the input image size was 352 × 352 × 3. Both the low-level feature and high-level feature sizes of the IFE module output were 60 × 60 × 512, and then graph node construction was performed. Due to the limitation of computational resources, the number of both low-level feature graph nodes and high-level feature graph nodes is set to 8 in this paper.
The training loss in this paper is defined as the sum of all supervised losses.
The BCE loss [49], shown in Equation (15), is the most widely used loss in binary classification and segmentation.
Experimental setup
The proposed network is based on a PyTorch implementation. For network training, the weights of the backbone network are initialized by the pre-trained ResNet-50, and the remaining convolutional layers and modules are initialized randomly. To optimize the network, the optimizer uses Adam with an initial learning rate of 5e-5 and a weight decay rate of 0.0005, with the learning rate decaying by a factor of 10 for every 10 epochs of training. The network training epoch is set to 40 and the batch size is set to 8. The models are trained on an NVIDIA Tesla V100 GPU to ensure higher accuracy. During testing, all models are executed on an NVIDIA RTX 3060 GPU with 12 G of RAM.
Dataset
To evaluate the performance of the proposed network, experiments are conducted on three typical optical remote sensing image cloud detection datasets. These are the open-sourced 38-Cloud dataset, the SPARCS dataset, and the cloud detection dataset (CHLandsat-8) collected and self-built from Landsat-8 satellite data. The CHLandsat-8 dataset is more challenging as it has a higher spatial resolution and more representative land cover types.
The 38-Cloud dataset [8] consists of 38 Landsat-8 scenes, 18 scenes in the training set, and 20 scenes in the test set. 38 scene images were cropped to 384 × 384, 8400 images in the training set and 9201 images in the test set.
The SPARCS dataset [50] consists of a patch of 1000 × 1000 × 3 extracted from 80 complete Landsat-8 scenes and is commonly used for training and testing remote sensing image cloud detection algorithms.
The CHLandsat-8 dataset includes 64 full scenes collected by Landsat-8 satellites from different regions of China from January 2021 to December 2021 with high-resolution remote sensing images. CHLandsat-8 is probably the first remote sensing image cloud detection dataset collected from Landsat-8 satellites in China. Moreover, the scenes in CHLandsat-8 are more complex and diverse than previous datasets, making it more challenging to achieve high accuracy cloud detection. The dataset covers the Northwest, North, Qinghai-Tibet, and South regions of China and contains a variety of land cover types including urban, snow and ice, grassland, mountain, forest, ocean, and desert. The dataset is a preview map of remotely sensed images with dimensions of 8000×8000×3 approximately. In addition, the reference cloud Mask for the dataset has been annotated and is available online. Surely the open-sourced CHLandsat-8 dataset helps to promote the research on cloud detection (https://github.com/HaiLei-Fly/CHLandsat8/).
In the process of building the dataset, the experts manually mark the position of the cloud in the image pixel by pixel. Meanwhile, the reference Mask is created by marking the pixel values of the cloud and the background with 1 and 0 respectively. The reference Mask has been iteratively checked and corrected to ensure the accuracy of the labels. In this work, 44 images are randomly selected from the dataset as the training set named CHLandsat-8-TR and the rest of 20 images are used as the test set named CHLandsat-8-TE.
Due to the limited memory of the GPU, the 3 datasets with different scene images are cropped to the size of 352 × 352 × 3. The details of the dataset are shown in Table 1.
Dataset details
Dataset details
The proposed algorithm is evaluated through some widely used comprehensive metrics, including (1) maximum F-measure (MaxFm), (2) mean absolute error (MAE), (3) weighted F-measure (WFm), (4) average F-measure (AvgFm), (5) S-measure (Sm), and (6) E-measure (Em).
F-measure (F
β) is an overall performance metric that combines precision and recall [51]:
MAE is used as a complement to F-measure to calculate, pixel by pixel, the mean absolute error between the predicted cloud area and the cloud Mask [53]:
The F-measure is further extended by the weighted F-measure [54], which extends the four fundamental quantities TP, TN, FP, and FN to real values and assigns different weights to different errors at different locations, taking into account neighborhood information ω:
S-measure is more sensitive to foreground structural information than F-measure [55], which takes into account both region-perceived structural similarity S
r
and object-perceived structural similarity S
o
.
E-measure considers both the global mean and local pixel matching of an image and is defined as [56]:
The experimental results are compared quantitatively and qualitatively with the existing SOTA methods, including FCN8 S [18], UNet [20], PSPNet [57], SEGNet [21], GFRNet [58], CDNet [6], CDNetV2 [7], Cloud-Net [8], ClouDet [32]. For a fair comparison, all experimental results are obtained in the same experimental environment using the open-sourced code of the authors using the CHLandsat-8-TR dataset for training and 3 test datasets for testing.
1) Quantitative experiments
To evaluate the quality of the segmented cloud regions, quantitative comparison experiments are performed. Table 2 shows the results trained on the CHLandsat-8-TR dataset and evaluated on the CHLandsat-8-TE dataset. The comparison results indicate that the Cloud-Graph captures more valuable features from the input images and generates cloud regions closer to the manually extracted Mask. The evaluation metrics in the table include MaxFm, MAE, WFm, AvgFm, Sm, and Em. The best performance of each metric is ranked in order of red, blue, and green. Quantitative comparison experiments can be seen that the designed algorithm Cloud-Graph achieves the best performance on all evaluation metrics and the algorithm Cloud Detection outperforms the comparison algorithms, proving the effectiveness of feature interaction graph reasoning (FIGR) and demonstrating that the designed algorithm Cloud-Graph is effective in alleviating the semantic divide problem in the cross-level feature fusion process.
Comparison of quantitative results with SOTA methods on the CHlandsat-8-TE dataset
Comparison of quantitative results with SOTA methods on the CHlandsat-8-TE dataset
Table 3 shows the results trained on the CHLandsat-8-TR dataset and evaluated on the 38-Cloud-Test dataset with the same evaluation metrics in Table 2. The best performance of each metric is ranked in order of red, blue, and green. Cloud-Graph did not achieve the best performance in the MaxFm and AvgFm metrics, with MaxFm slightly worse than ClouDet by 0.021 and AvgFm slightly worse than ClouDet by 0.012, but substantially outperformed the comparison algorithm in the other four evaluated metrics.
Comparison of quantitative results with SOTA methods on the 38-Cloud-Test dataset
The results of the Cloud-Graph and comparison algorithms trained on the CHLandsat-8-TR dataset and evaluated on the SPARCS dataset are shown in Table 4. The best performance of each metric is ranked in order of red, blue, and green. Cloud-Graph is identical to ClouDet in terms of MAE evaluation metrics, and substantially outperforms the comparison algorithm in all five other evaluation metrics.
Comparison of quantitative results with SOTA methods on the SPARCS dataset
2) Qualitative experiments
This paper shows the qualitative comparison results between Cloud-Graph and the comparative algorithms FCN8 S, UNet, PSPNet, SEGNet, GFRNet, CDNet, and CDNetV2 in order to verify the good performance of the proposed methods in a more visual comparison. The qualitative results show that Cloud-Graph is able to handle different types of cloud regions and generate accurate cloud detection results.
In order to demonstrate that Cloud-Graph can handle remote sensing images of different scenes, this paper selects grassland scene, desert scene, plateau scene, forest scene, and snow scene in the CHLandsat-8-TE dataset. The cloud detection results of Cloud-Graph and the comparison algorithm are shown in Fig. 5. The CNN-based method has serious problems of missing and false detection when facing remote sensing images of different scenes, and the method in this paper alleviates this problem to a certain extent.
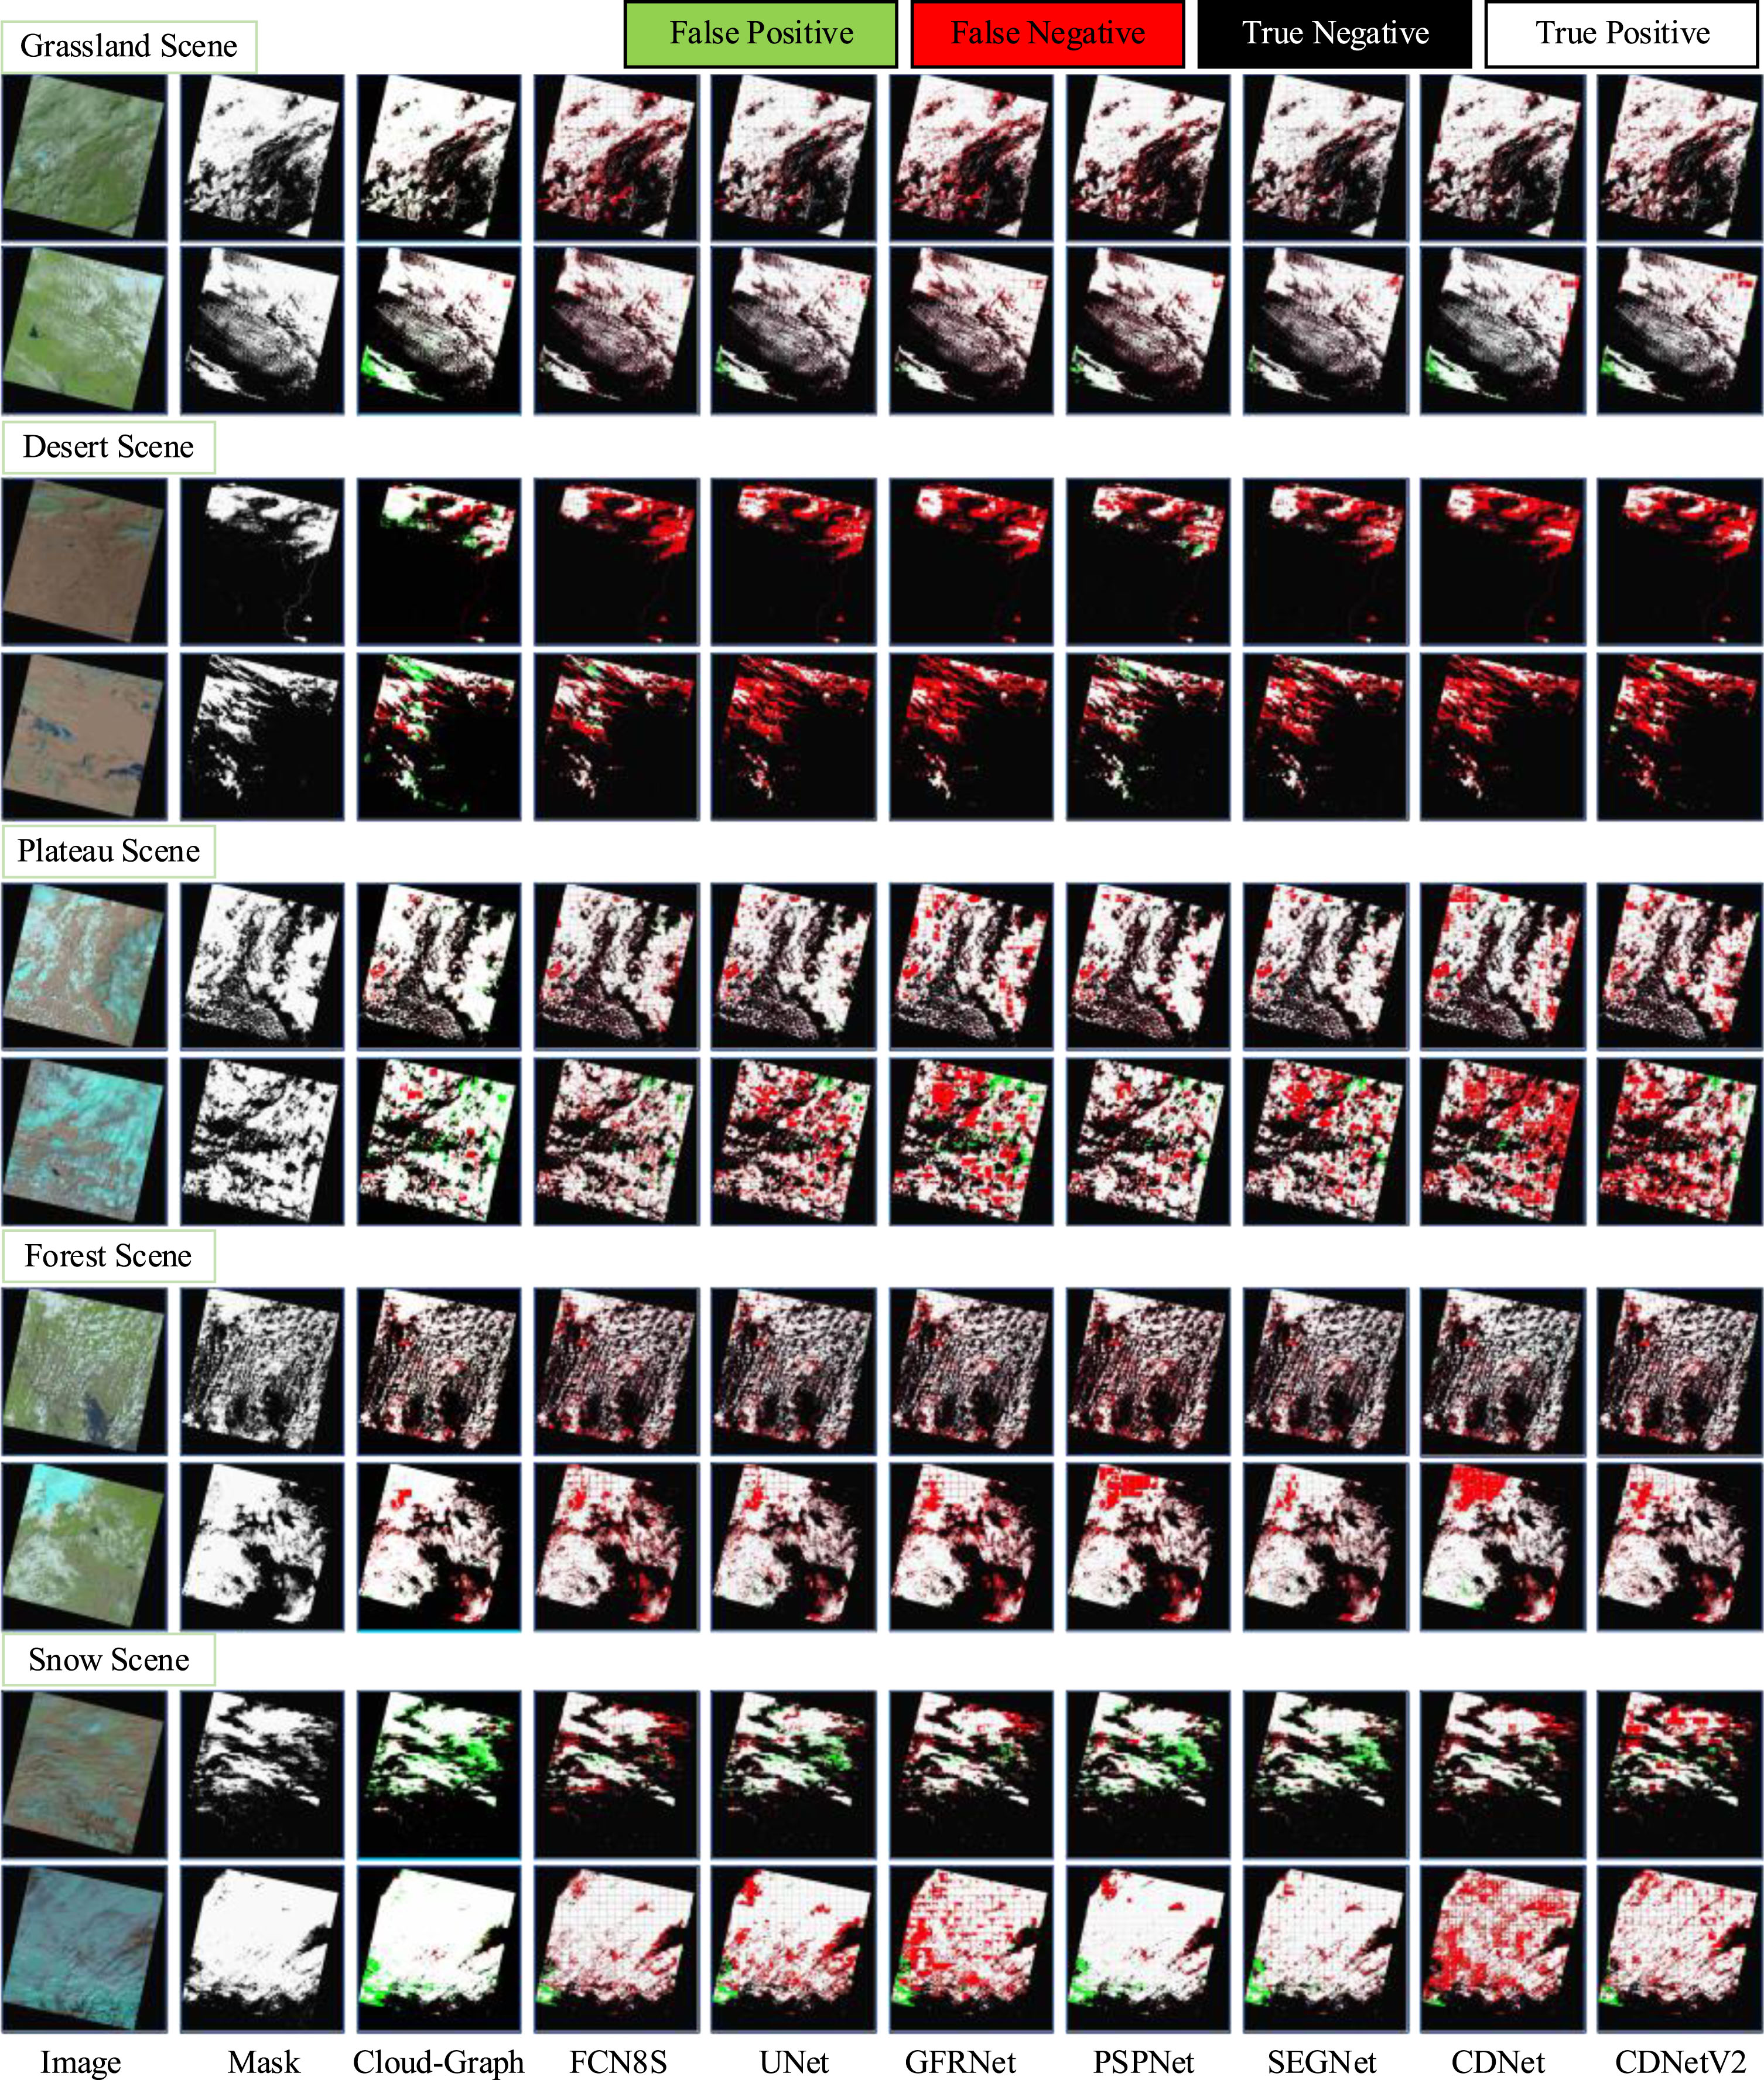
Comparison of visual results in CHLandsat-8-TE dataset with SOTA methods. Images from different scenes of the CHLandsat-8-TE dataset: Grassland Scene, Desert Scene, Plateau Scene, Forest Scene, and Snow Scene.
In order to further verify the cloud detection capability of the proposed method, the 38-Cloud-Test dataset was selected from simple scene, cloudy scene, partly cloudy scene, thin-cloud scene, ice and snow scene, and ocean scene. The cloud detection results in Fig. 6 show that the proposed method can detect cloudy regions, especially ice and snow scene, in the remote sensing images of different scenes. The method in this paper effectively alleviates this problem.

Comparison of visual results in 38-Cloud-Test dataset with SOTA methods. Images from different scenes of the 38-Cloud-Test dataset: Simple Scene, Cloudy Scene, Partly Cloudy Scene, Thin-Cloud Scene, Ice and Snow Scene, and Ocean Scene.
In this paper, the thin-cloud scene, simple scene, complex scene, snow scene, cloudy scene, cloud shadows scene, confusing background, and partly cloudy scene. The cloud detection results for Cloud-Graph and the comparison algorithm are shown in Fig. 7.
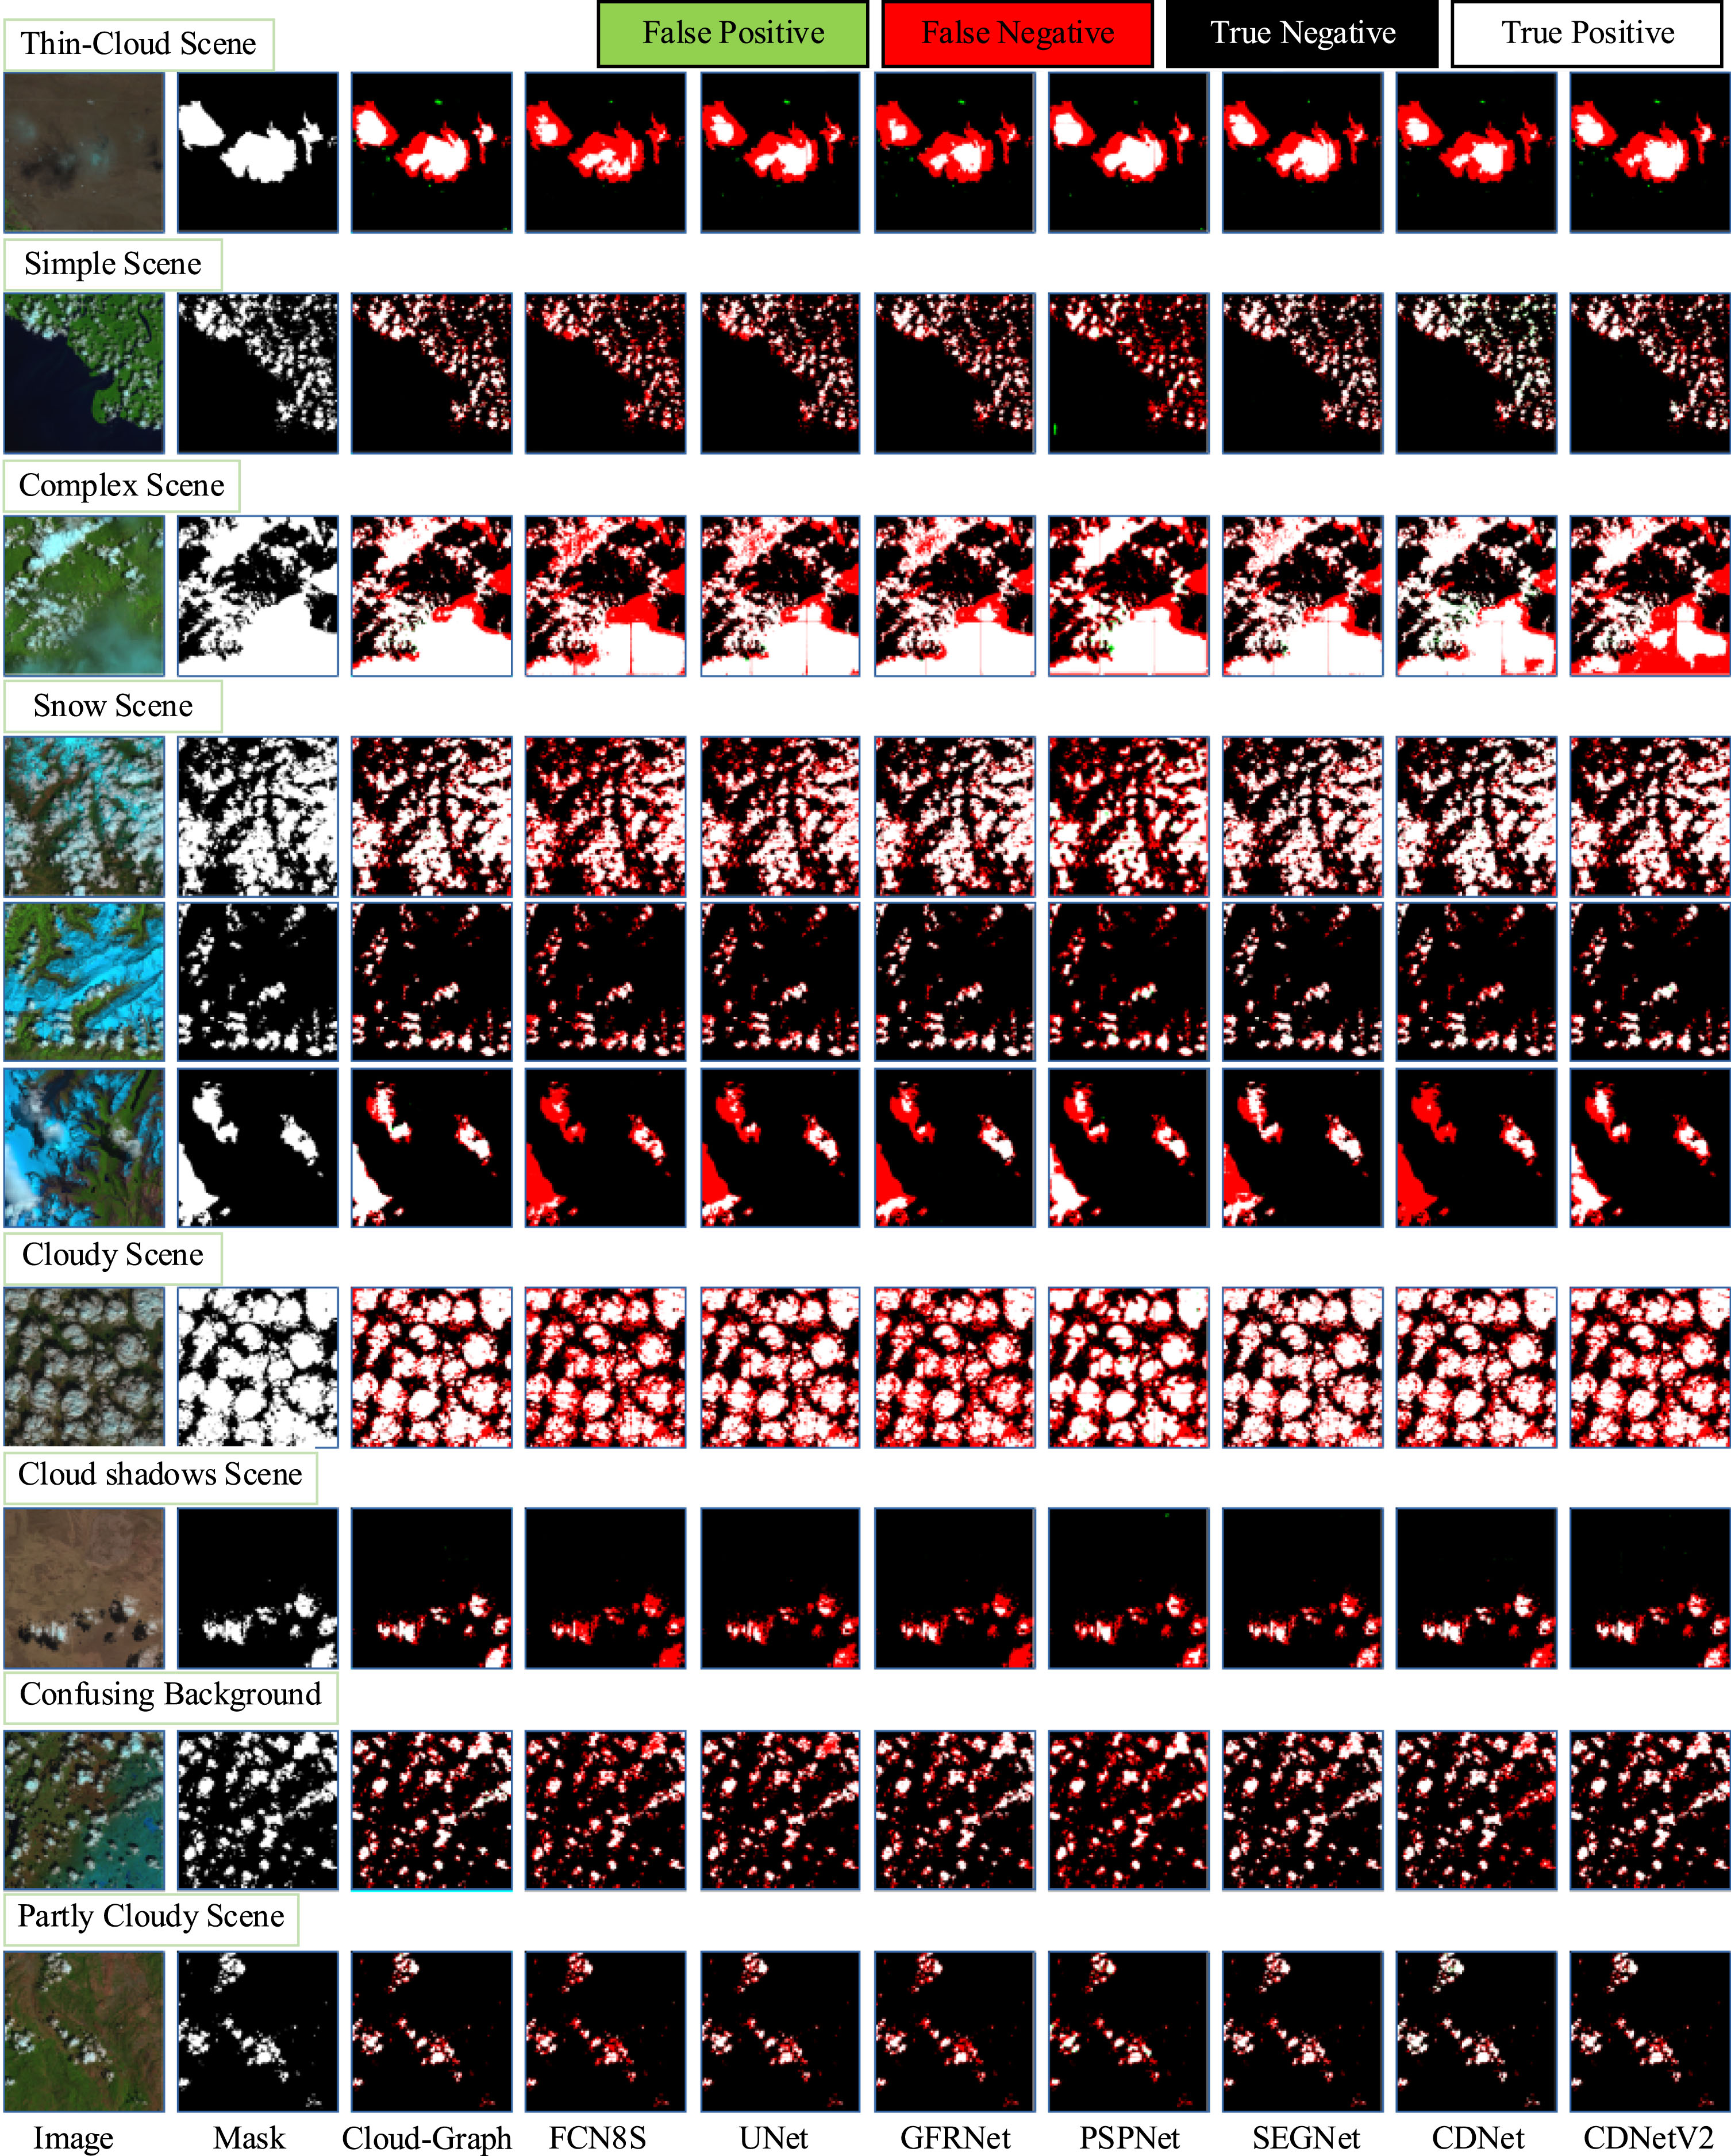
Comparison of visual results in SPARCS dataset with SOTA methods. Images from the different scenes of the SPARCS dataset: Thin-Cloud Scene, Simple Scene, Complex Scene, Snow Scene, Cloudy Scene, Cloud shadows Scene, Confusing Background, and Partly Scene.
Cloud-Graph’s cloud detection results on the three datasets compare favorably with the comparison algorithm, as the cloud detection results outperform the comparison algorithm. The aim of this chapter is to fully cross-fertilize low-level and high-level features. The low-level features of remote sensing images contain rich cloud detail features, while the snow and ice background noise will be retained, and the high-level features of images are rich in semantic information, which can roughly locate cloud regions. Both features are fully aggregated through the FIGR module, a large amount of snow and ice background noise will not be learned by the network, and the features will then be recovered in high resolution, and the predicted cloud regions will be more accurate, and false positive and false negative results will be reduced.
Thin and cirrus cloud remote sensing images are also difficult to detect because of the high transparency of these two types of clouds. Desert scene and forest scene images contain abundant thin and cirrus clouds, and the algorithm is susceptible to interference from their land cover type when performing cloud detection, ultimately identifying clouds as non-clouds. Cloud-Graph cloud detection performance is relatively excellent, and the reason for this is still the role of the FIGR module, where low-level feature nodes interact fully with high-level feature nodes, and inference is made through the GCN, and coarse cloud regions are effectively fused with fine cloud features, and the algorithm is ultimately able to identify more accurate clouds.
As the innovative design of this paper is the feature interaction graph reasoning (FIGR) module, the network structure ablation experiments were only done to train the network with or without the addition of the FIGR module and to evaluate the metrics for comparison. The designed algorithm, Cloud-Graph, uses ResNet-50 as the backbone network and evaluates the network performance using MaxFm, MAE, and Sm metrics, with all other configurations of the algorithm remaining the same, and the comparison results on the 3 test datasets are shown in Table 5. The results in the table demonstrate the effectiveness of the designed FIGR module.
Results of the proposed network structure ablation experiment
Results of the proposed network structure ablation experiment
To verify the robustness of the designed Cloud-Graph algorithm, we trained using a weighted cross-entropy loss-supervised network. The experimental procedure varies the balance parameters α and β for positive and negative samples, while the MAE and MaxFm evaluation metrics are used for quantitative comparison, and the experimental results are shown in Table 6.
Experimental results on the robustness of the proposed network
Experimental results on the robustness of the proposed network
As can be seen from the data in the table, the changes in the balance parameters α and β have an impact on the final cloud detection effect of the network, but the overall fluctuations in the evaluation metrics are small, so the Cloud-Graph algorithm is robust.
To explain the effectiveness of the designed network more intuitively, this paper completes the explanatory experiments through feature visualization. As shown in Fig. 8, F
L
denotes the visualization of low-level features containing detailed information, F
H
denotes the visualization of high-level features containing semantic information, and
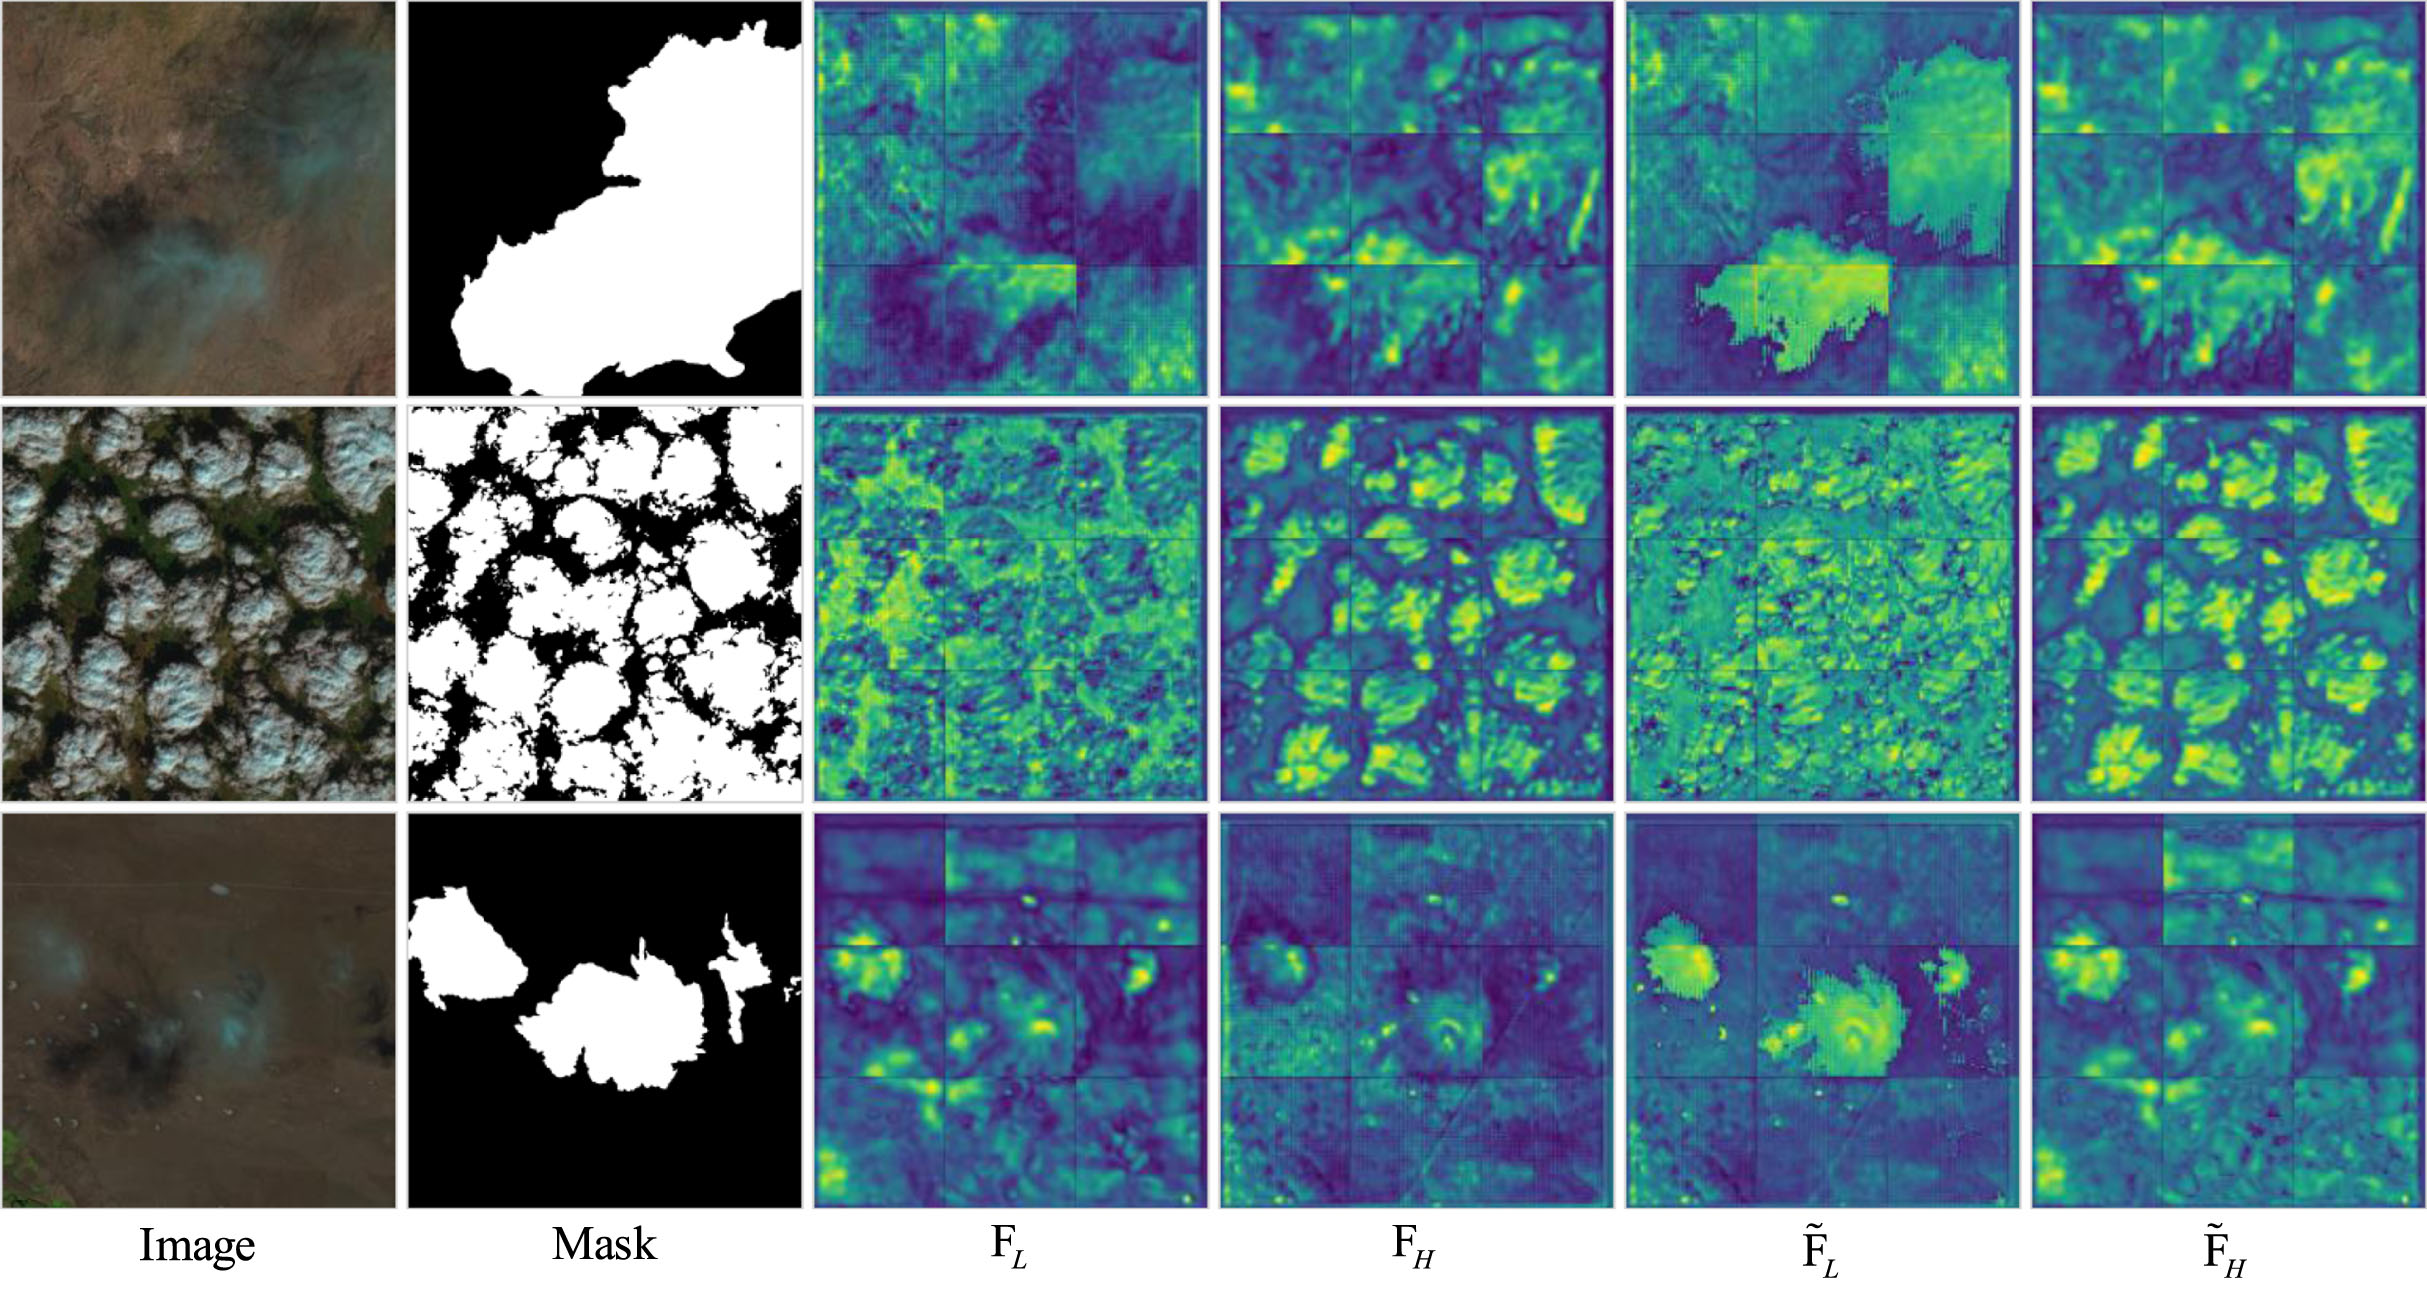
Feature visualization results. Comparison of feature maps of low-level and high-level features with and without feature interaction graph reasoning (FIGR) module.
Comparing the F
L
and
In this paper, a novel feature interaction graph convolutional network for remote sensing image cloud detection is proposed, in which the feature interaction graph inference module can mine valuable complementary information in low-level and high-level features and alleviate the semantic gap problem in the feature fusion process. Extensive experiments have shown that the model in this paper helps overcome the inherent shortcomings of CNNs in cloud detection tasks and can better detect cloud regions. We believe that the feature interaction graph reasoning (FIGR) module designed in this paper can be beneficial for other related computer vision tasks, such as image segmentation. In future work, we will further improve the inference speed of the designed algorithm Cloud-Graph, while deploying the algorithm to the smart hardware side for on-the-ground applications.