
Abstract
In traditional user portrait construction methods, static word vectors can extract only shallow semantic representations, which cannot manage word polysemy. Moreover, the common clustering algorithm K-means has the problems of initial K values and unstable initial centroid selection. A Bert-CK model based on Bert and CK-means+ is proposed. First, Bert is used to extract semantic and syntactic text features at various levels, and word vectors and sentence vectors are obtained according to the context. Then, the CK-means+ algorithm is improved based on canopy and mean calculation. Next, the K value and initial centroid are determined. The sentence vectors are input to CK-means+ to obtain user classification and topic features. Finally, semantic features and topic features are fused and classified. CK-means+ is evaluated on the Sogou user portrait dataset. The experimental results verify that Bert-CK is better than the baseline model.
Introduction
User portrait technology is widely used in e-commerce [1], personalized recommendation [2, 3], demand forecasting [4] and other fields to realize the automatic matching of resources and differentiated needs of users. Therefore, the construction of accurate user portraits has aroused widespread concern in society. User profiling is the process of labelling users by acquiring their attributes through classification [5] or clustering algorithms [6]. Clustering algorithms gather similar users and extract textual topic features. The word vector model converts the user’s text data into vectors.
After analysing the mainstream methods for user portraits, we found that most scholars are still accustomed to using static word vector models such as Term Frequency and Inverse Document Frequency(TF-IDF), Word to Vector(Word2vec) [7] and Document to Vector (Doc2vec) when constructing user portraits. The models obtain only shallow representations and do not resolve the problem of multiple word meanings, resulting in limited user portrait classification accuracy. Clustering is an unsupervised algorithm that can partition most unlabelled data into various types based on the similarity between samples in user portraits. The K-means algorithm has become the most commonly used clustering algorithm for building user portraits because of its simple principle, easy implementation, and efficient operation [8]. However, the K-means algorithm suffers from the problems of unstable selection of cluster number K values and initial centroids. These problems lead to low user classification accuracy [9] and inaccurate topic label extraction [10, 11] when constructing user portraits. Deficiencies in both word vector techniques and clustering techniques have challenged the user portrait construction accuracy.
With the development of Natural Language Processing(NLP), pretrained models have emerged for major text processing tasks, classically represented by bidirectional encoder representations from transformers (Bert) [12]. Bert is first pretrained on a large text corpus and then applied to a variety of text processing tasks by fine-tuning. Semantic and syntactic text features are captured from different levels, and its pretraining task can address the problem of multiple word meanings. Therefore, combining the features of Bert’s model to build user portraits can help improve user portrait accuracy.
Therefore, to improve user portrait construction accuracy, a user portrait model based on Bert and CK-means+ is proposed for both the word vector level and the clustering level. The education, age and gender attributes of users are predicted from their search records on the Sogou user portrait dataset. The K-means is improved based on canopy and mean calculation, and the CK-means+ algorithm is proposed [13]. The canopy algorithm is first used to coarsely cluster the dataset and obtain the K value. Then, the initial centroids are obtained by canopy and mean calculation.
The main contributions of this article are as follows:
* The Bert algorithm is introduced to address the problem that static word vectors can extract only shallow representations and cannot resolve the problem of multiple meaning words.
* For the problem that the K value and initial centroid selection of the clustering algorithm K-means are unstable, the CK-means+ algorithm based on canopy and mean value calculation is proposed.
* To address the problem that the word vector lacks topic features, the CK-means+ clustering algorithm is introduced to add topic features and to cluster the users.
* We design and implement the construction of the Bert-CK user portrait model to achieve the prediction of basic user attributes by making full use of textual features and semantic features of data through data preprocessing, data enhancement and semantic vector fusion.
Related works
Clustering algorithms are widely used in the user portrait construction task [14] improved the K-means clustering algorithm to obtain the overall control category of power users, thereby evaluating the overall picture of user information and constructing a portrait of electricity users. [15] combined the strong complementarity of the K-means++ algorithm and the mini-batch K-means algorithm to improve the analysis and processing capabilities of the model. [16] used the Linear Discriminant Analysis(LDA) [17] algorithm to model the user’s interest points according to the number of Weibo users’ answers and messages. Scholars who use K-means to construct user portraits have improved certain efficiency but have not fundamentally improved the K-means algorithm. User text data processing is also very rough using only the TF-IDF algorithm for simple text processing. The user portrait results are not only low in accuracy but also very rough in granularity. Based on this, in this paper, we propose an improved CK-means+ algorithm and use the Bert neural network to extract multidimensional feature information from user data.
The word vector representation of a text is the basis of text classification tasks. The word embedding method first uses one-hot, TF-IDF and other models to discretely represent text. Later, static word embedding models based on shallow neural network structures such as word2vec and Global Vectors for Word Representation(GloVe) [18] trained continuous and dense word vector representations. Compared with that of the discrete representation methods, the dimensionality of word vectors is reduced, and the semantics of word vectors are enriched. The similarity between words can be captured. [19] and others have built user portraits based on the improved LDA and K-means algorithms to identify sensitive types of users in electricity payment. [20] and others obtained the data characteristics of user search records based on trigram, Doc2vec [21], Word2vec and Convolutional Neural Networks(CNN) models and analysed the user characteristics through eXtreme Gradient Boosting(XGBoost) [22] to construct user attribute portraits. The emergence of the static word embedding model has raised user portrait construction to a higher level, but its simple structure cannot resolve the problem that Chinese has different semantics in different contexts, nor can it learn the grammatical structure of Chinese. This makes user portrait construction under the Chinese dataset a bottleneck.
Subsequently, [12] proposed the Bert model in 2018, which uses a bidirectional multilayer transformer encoder structure for pretraining on a large text corpus. Fine-tuning the Bert model in downstream NLP tasks can realize the dynamic representation of word vectors in various contexts, thereby addressing the polysemy problem in Chinese words. [23] proposed a Bert-based user portrait algorithm to predict user attributes. [24, 25] constructed user portraits based on Bert and XGBoost. Several experimental results show that Bert has higher accuracy than static models such as word2vec and doc2vec. However, when studying the literature of other scholars, it was found that although scholars have used Bert to further improve the results, they have not considered user portrait construction overall and have not made targeted improvements. Scholars rely on Bert alone to extract the semantic features of the text, ignoring not only the overall theme meaning of the user text but also the clustering of similar users and the construction of group user portraits.
Based on the above research, we propose a Bert-CK user portrait model based on Bert and CK-means+. This method uses the Bert model to obtain the text semantic features and then uses the CK-means+ algorithm to cluster similar users to obtain topic features. Then, the topic features and semantic features are fused to obtain individual user portraits and group user portraits in parallel. Experimental results show that, compared with that of the baseline model, this model significantly improves the accuracy of user label prediction. This demonstrates the validity of the research in this paper and highlights the research and practical application value of this paper.
Bert-CK model
The Bert-CK user portrait model contains the following four layers, as shown in Fig. 1: (1) Word embedding layer: The text is preprocessed and input into the pretrained word vector model. Bert generates dynamic semantic vectors of the text to obtain word vectors and sentence vectors of the text. (2) Clustering layer: The sentence vectors are input to the CK-means+ algorithm, which clusters the sentence vectors, classifies users into different categories, and extracts the topic features of the text from them. (3) Semantic fusion layer: This layer fuses the semantic features and topic features, that is, splices the word vector and the topic vector. (4) Output layer: The spliced semantic vectors are fed into the fully concatenated layer and softmax classifier to predict the user’s education, age and gender labels.

Bert-CK user profile model
Bert is a pretraining plus fine-tuning dual paradigm. The first pretraining task is the determination of masked words (MaskedLanguage Model, MLM), which learns contextually relevant bidirectional feature expressions. The second pretraining task is NextSentence Prediction (NSP), which allows the model to understand the relational features between sentences. The second step is the fine-tuning phase, where parameters are set for specific tasks. MLM randomly selects a certain percentage of lexical elements as masked lexical elements for prediction, and the model learns the masked lexical elements through the global context. Although MLM can encode bidirectional context to represent words, it cannot explicitly express the logical relationship between text pairs. NSP can be regarded as a sentence-level binary classification problem that mines the logical relationship between sentences by determining whether the latter sentence is a reasonable next sentence of the former sentence. Therefore, the Bert model achieves word vector representation and semantics by combining MLM and NSP feature extraction.
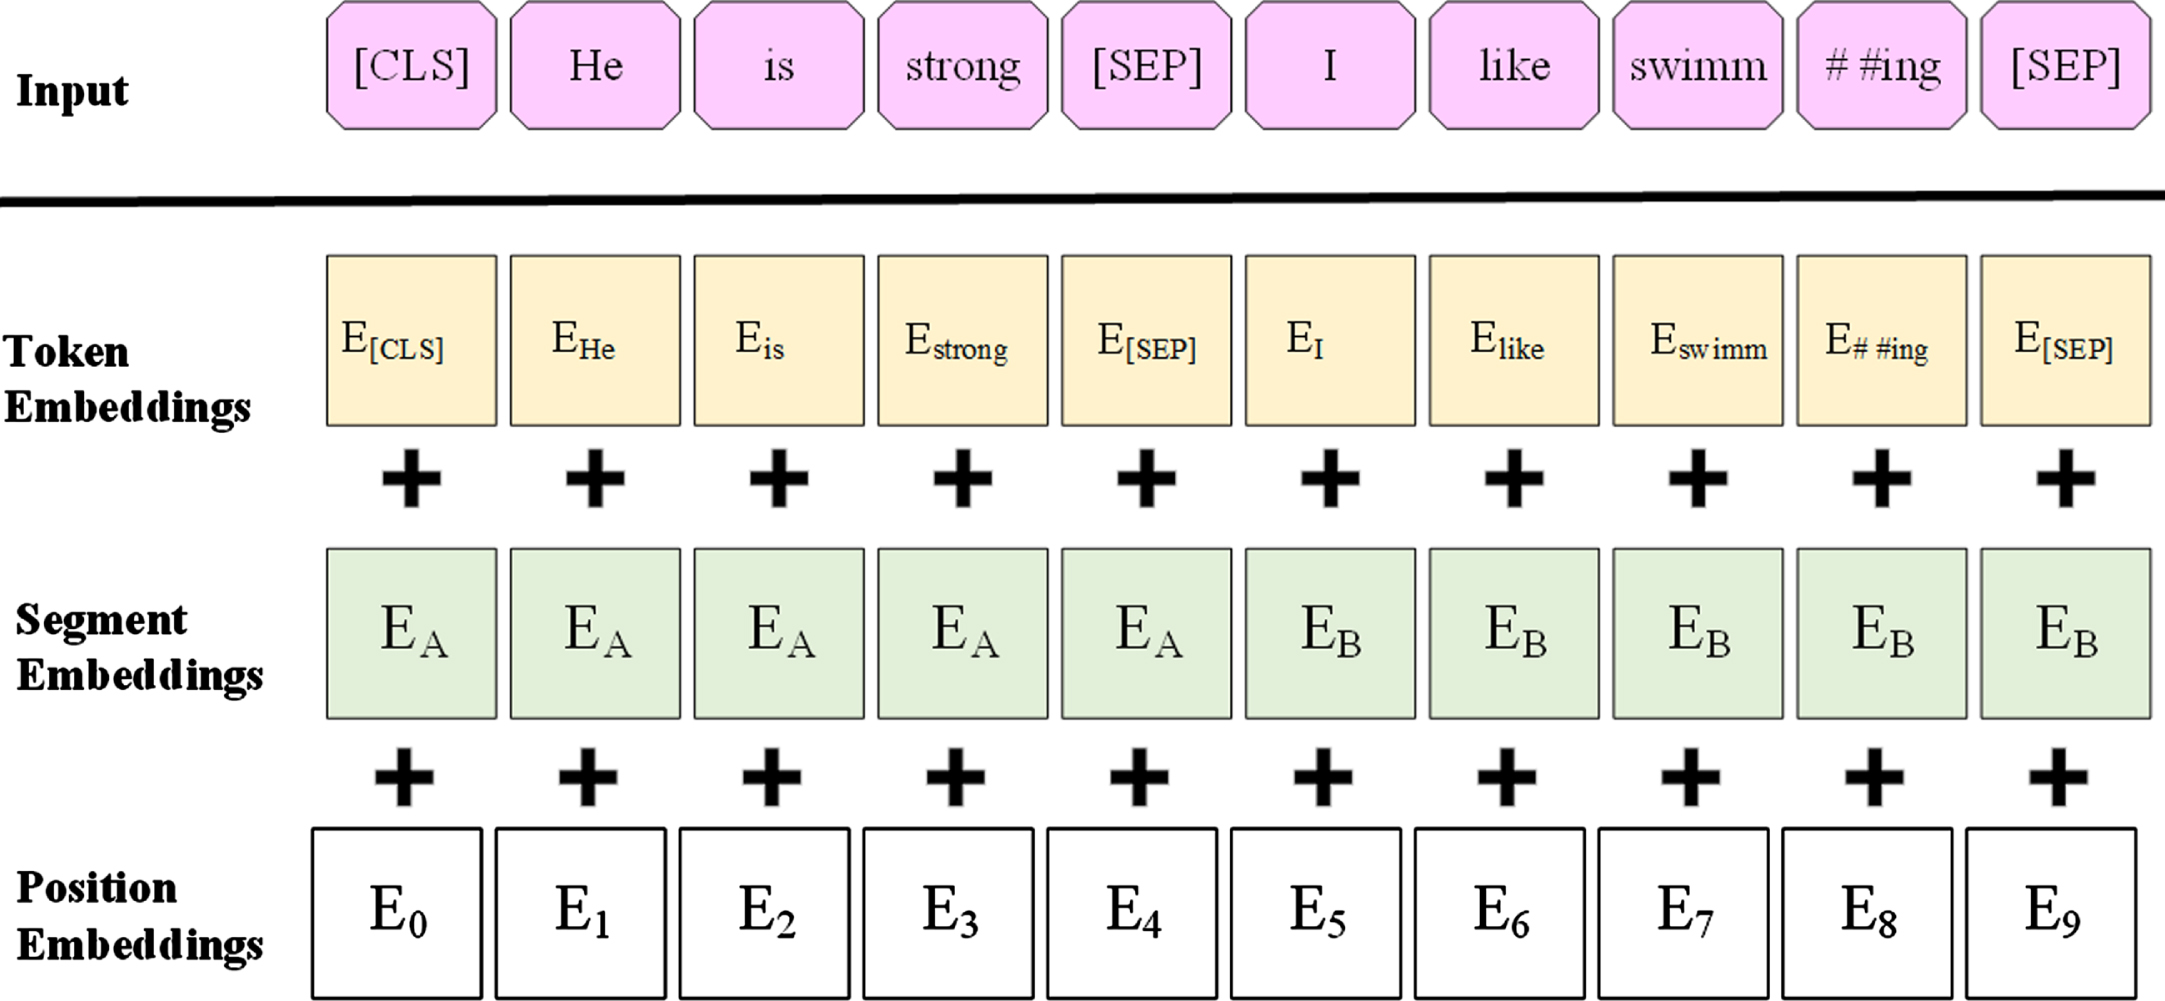
In Fig. 2, E1, E2, . . ., EN is the input sequence of the Bert model, Trm is the encoder model of the transformer, and T1, T2,. . .,TN. Trm represents the Transformer model and adopts an encoder decoder architecture, consisting of 6 encoder and 6 decoder layers stacked together. The encoder contains a self attention layer and a feedforward neural network. Decoder includes a self attention layer, an attention layer and a feedforward neural network.The input sequence of Bert is the sum of token embeddings, segment embeddings and positional embeddings, where the text sequence of token embeddings needs to start with the word element <cls> as the starting token. The input sequence model is shown in Fig. 3. Bert has a 12-layer encoder, which means that for each word, there are 12 corresponding 768-dimensional hidden state representations, and according to the Bert authors’ tests, the last four layers of the splicing vector perform best.

Bert model.
Input representation of BERT Model [12].
The length of a user’s monthly query record is very long, with an average length of 873.6. To cover more information, a data enhancement strategy is used to crop the length of the user query text data. Text below 1024 length is filled in, while lengths above 1024 are truncated. The maximum length that Bert can manage is 512, dividing the 1024 field into two 512-segment long fields and then inputting the fields into Bert. Then, the two subtexts share Bert, splicing the two 3-dimensional vectors of Bert output for the next processing step.
Improvements to CK-means+
The canopy algorithm is an unsupervised preclustering algorithm that divides the data into multiple overlapping subsets and eliminates the spurious points and outliers of the dataset. The canopy algorithm is relatively insensitive to noise, which is more convenient and timesaving compared with the K-means algorithm and can obtain better results. K-means is sensitive to noise, and the introduction of canopy can effectively reduce the number of operations of the K-means algorithm, thus reducing the complexity of the K-means algorithm and improving its efficiency.
The Canopy algorithm clusters data stored in an array, manually setting the distances between T1 and T2, with T1>T2. Then, arbitrarily select a data point from the dataset as the center, calculate the distance d from other points to it, and classify according to the distance threshold to output K classes.
Step 1: The Canopy algorithm inputs the given set of data into matrix X, sets initial distance thresholds T1 and T2 (T1>T2), selects data point x i as the starting midpoint C1, and stores the given data in the ArrayList set (candidate center points).
Step 2: Calculate the Euclidean distance d between other data x and C1 in the ArrayList, and compare d with the values of T1 and T2. When d<T1, divide this point into the Canopy set and; When d<T2, remove this point from the List set and no longer add it to other Canopy sets; Perform new operations on data with T2<d<T1, then update to calculate the distance between the point and the new center point, compare the distance and threshold, and classify it into categories.
Step 3: Repeat the for loop until the ArrayList set is empty.
In the canopy algorithm, the distance thresholds T1 and T2 are random, and the settings of T1 and T2 are usually decided empirically, which can lead to a very unstable accuracy and efficiency of the algorithm. If the thresholds are set too large, data from different categories can be grouped into one set; conversely, it causes data from the same category to be grouped into different categories. Therefore, our approach optimizes the canopy algorithm. The threshold T2 of the canopy algorithm has a certain influence on the result K; however, the threshold T2 is uncertain, so we propose a method to obtain the threshold T2 adaptively by finding the sum of the distances between points in the dataset.
In this paper, the initial centroids of K-means and the selection of the number of clusters K are improved by using canopy and mean value calculations. First, the threshold T2 of Canopy is optimized, and the total number of clusters K is obtained according to the canopy algorithm. Then, the average number of K clusters is obtained according to the mean calculation method. The data point closest to the average is taken as the initial centroid of the K-means algorithm. In this way, the value of K and the initial centroid of the K-means algorithm can be determined. Fig. 4 is the overall flow chart.
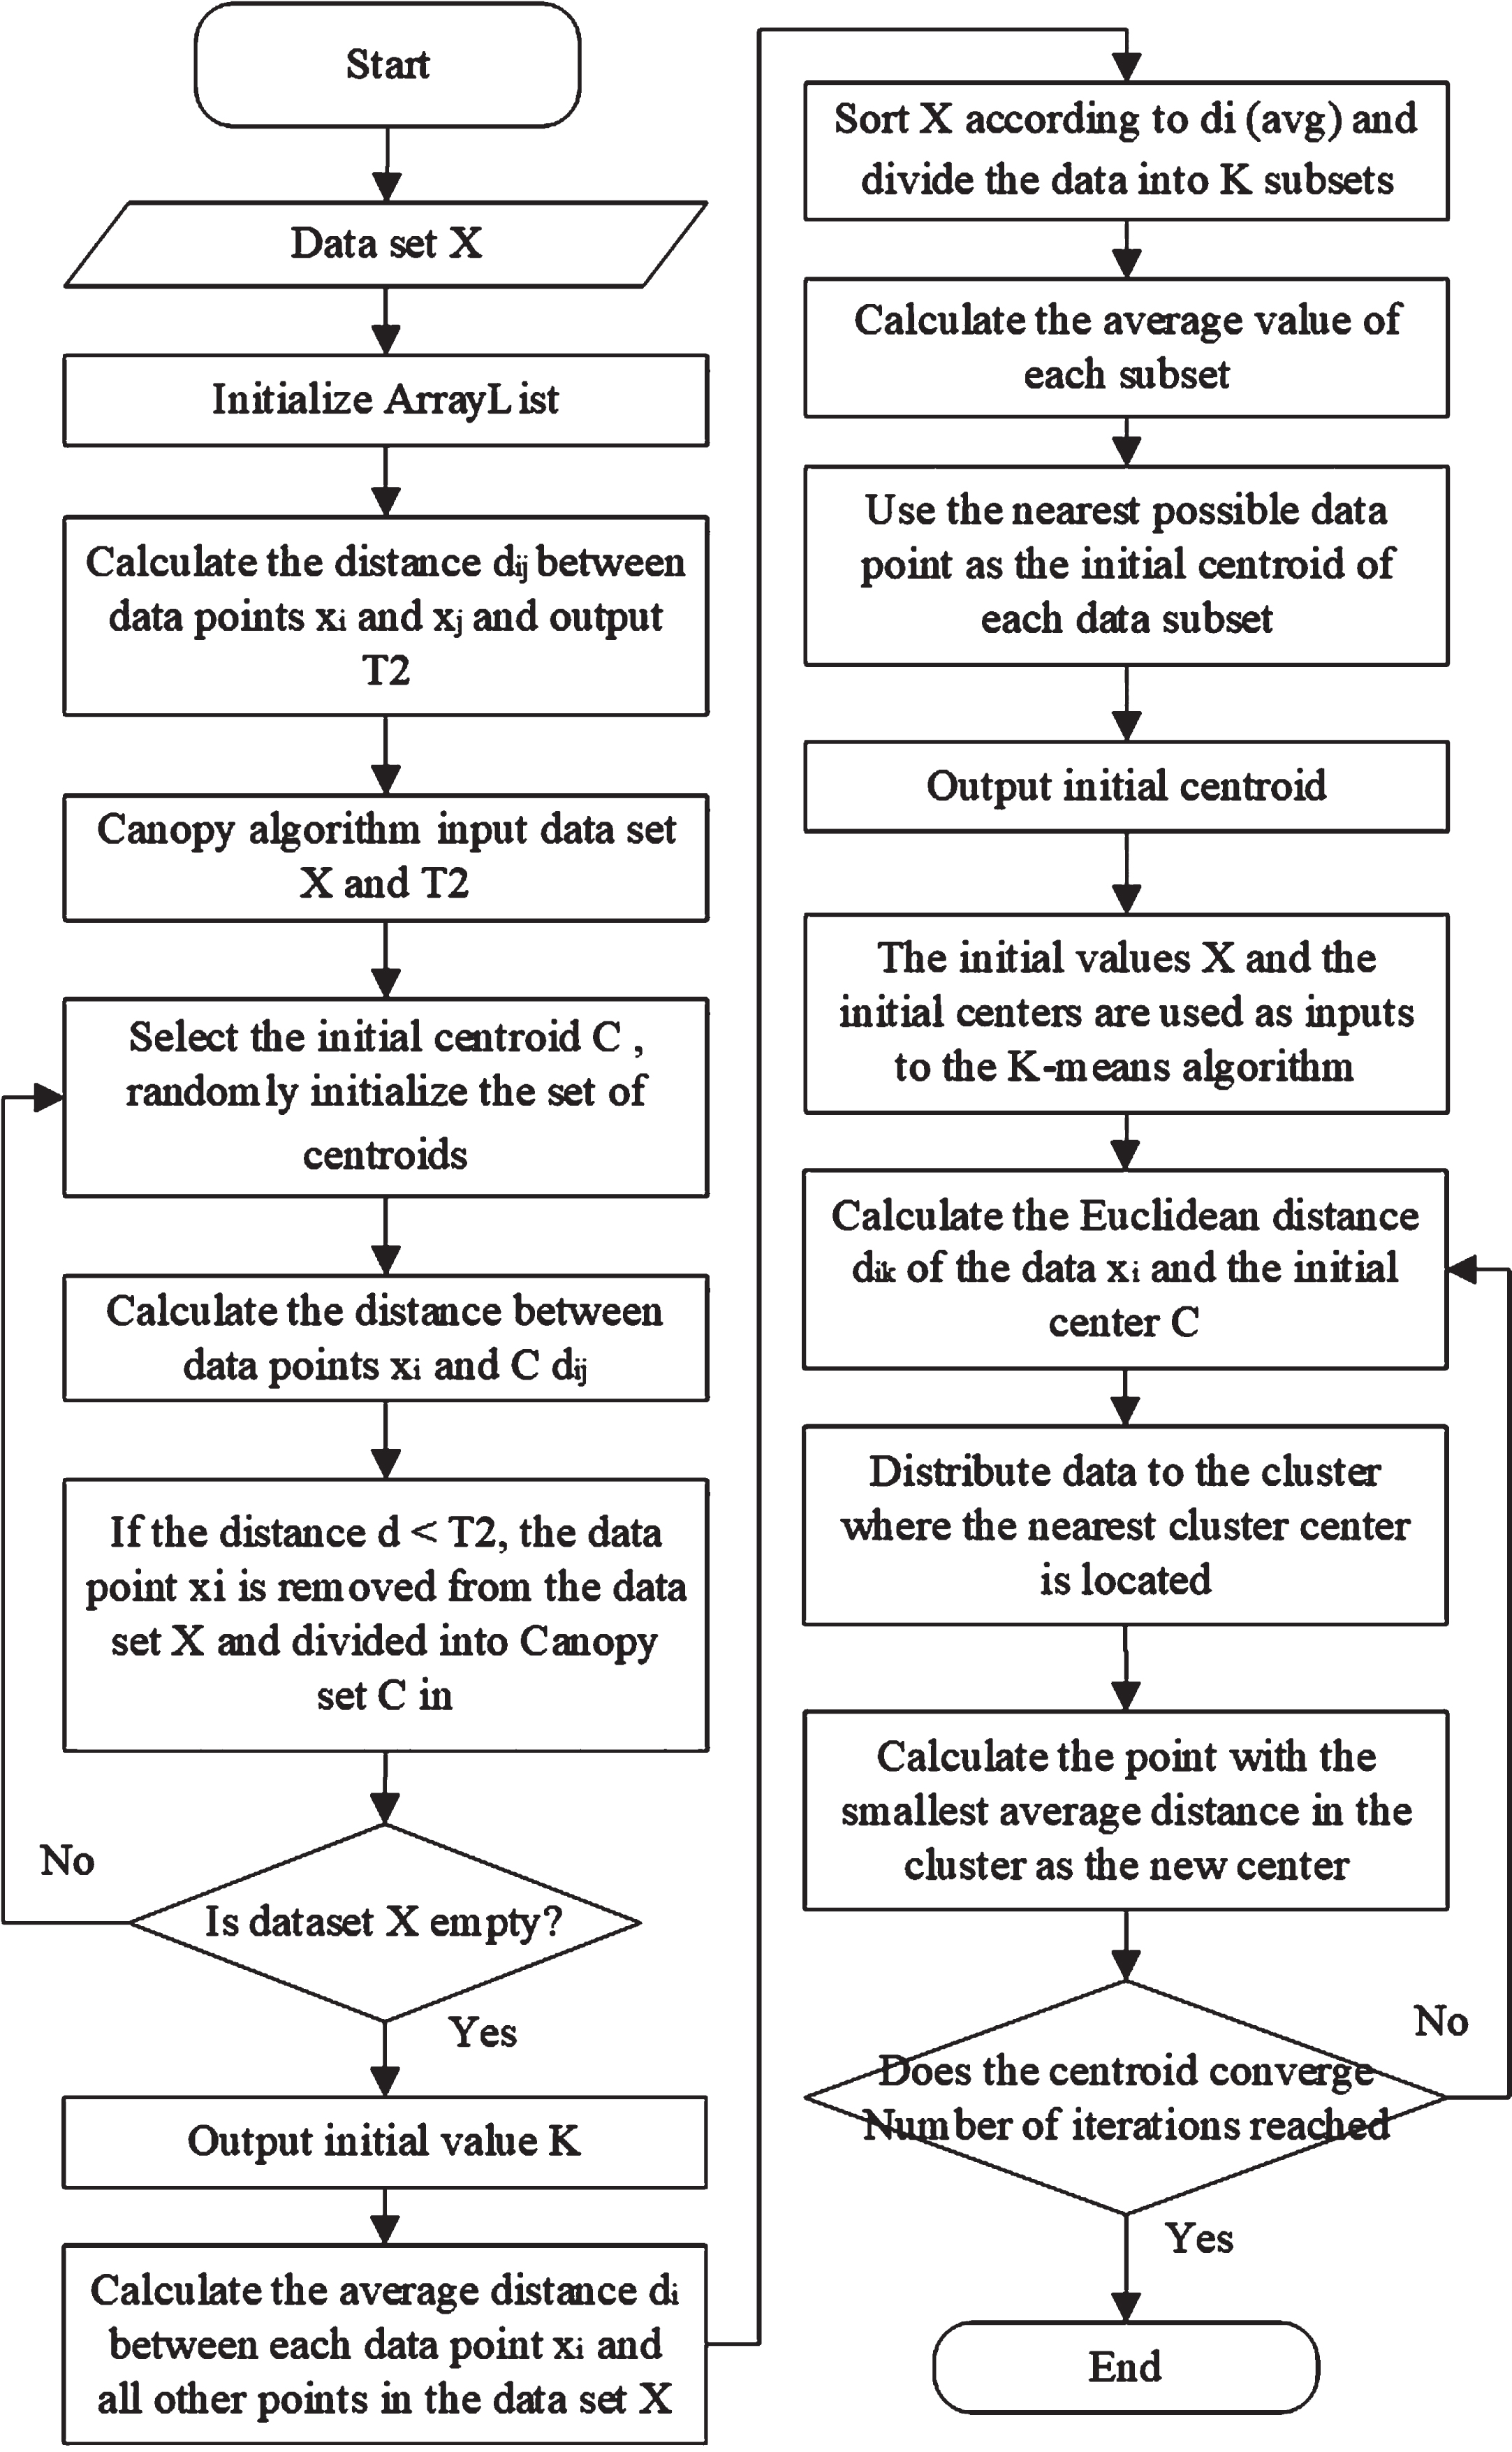
Improved CK-means+ flow chart.
The mean function is set to average the semantic vector features of the penultimate layer of the Bert model as sentence vectors. The similarity between sentence vectors is calculated by CK-means+. The dimension of the sentence vector is [seq-length, hidden-size*2], so there is no need to reduce the dimension when clustering.
If the entire dataset D contains data from n users, each with a corresponding sentence vector d i , then the dataset D=[d1,d2,...,d n ]. Calculate the cosine similarity of the sentence vector d i as shown in Eq. (1). divide the entire dataset into k classes, and the text corresponding to each class is written to the file. Additionally, considering the effectiveness of the clustering algorithm, the effectiveness of clustering needs to be measured based on the contour coefficient. The clustering ends when the number of iterations is maximum.
Unlike the CK-means+ algorithm in Chapter 3, the similarity calculation method is changed from the Euclidean distance to the cosine value in this section in the face of high-dimensional sentence vectors, as shown in Eq. (1). The range of values [0,1] is taken, and the larger the value, the more similar they are.
The class labels of each user, such as Cluster 0, Cluster 1, and Cluster 2, are obtained after the clustering is finished. We need labels to describe each cluster topic. This article uses TF-IDF calculation to select the 10 words with the highest word frequency in each cluster as labels for that cluster, as shown in formula 2.. Translate tags into word vectors through Bert to provide topic information for the next step of integrating semantic vectors. Summarize the search records of each category of users into corresponding documents, resulting in a total of K categories and K documents. The serial numbers of each document are 1, 2, 3... k; There are 1, 2, 3... x words in each document. TF represents word frequency, representing the number of occurrences of word x in this document. The more occurrences, the greater the importance of this word in this document.. IDF represents the frequency of anti document, representing the number of documents with word x appearing in K documents. The more documents contain the word x, the more common the word is and the less representative it is. The fewer documents containing the word x, the more unique the word, and the more representative it is of this document. The essence of TF-IDF is to weaken the common words that appear in most documents and screen out the truly high-frequency words that are most representative of the current document.
After obtaining the word vector output by Bert and the topic vector output by CK-means+, the topic vector and the semantic vector are spliced. There are two common splicing methods. The first is cat splicing, where vectors with the same shape are added directly without changing the dimensionality of the vectors. The second is stack splicing, which splices vectors with the same shape in an expanded dimension. Because stack splicing causes the vector dimension to become larger, which may cause dimensional disaster, this research utilizes cat splicing.
Output layer
Connecting the fully connected layer with the softmax classifier, ReLU is used as the activation function to mitigate the problem of model overfitting when using dropout. The value can be calculated by using the following mathematical formula.
where s is the feature representation of the text, o is the output of the fully connected layer, b is the bias term, W is the weight matrix, and g is the output vector of the last model. softmax calculates the probability formula for each attribute as follows.
Dataset
The dataset is provided by Sogou and the Chinese Computer Society and is the dataset from the CCF "Sogou User Portrait Mining" competition [26]. The dataset contains 100,000 search results of users and their gender, age, and education labels. The contest evaluation criterion is the average of the accuracy of the three labels of gender, age and education of the user data.The dataset includes 100000 pieces of data, which are divided into 80000 training sets, 10000 testing sets, and 10000 validation sets based on experiments.The format of the data is<ID, education, age, gender, query term>.
User profiling dataset
User profiling dataset
In this paper, the prediction of users’ education, age and gender labels are three tasks, which are trained and predicted separately. Among them, gender is dichotomous, and age and education are six categories. To measure the effectiveness of the model to manage the three tasks together, the accuracy and average accuracy are chosen as evaluation metrics in this paper. Accuracy is the ratio of the number of correctly classified samples to the total number of samples.If the accuracy rates of gender, education and age are expressed as Acc
gender
,Acc
edu
and Acc
age
, respectively, then the average accuracy rate is calculated as shown in Equation 10.
where L represents the number of category labels, TP represents the number of positive samples that are predicted to be positive, FP represents the number of positive samples that are predicted to be negative, and FN represents the number of negative samples that are predicted to be positive.
The silhouette coefficient is an important indicator of clustering effectiveness. Since this dataset has no clustering labels, it is impossible to determine the clustering accuracy with the true and predicted values, so the silhouette coefficient is chosen as an evaluation index. The contour relationship is determined by the degree of cohesion between the same clusters and the degree of separation between different clusters. The value interval of the contour coefficient is [-1, 1], and the larger the value, the closer the distance between the same class and the farther the distance between different classes, the better the clustering effect. Let sample point i. The calculation steps are (1) Cohesion degree a(i): the average dissimilarity of i vectors to other nodes within the same class. (2) Separation degree b(i): the minimum of the average dissimilarity of the i-vector to the nodes in other classes. (3) The contour coefficient of sample i is:
The PyTorch platform can automatically accumulate gradients and zero out the data after N batches have been calculated, i.e., the training batches are increased by a factor of N. Our experimental environment is as follows. The python version is 3.8; the deep learning framework is PyTorch 1.1.0; Video Cards is GeForce GTX 1080Tix2; and the CUDA version is 11.0.
The Bert model starts with a small learning rate of 5e-6, and the update method for the learning rate is exponential decay, with a decay rate of 0.98. The length of the input sentence is 512. The dimension of the word vector hidden layer is 768 dimensions. The batch size entered by the model is 128. The number of gradient accumulations is 4, which can increase the training batch without consuming more memory. The Python platform can automatically accumulate gradients and clear the data to zero after calculating N batches, which means the training batch is increased by N times. The number of epochs that the entire training set will be input during the training process is 30. To prevent overfitting, set the dropout rate to 0.5. The activation function is ReLU, the loss function is cross entropy, and the optimizer is Adam.
Bert parameter setting
Bert parameter setting
Word vector ablation experiment
To validate the effectiveness of the dynamic model, Bert was compared with three currently dominant word vector models: word2vec [7] (static), GloVe [27] (static), and ELMO [28] (dynamic). The word2vec word vector dimension was 300, the GloVe word vector dimension was 300, and the ELMO word vector dimension was 512. The first four groups are the results of the word vector model directly connected to the softmax classifier; the last four groups are the results of training after adding topic features by the CK-means+ algorithm. The experimental results are shown in Table 3.
Accuracy of word vector model and clustering processing
Accuracy of word vector model and clustering processing
From the experimental results in the first part of Table 3, we see that Bert-CK shows excellent performance compared with that of the baseline model. In addition, we also combine the proposed method with other baseline comparison models. In the third part of Table 3, we see that the performance of the baseline model and our proposed method have improved to varying degrees. The experimental results also verify the effectiveness of the proposed method.
Compared with word2vec, GloVe has an average accuracy increase of 3.6 and F1 improvement of 3.58; compared with word2vec-CK, GloVe-CK has an average accuracy increase of 3.68 and F1 improvement of 4.28. This is because training GloVe is based on the global corpus, while training word2vec is based on the local corpus, and the weight of GloVe can be mapped, while the weight of word2vec is fixed. Compared with word2vec, GloVe optimizes the weight function.
Compared with those of GloVe, ELMO has an average accuracy increase of 3.1 and F1 improvement of 3.28. Compared with those of GloVe-CK, ELMO-CK has an average accuracy increase of 3.26 and F1 improvement of 2.77. This is because ELMO can learn the semantics of words in various contexts, and ELMO adopts a two-layer LSTM structure. Compared with those from GloVe, it has multilayer extraction capabilities, so it can obtain higher indicators in text classification.
Compared with ELMO, Bert’s average accuracy rate increased by 1.32, and F1 increased by 1.35; compared with ELMO-CK, Bert-CK’s average accuracy rate increased by 1.36, and F1 increased by 1.1. This is because the ELMO model has only two layers of LSTM, and the internal parameters are not universal, so ELMO cannot retrieve the context representation of words at the same time, and the multilevel extraction ability is limited. Bert has a multilayer encoder and multilayer self-attention mechanism structure with strong parallel computing ability and can simultaneously utilize the deep semantic structure of context information.
Figures 6 show the changes in accuracy and loss values for Bert-CK and word2vec-CK on gender classification training. From Fig. 5, the accuracy of Bert-CK increases significantly, and the convergence of Bert-CK is faster, as seen in Fig. 6.
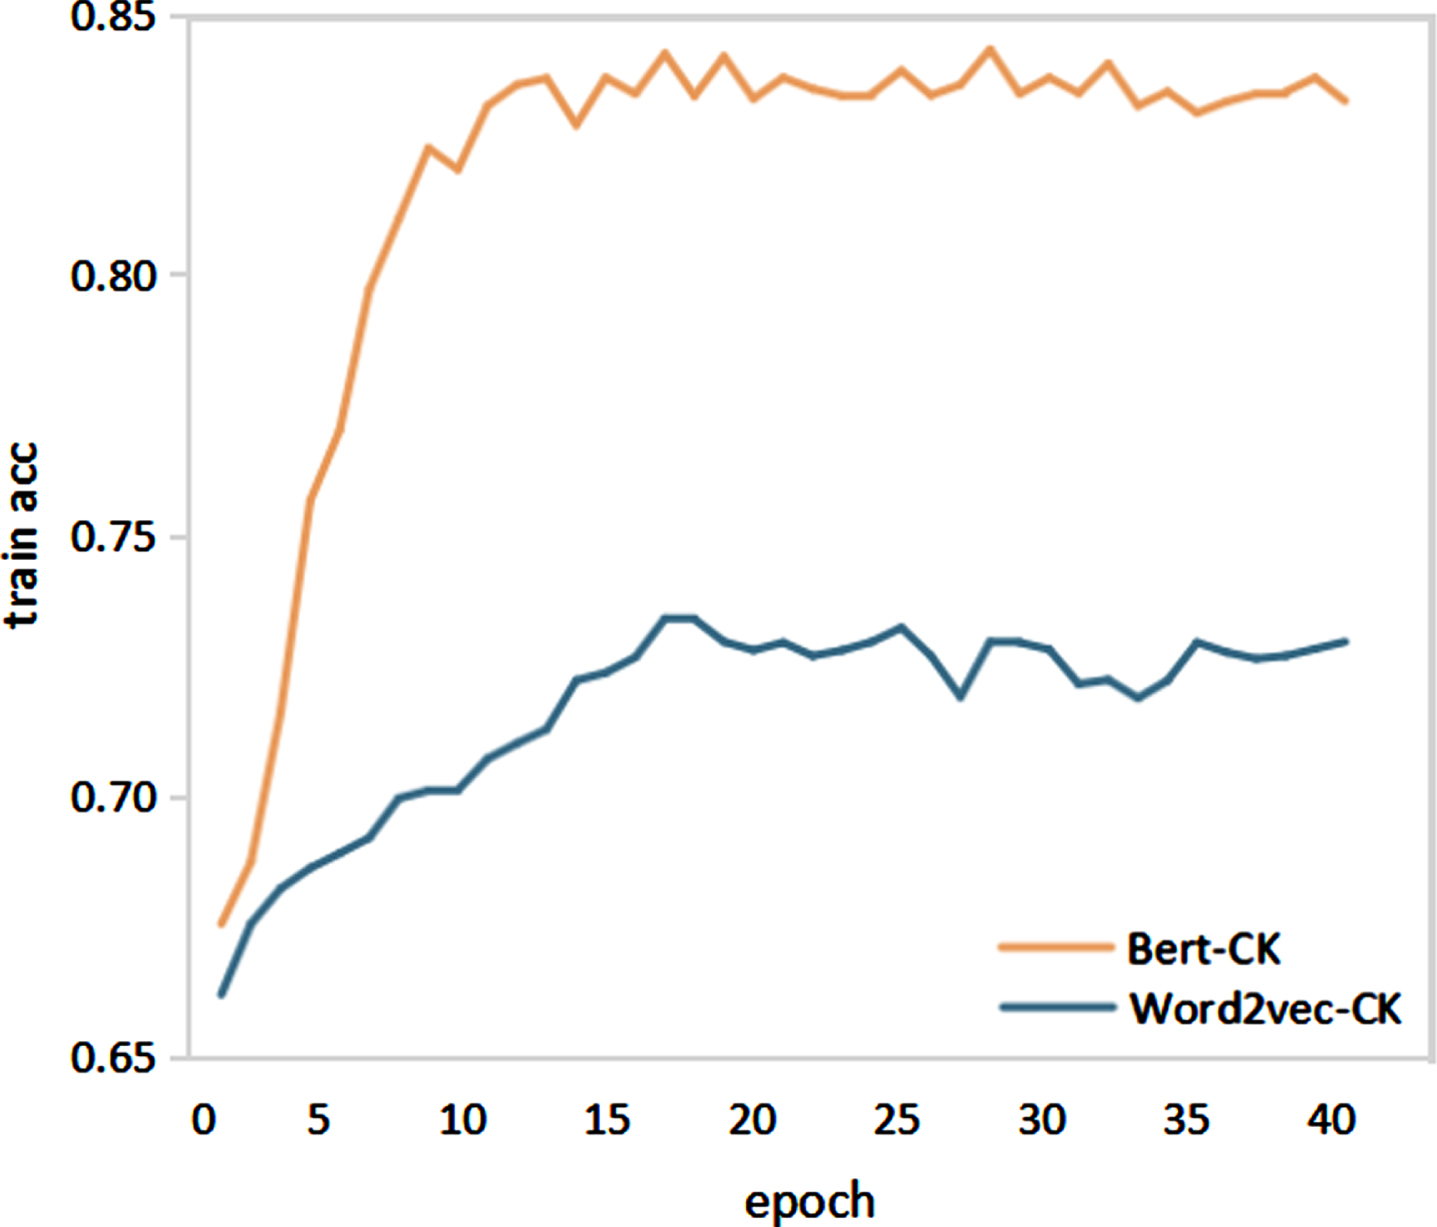
Change in accuracy in gender classification.
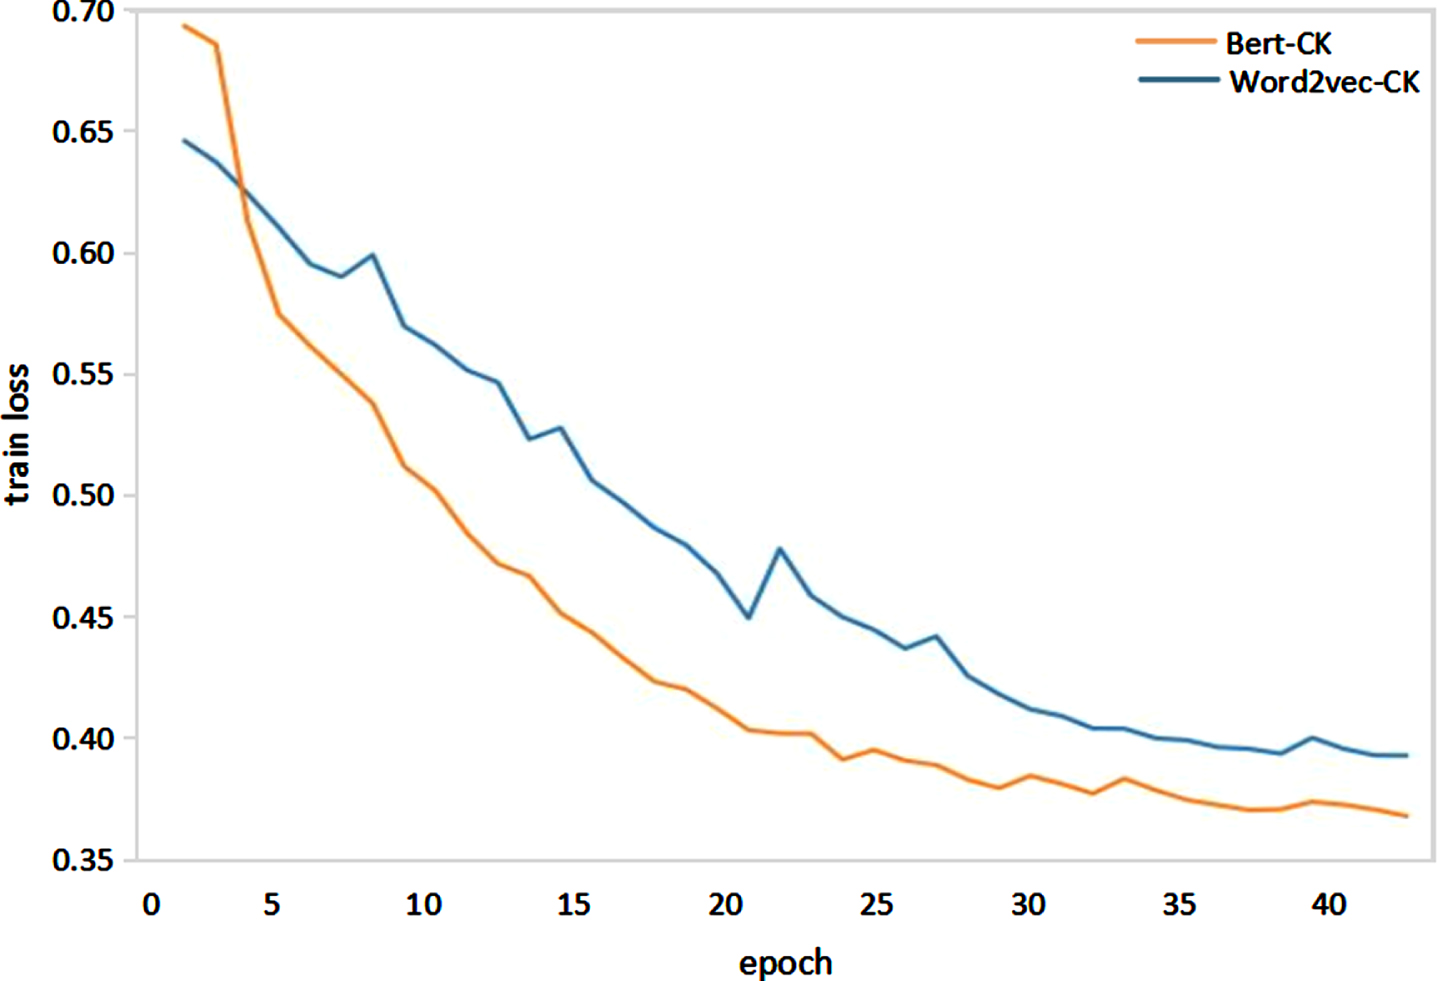
Change in loss value on gender classification.
To demonstrate the effectiveness of CK-means+, ablation experiments were designed with the K-means [29] algorithm, CK-means algorithm and K-means++ [30] algorithm. CK-means is the algorithm with only canopy preprocessing, and the experimental results are shown in Table 4.
Accuracy of the various clustering algorithms
Accuracy of the various clustering algorithms
From the experimental results in Table 4, among the four user portrait models, the Bert-CK-means+ model has the highest accuracy and F1 score, which demonstrates the superiority of the CK-means+ model in text classification tasks. Compared with that of K-means, CK-means+ achieves an accuracy rate of 1.13, and F1 increases by 1.32. Compared with that of the CK-means model, the accuracy rate increases by 0.8, and F1 increases by 0.72. Compared with that of the K-means++ model, the accuracy rate increases by 0.47, and F1 increases by 0.34. For the K-means algorithm, the most important thing is the selection of the K value and the initial centre point, so we analyse the reasons for the superior performance of CK-means+ from these two aspects.
From the perspective of the K value selection, the K value of K-means and K-means++ is random, while CK-means+ is preprocessed by the canopy algorithm, and the selection of the K value is more stable, so CK-means+ achieves the highest accuracy rate. As shown in Fig. 7, the K value of K-means is 28, the K value of K-means++ is 25, and the K value of CK-means and CK-means+ is 24. Both CK-means+ and CK-means are preprocessed by the canopy algorithm, so the K value is the same, but CK-means is not processed by the mean calculation method, and the selection of the initial centre point is random, so the CK-means accuracy is lower than that of CK-means+. K-means has the largest number of categories, and the choice of K value is the most unstable. This results in a large degree of dispersion between categories, which directly affects the clustering effect of the data; therefore, the K-means accuracy is the lowest.
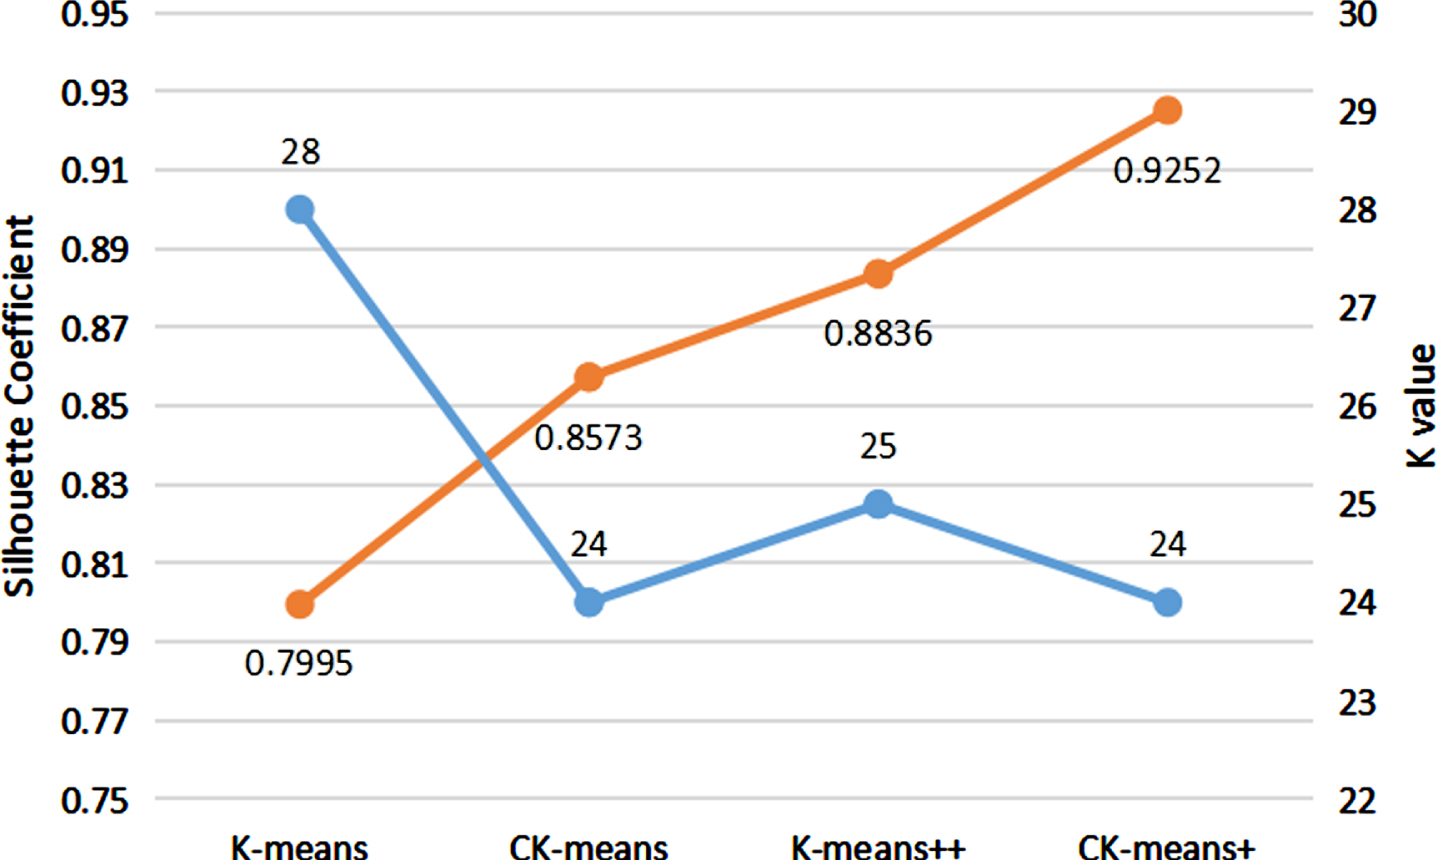
K value and contour coefficient of the clustering algorithm.
From the point of view of the selection of the initial centre point, the CK-means+ algorithm selects the initial centre point through the mean method. However, the initial centre points of the other three algorithms are random, so the accuracy of CK-means+ is the highest. The silhouette coefficients of the four algorithms are shown in Fig. 7. The silhouette coefficient of K-means is the smallest, and the clustering effect is the worst, so the classification effect of K-means is the worst. The silhouette coefficient of K-means++ is higher than that of CK-means, and the clustering effect is better, so the accuracy of K-means++ is higher than that of CK-means. CK-means+ has the largest silhouette coefficient value and the best clustering effect, so CK-means+ has the highest accuracy rate. Through the analysis of the above two aspects, the CK-means+ algorithm was shown to be effective for the adaptive improvement of the K value and the initial centre point.
From Table 3, all four word vector models have varying degrees of accuracy increase after the clustering process, and the degree of increase is related to the word vector models. Thus, to verify the influence of word vector models on the clustering effect and topic features, this research analyses the changes in the four groups of word vector models before and after the introduction of clustering, as well as the corresponding K values and profile coefficients.
In Fig. 8, blue represents the output result of word vectors being directly classified without clustering processing. The yellow color represents the output of the word vector after clustering and classification.From Fig. 8, after clustering, the average accuracy of word2vec increases by 0.86, GloVe increases by 0.94, ELMO increases by 1.1, and Bert increases by 1.14. Word2vec-CK improves the least, and Bert-CK improves the most. This is because the quality of word vectors affects the clustering judgement on the similarity of sentence vectors, which in turn affects the clustering results, and the quality of the word vector model further affects the quality of topic feature word vectors, thereby affecting the accuracy of the classification rate.

Comparison of accuracy rates before and after clustering.
As shown in Fig. 9, word2vec-CK has the lowest contour coefficient value, and ELMO-CK and Bert-CK have the highest contour coefficients, which are similar. This indicates that CK-means+ is less effective in clustering word2vec word vectors, while it is more effective in clustering both ELMO and Bert word vectors. This is because word2vec and GloVe are both static models in which the expressions of words are fixed and do not change with the context, i.e., a word corresponds to a vector, while ELMO and Bert are dynamic models that can learn the meaning of each word according to the context, i.e., each meaning of each word corresponds to a vector, hence the similarity of ELMO and Bert sentence vectors. Therefore, the calculation of ELMO and Bert sentence vector similarity is more accurate.

K values and contour coefficients for word vector clustering.
The above results show that the superiority of word vectors can affect the effect of clustering and the quality of topic features; the higher the quality of word vector expression is, the better the clustering effect and the higher the classification accuracy. In addition, the K value of all four groups of experiments is 24, which further proves the stability of CK-means+.
Through the above three sets of comparative experiments and analysis, we have shown that the Bert-CK model, by means of data preprocessing, introduction of Bert and CK-means+, can effectively improve the accuracy of user label classification. In the selection of the word vector model, Bert is superior to word2vec, GloVe and ELMO. With respect to the effect of introducing topics into the clustering algorithm, CK-means+ is superior to K-means, K-means++ and CK-means. For the different degrees of improvement of the word vector model before and after clustering processing, the quality of word vector expression is analysed on the clustering effect and topic. The influence of the quality of word vector representation on the clustering effect and topic features is analysed.
User portraits mainly serve the precision marketing business and precisely match diverse needs of users and enterprises. In the experimental results, we were able to obtain individual user portraits and group user portraits. This can help us analyse the current and potential needs of several types of users to achieve precise marketing. Table 5 shows some examples of clustered topic features. Figure 10 shows the number of people in different categories. Cluster 0 users are mostly women aged 18-35, and most of them are college students, accounting for 2121 people. Therefore, products such as beauty makeup, clothing, and food can be recommended for marketing. Women are the main consumption force, but the proportion of the number of people who shop on the web is relatively small, which shows that the method of shopping on the web is still not convenient and needs further improvement. Cluster 1 users are mostly men aged 25-30 who pay more attention to investment information such as funds and stocks, so more wealth management information in the financial industry can be recommended to them. Cluster 2 is mostly male college students aged 18-24 who are interested in electronic products, so tablets, Bluetooth headsets and other electronic products can be recommended to them. Therefore, based on the understanding of users, the network marketing strategies formulated are more directional and instructive, saving the time, cost and energy of enterprises and users and providing enterprises with more valuable marketing strategies.
Example of theme tags
Example of theme tags
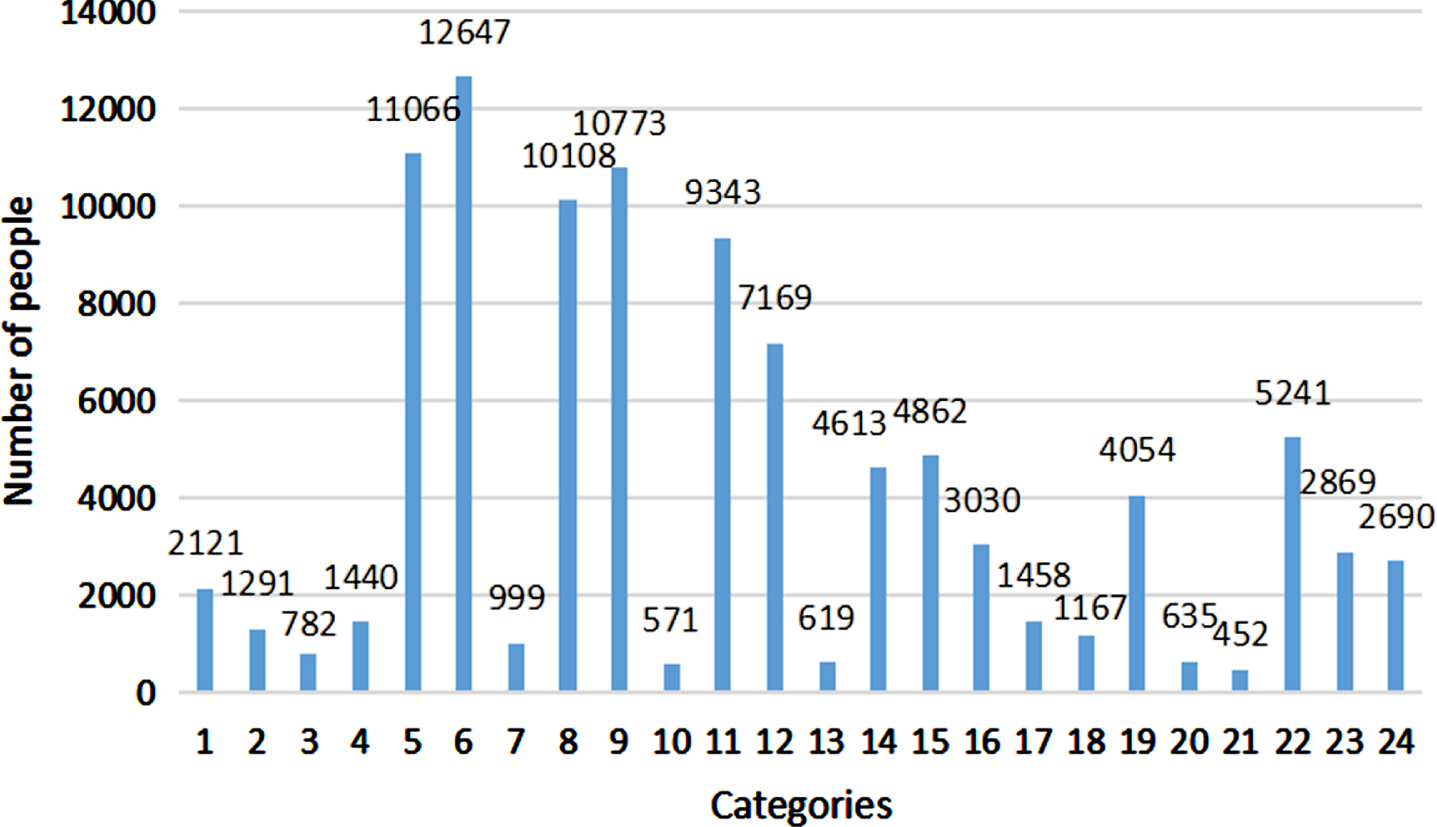
Number of users of all types.
To address the problem that static word vectors cannot fully extract word representations and to resolve word polysemy in traditional user portrait model construction, we propose a Bert-CK user portrait model. The main idea is to introduce Bert to extract different levels of feature information of words and to manage the problem of word polysemy in the pretraining task. To improve the classification accuracy, CK-means+ is introduced to create topic features at the level of semantic features. It not only makes full use of word vectors and sentence vectors but also fully integrates semantic features and topic features, which effectively improves the accuracy of user profile classification. The shortcoming of this model is that it cannot better extract attribute features according to the downstream classification task, and the accuracy of the model may be improved by combining classical neural networks for text classification in the future.
Footnotes
Acknowledgements
This work is supported by the following funds: (1) National Natural Science Foundation of China (NSFC) project "Research on Key Technology of Air-Sky-Earth Multimodal Data Fusion for Digital Twin Agriculture" (62266043) (2) Major Project of High Resolution Earth Observation System of the National Defence Bureau of Science and Technology (95-Y50G37-9001-22/23) (3) Natural Science Foundation of the Autonomous Region: Research on Key Technology of Multisource Heterogeneous Data Fusion and Mining for Government Affairs (2021D01C083) (4) Autonomous Region Science and Technology Program Young Scientists Fund Project: Research on Operation Risk Assessment Method of Integrated Energy System Based on Deep Neural Network (2022D01C83)