
Abstract
Most of the flight accident data have uneven distribution of categories. When the traditional classifier is applied to this data, it will pay less attention to the minority class data. Synthetic Minority Over-sampling Technique (SMOTE), and its improvements are well-known methods to address this imbalance problem at the data level. However, traditional algorithms still have the problems in blurring the boundary of positive and negative classes and changing the distribution of original data. In order to overcome these problems and accurately predict flight accidents, a new Clustered Biased Borderline SMOTE(CBB-SMOTE) is proposed for Quick Access Recorder (QAR) Go-Around data. It generates more obvious positive and negative class boundaries by using K-means for boundary minority class data and safety minority class data respectively, and maintains the original data distribution to the greatest extent through a biased oversampling method. Experiments were carried out on a group of QAR Go-Around data. The data set is balanced by CBB-SMOTE, SMOTE, Cluster-SMOTE algorithm respectively, and the random forest algorithm is used to predict the new data set. The experimental results show that CBB-SMOTE outperforms the SMOTE in terms of G-means value, Recall and AUC.
Introduction
With the rapid development of civil aviation industry, both the number of passenger flights and cargo flights have been growing rapidly in recent years. While more people choose aircraft as a means of transportation, the safety of flights has also received more attention. Predict possible situations through data can make early warnings and adjustments to avoid dangerous events [1]. It is necessary to learn the existing flight accident data, predict the occurrence of the accident according to the learned knowledge and experience, and then make preparations in advance [2–7]. However, most flight accident data sets are essentially imbalanced. When a classifier is constructed based on an imbalanced data set, the prediction results may be biased towards the majority class, which makes it easy for the classifier to misclassify the minority samples into the majority class [8–13]. But sometimes the minority class samples, such as the accident samples, are the main research objects of the problem. And in this case, the misclassification of the minority class samples may bring serious problems and risks. Therefore, the imbalanced learning of flight accident data becomes particularly important [14]. Aircraft go-around is a common flight accident, and an accurate prediction of whether go-around is needed has a significant impact on enabling pilots to perform the next step properly and to calm passengers in advance. It plays an important role in the safe flight of aircraft. However, aircraft go-around is still minority event. Therefore, this article starts with a set of QAR go-around data and uses an improved SMOTE algorithm to research and enhance the accuracy of go-around prediction by addressing the imbalance issue within the data.
Researchers have done a lot of work on imbalanced learning methods, but learning imbalanced data is still a big challenge for machine learning [15–18]. The methods of imbalanced learning are roughly divided into two types: algorithm level [19, 20] and data set level [21, 22]. Compared with the algorithm, the data level method is not limited by the domain and classifier [23–25], and has better adaptability. The methods of dealing with imbalanced data can be divided into undersampling, oversampling and mixed sampling. They achieve the relative balance between the majority class data and the minority class data in quantity through scientific methods [14]. Among them, Chawla et al. [26] put forward SMOTE is one of the classic oversampling algorithms. The algorithm randomly synthesizes samples on the connection line between two minority classes based on k-nearest neighbors, so that the samples between different classes tend to be balanced. It realizes the targeted generation of new data and avoids the uncontrollability caused by random generation. However, there is a certain blindness in the setting process of k when selecting the k nearest neighbor sample points. And the sample points with marginal distribution are easily generated in the reconstructed data set, which will lead to the problem of blurring the positive and negative class boundaries. According to the idea of this algorithm, many improved algorithms have been derived for its shortcomings. Borderline-SMOTE [27] distinguishes borderline and non-border regions by the distribution of neighborhood samples, and balances the data set by synthesizing borderline samples. It is one of the most popular SMOTE variants at present, which solves the problem of blurring positive and negative class boundaries that may appear in SMOTE algorithm. Literature [28] proposes the Cluster-SMOTE algorithm, which combines K-means and SMOTE algorithm, and then literature [29–31] combined different clustering methods with sampling algorithm to control the randomness of k value selection. The Radius-SMOTE [32] algorithm controls the interpolation area by setting the sampling radius instead of the Euclidean distance. Literature [33] proposed an improved SVM SMOTE algorithm, which can remove noise data in the overlapping area, effectively improving the classification accuracy. Self-Organizing Map Oversampling(SOMO) [34] applies self-organizing maps to generate two-dimensional representations of high-dimensional spaces. And use the SMOTE procedure to make instances in the cluster and between clusters. Bernardo A et al. [35] proposed a VFC-SMOTE algorithm with online streaming learning as an application context. It is used to solve the imbalance problem on data streams and extends the application scenarios of SMOTE algorithm. In addition, some new methods are also proposed in recent years [36–45].
The above improved algorithm optimizes the defects of SMOTE itself and solves its existing problems, but the new improved algorithm also brings new problems. For example, the Borderline SMOTE divides data sample points into safety points, boundary points, and danger points (noise points) based on the number of identical sample points around it. It solves to some extent the problem of the original SMOTE reconstruction dataset blurring positive and negative class boundaries. However, it only oversamples the boundary data, so the new data set generated by this algorithm will change the distribution characteristics of the original data. And the new samples generated by it will not only be in the boundary area, but will also appear around it, which will have the risk of expanding the boundary area. The combination of clustering algorithm and SMOTE can control the selection of k value within a certain range. But simple clustering will lead to the phenomenon that the minority class data in a cluster is more than the majority class data, which will lead to reverse oversampling. Or the minority data in a cluster is too small to achieve the expected sampling ratio.
Aiming at the problems existing, a Clustered Biased Borderline SMOTE(CBB-SMOTE) is proposed in this paper. CBB-SMOTE completes the entire balancing process by clustering the few class samples that have been identified by the boundaries and biased oversampling each cluster after clustering. The algorithm improves the clustering object of K-means, it takes the boundary points and safety points in the minority class data as the target. In addition, CBB-SMOTE adopts a new sampling method—biased oversampling. Different from the traditional algorithm, it performs oversampling operations on the boundary points and safe points in the clustered minority class data at the same time, but the sampling focus is more inclined to the boundary. It performs SMOTE oversampling on different clusters based on preset sampling comparisons. The combination of the two improved methods can deepen the boundary without expanding the boundary. This paper balances a group of QAR data related to aircraft go-around, and uses random forest algorithm to predict. The algorithm was validated in various aspects using Area Under the Curve(AUC), Recall, and G-means as evaluation indicators.
The main contributions of this paper are described as follows. The clustering object of K-means is improved. It avoids the problem of reverse oversampling or failure to achieve the desired sampling rate due to the small number of samples in the minority class data for the cluster. A biased oversampling method is proposed to balance the dataset. It can maintain the original data distribution on the basis of producing more obvious boundaries. Applying CBB-SMOTE to QAR aircraft Go-Around data demonstrates its feasibility in processing aircraft accident data.
Relevant knowledge
SMOTE
The SMOTE algorithm is an oversampling method, which is no longer a simple data generation method, and can avoid the over fitting after new data generation. The SMOTE algorithm firstly performs feature analysis on the minority class data in the data set, and finds the k neighboring data of each minority class sample point by calculating the Euclidean distance. According to the analysis results, the oversampling ratio of the data set was set as n. It means that n samples are randomly selected from the adjacent samples of k samples and interpolated on the connection line between sampling points and adjacent sample points to generate new data. The algorithm diagram is shown in Fig. 1, where the red dots represent minority class samples and the blue dots represent majority class samples. The algorithm achieves the balance of data categories by oversampling between a few sample points. The algorithm diagram is shown in Fig. 1, where the red dots represent minority class samples and the blue dots represent majority class samples. The algorithm achieves the balance of data categories by oversampling between the minority class samples points.
SMOTE algorithm.
The data generation formula is as follows.
The Borderline-SMOTE was proposed by Han et al [46], which is one of the representative algorithms in the improved SMOTE algorithm. It solves the SMOTE’s overlap between positive and negative class boundaries.
The Borderline-SMOTE algorithm compares the sample points in the minority class samples against the number of different types of points in the k-nearest neighbors. According to this, the minority class samples are classified into noise points, danger points (boundary points), and safety points. When there are more than half of the dissident samples in the surrounding sample points, this sample point is defined as a boundary point. Before half of it, the sample point is defined as a safe point. When the surrounding sample points are all dissident samples, this sample point is defined as a noise point.
The algorithm wants to strengthen the boundary part to make the boundary clearer, so it is necessary to generate new sample points according to the boundary points. The safety point is at the core of minority class, far from the boundary, so this part of sample points need not be used as the base point for generating new sample points. The noise points are not very helpful for classification, so new sample points are not generated according to it as a base point.
K-means
K-means clustering algorithm [47] is an iterative clustering analysis algorithm, which is mainly used to calculate data aggregation and realize clustering by continuously calculating the points close to the initial cluster center.
For a group of test data sets {x1, x2, …, x
n
}, k sample points are randomly selected as the starting cluster centers. Calculate the distance from each sample in the data set to every starting cluster centers (generally Euclidean distance, as shown in formula (2)).
Assign the sample points to the cluster that is closest to its starting center point, and generate the initial k category (cluster). The cluster center of each cluster is recalculated, and the sample point closest to other points in the cluster is selected as the new cluster center. Traverse all sample points in the dataset and divide them into new clusters. Continue to iterate the above process until all sample points will no longer change.
CBB-SMOTE utilizes the K-means algorithm to further narrow the operating region of oversampling, reducing the risk of blurred boundaries. And the use object of K-means in the existing algorithm are improved. In the clustering operation, it takes the safety data and boundary data in the minority class as the target respectively, rather than the overall data set, which avoids the blindness of k value selection and solves the problems of insufficient sampling samples and reverse oversampling that would occur before. And proposes a biased oversampling method, which takes both safety data and boundary data into consideration, and places the oversampling focus on the positive and negative class boundaries, so as to generate boundaries that are easy to classify while maintaining the original data distribution as much as possible. Using the sampling cluster selection strategy of CAB-SMOTE Strategy II [46], the clusters are screened before oversampling to avoid unnecessary computation and reduce computational complexity.
K-means clustering object improvement
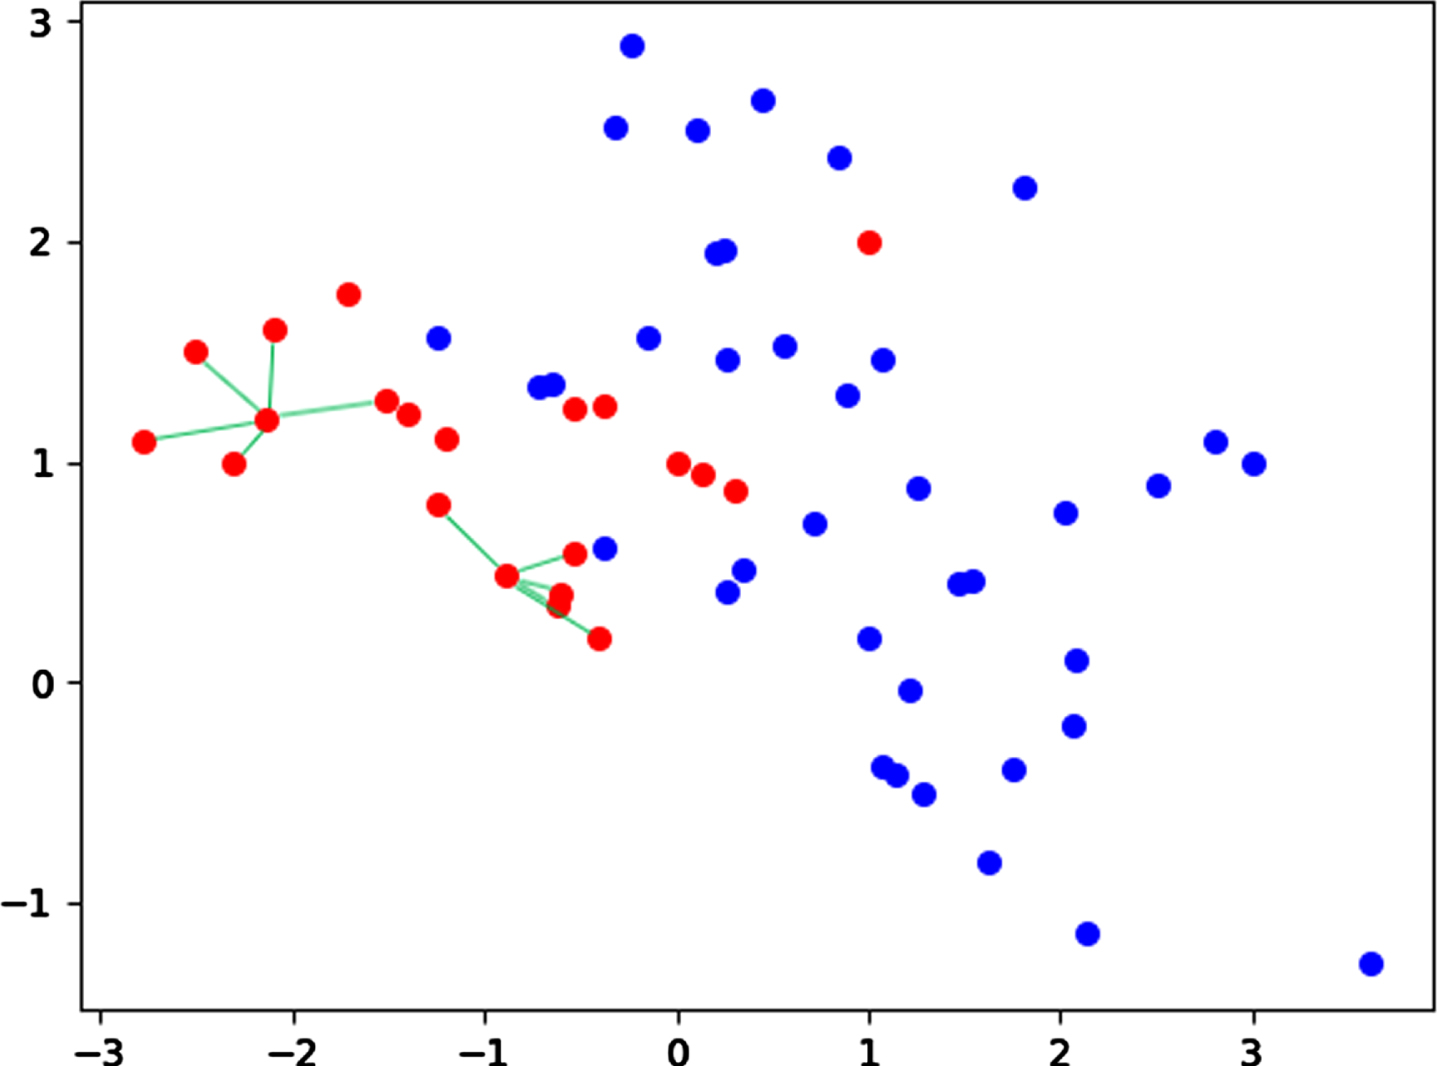
To solve the problem that when the original algorithm generates new boundary samples, which are distributed around the boundary area instead of completely in the boundary area. As in the initial stage of Borderline-SMOTE, the minority class sample points are first divided into safety points, boundary points and noise points. The boundary points and safety points are clustered by K-means respectively, so that the newly generated sample area is further limited in the cluster. Different from the K-means clustering method, the clustering algorithm only clusters the minority class samples, thus further dividing them into multiple clusters. It avoids the problem that occurs when the majority class data and the minority class data are clustered together. The schematic diagram of a few data clustering operations is shown in Fig. 2. Divide minority class data into multiple clusters using the K-means algorithm.
Schematic diagram of K-means clustering operation (red marks are minority class data).
To address the problem with Borderline-SMOTE changing the raw data distribution by treating boundary data only, and to make full use of the resources used in safety data. A biased oversampling method is proposed, which is to perform K-means clustering on the safety data and boundary data at the same time, and then the two parts of data are interpolated according to a certain sampling proportion by using the updated new sample generation formula. Finally, the balance of the data set is achieved by realizing the balance within the cluster. Moreover, the boundary data has a higher sampling ratio than the safety data. In this way, the focus of oversampling is more on the boundary data. The safety data is not ignored while paying more attention to the boundary data. So that the new samples are more inclined to appear in the boundary area. This can not only ensure that the new data set has more obvious positive and negative class boundaries, but also reduce the damage to the original data distribution. The process of sampling boundary data and safety data with the biased oversampling method is shown in Fig. 3. Oversampling operations are performed according to the categories of different clusters of minority class samples. The range of oversampling operations is further restricted by clustering, thus controlling the selection of k proximal points.

Schematic diagram of biased oversampling.
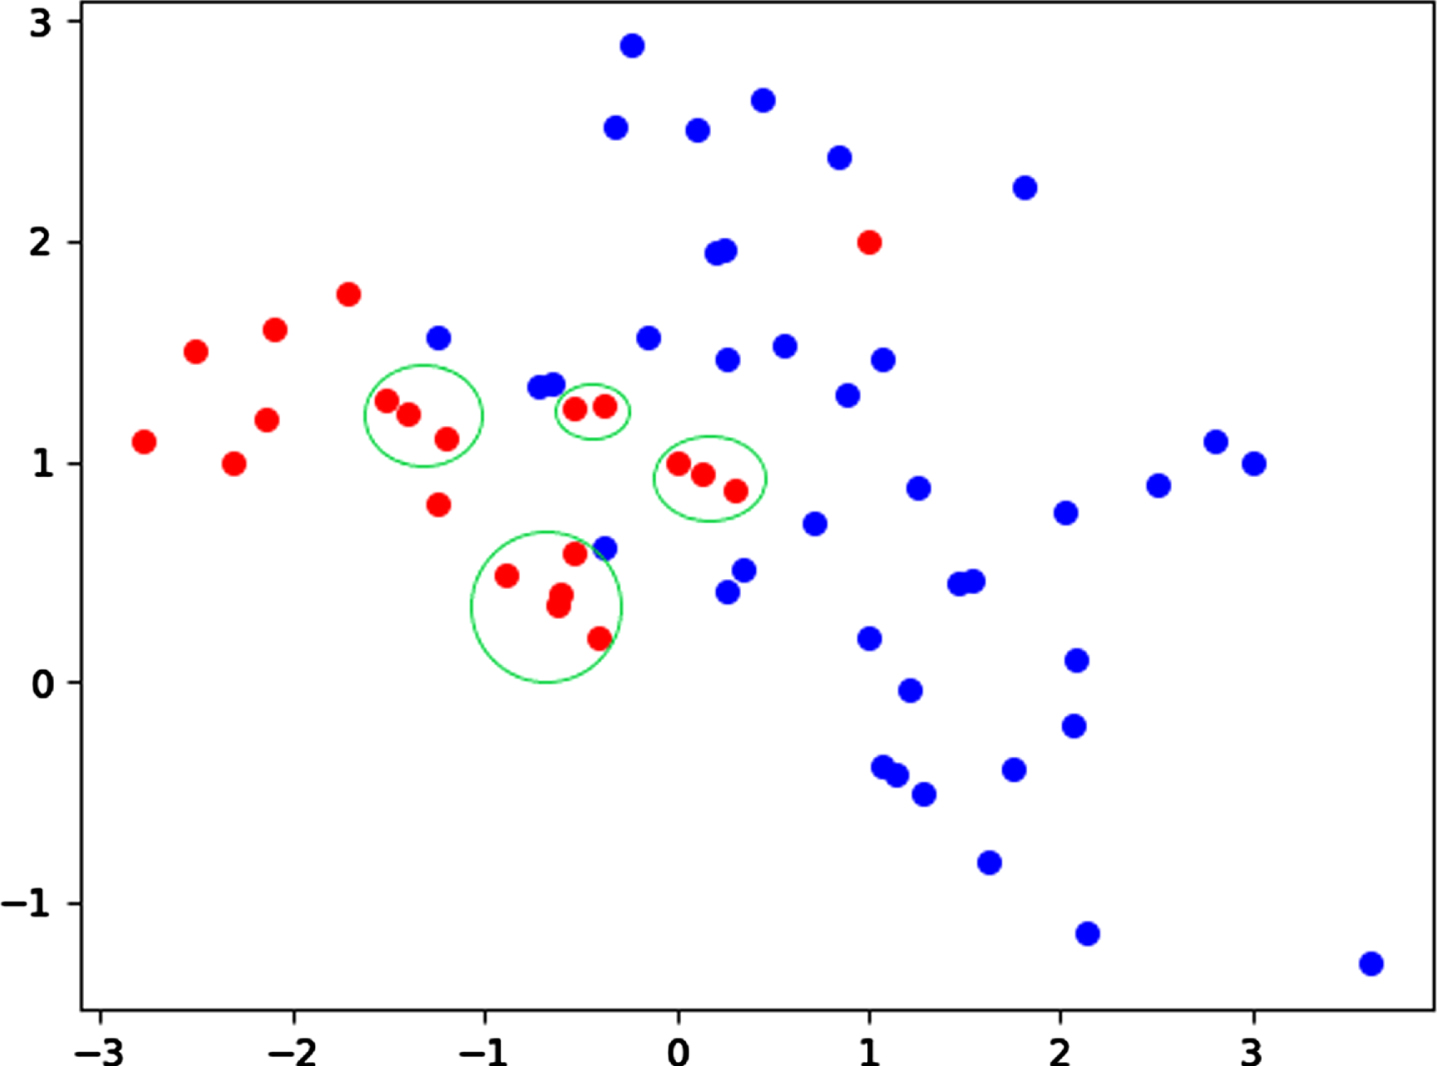
In addition, before performing intra-cluster oversampling, the sampling cluster selection strategy of CAB-SMOTE Strategy II in [46] is used to further screen the sampling clusters. First find the one with the largest number of samples in the cluster after clustering, and record the number of samples as M. Identify the number of samples in the remaining clusters, and the boundary clusters whose number of samples exceeds M/2 are reserved to continue the sampling operation afterward. For clusters with a small number of samples, it is considered that this type of data has fewer occurrences and has less impact on the final classification result. Therefore, clusters with a small amount of data are not oversampled. This can reduce the computational and time complexity, and will not have much impact on the classification results. The schematic diagram of cluster filtering strategy is shown in Fig. 4.

Schematic diagram of cluster filtering strategy.
The flow of CBB-SMOTE
The detailed steps of CBB-SMOTE

The flow chart of CBB-SMOTE.
The new sample generation formula is as follows:
During the interpolation operation, in order to avoid the influence of the noise in the data set on the classification result being amplified, no operation is performed on the noisy data. At the same time, it is necessary to set the sampling ratio of safety data and boundary data, which is based on the idea of Borderline-SMOTE. The focus of sampling operation is placed on the boundary data set so that the new data set can have more obvious positive and negative class boundaries. However, for most data sets, the safety data will occupy a large proportion, and the useful information contained therein cannot be ignored. Therefore, it is still necessary to operate the safety data during sampling. Finally, the new data subject generated by this algorithm is near the border, and new data will also be generated in the safe area. The sampling ratio of border data is greater than that of safe data. The optimal sampling ratio needs to be obtained through further experiments.
The CBB-SMOTE does not perform any operation on the noise data, because the noise data identification of this algorithm is by calculating the distance between the sample points and the surrounding points of them. Then judging the alien data in the nearest surrounding points to identify the noise data based on the position distribution of the sample points. Therefore, the possibility of special circumstances cannot be ruled out. When the classifier is used to predict the data, the noise data identified by this algorithm is still retained in the data set.
The experiment uses QAR data for experimental verification. Random forest algorithm is used as classifier. And AUC, Recall and G-means is used as the classification indicators. The superiority of this algorithm is demonstrated by comparing CBB-SMOTE with existing SMOTE and Cluster-SMOTE algorithms. Then the data processed by CBB-SMOTE algorithm is applied to several other different classifiers. Classification algorithms include Random forest, Logistic regression and Adaboost, which are three most popular methods. The general applicability of this method to different classification algorithms is further verified.
Data set
QAR is a fast storage device in the aircraft airborne recording system, which can make up for the inconvenient transcription of the flight recorder (black box), and realize the convenient access of aircraft flight data, including meteorological data, aircraft status data, etc. [48]. The data set used in this experiment is a group of QAR data sets for the judgment of the aircraft Go-Around state. According to the data characteristics, including environmental factors such as wind shear, and aircraft state factors such as fuel quantity, it is judged whether the final aircraft go-around. In this experiment, the above-mentioned problem is simplified into a two-category problem, and the indicator of whether to go around is used as the label, 1 means go-around, and 0 means no go-around. Part of the QAR data is shown in Table 1.
Part of the QAR data
Part of the QAR data
There are 3656 pieces of data in the original data set, of which the number of features (including label items) is 77. Considering the missing data and missing features, as well as some features that are useless to the classification results, the data set is preprocessed first. Delete features with serious missing data and features that are meaningless for classification. For example, all data of a feature have the same behavior. There are 3656 pieces of data in the final data after processing, of which the number of features (including tag items) is 53. The data characteristics after pretreatment are shown in Table 2.
Data characteristics after pretreatment
Accuracy is a common indicator to measure the classifier performance. But when the data set is imbalanced, the accuracy cannot well reflect the classification performance for minority class samples [49].
AUC is the area under the ROC curve, where ROC is a curve drawn according to a series of different binary classification methods. The ROC curve takes the true positive rate (TPR, also known as Sensitivity) as the vertical axis and the false positive case rate (FPR, also known as sensitivity 1 - Specificity) as the horizontal axis. It can represent the change curve of true positive rate and false positive rate under different classification standards. AUC (area under curve) is defined as the area between the ROC curve and the horizontal axis. The AUC value is often used to evaluate the performance of the model. As a numerical value, the classifier with a larger AUC is better. Since the AUC value is related to the classification situation of the classifier and does not only represent whether it is correct or not, so it is used as a classification indicator for imbalanced data [50].
In the classification task, most of the evaluation indicators are generated based on the confusion matrix, which is a standard format for expressing the accuracy evaluation. The confusion matrix is an index to evaluate the model results. Confusion matrices are often used to judge the quality of classifiers. As shown in Fig. 6.
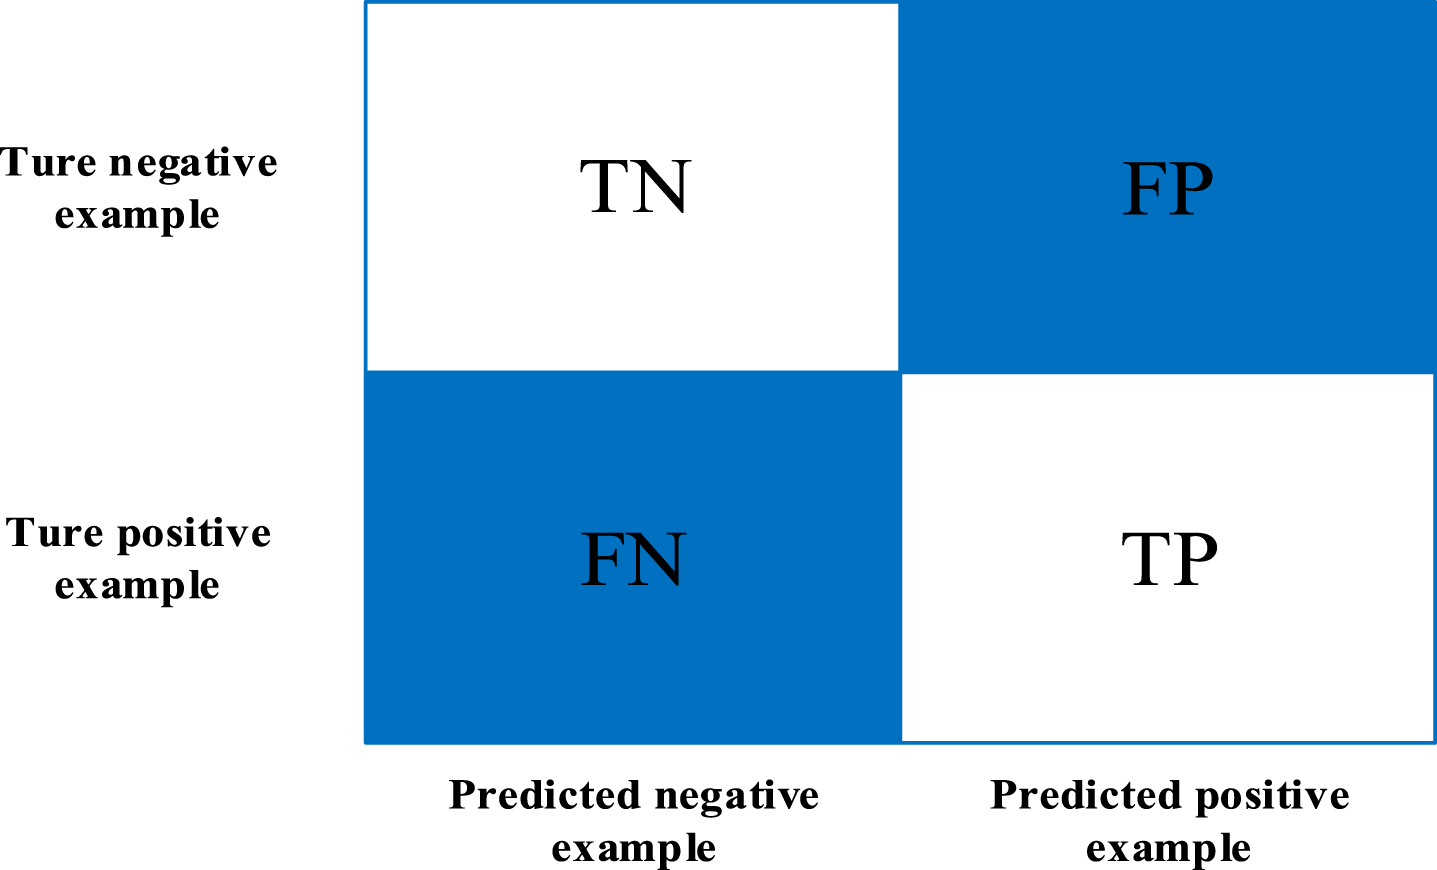
Confusion matrix.
The Recall rate represents the probability that the actual positive sample is correctly predicted to be positive. The Recall rate can be applied to evaluate the quality of the model.
The Recall is calculated as follows.
Corresponding to the Recall is the Specificity. The formula is as follows.
The value of G-means depends on the accuracy of the majority class (true positive rate) and the accuracy of the minority class (true negative rate). Only when the values of both are large, the value of G-means will be large. It can be said that geometric mean G-means is a standard that can reasonably evaluate the overall classification performance of imbalanced data sets [51].
The experiment first uses the original QAR data for classification, and obtains the classification of the original data by the classifier. Random forest is a supervised learning algorithm and an integrated model composed of multiple decision trees. Logistic regression is a generalized linear regression model. Adaboost is an iterative algorithm that trains different classifiers (weak classifiers) for the same training set, and then combines these weak classifiers to form a stronger final classifier (strong classifier). The following shows the experimental results of the classifier based on random forest algorithm.
The distribution of the original data is shown in Fig. 7. The experimental results of the Go-Around prediction using the original data are shown in Figs. 8, 9. All experimental results were obtained after 5-fold cross-validation.
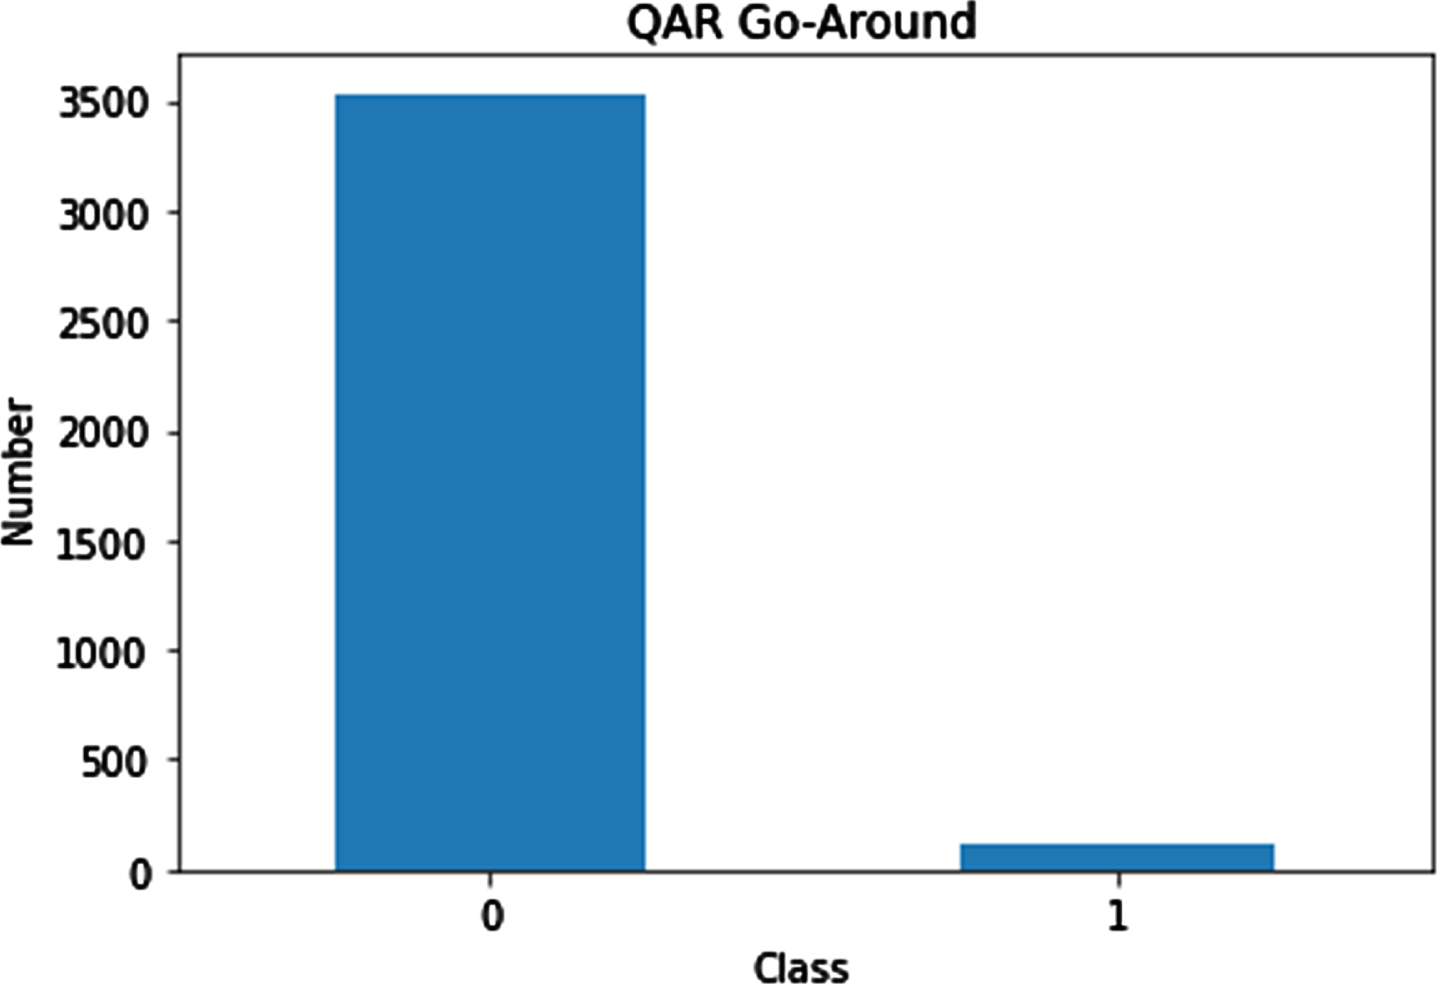
Distribution of original data.
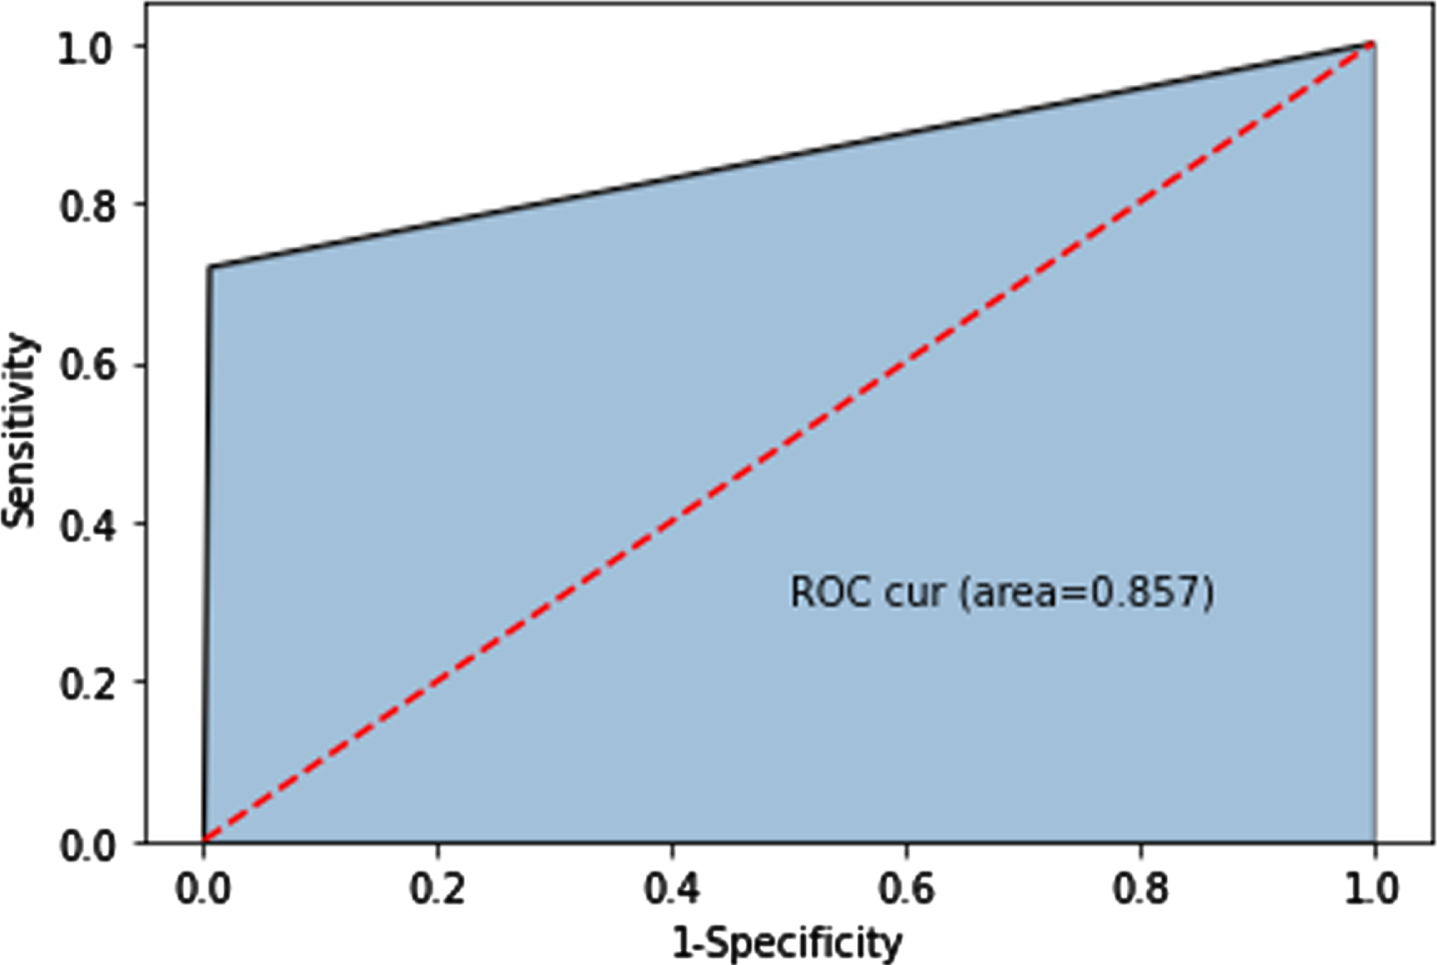
AUC value of original data classification result.

Confusion matrix of original data classification results.
The original QAR data is balanced by the CBB-SMOTE and according to the algorithm flow in the previous section. However, the optimal sampling ratio cannot be determined, and the optimal sampling ratio will change for different data. Therefore, some experiments have been conducted here to find the best sampling ratio.
After the boundary division and clustering of the QAR data, it is found that the contour coefficient value is the highest when the safety data in the test set is divided into 5 clusters, and 4 clusters are selected according to the sampling cluster selection strategy for the next interpolation operation. Then use the grid search method to set different sampling ratios for safety data and boundary data to find the data sampling ratio with better classification effect. Four-part experiments were carried out for the boundary data sampling ratio of 50 (safety data sampling ratio of 40), 100 (safety data sampling ratio of 35), 150 (safety data sampling ratio of 31), and 200 (safety data sampling ratio of 24).
The final classification results of different sampling ratio are shown in Figs. 10–13.
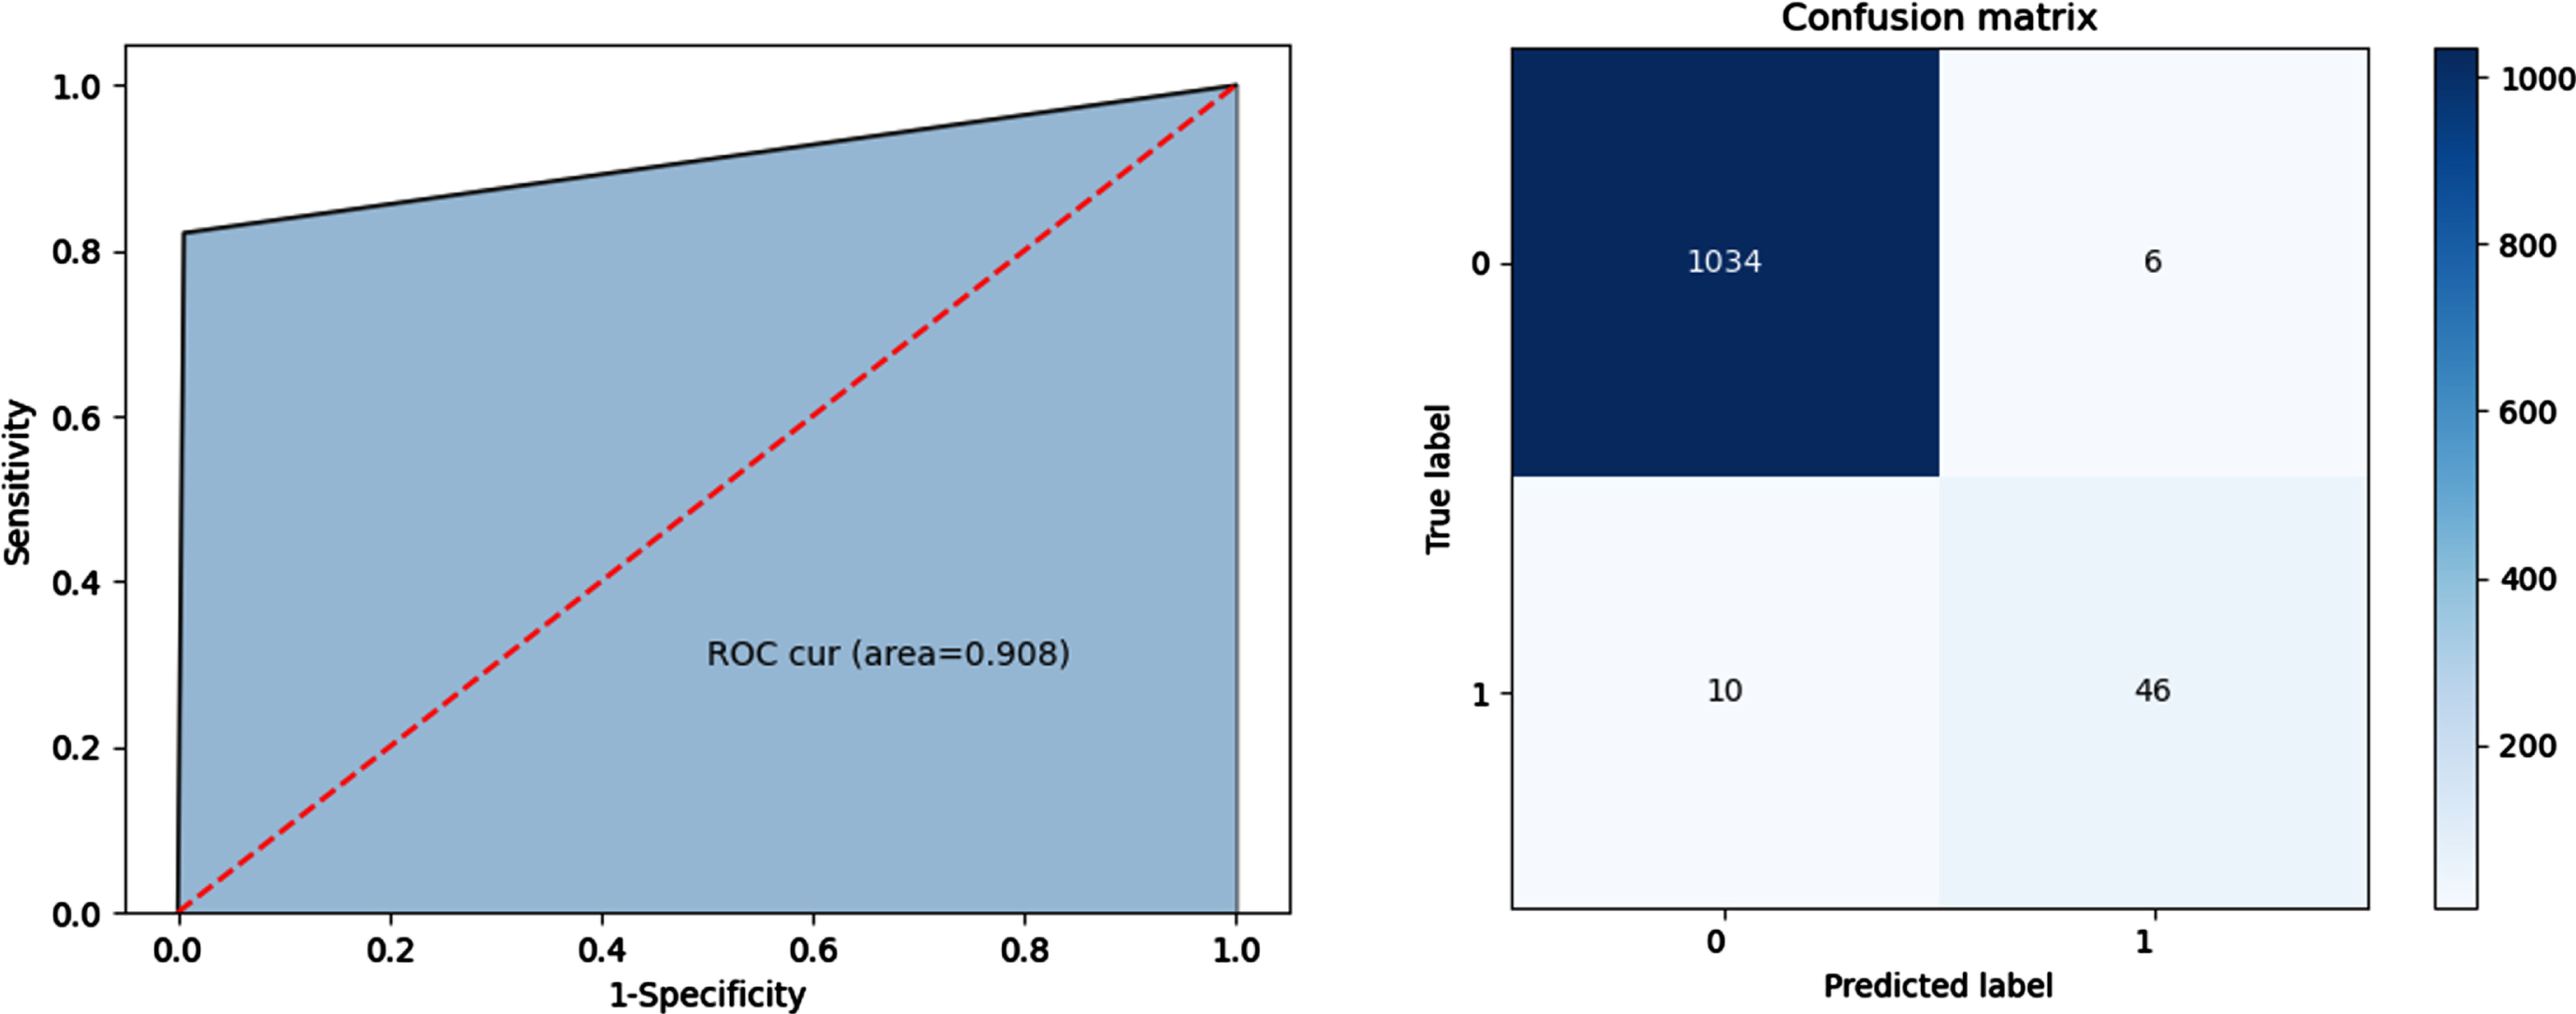
Classification results of reconstructed data by CBB-SMOTE (boundary data sampling ratio is 50, safety data sampling ratio is 40).

Classification results of reconstructed data by CBB-SMOTE (boundary data sampling ratio is 100, safety data sampling ratio is 35).
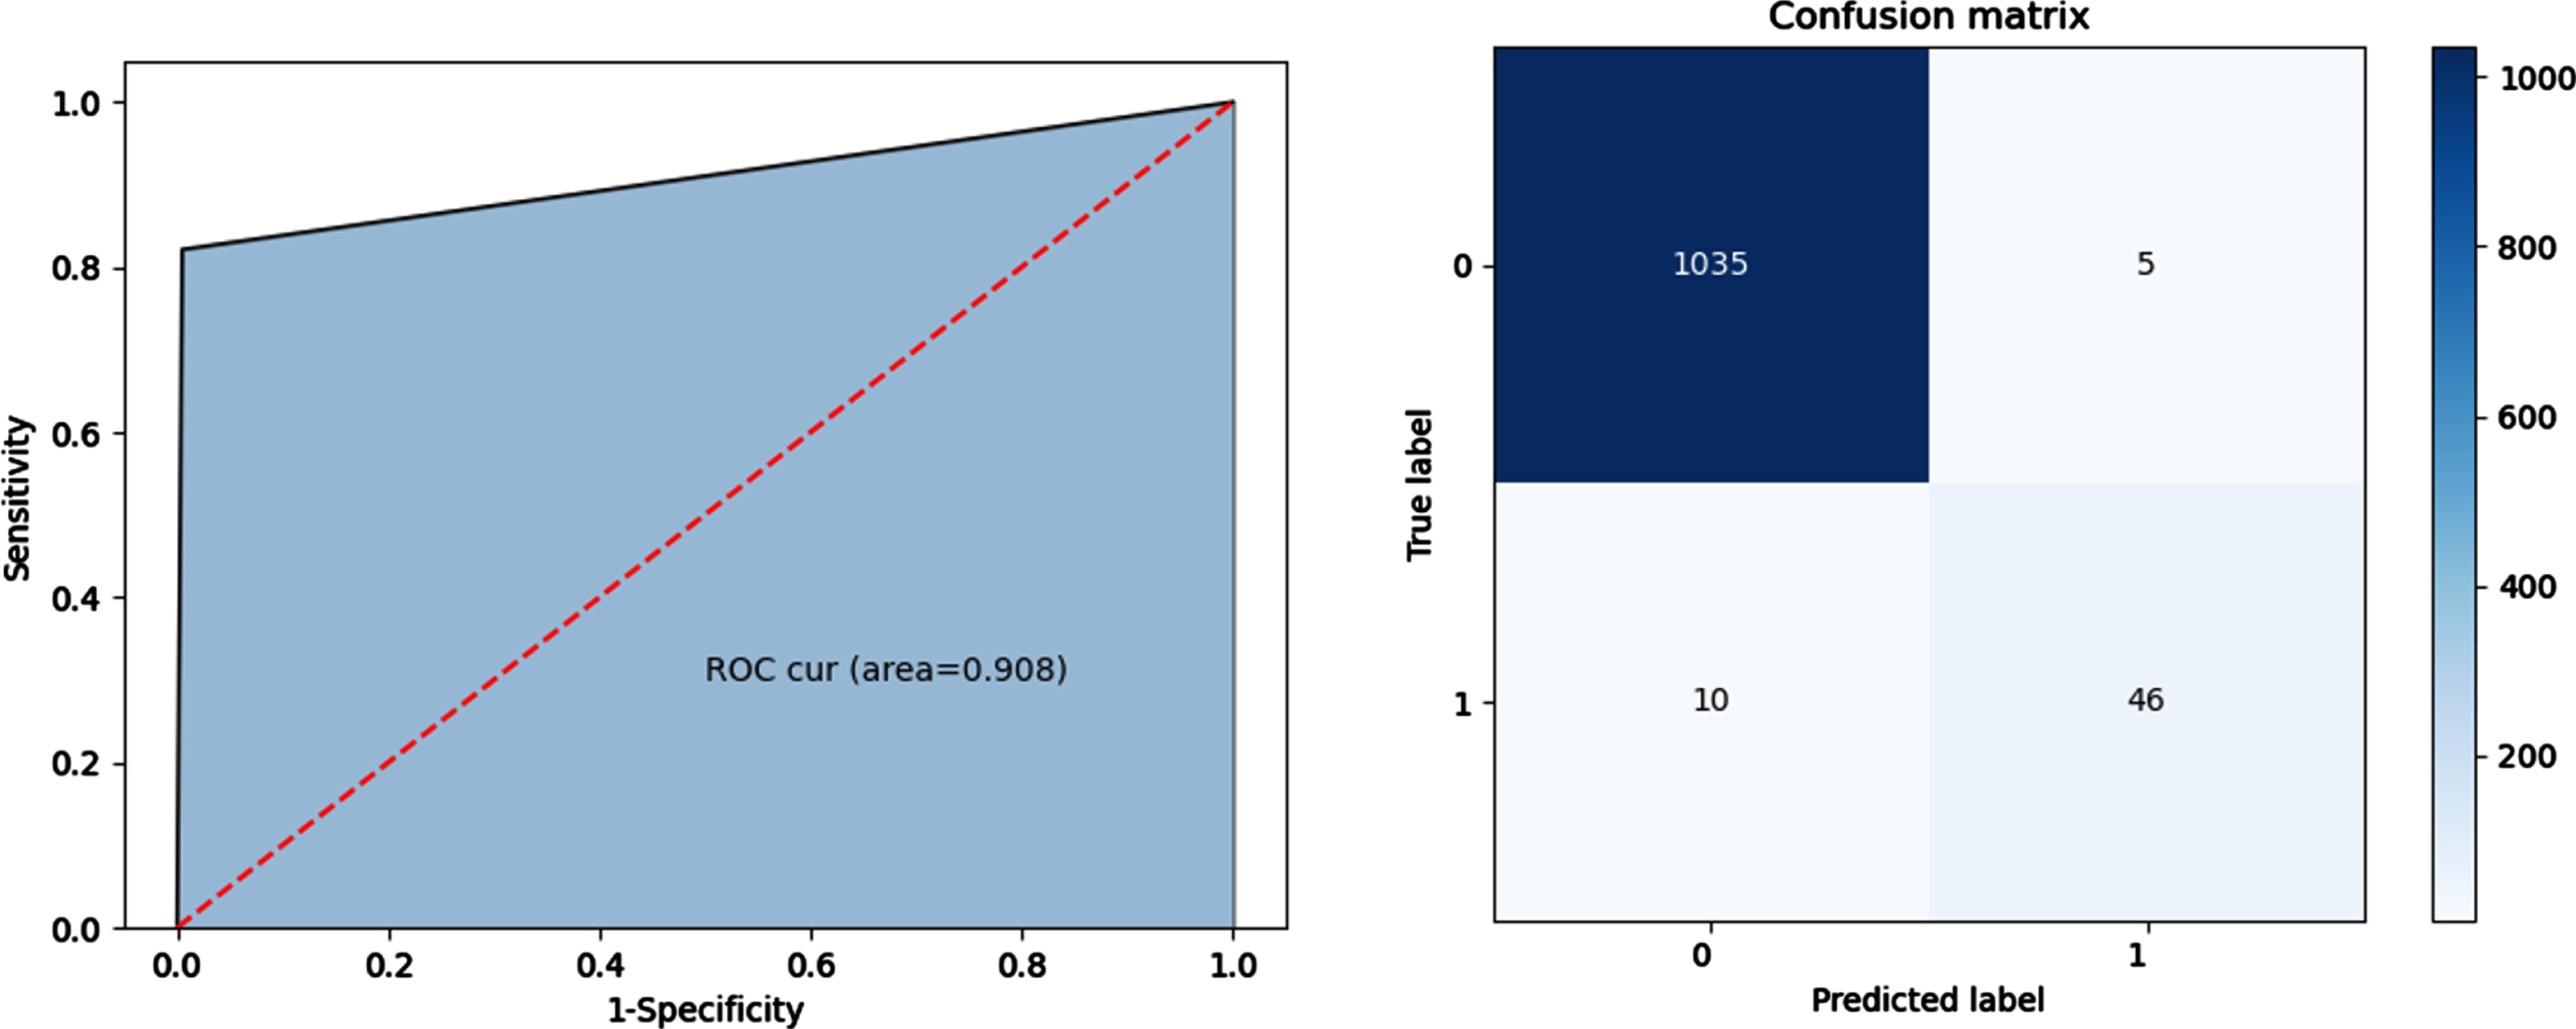
Classification results of reconstructed data by CBB-SMOTE (boundary data sampling ratio is 150, safety data sampling ratio is 31).

Classification results of reconstructed data by CBB-SMOTE (boundary data sampling ratio is 200, safety data sampling ratio is 24).
According to the confusion matrix obtained from the above experiments, the Recall and G-means of the current results are calculated by formula (5) and (7). In order to display the evaluation results more intuitively, the three evaluation indicators are summarized. The summary results are shown in Fig. 14.
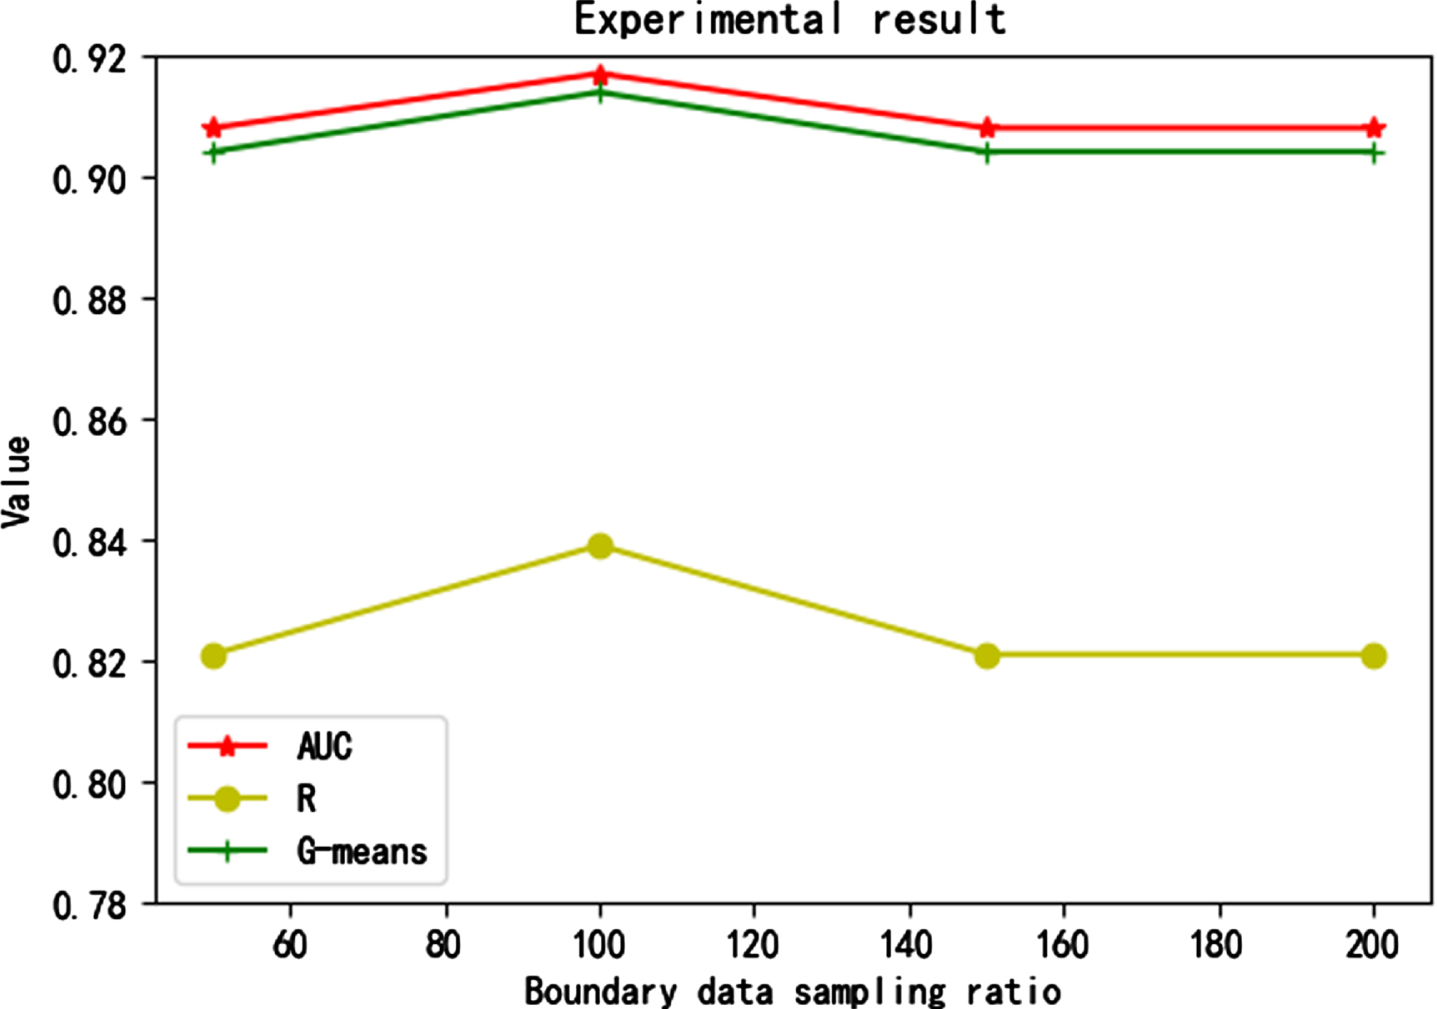
Classification results of different sampling ratios by CBB-SMOTE.
Compare the experimental results of the CBB-SMOTE algorithm with those of the two basic algorithms, SMOTE and CM. At the same time, two novel improved algorithms based on SMOTE were compared, namely KMeansSMOTE [52] and GeometricSMOTE [53, 54]. The experimental results are shown in Table 3.
Comparative analysis of algorithms (Random forest classifier)
The original data and the data after being balanced by different algorithms are applied to other classifiers. The experimental results are shown in Tables 4, 5.
Experimental results of classification (Logistic regression)
Experimental results of classification (Adaboost)
It can be seen from the results in Table 3 that for this QAR data set, among the comparative tests of several algorithms, the CBB-SMOTE algorithm has the best classification effect on the reconstructed data set when the boundary data sampling ratio is 100 and the safety data sampling ratio is 35.Taking the evaluation index G-means as an example, after the CBB-SMOTE algorithm is set to an appropriate sampling ratio, the G-means value can be increased by 1.2% compared with the Cluster-SMOTE algorithm and 1.8% compared with the basic SMOTE algorithm (performance on random forest algorithm). From the experimental results in Tables 3–5, it can be seen that on regardless of which classifier, the CBB-SMOTE performs best on various indicators. This can prove the universality of the algorithm and is not affected by the classifier. CBB-SMOTE algorithm introduces the idea of reclassifying minority data in Borderline-SMOTE, and improves the target object of K-means clustering in Cluster-SMOTE algorithm. It can be seen that the classification accuracy of the new data set generated by this algorithm is improved compared with the original algorithm, both for the positive class and for the negative class. This is exactly the promotion effect that we want to get when dealing with imbalanced data.
During this experiment, it was found that the experimental results of CBB-SMOTE were the same when the sampling ratio of the boundary data was 200 and was 150. This may be due to the over-fitting phenomenon caused by the excessive sampling ratio. The experiment found that setting different sampling ratios for boundary data and safety data in minority class samples has a significant impact on the final classification results. This also provides an idea for the subsequent research that when dealing with the imbalance problem in the data, it is not necessary to excessively pursue the absolute balance in the number of samples from different classes. Cleverly utilizing sampling strategies to find data structures suitable for the experimental samples, achieving relative balance between different samples. Thus, the purpose of improving classification accuracy and target recognition accuracy is achieved.
Since the CBB-SMOTE algorithm improves the clustering strategy and oversampling strategy of the previous proposed algorithm, while the new sample generation is still done based on the SMOTE algorithm. So the algorithm still has a great scope of application. In this paper, although only conducted experiments related to flight accidents, due to the similarity of such data, the CBB-SOMTE algorithm can be applied to fields such as fault diagnosis, disease diagnosis, and accident prediction.
Conclusion
In this paper, a CBB-SMOTE algorithm is proposed, which improves the positive and negative class boundary ambiguity and k-neighbor selection problem existing in the original SMOTE algorithm. At the same time, the combined use of clustering operation and synthetic minority oversampling technique is optimized. And a biased oversampling method is proposed, which can take into account both safety data and boundary data. By using a group of QAR data, taking AUC, Recall and G-means as evaluation indexes, and comparing with SMOTE and Cluster-SMOTE algorithms. The feasibility and superiority of CBB-SMOTE algorithm in flight accident prediction problem are studied. The experiments show that CBB-SMOTE has better performance and considers more comprehensive factors, which also meets the requirements of aircraft flight safety. Its AUC value can reach 0.917, the Recall can reach 0.839, and the G-means can reach 0.914. Compared with the traditional SMOTE algorithm, all three aspects have been improved.
It is found that controlling the data structure by sampling ratio will have an important impact on the final experimental results. And one of the problems of the currently implemented CBB-SMOTE algorithm is that the algorithm itself cannot independently determine the optimal sampling ratios of the safety data and boundary data. So in the future, the sampling ratio will be used as a parameter of the algorithm subsequently to further improve the convenience of the algorithm. When the algorithm is applied to different datasets in the future, some optimization algorithms can be used to maximize the evaluation indexes of the classification results with the sampling ratio as a parameter. So as to realize that the algorithm can adaptively determine the best sampling ratio of data and further improve the classification effect.
Footnotes
Acknowledgments
The authors would like to thank all the reviewers for their constructive comments. This work was supported in part by the National Natural Science Foundation of China (Grant No. U2133205, U2033214), and the Central University Basic Scientific Research Business Fee Project of Civil Aviation University of China (2000420534).