
Abstract
Stratifying long-tail customers and identifying high-quality customers with high growth potential are crucial for civil aviation companies to explore new profit growth points. This paper proposes a long-tail customer stratification model based on clustering ensemble to address the problems of insufficient attention to long-tail customers in previous studies and the low accuracy and lack of accuracy testing of single clustering algorithms. First, the Bayesian information criterion is used to determine the optimal number of clusters. Then, an ensemble framework integrating the Gaussian mixture model, spectral clustering, Two step clustering and K-means algorithm is constructed, and the stacking and bagging ensemble methods are used for the cluster ensemble. Finally, three different indicators are used to evaluate the algorithm performance. Experimental results indicate that compared with single clustering algorithms, the Stacking algorithm increases the silhouette coefficient by 14.77% to 27.11%, the Calinski-Harabasz index by 38.83% to 122.18%, and the Davies-Bouldin Index by 19.38% to 98.04%. This indicates that each clustering has high cohesion and separation, with samples within a category being more closely related and those between categories having clear boundaries. It shows that the Stacking algorithm more accurately stratifies long-tail customers with similar consumption behaviors into different categories, achieving customer stratification.
Introduction
With the development of society, China’s aviation passenger transport business has developed rapidly, and market demand continues to increase, making customers the most important asset of each airline company [23]. In fierce market competition, small and medium-sized customers in the tail market have become the new growth point for enterprise profits [20]. However, the existing studies related to customer stratification in the civil aviation field focus on the identification and maintenance of high-value customers of enterprises [30] and pay insufficient attention to low-value long-tail customers, suggesting that enterprises should not pay too much attention to them [10]. As a supplement and improvement of Pareto’s law in the Internet economy [21], the long-tail theory emphasizes that although the base of long-tail customers is large, there are also high-quality customers with great potential value, who are either new customers or old customers who have become loyal to the company after multiple comparisons. Therefore, it is necessary to stratify long-tail customers and then carry out differentiated management to realize customer value enhancement [6]. How to effectively differentiate and stratify long-tail customers with highly similar consumption behaviors is an urgent problem for companies to solve.
Machine learning is one of the most important technologies in the 21st century [1]. As an unsupervised machine learning technique, clustering can divide data into several clusters based on similarity so that objects in the same cluster are similar to each other, while objects in different clusters are different from each other [24]. Chen et al. (2016) used hierarchical clustering and K-means algorithms to segment the environmental behaviors of Taiwan civil aviation customers [7]. Chiang (2017) used the Ward method to divide airline customers into four categories and created association rules using the supervised Apriori algorithm [30]. Dehghani Zadeh et al. (2018) improved the K-means algorithm using the imperial competition algorithm to achieve civil aviation customer stratification [23]. These studies either combined algorithms to obtain more comprehensive customer behavior characteristics or improved algorithms to obtain better results but only used a single clustering algorithm, ignoring the inherent ambiguity of the algorithm and its matching with the data set, which cannot fully reveal the intrinsic structure of the data set and obtain accurate clustering results and has low robustness [29]. For a large amount of highly similar data, the clustering accuracy and efficiency of a single method cannot be balanced [16].
Ensemble learning is a research hotspot in the field of machine learning, where the results of each machine learning algorithm are integrated into a framework in some way so that the complementary information of each algorithm can be used effectively to improve the performance of the overall model [32]. In the unsupervised field, it is called the clustering ensemble, which uses clustering algorithms to generate a series of clustering partitions and combines these partitions together to obtain a consensus solution [32]. As it fully utilizes the information provided by clustering members, clustering ensemble algorithms can significantly improve the accuracy, robustness, and stability of a single clustering algorithm [32]. There have been studies using cluster ensemble techniques to achieve customer stratification, such as Farvaresh & Sepehri (2011), who first used a self-organizing map neural network and K-means algorithms to cluster customer data of a telecommunications company and added category labels and then used decision trees, neural networks, and support vector machines as individual classifiers using stacking and other strategies for integration [12]. Yang et al. (2020) used a semi supervised spectral clustering ensemble (SSSCE) algorithm to stratify automotive after-sales service customers and demonstrated that the customer stratification results of the SSSCE algorithm outperformed those of a single spectral clustering algorithm [33]. Huang et al. (2020) integrated the Clara algorithm and K-means to build a customer stratification model and achieved precision marketing for tobacco retailing [11]. Although cluster integration is widely used in major fields, no study has been conducted to stratify civil aviation long-tail customers using cluster ensemble algorithms.
In summary, in previous studies on the stratification of civil aviation customers, there has been insufficient attention paid to long-tail customers and insufficient depth of value mining, as well as the problem of using a single clustering algorithm with low accuracy and a lack of accuracy testing. From the perspective of the long tail theory, this paper uses clustering ensemble algorithms to stratify civil aviation long tail customers, discover high-quality customers with growth potential among long tail customers, and manage customer relationships well, in order to maximize the retention of valuable existing customer resources for civil aviation enterprises.
The main contents include: Firstly, based on Lawrence’s classic customer stratification framework and the RFM model, considering the impact of service cost on customer value, we construct the RFMC model and use self-organizing map neural network to identify long-tail customers; Secondly, the LTPNDG model reflecting the growth potential of long-tail customers in civil aviation was constructed, and clustering ensemble algorithms based on Stacking and Bagging were used to stratify long-tail customers; Then, three different clustering performance evaluation metrics are used to assess the effectiveness of clustering ensemble, and the optimal long-tail customer stratification result is selected accordingly; Finally, according to the consumption behavior characteristics and growth potential of different levels of customers, targeted marketing management measures are proposed.
Relevant introduction
The performance of ensemble learning largely depends on the diversity between individual classifiers [26]. To achieve better clustering results, different types of classifiers can be combined. Classic clustering algorithms include partition-based, hierarchical, density-based, and model-based methods [16].
Single clustering algorithm
Gaussian mixture model
Gaussian Mixture Model, or GMM for short. It is a probabilistic model that uses a probability density function obeying a Gaussian distribution to describe the cluster centers, assigns similarity to data samples by calculating their probability of satisfying the Gaussian distribution, and then corrects the probability to divide the clusters [17]. The basic functions are as follows:
The core idea of spectral clustering, as a division-based clustering algorithm, is to transform the unsupervised clustering problem into a division of undirected graphs, which can achieve clustering in sample spaces of arbitrary shapes and converge to the global optimum [19].
For a data set X = (x1, x2, . . . , x n ) ∈ Rn×m, each sample has m attributes, and a certain sample x i can be represented as x i = (xi1, xi2, . . . , x im ), i = 1, 2, . . . , n. The basic principle of classic spectral clustering is as follows:
First, construct the similarity matrix A ∈ Rn×n:
Then, select the top K largest eigenvalues of L and form an n×K matrix Y with their corresponding eigenvectors. Normalize Y to obtain matrix V, where
Twostep is an improved clustering algorithm that uses hierarchical clustering ideas. It can handle mixed data of categorical and continuous variables and automatically determines the optimal number of clusters in the clustering process based on the Bayesian Information Criterion (BIC) [28], solving the problem of having to determine the number of clusters beforehand when facing unknown data set distributions.
If for the existing class j and class s, the clusters after the merger of the two classes are denoted as < j, s >, the distance between them is defined as the difference between the log-likelihood estimate
K-means is a classical division-based clustering method that uses the Euclidean distance as the similarity measurement method and iteratively searches for cluster centers [17]. It has the advantages of high efficiency, low computational complexity, easy implementation, and applicability to large-scale datasets [25] and is widely used in clustering integration research [1]. The basic functions are as follows:
Assuming that the data set is X = {x1, x2, . . . x
i
, . . . , x
n
}, x
i
∈ R
d
, n represents the number of samples, d represents the feature dimension of the sample, x
i
= (xi1, xi2, . . . , x
id
). C ={ C1 , C2, . . . , C
j
, . . . , C
k
} denotes the division of X into k clusters, then:
These four clustering algorithms are heterogeneous and perform well in a wide range of applications, and they have significant differences in learning rate, efficiency, ability to handle outliers, discrete values and noisy data, and efficiency of processing large sample data to meet the requirements of ensemble learning for individual learners.
Stacking ensemble learning
Stacking [5] and bagging [22] are two mainstream ensemble learning methods that are widely used. Stacking is popular among hybrid models by fusing multiple classification models through a meta-learner, which can build all-purpose algorithms in the form of complementary strengths and improve prediction efficiency [29] and has the advantages of simple structure, high performance, and the ability to fuse multiple heterogeneous learners [14]. As shown in Fig. 1, it usually contains two layers. In the first layer, several base learners are trained based on complete raw data to obtain corresponding prediction results, and then in the second layer, the meta-learner is fitted based on individual outputs and outputs the final results [14].

Schematic diagram of the stacking ensemble learning structure.
Stacking ensemble learning requires that the base learners in the first layer have high diversity and accuracy, and the meta-learner in the second layer is concise, efficient, and low in complexity [14]. Therefore, in this paper, we comprehensively consider using GMM, Spectral, and Twostep as base learners and using K-means as the meta-learner.
Bagging is the most famous representative of parallel ensemble learning methods, where there is no dependency between the base learners and strong learner models can be efficiently constructed by parallel training [13]. As shown in Fig. 2, during the bagging ensemble learning process, the base learners are trained in parallel and obtain prediction results. Then, the majority voting method is often used to integrate the prediction results of the base learners and obtain the final class label [26].
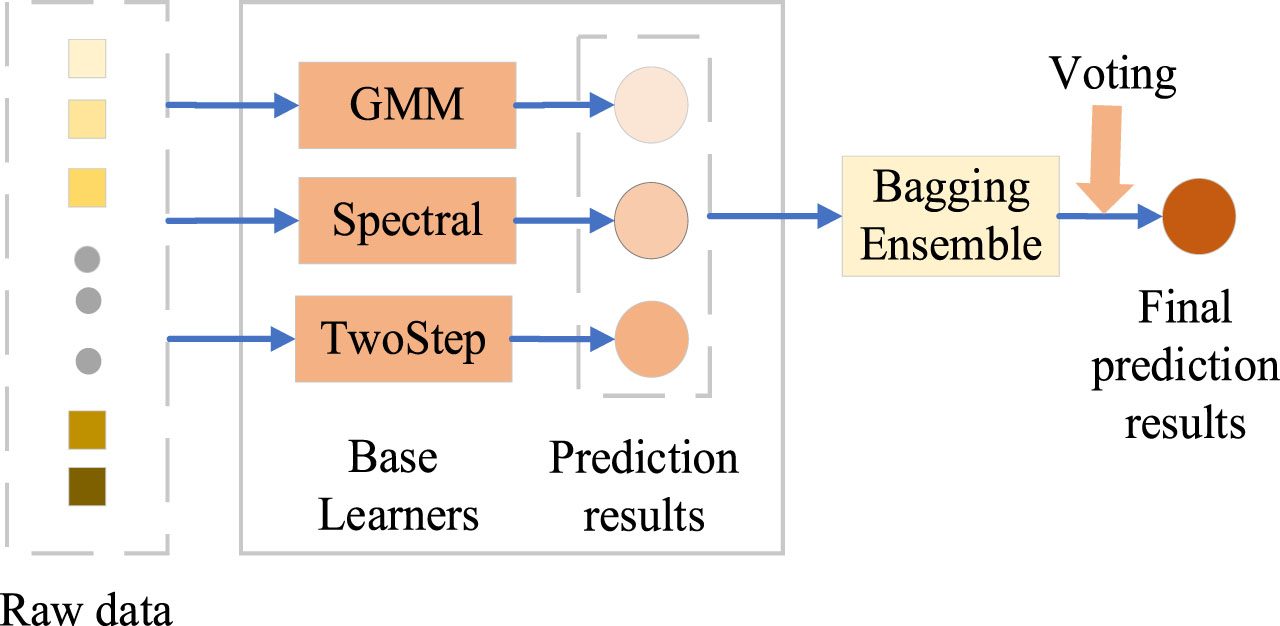
Schematic diagram of the bagging ensemble learning structure.
The long tail theory, first proposed by Chris Anderson in 2004, suggests that as long as storage and distribution channels are large enough, poorly selling products will occupy a market share similar to that of a few popular products [4]. In the Internet era, the success of online retailers is largely attributed to the profitable and previously untapped “tail market” [27]. The implication of this for customer relationship management is that the large base of long-tail customers as a large group is a potentially more concentrated market that can be lucrative for companies to value and tap into long-tail customers [31]. Moreover, in the era of big data, enterprises can make use of big data for customer maintenance and market expansion and tap long-tail customers to further enhance their competitiveness and operational efficiency [34]. Therefore, in this paper, from the perspective of long-tail theory, an ensemble learning method is used to establish a long-tail customer stratification model to more accurately distinguish long-tail customers with similar consumption behaviors.
First, civil aviation long-tail customers are identified, then stratification indicators are constructed based on the consumption behavior characteristics of long-tail customers, and the optimal number of clustering clusters is determined based on the Bayesian Information Criterion (BIC). Next, each base learner unfolds according to the optimal number of clustering clusters to obtain the primary clustering result, and two ensemble methods are used for ensemble clustering. Finally, the clustering performance evaluation indicators are used to evaluate the clustering effect and obtain the optimal stratification result. The process of long-tail customer stratification is shown in Fig. 3. The pseudo code for the Stacking clustering ensemble process is shown in Algorithm 1, and the pseudo code for the Bagging clustering ensemble process is shown in Algorithm 2.
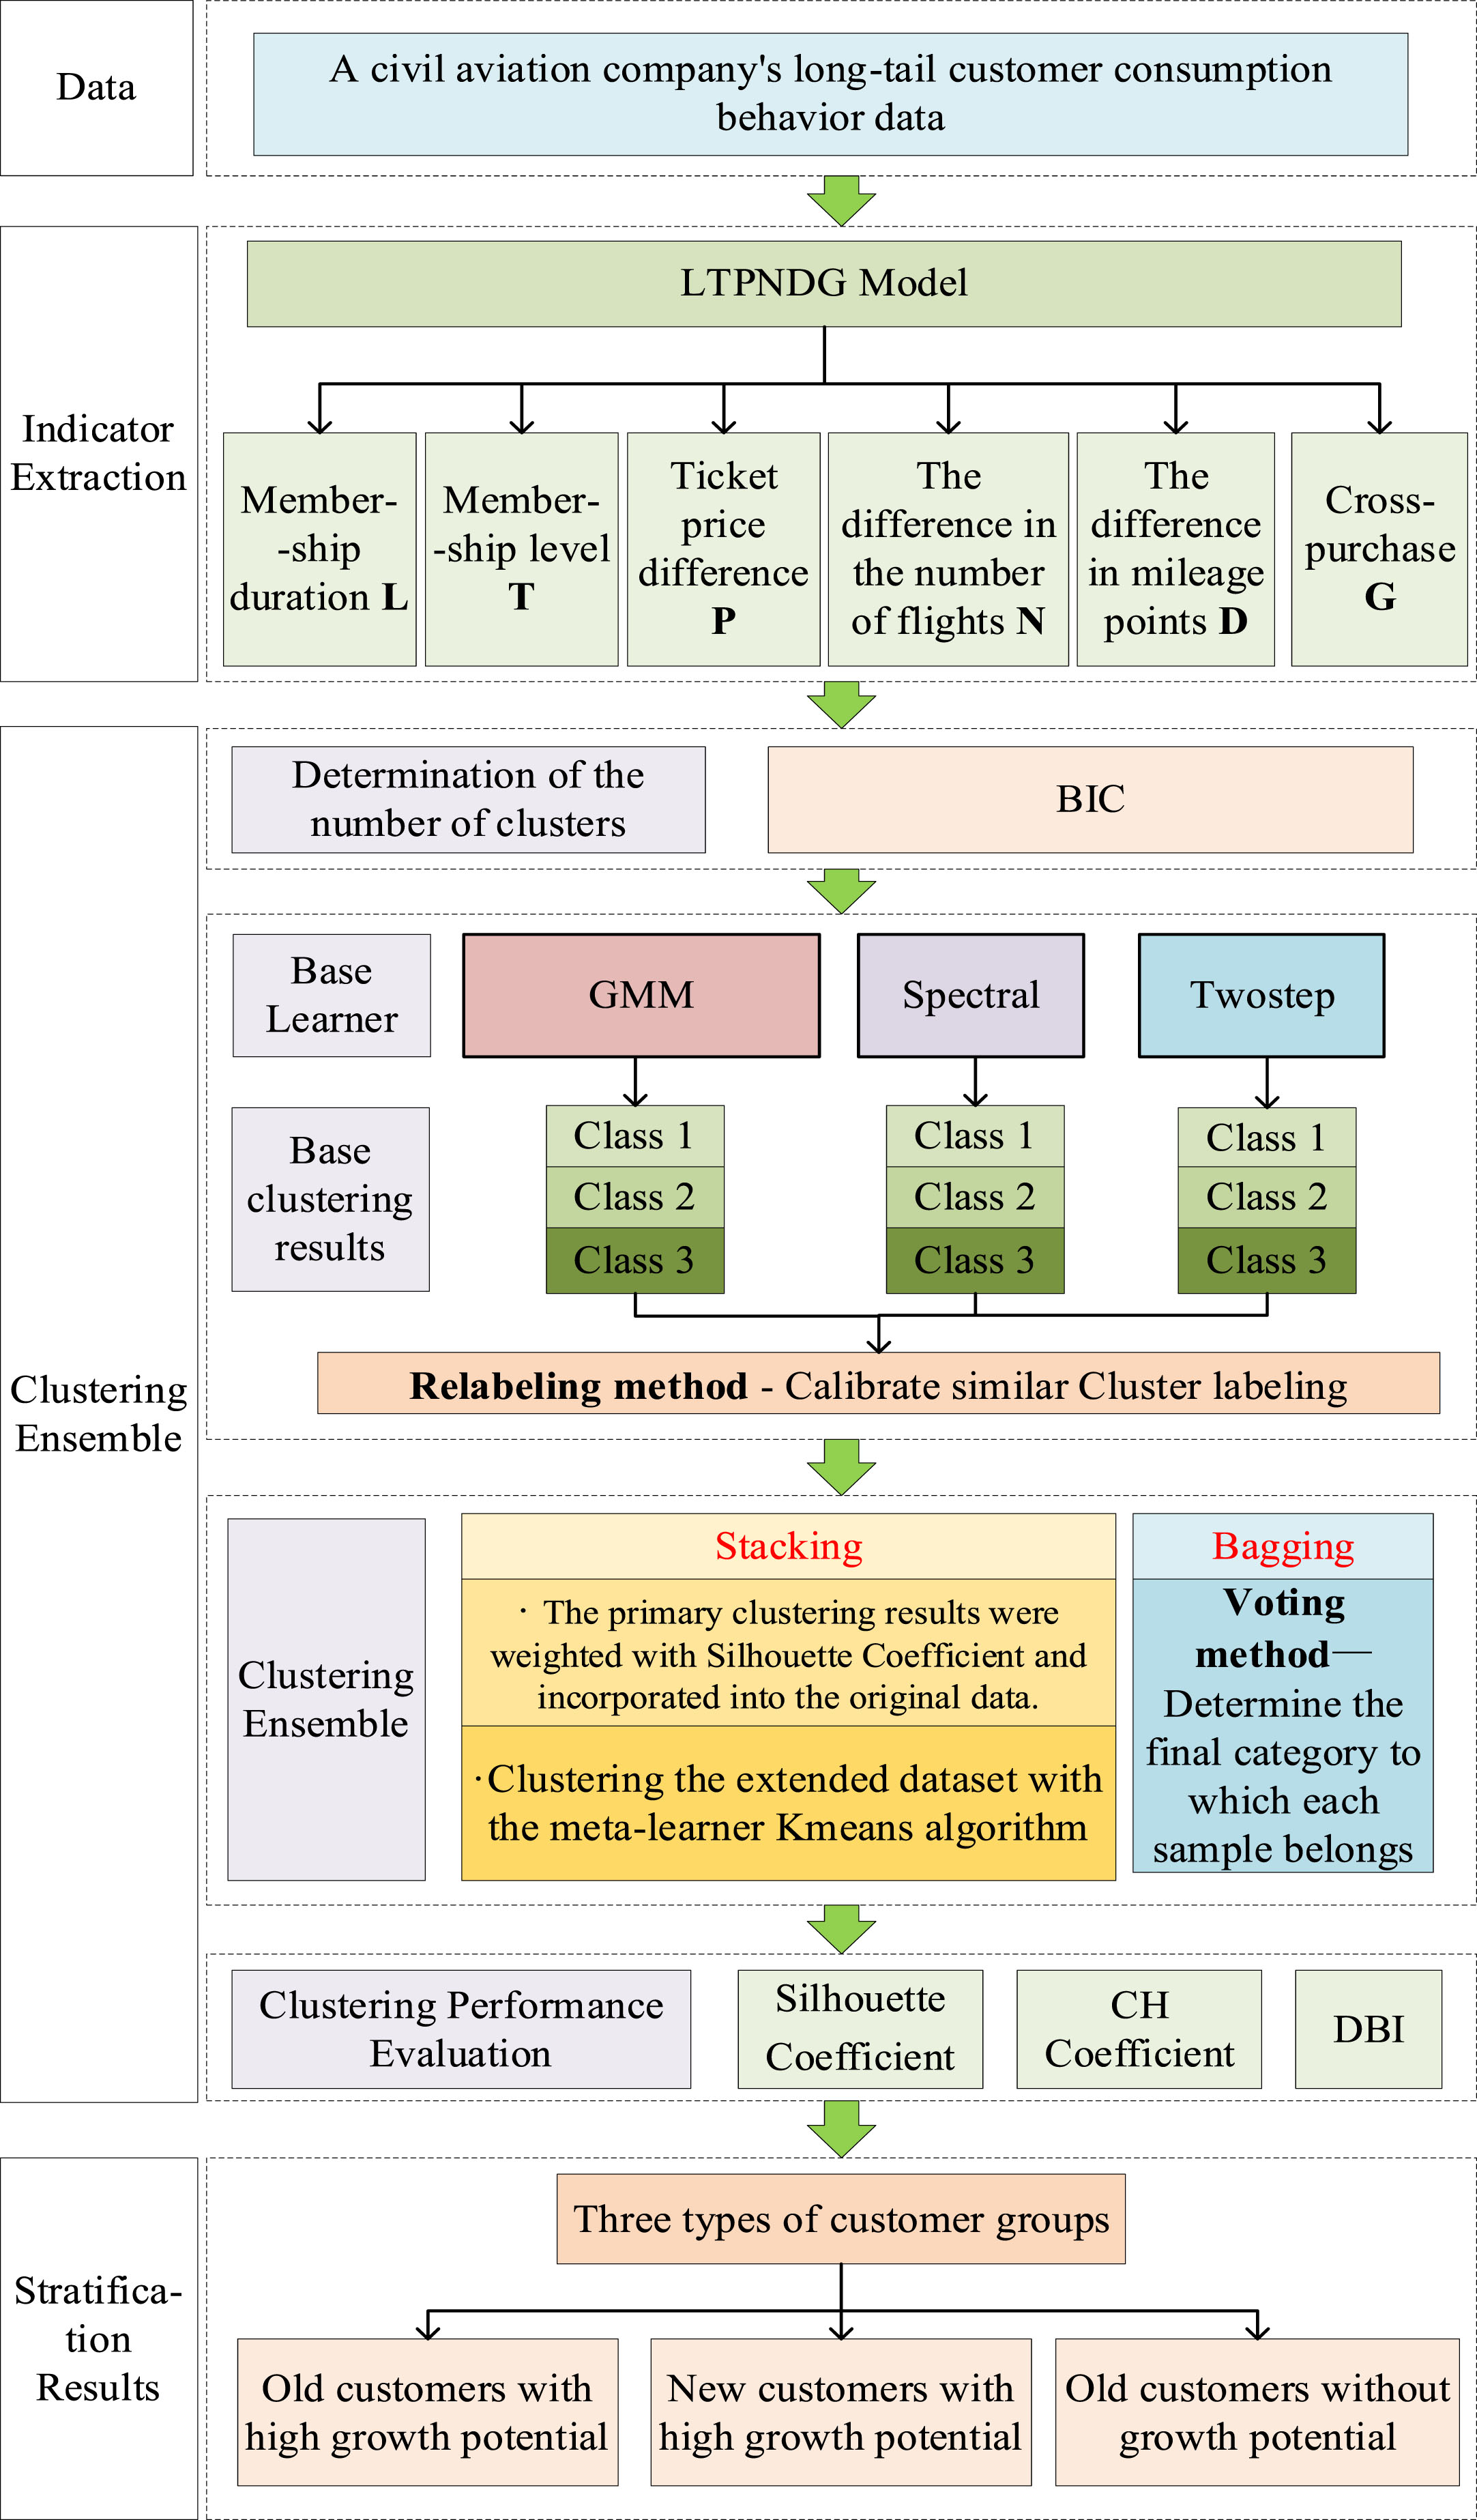
Long-tail customer clustering ensemble hierarchy flow chart.
To accurately identify long-tail customers, this paper improves the classic RFM model based on the classic customer stratification framework proposed by Lawrence and other scholars, as well as the consumption behavior characteristics of civil aviation customers. The RFMC model is constructed, and then the Self-Organizing Map (SOM) neural network clustering is adopted.
Data preprocessing
The original data consisted of 62,988 records with 44 attribute features. Among them, there are 689 records containing null values and 1036 records with abnormal values, totaling 1725 records, which account for a relatively small number. The total number of valid data after cleaning is 61263.
RFMC model construction
Transaction time probability denotes the likelihood that a customer will spend money again, and is denoted by the letter R. Therefore, it is assumed that the consumption behavior of the same customer conforms to the standard normal distribution, and the probability of repurchase reaches the peak of the standard normal distribution curve when the time interval between the latest consumption is equal to the average consumption interval.
Let the distance from the last transaction time be x, and t be the average flight interval of the customer. Because it is a standard normal distribution, the mean u = 0 and the standard deviation σ = 1. The formula is as follows:
Transaction frequency indicates the number of customer transactions and is denoted by the letter F.It reflects the level of customer activity. The formula is as follows:
The average kilometre price represents the average unit fare per kilometre flown and is denoted by the letter M. The calculation is as follows:
Cost-to-service indicates the cost paid by the company in the whole process of selling products and providing services to customers and is denoted by the letter C. The airlines provide various value-added services to retain customers, such as customers can redeem their points for a proportion of goods or enjoy services such as upgrades in the company’s official website mall, or enjoy different discounts on air ticket services through membership levels. This is all a cost of service paid by the company.
According to the research of Lawrence and other scholars, when selecting indicators to measure the service cost of enterprises, the four aspects of feasibility, measurability, reliability and commonality of data indicators can be considered [8], and the actual situation of airline enterprises and the measurability of the value of value-added services provided are combined to calculate the service cost of customers by using the total accumulated points cost and the average discounted fare, with the formula:
Indicator weights a and b were determined using a high confidence objective indicator weight determination method, the entropy weight method [36], in the following steps:
First, the data are standardized to eliminate the effects of magnitudes:
Second, the information entropy e
ij
of each indicator is:
Finally, the weights of each indicator w
j
are determined:
The four indicators after feature extraction are standardized by Z-score to eliminate the effect of different magnitudes. Where Z
i
denotes the value of the i feature after standardization, i denotes the value of the four feature metrics taken,
Using the Self-Organizing Map (SOM) neural network to cluster the standardized RFMC model, as shown in Fig. 4, four customer groups with significantly different behavioral differences were obtained.
According to Lawrence’s classic customer stratification framework [9] and their mean scores on the four RFMC indicators to stratify them as core, opportunistic, service drain and marginal customers, the results are shown in Table 1.
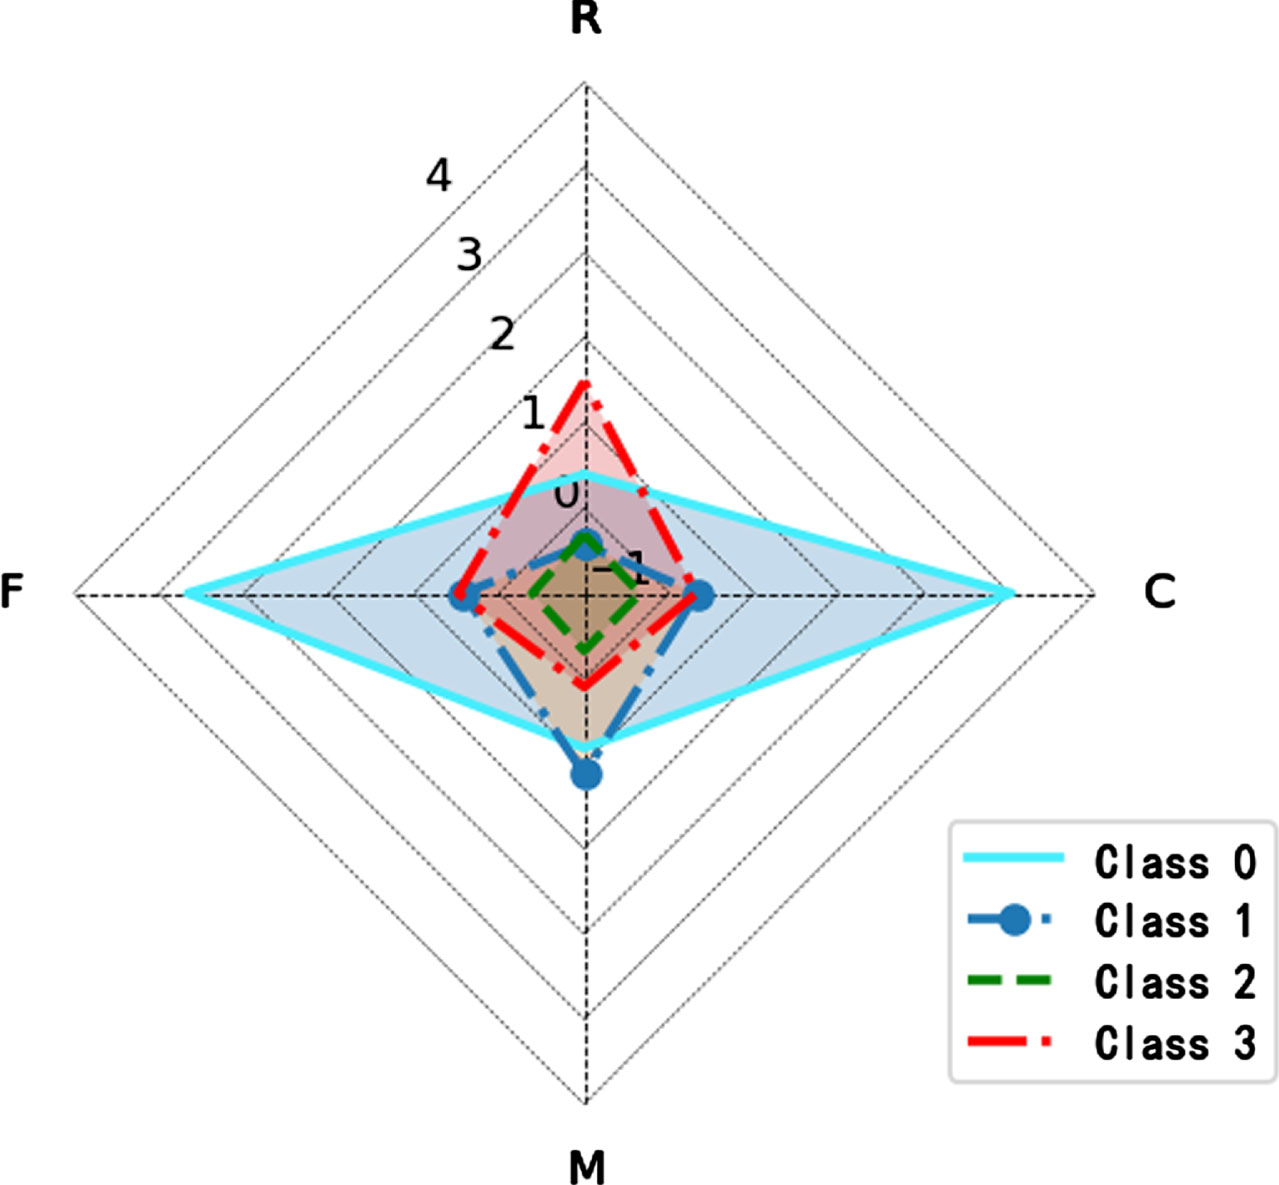
Radar chart of customer characteristics.
SOM neural network stratification results
As seen from Table 1, the average value of marginal customers on each indicator is very low, indicating that they have contributed little value to the enterprise in the past. According to the long tail theory, although the marginal customers bring little value to the enterprise in the past, they are large in number, and the total value they contribute to the enterprise is almost half of the total value contributed by all customers. Therefore, this large base of marginal customers is the enterprise’s long-tail customers, and the other three categories are called the enterprise’s high-value customers. In this paper, we will dig deeper into the growth potential of long-tail customers according to the long-tail theory.
According to the characteristics of long-tail customers’ consumption behavior and long-tail theory, the long-tail customers’ stratification evaluation index model is constructed.
Membership length indicates the length of time from when a customer joins the company’s membership to the statistical deadline, and is denoted by the letter L. The longer the time, the higher the customer’s dependence on the company, and the higher the potential contribution to the company’s revenue [35]. The formula is as follows:
The membership level indicates the level of the member’s customer [18], and is denoted by the letter T. The higher the level, the more customers understand the enterprise-related membership hierarchy and marketing strategies and are more loyal to the enterprise, with certain growth potential.
The ticket price difference represents the total ticket price of the member customer in the second time period minus the total ticket price in the first time period [3], and is denoted by the letter P.The larger the difference, the more it indicates that the customer has growth potential and is likely to bring more value to the business in the future. The formula is as follows:
The difference in the number of flights represents the number of flights taken by the member customer in the latter period minus the number of flights taken in the former period in two identical time periods [3], which is denoted by the letter N. The greater the difference, the more it indicates that the customer’s frequency of flying with the airline is constantly increasing and is more likely to generate more consumption in the future, bringing more profits to the company. The formula is as follows:
The difference in mileage points represents the total points obtained by a member customer during the second time period of two identical time periods minus the total points obtained during the first time period [3], which is denoted by the letter D. The greater the difference, the more it indicates that the member customer has certain growth potential. The formula is as follows:
Cross-purchase represents the number of other points earned by a member customer through cross-purchase in the latter period minus the number of other points earned in the former period during two identical time periods, and is denoted by the letter G. The greater the difference in other points earned through cross-purchase, the greater the growth potential of the member-customer, who buys other items from partners and accumulates points in addition to airline tickets. The point accumulation policy of a loyalty alliance is “accumulate 1 point for every 1 yuan spent”, so the formula for calculating cross-purchase G is as follows:
After extracting the indicators, standardize them to eliminate the dimensional influence according to formula (17), and then use the entropy weight method shown in formulas (13)-(16) to determine the weights of each indicator.
The Bayesian Information Criterion (BIC) is one of the most popular model selection criteria [15], designed based on the idea of Bayes’ theorem and information entropy, which can predict the number of clusters based on the data distribution with the following equation:
In this paper, the number of clusters is determined according to the BIC in the Twostep clustering process with the following steps:
First, perform preclustering: This part adopts the idea of clustering feature tree (CF) growth in the Balanced Iterative Reducing and Clustering Using Hierarchies (BIRCH) algorithm. It scans the data records in sequence from the data set and judges whether the current record should be merged with any previously constructed dense area or formed into a singleton based on the distance standard. During the construction of the CF tree, the data points in the dense areas are preclustered to form many small subclusters. In this process, the rough estimation of the number of clusters in the data is calculated based on the BIC [28].
Then, formal clustering is performed: Using the subclusters obtained in the preclustering stage as objects, the agglomerative hierarchical clustering method is used to merge the subclusters one by one. Each time a merge is performed, the number of clusters is adjusted based on the distance standard to reduce the estimated number of clusters in the first stage to the true number of clusters, which is the optimal number of clustering clusters [28].
Stacking-based clustering ensemble
The ensemble process is shown in Fig. 5 and is as follows:
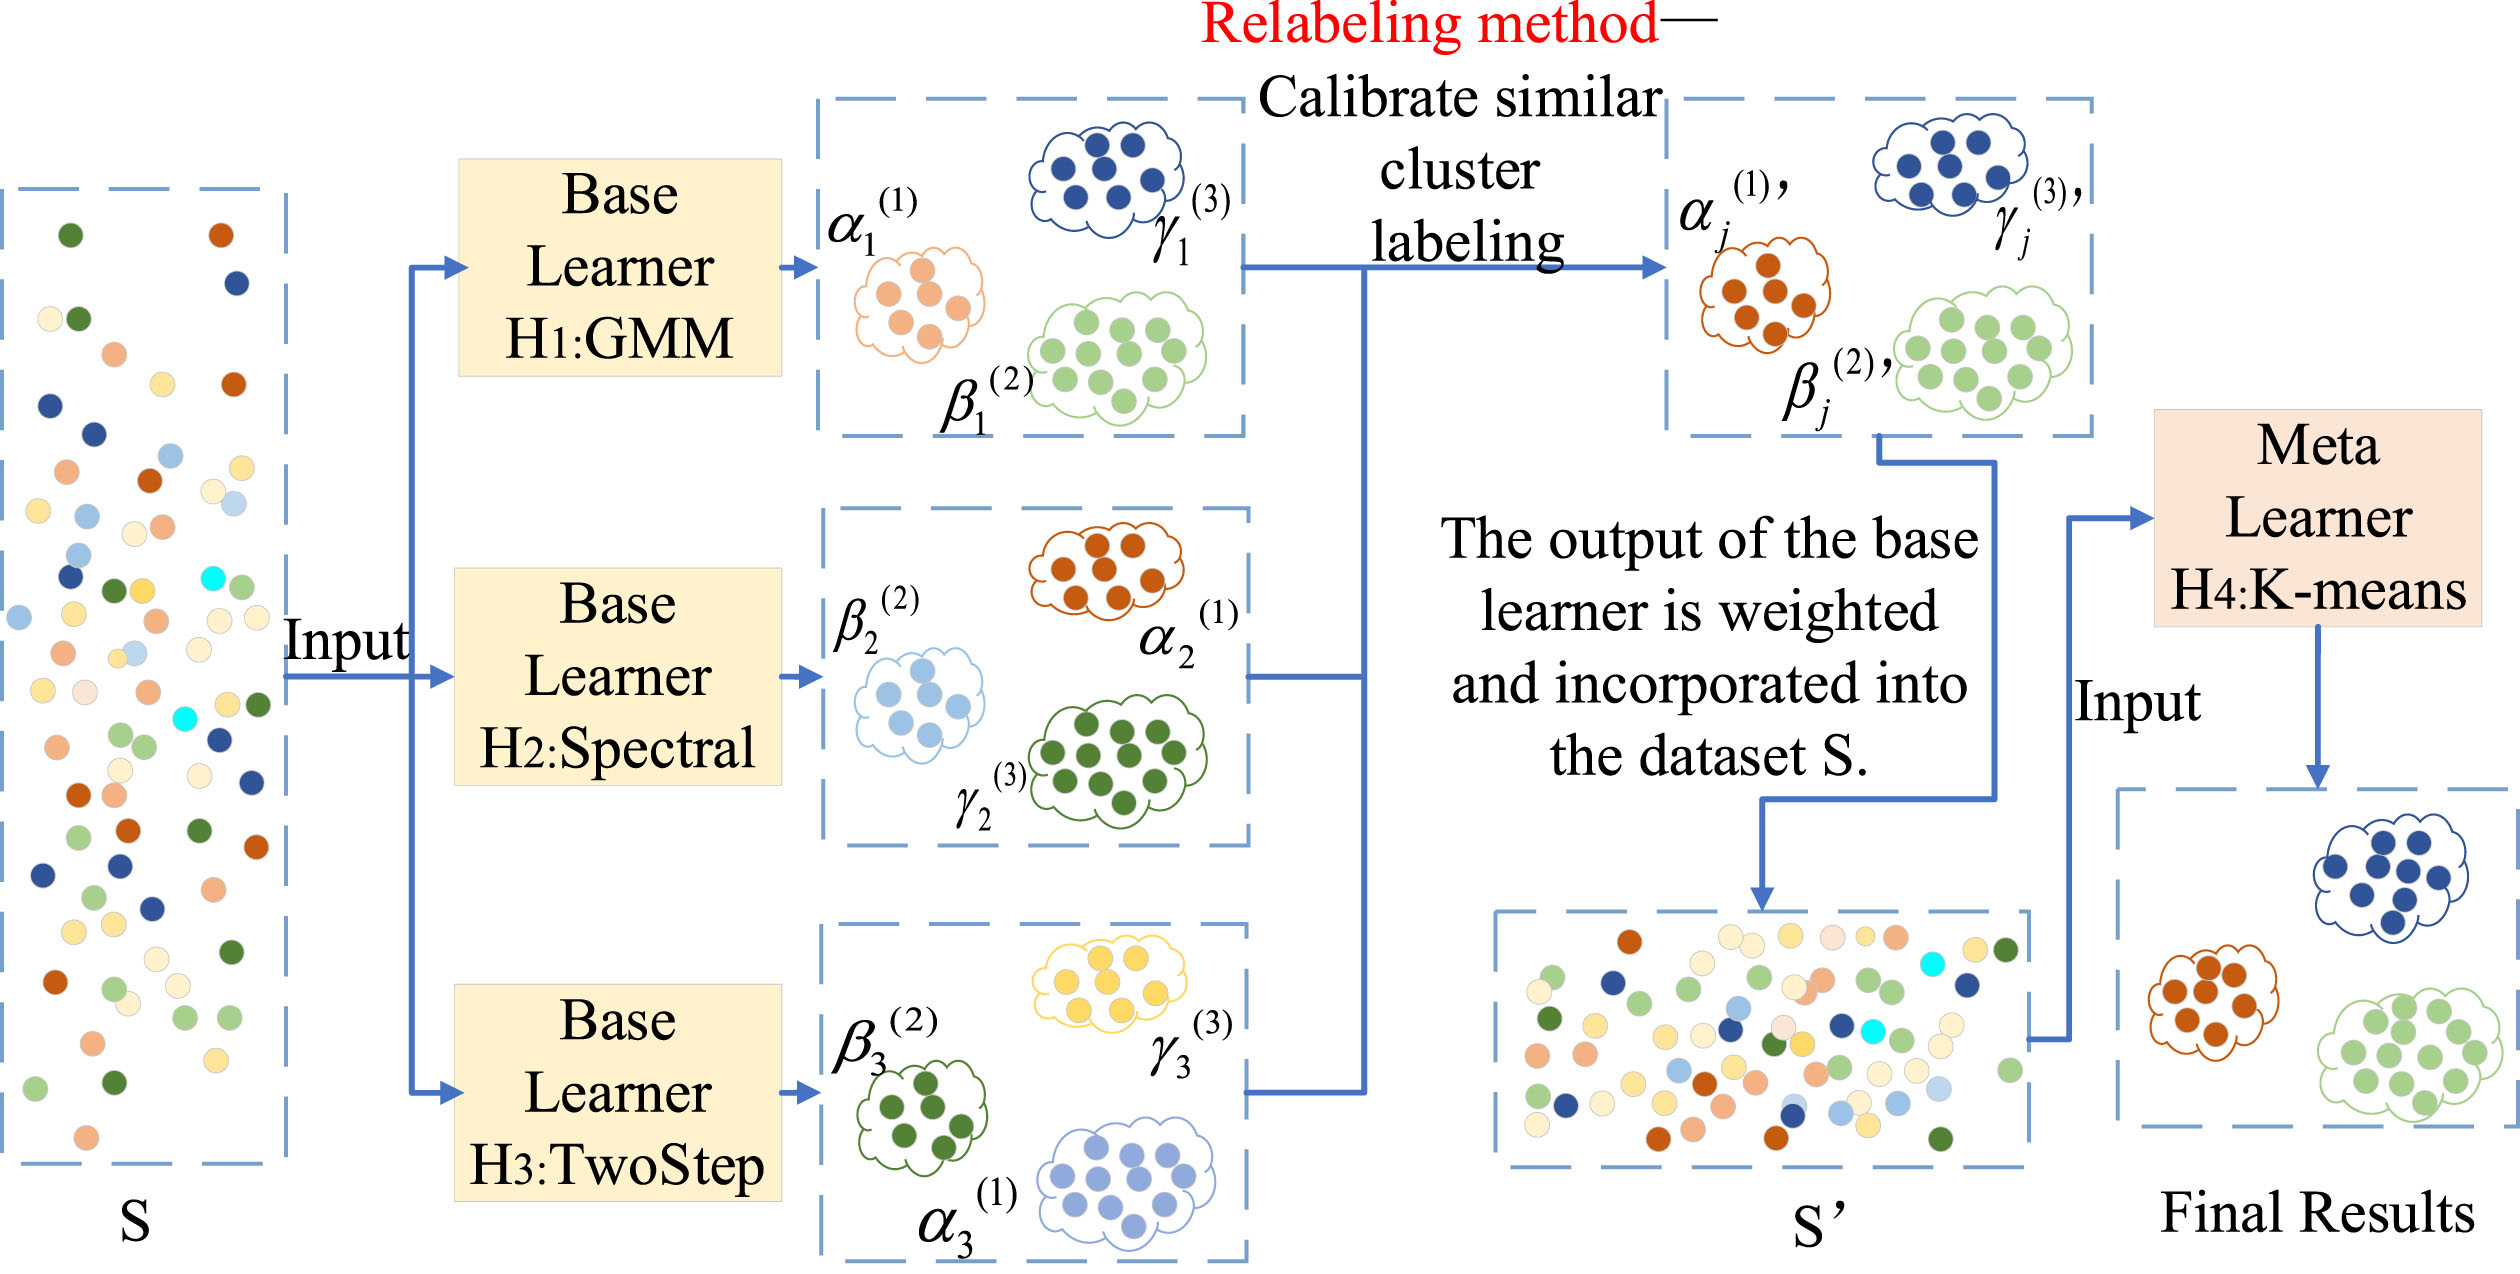
Stacking-based clustering ensemble process.
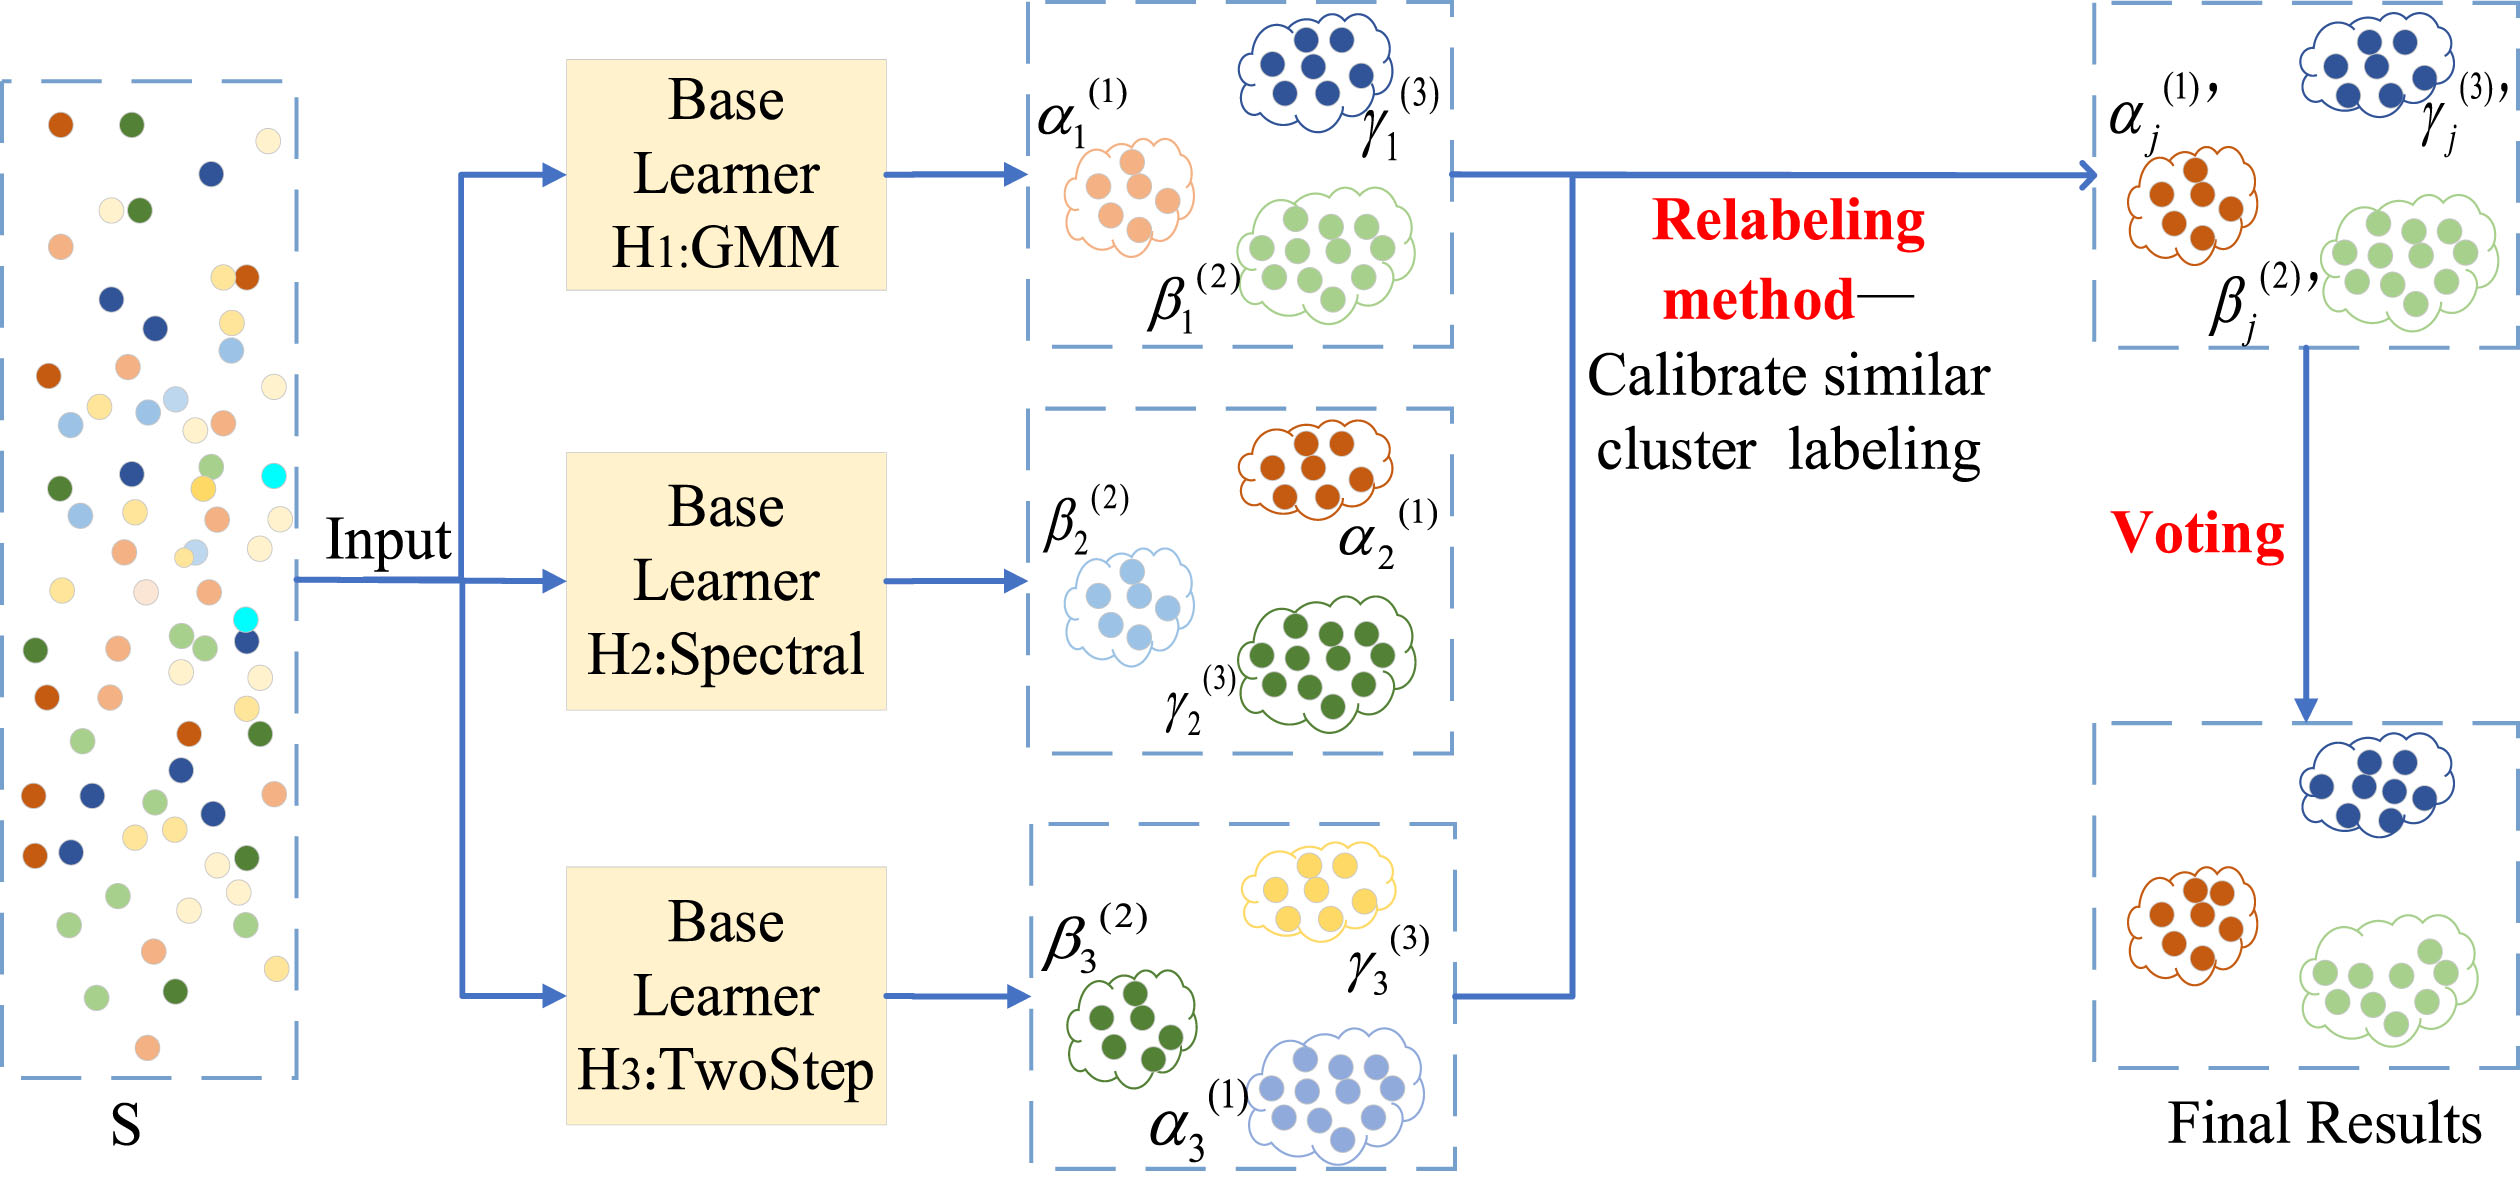
Step 1: The input data are the LTPNDG model indicator data, represented by S, where S = {s1,s2, . . . ,s n }. There are a total of 39,722 long-tail customer data points, so n = 39722. Each base learner is represented by H j (j = 1, 2, 3), and the meta-learner K-means is represented by H4. The clustering results of each base learner are represented by R j ={ α j (i), β j (i), γ j (i) }, where i = 1, 2, 3, j = 1,2,3. Here, i represents different clusters, and j represents different base learners. For example, the output result of H1 can be represented as R1 ={ α1(1), β1(2), γ1(3) }.
Different algorithms have different output results. For example, the sample size and similarity of clusters α1(1) in the output results of H1 and cluster α2(1) in the output results of H2 have great differences, making it impossible to directly integrate them. Therefore, the relabeling method is needed to make similar clusters in different clustering results obtain the same label.
Step 2: Relabeling method to calibrate similar cluster labeling: randomly select the results of a base learner as a reference, such as the H1 clustering results as a benchmark, the clusters similar to α1(1) are relabeled as α1(1)’, α2(1)’ and α3(1)’, then α j (1)’, (j = 1, 2, 3) indicates the 1st class in the different clustering results, corresponding to Fig. 5 shows that the clusters similar to α1(1), β1(2) and γ1(3) are relabeled as the same color and denoted by α j (1)’, (j = 1, 2, 3), β j (2)’, (j = 1, 2, 3) and γ j (3)’, (j = 1, 2, 3) respectively.
Step 3: Weight the output results of each base learner using silhouette coefficients and then merge them into data set S. First, calculate the silhouette coefficient λ j (j = 1, 2, 3) for each base clustering algorithm and then multiply by the corresponding weight coefficient w : w = 0.3 × λ j for each element in R j . Then, merge the output results of each base learner to obtain result set R = R1 ⋃ R2 ⋃ R3, and finally combine it with the original data set S to obtain the new data set S′, S′ = S ⋃ R.
The multiplication of the silhouette coefficient by 0.3 is based on the extreme value distribution of elements in the data set S to avoid the difference in scale between newly inserted data and original data from affecting the clustering results.
Step 4: The new data set is used as the input of meta-learner H4 for the cluster ensemble to obtain the final clustering results.
The ensemble process is shown in Fig. 6 and is as follows:
Ensemble process of clustering based on bagging.
Step 1: Input data set S. After clustering by each base learner H j (j = 1,2,3), the results are R j = { α j (i), β j (i), γ j (i) } , i = 1, 2, 3, j = 1, 2, 3.
Step 2: Use the relabeling method to calibrate the similar cluster labels as above.
Step 3: Using the voting method for the clustering ensemble: For the same sample point, if the clustering results of three base learners all consider it to belong to category 1, then the voting ensemble result is 1. If two base learners consider it to belong to category 3 and one considers it to belong to category 2, then the minority follows the majority, and this customer belongs to category 3. If the output results of three base learners are all different, then a category is randomly selected as the final category of this sample. From this, we obtain the final clustering result for each sample.
Cluster evaluation is a crucial step in assessing the performance of clustering methods in identifying relevant groups, which helps to analyse whether one method is superior to another. The following indicators are often used to evaluate the performance of clustering algorithms.
Silhouette coefficient
The silhouette coefficient (SC) consists of two components: the degree of cohesion and the degree of separation, with the degree of cohesion reflecting the closeness of a sample point to the intraclass elements and the degree of separation reflecting the closeness of a sample point to the extra class elements [2]. Therefore, the silhouette coefficient evaluates the clustering effect comprehensively by calculating the dissimilarity within and between clusters. The formula is as follows:
The Calinski-Harabasz (CH) coefficient judges the degree of compactness within each cluster and the degree of separation between clusters by the ratio of the difference between intercluster distance and intracluster distance [2]. The formula is as follows:
The Davies-Bouldin Index (DBI) reflects the tightness of samples within the same cluster and the separation of samples between other clusters, and the smaller the value is, the better the clustering effect [24]. The formula is as follows:
Experimental environment and data
The experiments were implemented under Python 3.8 on an AMD Ryzen 7 4800 U with Radeon Graphics1.80 GHz processor. The data is sourced from the “Teddy Cup” National College Student Data Mining Competition website, with the URL being http://www.tipdm.org/ts/661.jhtml. The data contains the flight records of all customers within two years, with a total of 62988 records and 44 attributes. Some of the data is shown in Table 2.
Raw data
Raw data
After constructing the LTPNDG index by the above steps, the optimal number of clusters determined by the BIC was 3. Each clustering algorithm was clustered by the optimal number of clusters, and then three clustering performance evaluation indexes were used to evaluate the clustering effect. The comparison results are shown in Fig. 7.
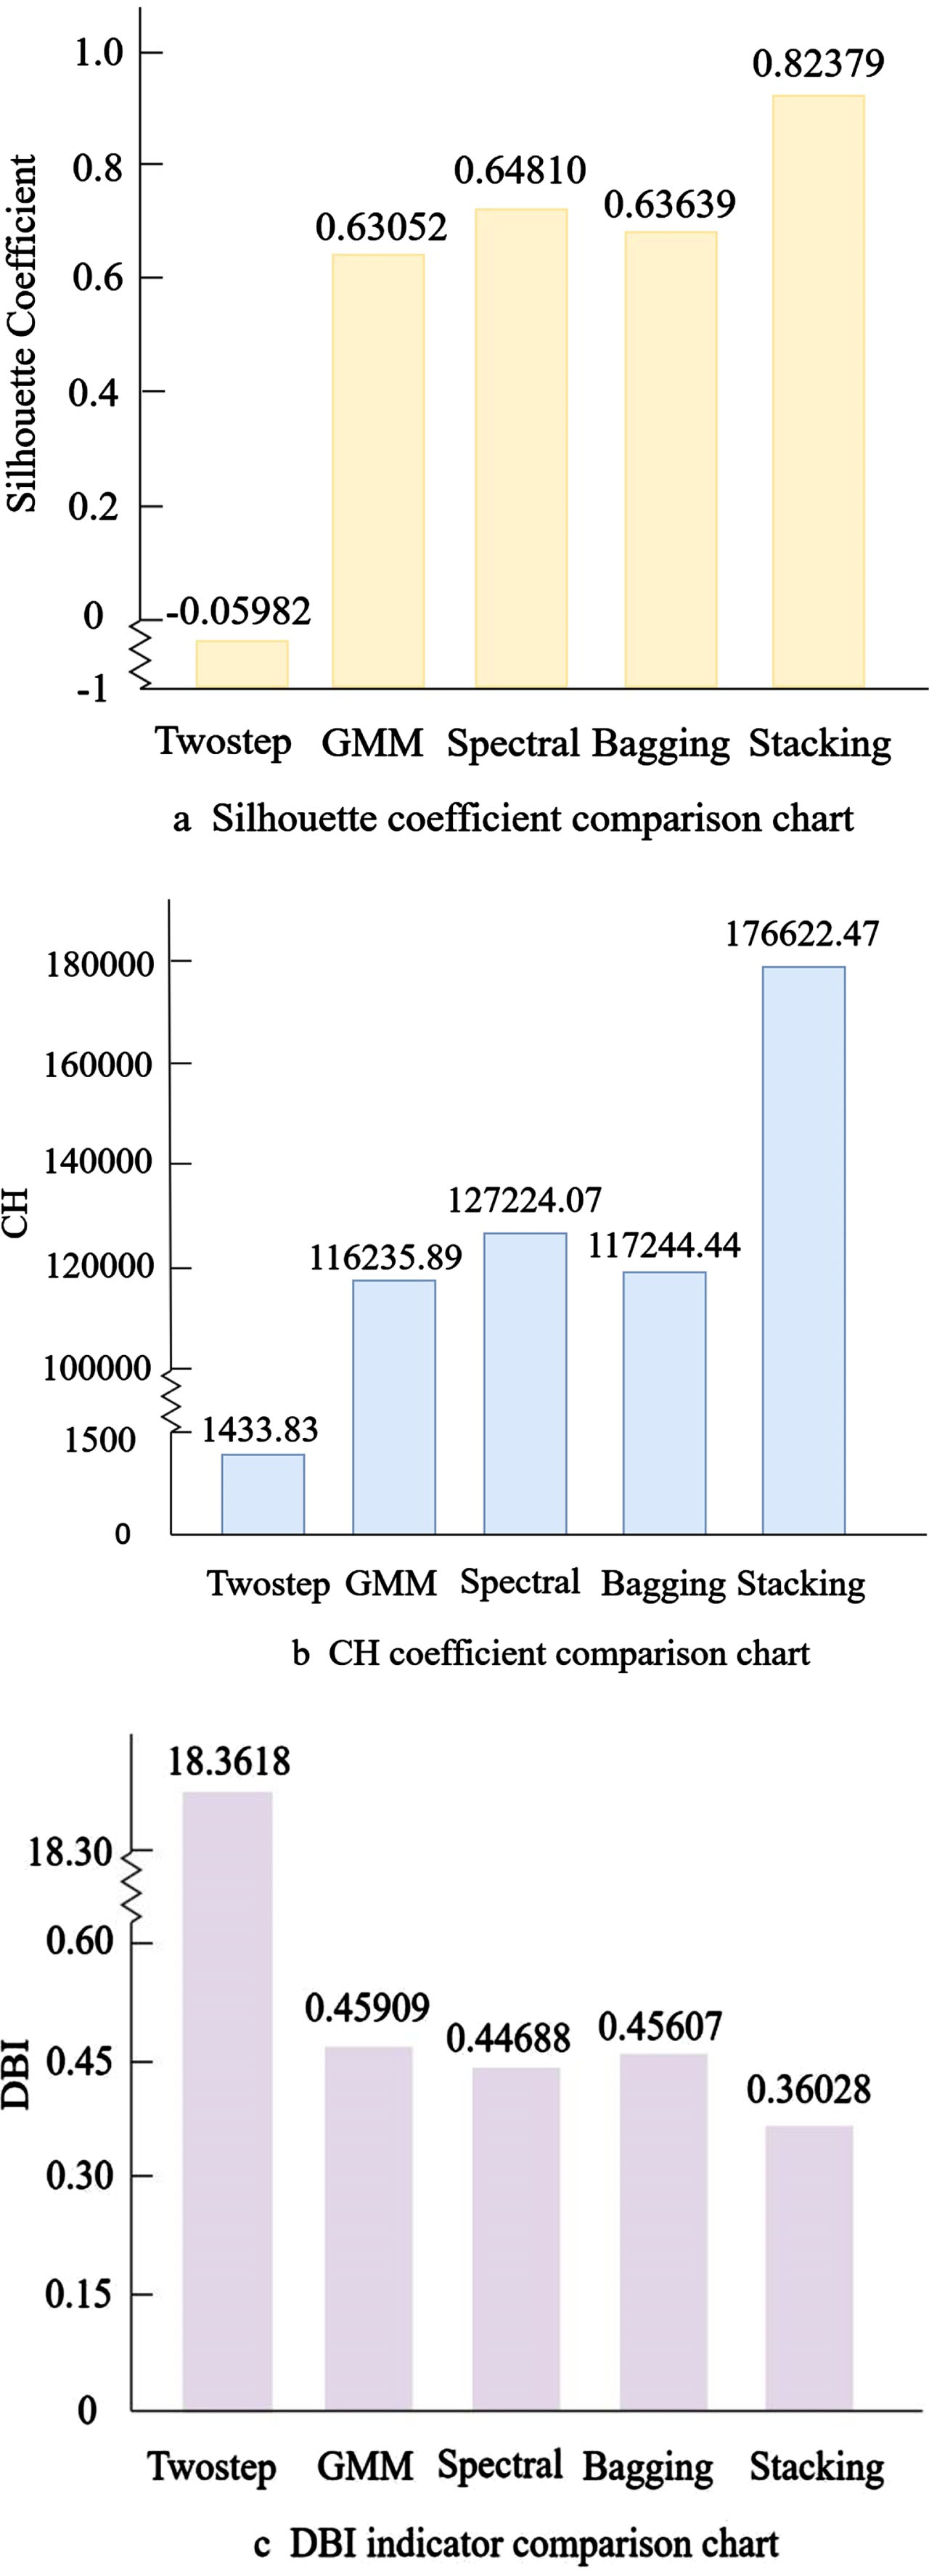
Algorithm performance comparison chart.
From Fig. 7, it can be seen that compared with single clustering algorithms, the Stacking algorithm increases the silhouette coefficient by 14.77% to 27.11%, the CH coefficient by 38.83% to 122.18%, and the DBI index by 19.38% to 98.04%. The experimental results show that each cluster generated by S tacking integrated clustering has higher cohesion and separation. This indicates that within the same category, the similarity between data samples is higher and the distribution is more compact, so customers belonging to the same category have higher similarity and similar consumption behavior habits. On the other hand, between different categories, data samples have higher heterogeneity and the distribution is more scattered, indicating that customers’ consumption preferences and purchasing habits vary greatly between different categories, requiring companies to manage them differently. Therefore, the Stacking clustering ensemble algorithm more accurately divides long-tail customers into different categories and achieves customer stratification.
In the Stacking ensemble learning process, the first layer uses three heterogeneous base learners for primary clustering to explore the distribution structure of the data from different perspectives, providing richer clustering information for the second-layer clustering. The meta-learner integrates these information using weighted integration to fully utilize the advantages of the base learners. Compared with a single clustering algorithm, ensemble learning can more accurately stratify clusters based on the distribution of the data, and is less affected by outliers in the data, improving clustering accuracy.
Compared with the clustering ensemble algorithm based on Bagging, the Stacking algorithm increases the silhouette coefficient by 29.45%, the CH coefficient by 50.64%, and the DBI index by 21%, significantly improving clustering performance. This indicates that the S tacking algorithm’s integration method is clearly superior to the Bagging algorithm’s integration method. The Stacking algorithm uses a more complex hierarchical model for integration. After the first-layer base learners complete clustering, the silhouette coefficients of each base clustering result are calculated and used to weight each clustering result accordingly. The greater the silhouette coefficient value, the better the clustering effect of the base learner, and the greater its weight. Therefore, in the second layer, weighted integration of the base learners’ clustering results with the original data is performed and input into the meta-learner for clustering. The greater the weight of a base learner, the greater its contribution to improving clustering effectiveness, thereby enhancing the accuracy of the ensemble learning model. The Stacking integration method takes into account the accuracy of each base learner’s clustering and weights can reflect each base learner’s contribution, highlighting better-performing base learners and weakening those with poor performance, thereby improving the clustering effectiveness of integrated learning models. In contrast, the Bagging algorithm adopts a majority voting strategy after each base learner completes clustering, only considering the result with the most votes and not considering differences in clustering performance among different base learners. Therefore, it cannot fully leverage the strengths of each base learner, resulting in poor ensemble effects.
Therefore, the stacking clustering ensemble result is the final stratification result for long-tail customers, and the clustering centers are shown in Table 3.
Stacking clustering ensemble results
From Table 3, it can be seen that the 39,722 long-tail customers are divided into three customer groups with significant behavioral differences. Among them, the membership time L of Category 0 customers is the longest, indicating that they are old customers of the company; however, their membership level T is relatively low, indicating that the membership level of these customers is also relatively low. Although they became members of the company very early, they do not understand various marketing policies such as membership upgrades and points. The number of times they fly with company N, the ticket price P, the accumulated mileage points D, and the cross-purchase volume G at the partner of the alliance are all decreasing, indicating that they have no growth potential and no willingness to deepen their relationship with the company. They are old customers with no growth potential.
Category 1 customers have the shortest membership time L, indicating that they are new customers of the company; their membership level T is also low, indicating that they do not yet understand various point promotions and membership upgrade systems. However, the number of times they fly with company N is increasing, and the difference in ticket prices P and mileage points D is decreasing, indicating that they are travelling more frequently over short distances. The cross-purchase volume G at the partner of the alliance is also increasing. Overall, although they are new customers of the company, they have a certain degree of recognition and satisfaction with the company’s products and services and may have a strong willingness to continuously understand and improve their relationship with the company. They have great growth potential and should be given priority by the company.
Category 2 customers have a longer membership time L, indicating that they are old customers of the company; their membership level T is the highest, indicating that the membership level of these customers is very high, and they are quite familiar with the company’s membership upgrade and related systems. The number of times they fly N is significantly increasing, and the ticket price P and mileage points D are also significantly increasing, indicating that they have high consumption ability and demand for air travel. For the company, they are of great value and can bring substantial profits to the company. At the same time, they often purchase other types of goods at the company’s partner, with a large cross-purchase volume G. Overall, this group of customers is more familiar with the company, actively participating in and familiar with various systems, and has high recognition and loyalty to the company. They also have great growth potential and are old customers with high growth potential, which can bring substantial profits to the company in the future.
Old customers with high growth potential
Through the above analysis, it can be seen that the customers in category 2 belong to the long-tail customers with high growth potential. The existing customer stickiness, recognition, loyalty or consumption habits of these customers have been increasing their consumption in the company and have the potential to continue to grow. Companies should strengthen their communication actively manage customer relationships, and attach great importance to the establishment, maintenance and development of long-term and deep relationships with these customers. The number of such customers is relatively small, accounting for only 1.16%. Enterprises can adopt one-to-one and other refined marketing management, targeted to explore their deep or new consumption and service needs, the development of differentiated marketing strategies to stimulate them in the enterprise, the same business alliance or partners of different business alliances to generate new consumption and the maintenance and increase of the original consumption, and constantly bring profits to the enterprise.
New customers with high growth potential
Through the above analysis, it can be seen that the customers in category 1 belong to the new customers with high growth potential in the long-tail customers, their understanding of the company is not deep enough, and the relationship they have established with the company is relatively shallow at present. However, from a comprehensive point of view, they have the willingness to further deepen their understanding and develop long-term relationships with the company and have great growth potential, which can continuously bring profits to the company in the future. Companies should actively communicate, maintain and develop long-term and positive relationships with these customers to maximize their value. For example, enterprises can popularize their marketing policies on time and regularly remind and help customers to redeem points and upgrade their membership. It can avoid wasting points and increase customers’ activity and loyalty at the same time. It can also track their consumption dynamics and later recommend different products or service combinations according to different customers’ consumption levels and abilities to gain more profits through cross-selling.
Old customers without growth potential
The above analysis shows that customers in category 0 belong to the long-tail customers with no growth potential. These customers not only bring little value to the company in the past but also have no potential for growth, which means it is difficult to bring profits to the company in the future. From a comprehensive perspective, they basically have no exploitable value, and companies do not need to pay more to manage them.
Conclusion
Research conclusion
Faced with the problems of insufficient attention to long-tail customers in previous research on civil aviation, shallow value mining, low accuracy and lack of accuracy verification of single clustering algorithms, this paper innovatively constructs a civil aviation long-tail customer stratification model based on a clustering ensemble from the perspective of long-tail theory. The model determines the optimal number of clustering clusters through the BIC, solves the problem that different base learners require the same and reasonable number of clustering clusters, and improves the clustering accuracy. Second, two mainstream ensemble learning methods are used for clustering ensemble, solving the problems of low accuracy and robustness of single clustering algorithms. Then, with the help of three clustering performance evaluation indicators, the clustering effect is evaluated to solve the problem of accuracy verification. The experimental results show that the clustering ensemble algorithm based on Stacking achieves better clustering results than traditional algorithms. This indicates that compared to single algorithms, Stacking can emphasize base learners with better performance and weaken those with poor performance during the ensemble process, thereby improving clustering accuracy and enabling more accurate stratification of long-tail customers with similar consumption behavior.
The limitation of this research is that it only focuses on one data set from the civil aviation industry, lacking considerations of diversity. Future research will consider the validation of machine learning models using different datasets to improve the accuracy and generalization of the models. In addition, algorithm improvement will also be considered to improve the accuracy of clustering, and to build a long-tail customer stratification management system that better fits the actual needs of the enterprise, so that the enterprise can better adapt to the development of the digital era.
Theoretical and practical implications
Theoretical implications
Firstly, this paper combines the long-tail theory and the customer stratification research in civil aviation, which enriches the application research of long-tail theory in civil aviation customer stratification. Secondly, it considers the impact of service cost on civil aviation customer value, enriches the indexes of civil aviation customer stratification, and constructs the RFMC model, which is in line with the characteristics of civil aviation customers’ consumption behaviour, and the LTPNDG model, which reflects the growth potential of civil aviation long-tailed customers, and can measure the value of civil aviation customers in a more comprehensive way. Finally, the ensemble learning method in machine learning is applied to solve the problem of civil aviation long-tail customer stratification, which promotes the cross-fertilization between disciplines.
Practical implications
Customers are an important channel for companies to gain market share and profits. The cost of keeping an old customer is much lower than the cost of getting a new customer. Moreover, for a service-oriented industry like civil aviation enterprises, it is more important to retain more valuable old customers. Therefore, from the perspective of long-tail theory, this paper explores the value of long-tail customers in depth, which can help civil aviation enterprises retain more valuable customer resources. Taking different marketing management measures for the value and consumption behaviour characteristics of different types of customers can also help civil aviation enterprises optimize customer relationship management and resource allocation. This is of great practical significance for them to cultivate competitive advantages in the fierce market competition. In the era of big data, the use of machine learning methods for the optimization of enterprise marketing management strategies can break through the limitations of traditional marketing planning, help enterprises achieve digital transformation, and better adapt to the development of the times.
Funding
The work in this paper was supported by the Research on customer stratification management based on cost to service measurement in Internet Era (Philosophy and social science project (TJGL18-036), Tianjin, China), the Stratification research based on civil aviation customer value: from the perspective of long tail theory (2022 Tianjin postgraduate scientific research innovation project (2022SKYZ311), Tianjin, China) and the Impact of utilitarian versus hedonistic goal conflict on continuous consumption decisions: the chain mediation role of purchase decision involvement and consumer participation (2022 Tianjin postgraduate scientific research innovation project (2022SKY336), Tianjin, China).