
Abstract
PURPOSE:
Increasing technological advancements in processing and storage have made it easier to handle formerly difficult jobs like disease diagnosis or semantic segmentation. Eye cancer is a rare but deadly disorder that, if misdiagnosed, can cause blindness or even death. It is essential to find eye cancer early in order to successfully treat it and enhance patient outcomes. The usage of DL methods for medical image analysis, particularly the identification of eye cancer, has fascinated increasing consideration in current era. The demand for efficient tool to detect the eye cancer emphasize the need for reliable detection systems. Examining how explainable deep learning techniques, in which the model’s decision-making process can be understood and visualized, can increase confidence in and adoption of the deep learning-based approach for detecting eye cancer. Expert input is necessary to train machine learning algorithms properly. As it necessitates knowledge of ophthalmology, radiography, and pathology, this can be difficult for eye cancer identification. The main purpose of the study is to detect the eye cancer with at most accuracy with the utilization of Deep learning-based approach.
METHODS:
There are four steps involved to achieve the efficient detection system. They are pre-processing, segmentation, augmentation, feature extraction with classification. The Circle Hough Transform is applied to detect the edges in the image. The dataset size is increased by shifting, rotating and flipping augmentation techniques. Deep learning-based approach is suggested for the automatic detection of eye cancer. The two methods named 3XConPool and 10XCon5XPool were investigated using Python learning environment. The two techniques 3XConPool and 10XCon5XPool imply on the Sine Cosine Fitness Grey Wolf Optimization (SCFGWO) algorithm for the adjustment of the hyperparameters. The 3XConPool and 10XCon5XPool methods with SCFGWO are compared with each other and also with the other existing methods.
RESULTS:
As a comparison to the earlier techniques, the suggested configured Convolution Neural Network with SCFGWP exceeds with regard to high accuracy, recall and precision. The suggested 10XCon5XPool with SCFGWO obtains 98.01 as accuracy compared to other method 3XConPool which results 97.23% accuracy.
CONCLUSION:
The Proposed Method 1 and Proposed Method 2 is presented here, where Proposed Method 2 with 5 times convolution layer with pooling layer yields high accuracy compared to proposed method 1. The main contribution by the SCFGWO algorithm resulted in the achievement of accuracy. This study will open the door for further investigation and the creation of deep learning-based techniques with optimization for ophthalmic processing.
Introduction
A branch of machine learning called deep learning uses ANNs, encouraged by the organization and functionality of the brain. Deep learning models are extremely operative for a variation of roles, together with picture, audio recognition, NLP, and autonomous driving. They learn and extract information from input using numerous layers of artificial neurons. The deep learning methodology is built on a collection of algorithms that give computers the ability to learn from data, recognize relationships and patterns, and then make predictions or judgements based on that knowledge. A deep neural network, which consists of numerous layers of interconnected nodes or neurons processing input data to produce an output, is frequently used to construct these methods.
Large quantities of categorized data are needed to train a deep learning model. To reduce the difference between its predictions and the actual labels, the model learns from this data by varying the weights of the connections between its neurons. The ability of deep learning to acquire intricate and abstract data representations depends on a procedure known as backpropagation.
Ocular oncology comprises the study of tumors related to the eye and its parts. Eye cancer can be categorized as primary eye cancer and secondary eye cancer. The cancer which occurs within the eye or eye surface or cells present in the eye is called as primary cancer. The cancer which starts in some other parts of the body and spreads to the eyes are called as secondary cancer. The rarest type is primary cancer and secondary cancer occurs most frequently. The pursuit of employing machine learning and deep learning techniques to identify cancer is an ongoing endeavour. The core of illness detection is the process that functions well and produces a quick retrieval system and precise detection.
The foremost contributions of the current work are To introduce enhanced model to detect the eye tumor with high accuracy. Eye Cancer Classification Model based on CNN (ECM-CNN) with hyperparameter optimization using Sine Cosine Fitness Gray Wolf Optimizer (SCFGWO) algorithm. The modified CNN architecture with the combination of layers with optimization in hyperparameter.
The articles related and supported for the development of the work is described in section II. Section III projected the proposed methodology for the detection of eye cancer, with discussion about the steps to reach the final output. The sections IV describe the result and the proposed methodologies. The section V describes the implementation and the evaluation metrics. The final section VI shows the conclusion of the proposed work.
Related works
Ocular oncology comprises the study of tumors related to the eye and its parts. Eye cancer can be categorized as primary eye cancer and secondary eye cancer. The cancer which occurs within the eye or eye surface or cells present in the eye is called as primary cancer. The cancer which starts in some other parts of the body and disseminate to the eyes are named as secondary cancer. The rarest type is primary cancer and secondary cancer occurs most frequently [30]. The cancer care team typically uses a staging system to explain how far a tumour has gone. The American Joint Committee on Cancer (AJCC) TNM system and the Collaborative Ocular Melanoma Study (COMS) group’s system are the two most frequently used systems to define the stages of eye melanomas [4]. Table 1 describes the stages of the tumor.
Stages of tumor
Stages of tumor
[32] Staging System of eye melanoma by Collaborative Ocular Melanoma Study (COMS) [13].
Deep learning has emerged as a crucial tool in a variety of industries, includes robotics, computer vision, NLP, and speech recognition. Additionally, it is used to optimize industrial processes, forecast weather patterns, and enhance medical diagnostics. Deep learning may be used to find and diagnose cancers of all kinds, including eye cancer [1]. The investigation of retinal pictures and the uncovering of retinoblastoma symptoms can be done using deep learning. A deep expert system is processed with a sizable dataset of retinal pictures that have been classified as either malignant or healthy. The network gains the ability to recognize aspects of the photos, such as unusual shapes or textures, that are linked to cancer [31]. Once the model has been trained, it can be used to categorize newly acquired retinal pictures as either malignant or healthy. The detection and treatment of eye cancer may be sped up by the automated and speedy completion of this procedure [2].
Deep learning can be used to identify other types of eye cancer besides retinoblastoma, like melanoma or lymphoma. Deep learning models can aid in the earlier detection of cancer and better patient outcomes by examining images of the eye and spotting abnormal patterns or structures. The total images taken for the consideration were 771 fundus images, where 181 had no tumor and 590 were intraocular retinoblastoma. The sensitivity and specificity achieved were 96% and 94% with the combination of Deep Learning and Computer Vision [3].
The author Coan et al. proposed two step approach: logical rule and machine learning modelling framework for the automatic detection of glaucoma. The logical rule framework achieved accuracy as 89%, whereas machine learning achieved as 93% [4]. Zhang et al. projected a cost-effective Deep Learning Assistant for Retinoblastoma Monitoring algorithm for automatic screening of retinoblastoma. The model is trained to classify the normal fundus image, active retinoblastoma for treatment and the inactive retinoblastoma with no importance for the treatment. The five-fold cross-validation achieved 95% confidence which distinguish the normal and active RB, and 92% confidence to distinguish stable and active RB [5].
The author sukru et al. compared six deep learning models such as DenseNet121, EfficientNetV2S, InceptionV3, MobileNet, VGG16, and Xception were applied over the OCT-C8 dataset. The dataset contains eight classes such as Normal, CSR, DME, DR, AMD, CNV, DRUSEN and MH. Out of six models, DenseNet121 performed better than others and achieved accuracy of 97% [6]. The deep learning model incpetionv3 was employed by the author to examine the fundus and non-fundus images of the retinoblastoma. The two famous explainable AI techniques were used to produce local and global features of the model. The spatial mechanism with incpetionv3 achieved 97% accuracy [7].
Ramesh et al. employed novel CNN architecture with human in the loop (HITL) for the detection of glaucomatous fundus images. The total images were 1400, out of which 1120 images were used for training and 280 images for testing. The testing images were split into 3 testing groups with various total images in each cluster. The sensitivity and specificity achieved were 97.6% and 98% [8]. Automatic eyelid tumour detection and differentiation utilising a deep learning classification network and a quicker region-based convolutional neural network are both performed by an artificial intelligence system was proposed by Zhongwen et al. [9].
Avigyan et al. collected images from Miles Research, Eye cancer and Uveal Melanoma and applied augmentation technique to generate more datasets. The images were pre-processed and converted into grayscale. Canny detection was used for the detection of outer boundary of the eye. Hough circle recognition was adapted to isolate the ROI. The ROI image were given to the CNN architecture named LeNet. The metrics used to analyse the performance are accuracy, sensitivity and specificity [10]. Anand et al. suggested the method qualitatively separates the tumours from any background noise. The results show that the suggested approaches are a suitable addition to the supervised methods. The experts also looked at the segmentation findings that were suggested and came to the conclusion that the quality was unaffected. The suggested method makes it easier for eye specialists to diagnose retinoblastoma patients by looking at the retina [11]. Sinha et al., created modified LeNet architecture for the detection of eye tumor. In order, to increase the dataset, augmentation was accomplished. The accuracy achieved was 95% [12].
Shah et al. proposed a model to detect diabetic retinopathy (DR) using Deep CNN based algorithm to reduce the blindness. The DR, prompt referral and sight threat were calculated. The sensitivity and specificity achieved was 97% and 97.5% [14]. Tache et al. presented a methodology to compare the normal retinal regions with the one influenced by glaucoma and diabetic retinopathy. The authors acquired image with the help of Canon CR-1 fundus camera. Total images present were 45, where 15 with healthy patients, 15 with diabetic retinopathy, 15 with glaucomatous disease. The fractal dimensions are calculated using Harsdorf distance, Minkowsi and Box counting dimension. The analysis was performed using mean, standard deviation [15].
Andayani et al. incorporated Backpropagation Neural Network for the classification of retinal fundus image. Grey Level Co-occurrence Matrix method was utilized for feature extraction. The accuracy achieved is 90% [16].
Khedekar A et al. demonstrated that without sedation or pharmacological dilatation, the iPhone-based MDEyeCare programme has successfully detected leukocoria in RB kids. Early detection of leukocoria would result in a greater response to treatment. Smartphone photography-based programmes (apps) have been created to identify leukocoria in the eyes of children with RB tumours [17]. Mohammed et al. projected a technique to classify the pepper with the help of DL. Well-trained CNN model named VGG16 was employed. This displays that the recommended system can precisely forecast and categorise various peppers with full performance and accuracy [18].
In terms of eye disease screening, diagnosis, and treatment, ophthalmology is poised for a revolution. Computer-based deep learning (DL) technology, which has the prospects to transform ophthalmology practice, is driving this revolution. The latest and quick expanding area of expert system is deep learning (DL). A method for analyzing huge databases and comparing the results to established ground truths. To make video and image searchable, this technology is implemented into social networking and photo software. Eventually, DL might even permit the creation of real artificial intelligence [19].
To segment the iris malignancies, Elhoussaine et al. colleagues used an active contour model and the Optical Vander Lugt Correlator. The K-means clustering algorithm was applied to combine data from Miles Research and Eye Cancer datasets. Even in multiregional cancers, this technique was able to retrieve the iris tumour. The proposed technique was contrasted with the Iris Tumor Detection System, Potential Field Segmentation method, and HCSD-LAC. The following measures, such as the Dice coefficient (D), sensitivity (Sen), ausdorff distance (dH), and specificity, are used to assess the proposed approaches (Spe) [20].
In the authors presented the automatic the process of executing the genetic cancer counseling. In order to save time and to obtain robust system, the data between the counsellor and the patient were far significant [21]. In [22], Iris recognition was used for identification in this study. This iris recognition system contains three steps: feature extraction, feature matching, and data pre-processing. The iris area was located using the Hough transformation during pre-processing, and the iris data set is normalised into rectangular chunks. Tests were carried out utilising the k-fold cross approach with k = 5. Each iteration with 10 unique grades of KNN was employed. The k = 3 parameter on the KNN algorithm produced the best accuracy for iris identification at 92.63%.
Oyebade et al. stated that an iris nevus was a pigmented growth that often appears around the pupil, on the iris, or in front of the eye. The iris nevus, a benign iris tumour, was the subject of decision support diagnostic models presented in this article. 90.8% was reached in one of the models. Classification models like Artificial Neural Network: BPNN, RBFN, SVM with linear kernel and quadratic kernel were applied over 500 samples of iris images with parameters like hidden neurons, learning rate, maximum epochs. The training duration and recognition rate of both neural network models are similar, however the RBFN model needs a larger number of hidden neurons, while the BPNN needs larger epochs in order to perform as expected. Mean Square Error (MSE) is the metric used for analysis [23].
Thiyaneswaran et al. [24] projected a system to detect and extract the mole present in the eye. The RGB was transformed into gray-scale and applied median filter over the picture. The picture was then changed as binary image and underwent morphological operations. An Object Area Detection (OAD) algorithm was employed for searching the mole presence. The segmentation was validated with execution time is 0.903 sec.
The author Kamil Dimililer et al. [25] proposed two systems: ETDS and IETDS. The smoothing techniques used here was median filter for resized image. Dilation and Erosion were the morphological operations applied. Image intensity and quality was improved by enlarging the intensity of the pixels. The edge detected; segmented image is merged with grayscale image to get fused image. The detection rate is 95%. The sigmoid stimulation function was applied in the hidden and output layer. The accuracy attained was 95.7%.
Fei He et al. [26] approach produced better local Gabor features by applying optimised Gabor filters for each dataset, according to the findings of several comparison trials on the JLUBR-IRIS, CASIA-I, and CASIA-V4-Interval iris datasets. Additionally, in order to increase accuracy and reliability, SVR fusion technique may fully exploit their discriminative capability. Other comparison studies demonstrate that this method might perform better than other well-known iris systems.
Jen-Hong Tan et al. [27] proposed Genetic Algorithm with Gradient Vector Flow (GVF) snake algorithm to find eye and cornea. The VarioCAM, JENOPTIK laser was utilized to record the infrared pictures. The chin rest was 50 cm away from where the photos are taken. The total images taken were 125. The success rate was 90% using this algorithm.
Abdulkader [28] presented a specific approach to detect the iris tumor. The ROI along with pupil (affected area) was segmented in the pre-processing stage. Grayscale conversion was the primary step. Next, to eliminate noises, smoothing the picture was the next stage. The important step was the segmentation using canny edge detection. Miles Research dataset was employed, where it consists of 30 normal images and 70 abnormal images. The accuracy obtained was 98.5%.
Pablo et al. [29] proposed identifying the precise position and diameter of the tiniest sphere enclosing the iris in a picture of an eye. In this study, a wavelet approach combined with the Hough transform and a median filter-based approach are introduced as two methods for determining the least circle that comprises the iris. The rare type of cancer noted as eye cancer limits the professionals with much difficulty to recognize and diagnose. The symptoms are similar to other benign eye conditions which is highly challenging to differentiate the eye tumor with non-tumor eye. The delay in determining the cancer makes the tumor to be unnoticeable. The real difficulty lies in accessing the backside of the eye. With the limitations of the existing approaches, the contribution of the work implements the eye cancer detection using Convolution Neural Network with modifications in the layers yields the configuration I and configuration II. The utilization of CNN along with certain preprocessing technique obtains the reasonable accuracy compared to the existing systems.
The work intends to inspect the detection of tumor present in the iris. In this section, the dataset prepared, proposed framework, training mechanism, and evaluation metrics measures for measuring the effectiveness of the models is presented. Figure 2 shows the steps related to pre-processing the image. Deep neural networks’ parameters are studied from data rather than being analytically specified, and deep designs are recognised to be capable of strong generalisation. This study attempts to create an integrated outline for extra precise and reliable eye cancer exposure [33].
Conversion from RGB to gray-scale
The range of pixel is from 0 to 255. To eliminate the complexity of computation, the pixels are minimized such yield a gray-scale image. Figure 1 shows the picture from the dataset and the grayscale image.
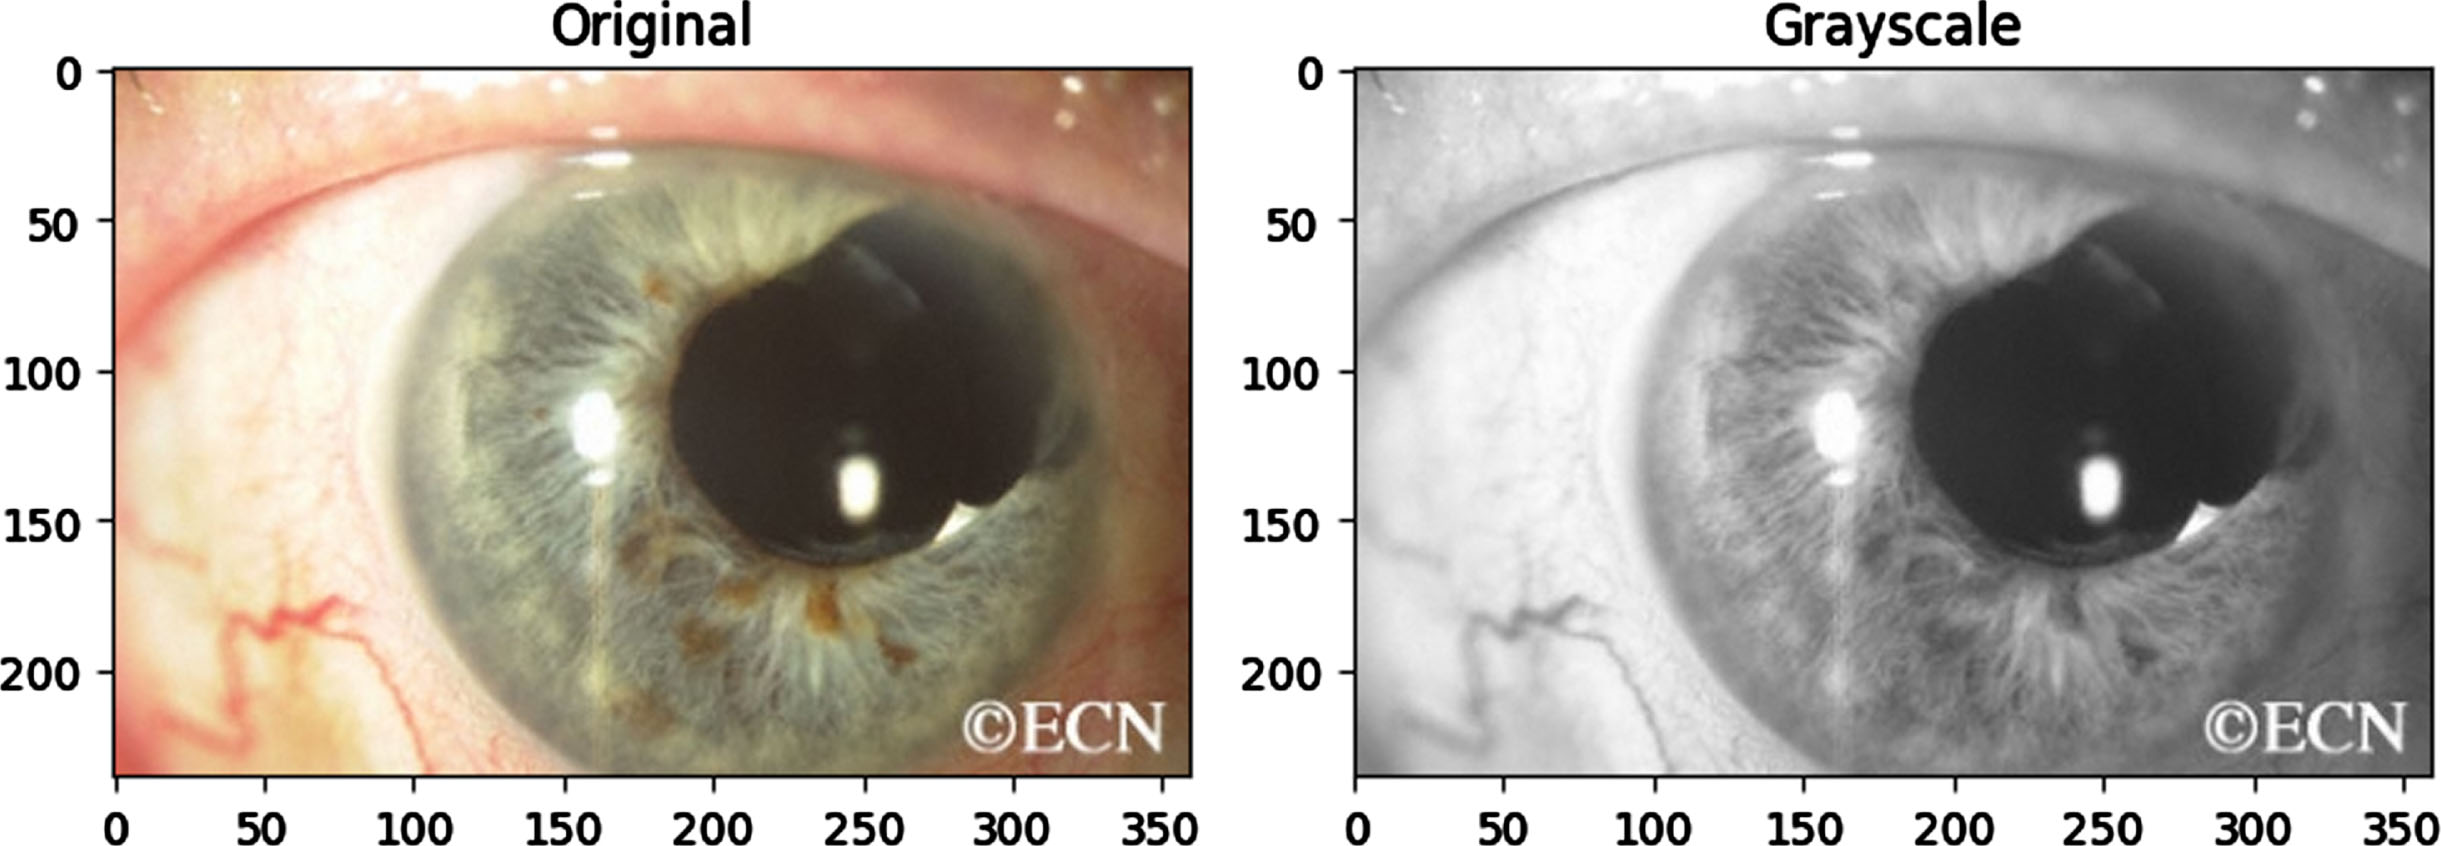
Original image vs gray scale image.
Any suggested strategies or algorithms of the recognition system should be implemented in the first step using a pre-processing method.
These methods can assist in removing the many noise kinds that emerged throughout the method of getting the iris image. The noise that is present in iris images is typically caused by a variety of factors, including blurring from eyeglasses and specular reflections. Other kinds of noise include that caused by lighting or illumination. The efficiency of the structure will be enhanced by removing this kind of noise during the pre-processing stage.
(i) Weiner Filter
The other names are Minimum Mean Square Error Filter or Least Square Error Filter. It is a linear calculation of the source image. The main aim is to decrease the noise in an image by computing the minimum mean square error between the original and the noisy image. Figure 3 indicates the weiner filter applied on the gray scale image.
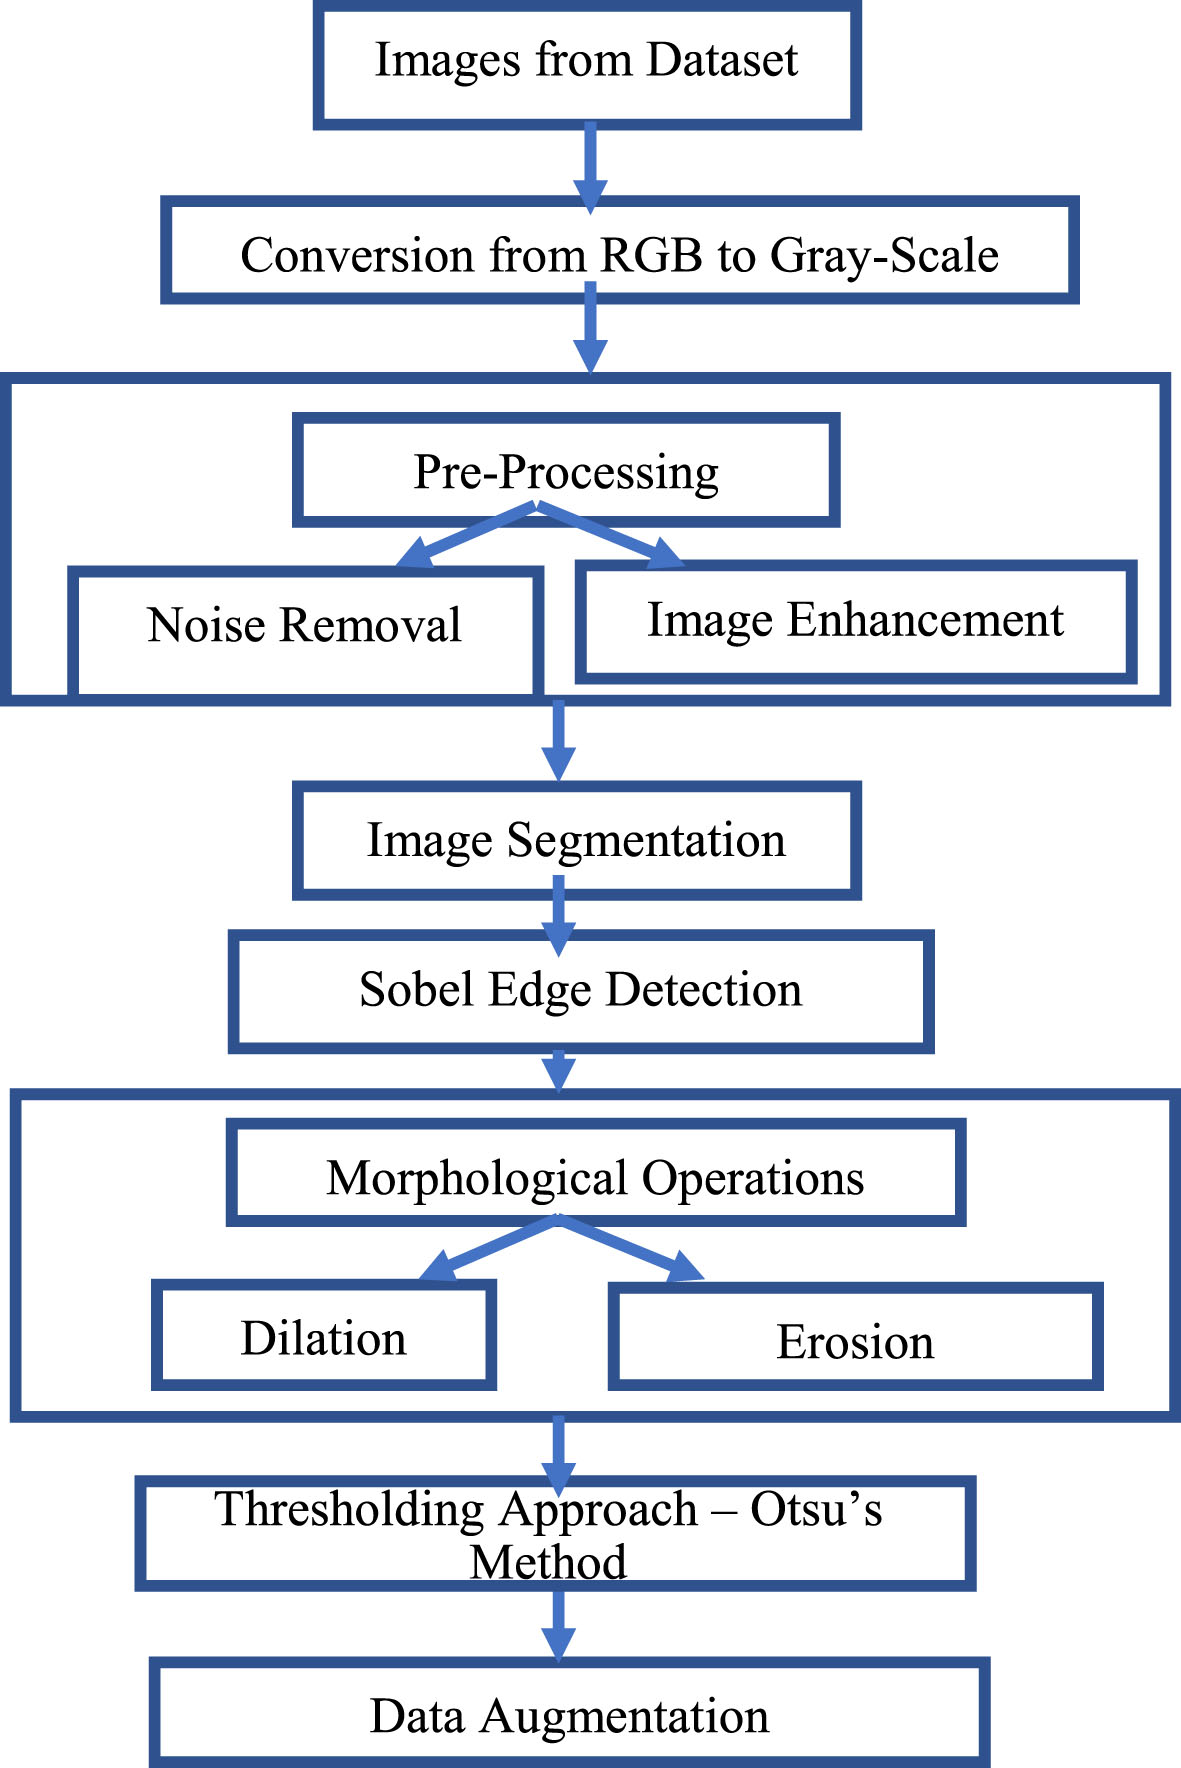
Stages from RGB to pre-processing.
(i) Image Enhancement
Local Histogram Equalization or Adaptive histogram equalization (AHE)
The adaptive approach differs from conservative histogram equalisation in that it boosts local contrast. The picture is segmented into various regions. AHE creates abundant histograms, representing each part of the picture. Figure 4 indicates the histogram of the original image.
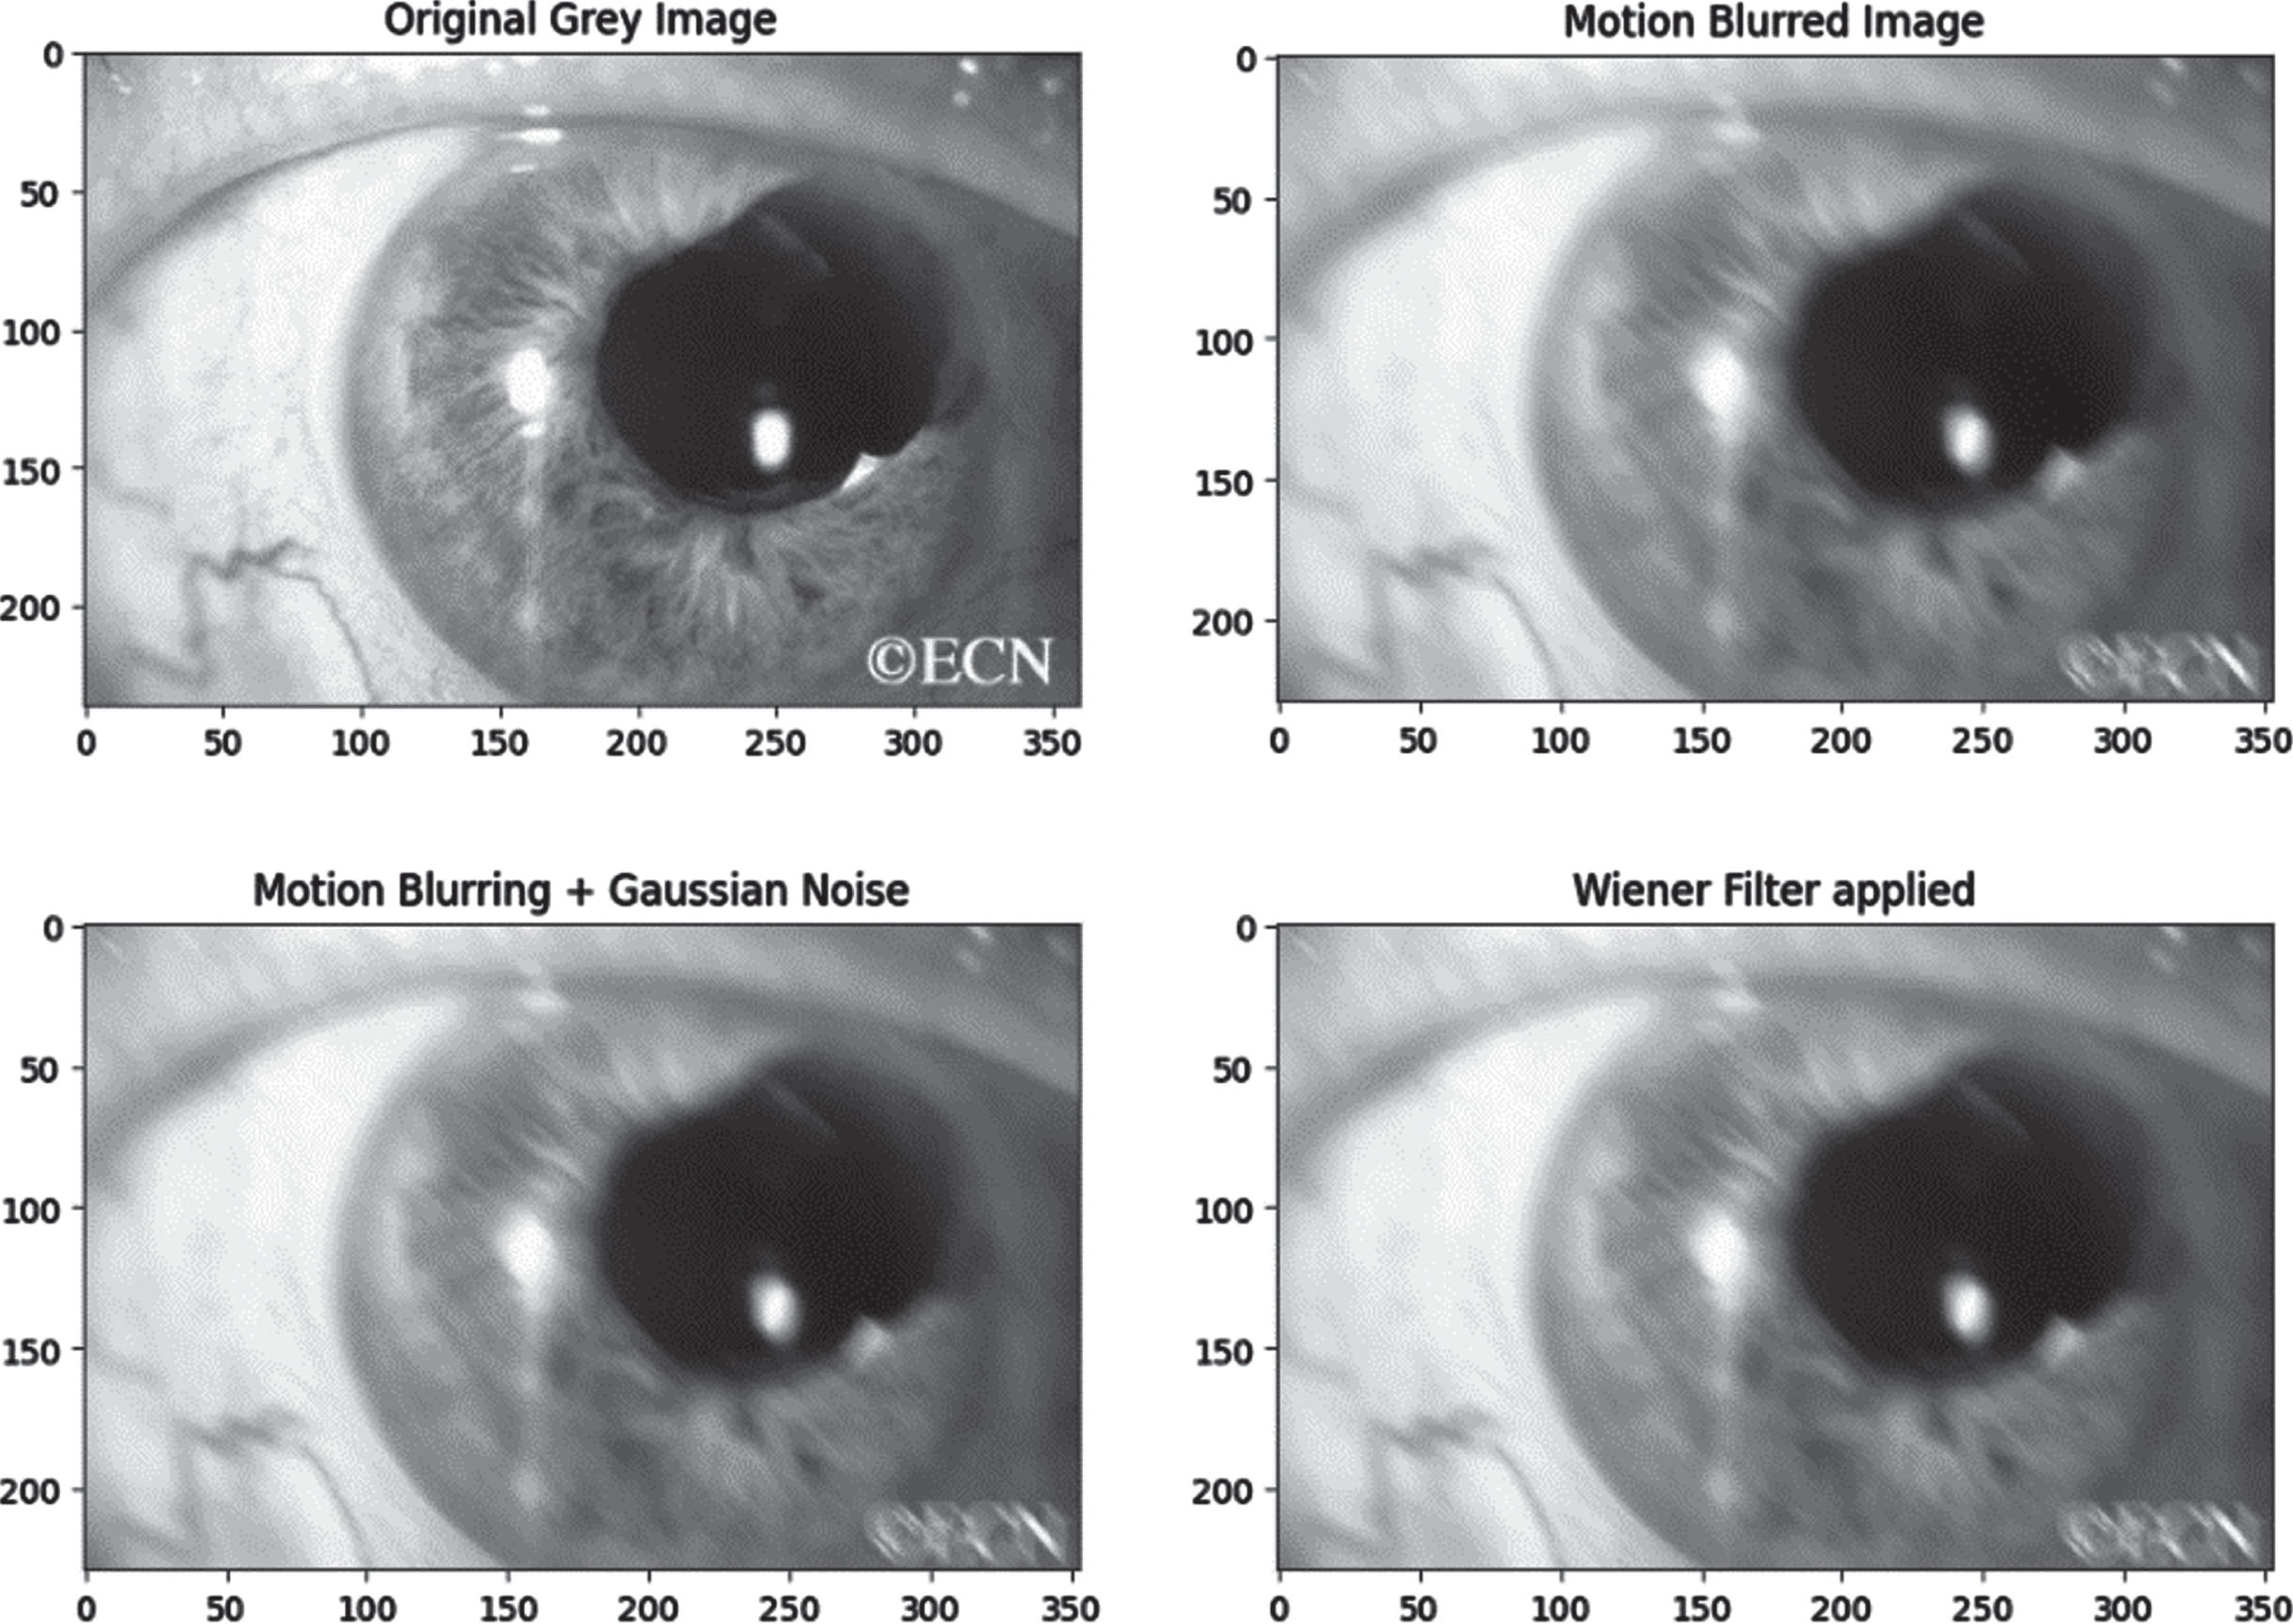
Weiner filter applied over the gray-scale image.
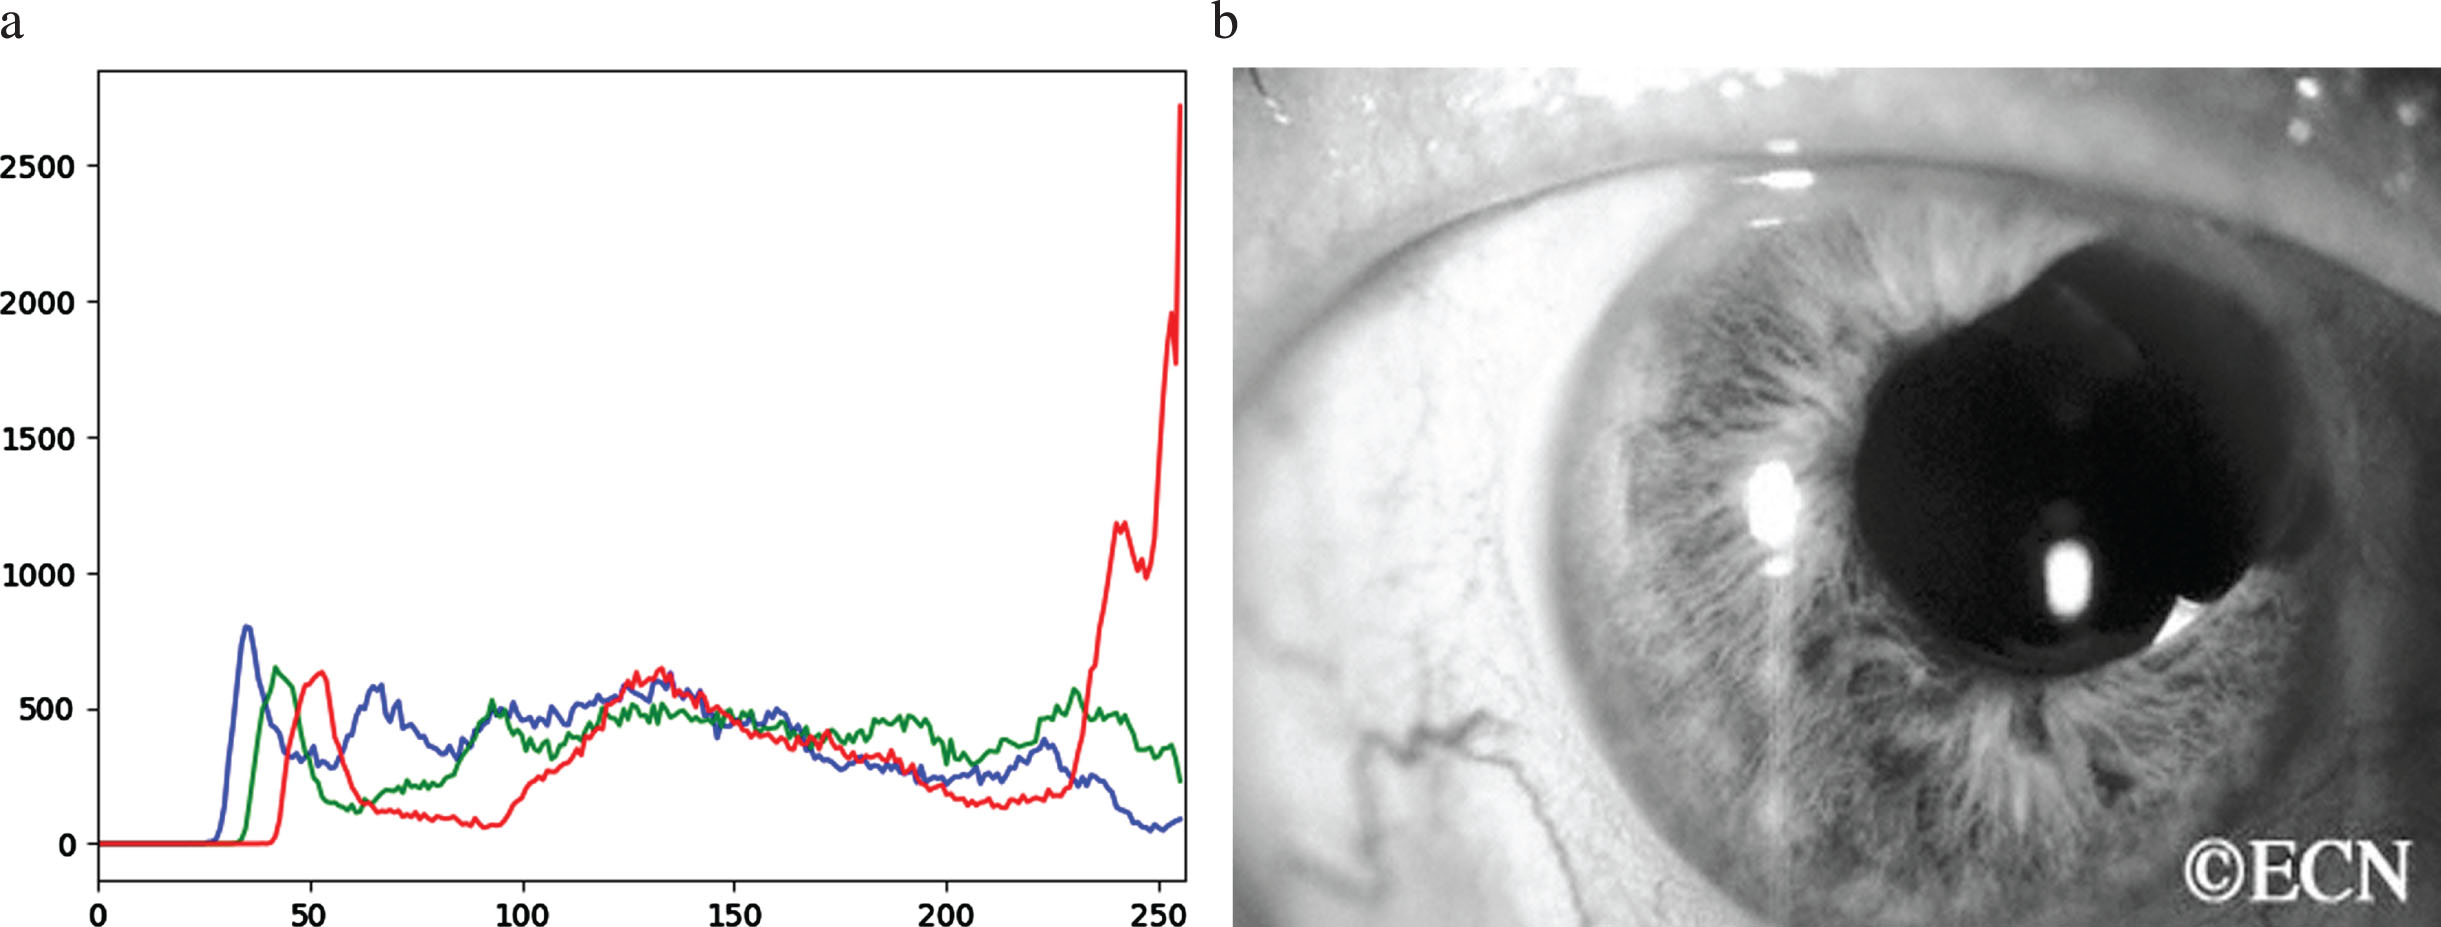
a) Histogram of original color eye b) image after histogram equalization.
When the image has incredibly bright or dark patches, AHE is preferable to regular HE. However, because the histogram is so concentrated in certain locations, AHE has a tendency to overamplify the contrast there. As a result, AHE might make sounds in the vicinity of constants louder. Figure 5(a) denotes the histogram using 100 bins for original picture. Figure 5(b) signifies the histogram of eye after equalizing the hist using 100 bins.
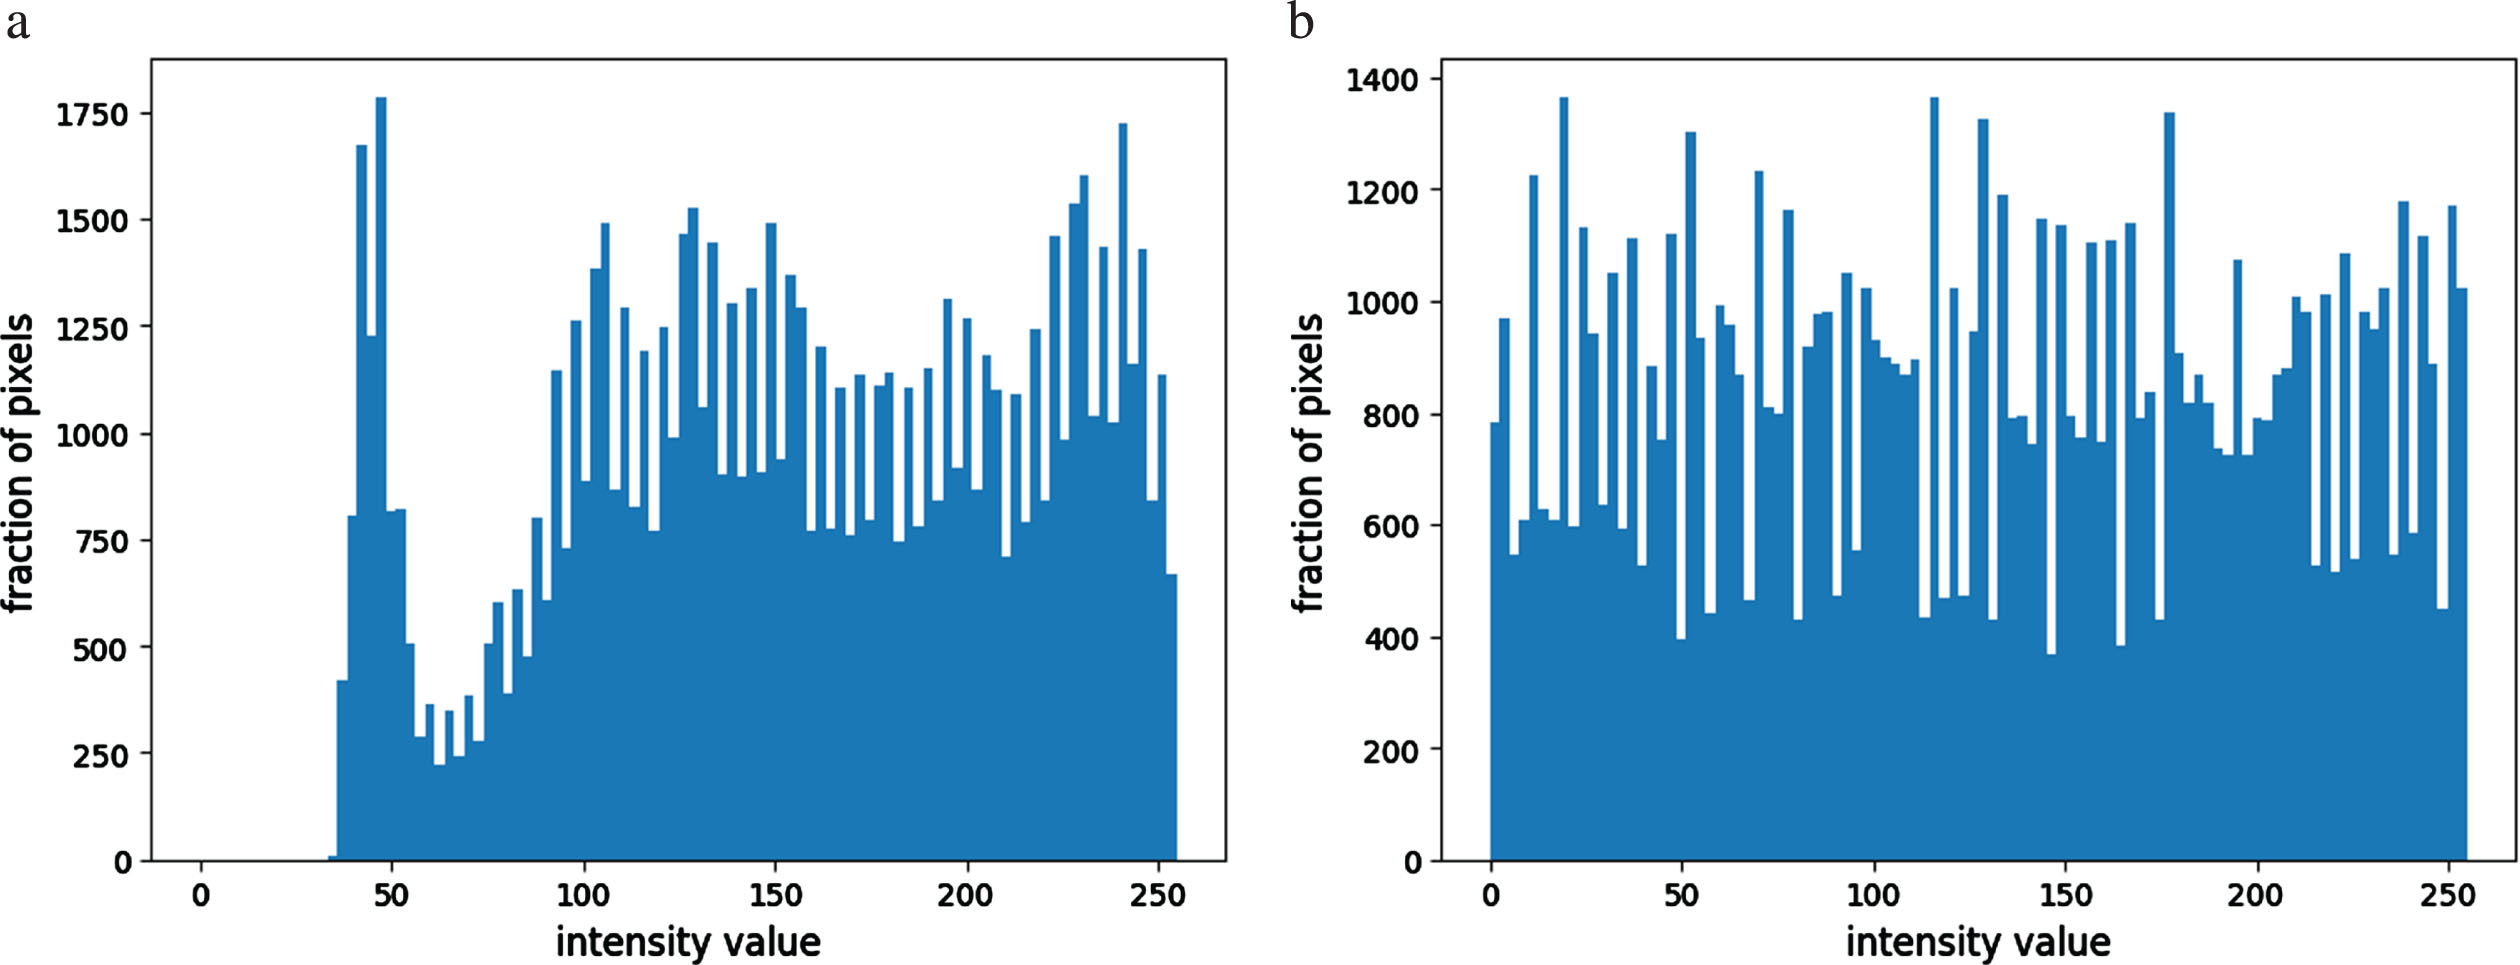
a) Denotes the histogram using 100 bins for original image b) denotes the histogram of image after equalizing the hist using 100 bins.
(ii) Circle Hough Transform (CHT)
Hough transform can detect the shapes like line, circle, ellipse. The parameters (r, θ) are used to detect the line. In order to detect circle, three parameters are required to define the circle. They are
The steps of CHT are as follows:
Step 1: Load the gray-scale image or Image from the dataset and convert it into gray-scale image
Step 2: To reduce noise and to avoid false circle detection, apply median blur.
Step 3: Use equation (3) and apply CHT. Use HOUGH_GRADIENT method Set the threshold values to detect the edge and for center detection Set the minimum radius and maximum radius of the circle to be detected.
Step 4: Draw and display the detected circle. Figure 6 shows the circle detection.
(iii) Otsu Thresholding
To discriminate between foreground and background items, segmentation techniques like thresholding are widely used. A threshold is a value that is surrounded on both sides by the ranges below and above it.
According to the linear discriminant criteria, Otsu’s thresholding method assumes that the image only consists of the object (foreground) and background and ignores the heterogeneity and diversity of the background.
L0 and L1 are the two segments of the image. L0 represents the range from 0,1 . . . n and L1 represents the range from n,n+1,..s-1,s. n shows the threshold value, s is the maximum gray level of the picture. The main objective is to determine the threshold value with min entropy of front and back of the image.
i, j means the index of rows and column of the eye. I, J means the rows and columns of the image, Prob(K) shows the histogram probabilities of the gray value.
weight a (n), mean a (n), variance a (n) of class L0 from the range 0,1 to n.
weight b (n), mean b (n), variance b (n) of class L1 from n + 1,..,s.
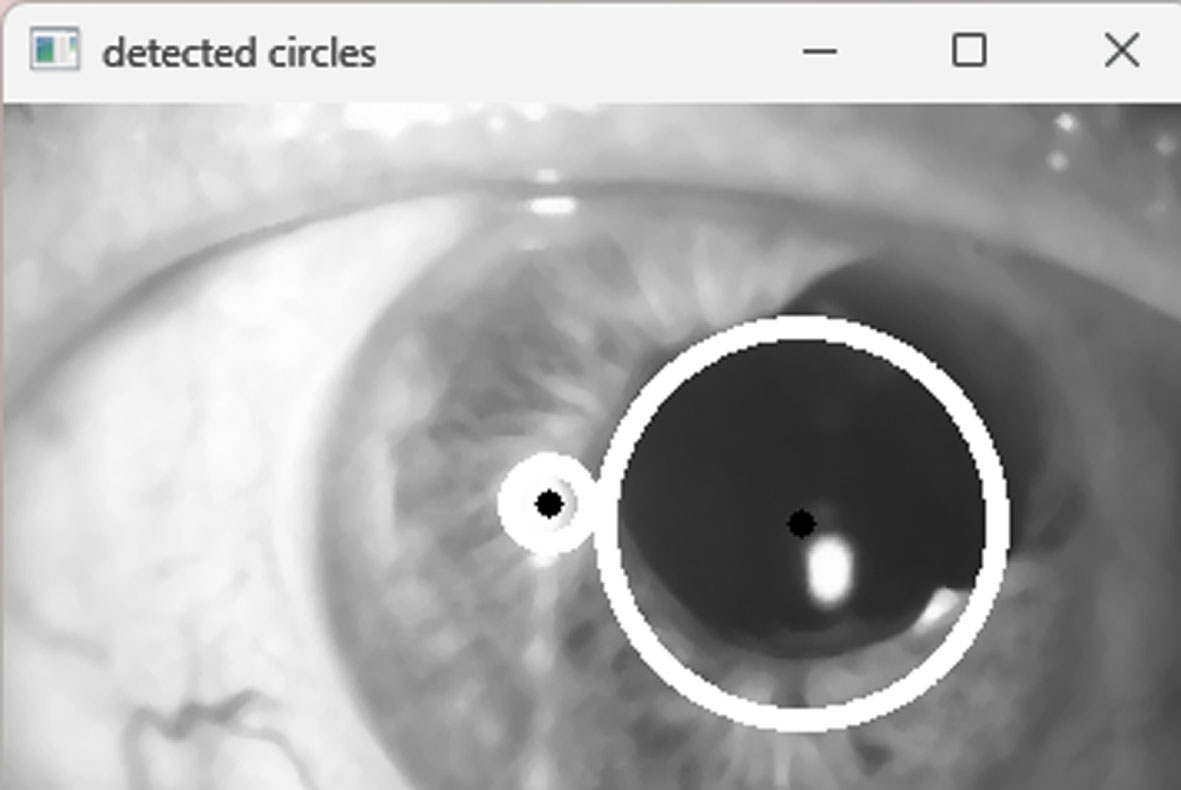
Circle detection using Hough Circle.
Figure 7 indicates the binary threshold, inverted image and binary image with otsu applied over the original image. Figure 8 displays the various thresholding applied over the image for getting the exact threshold for the image.
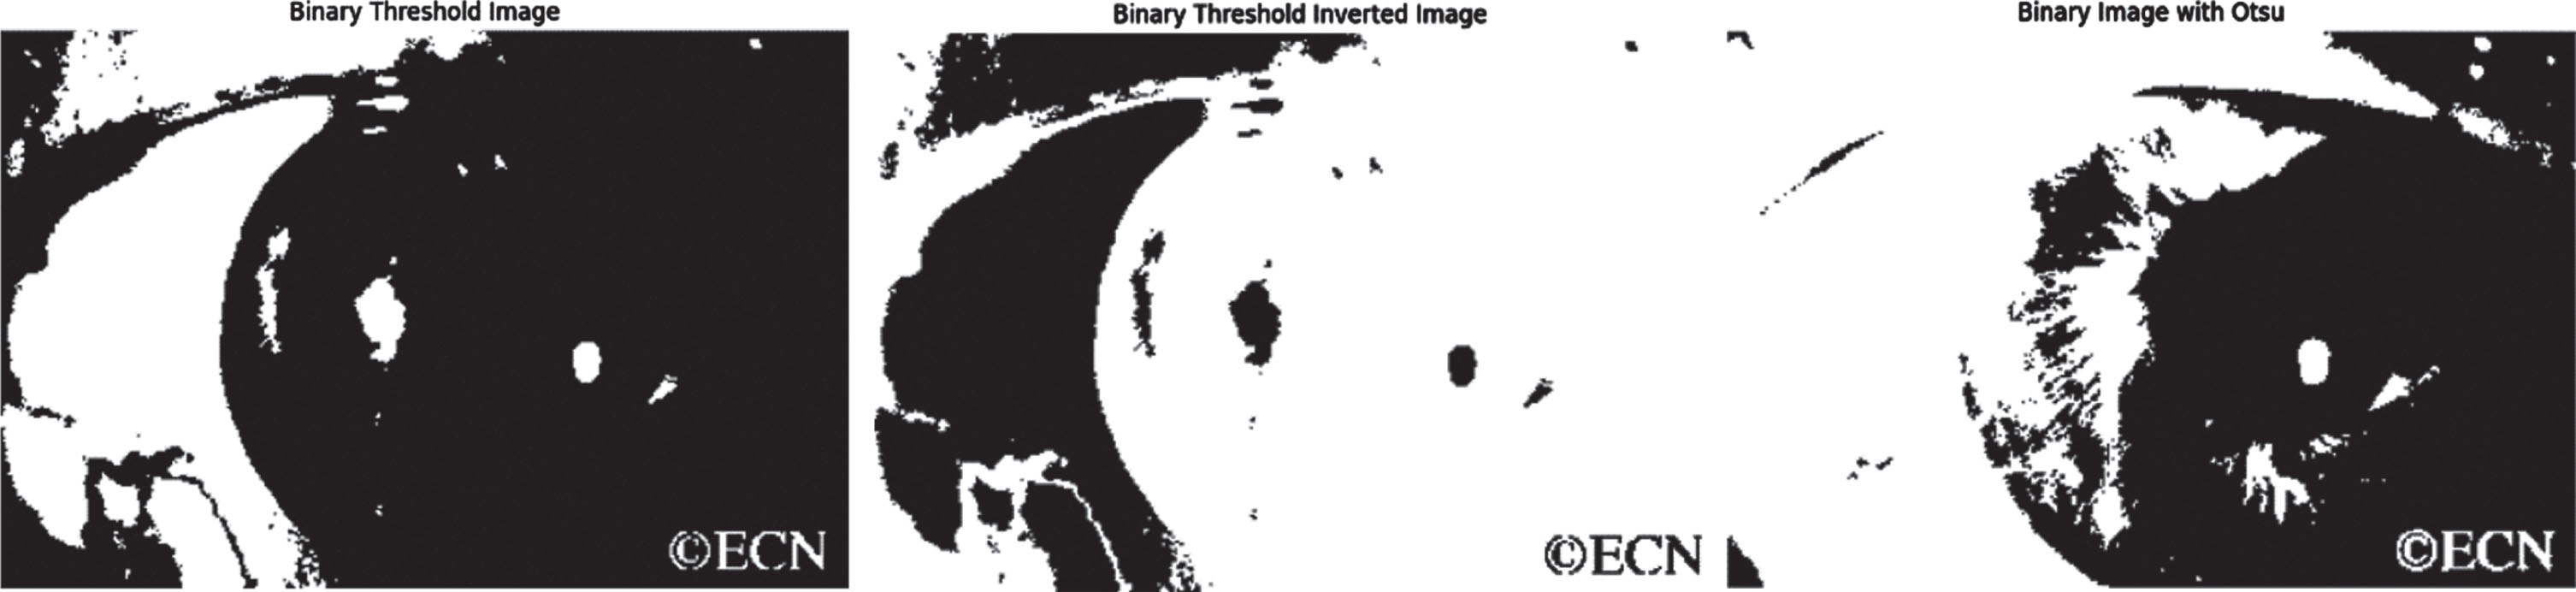
Binary Threshold, Inverted image, Binary Image with Otsu.
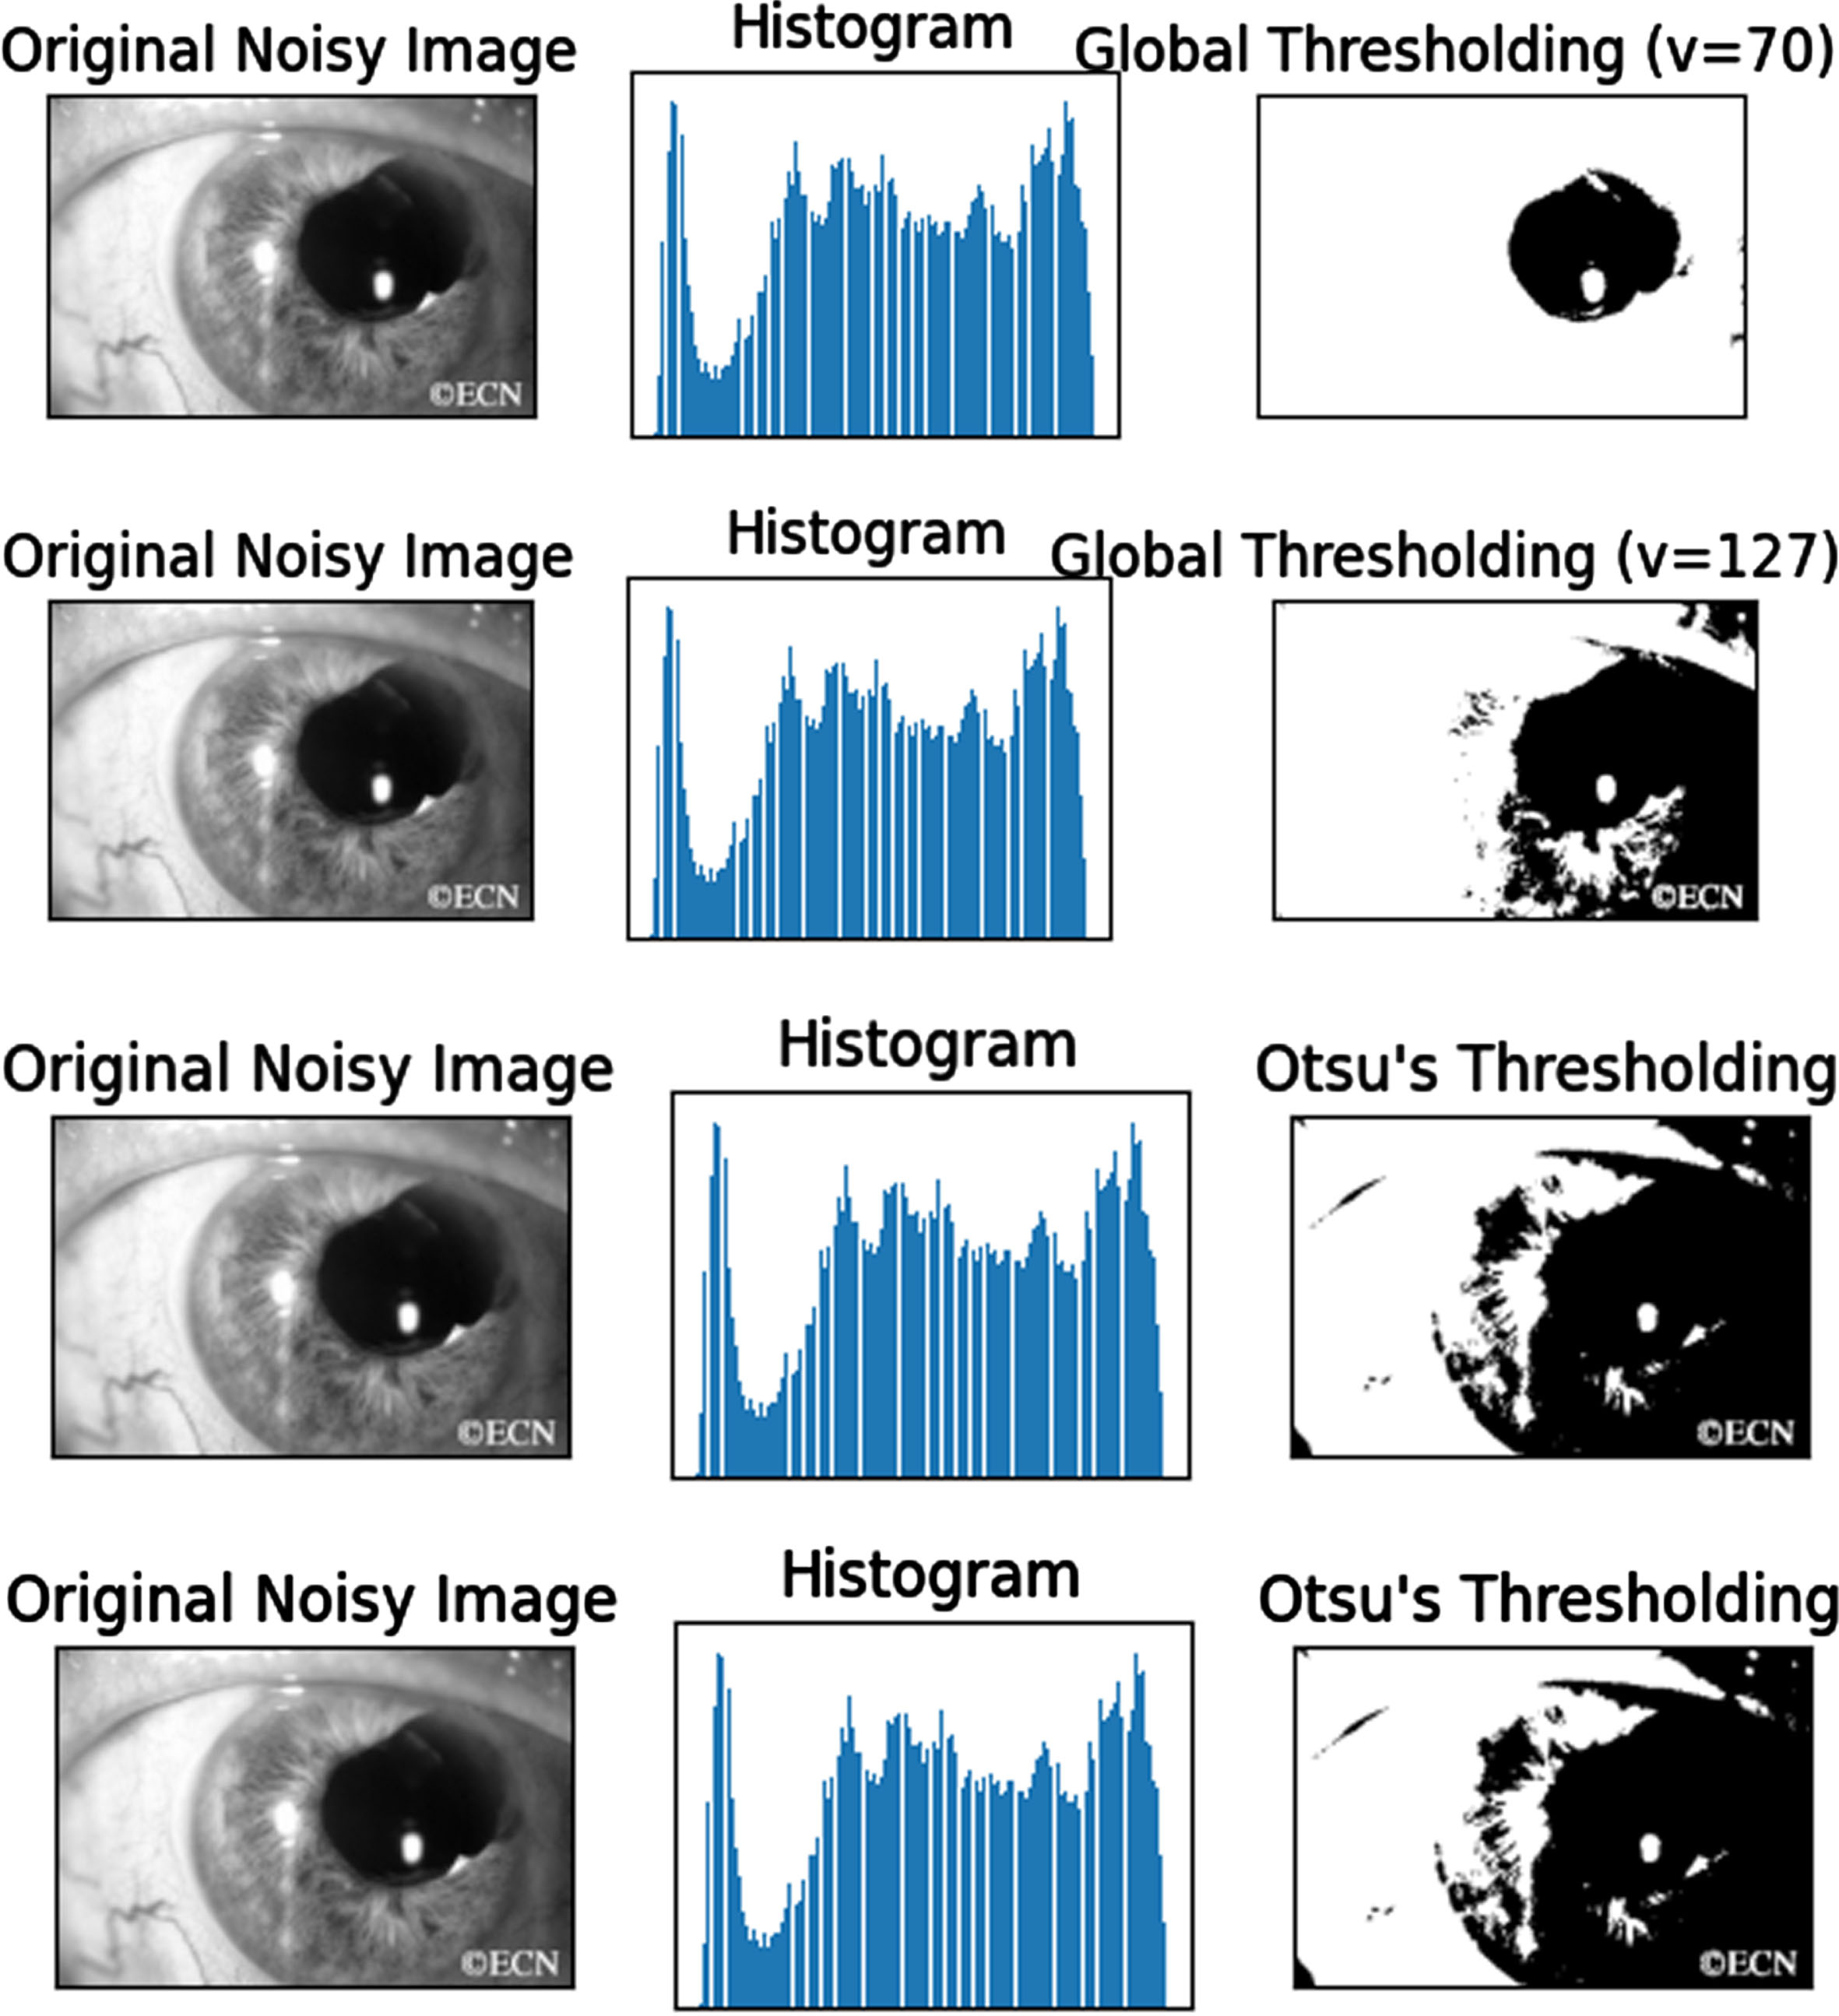
Comparison of various thresholding range over the gray scale image.
(iv) Sobel Edge Detection
The edge detection process significantly decreases the volume of data i.e. it removes the unwanted information. The edge of an image has variant intensity compared to other data inside the image. The methods used to detect edges are gradient estimation and Laplacian estimation. The equation used to estimate the intensity at a pixel in two directions x and y for an image p are
The gradient estimation is
The Sobel filter makes use of two 3 × 3 kernels. There are two to indicate the horizontal and vertical directions, respectively. To compute the estimated derivatives, the original picture and the two kernels are convolved. Figure 9 indicates the image on the sobel edge detection.
To determine the gradient magnitude at each individual pixel in the image, the gradient approximations provided by Gx and Gy are merged using the following expression.
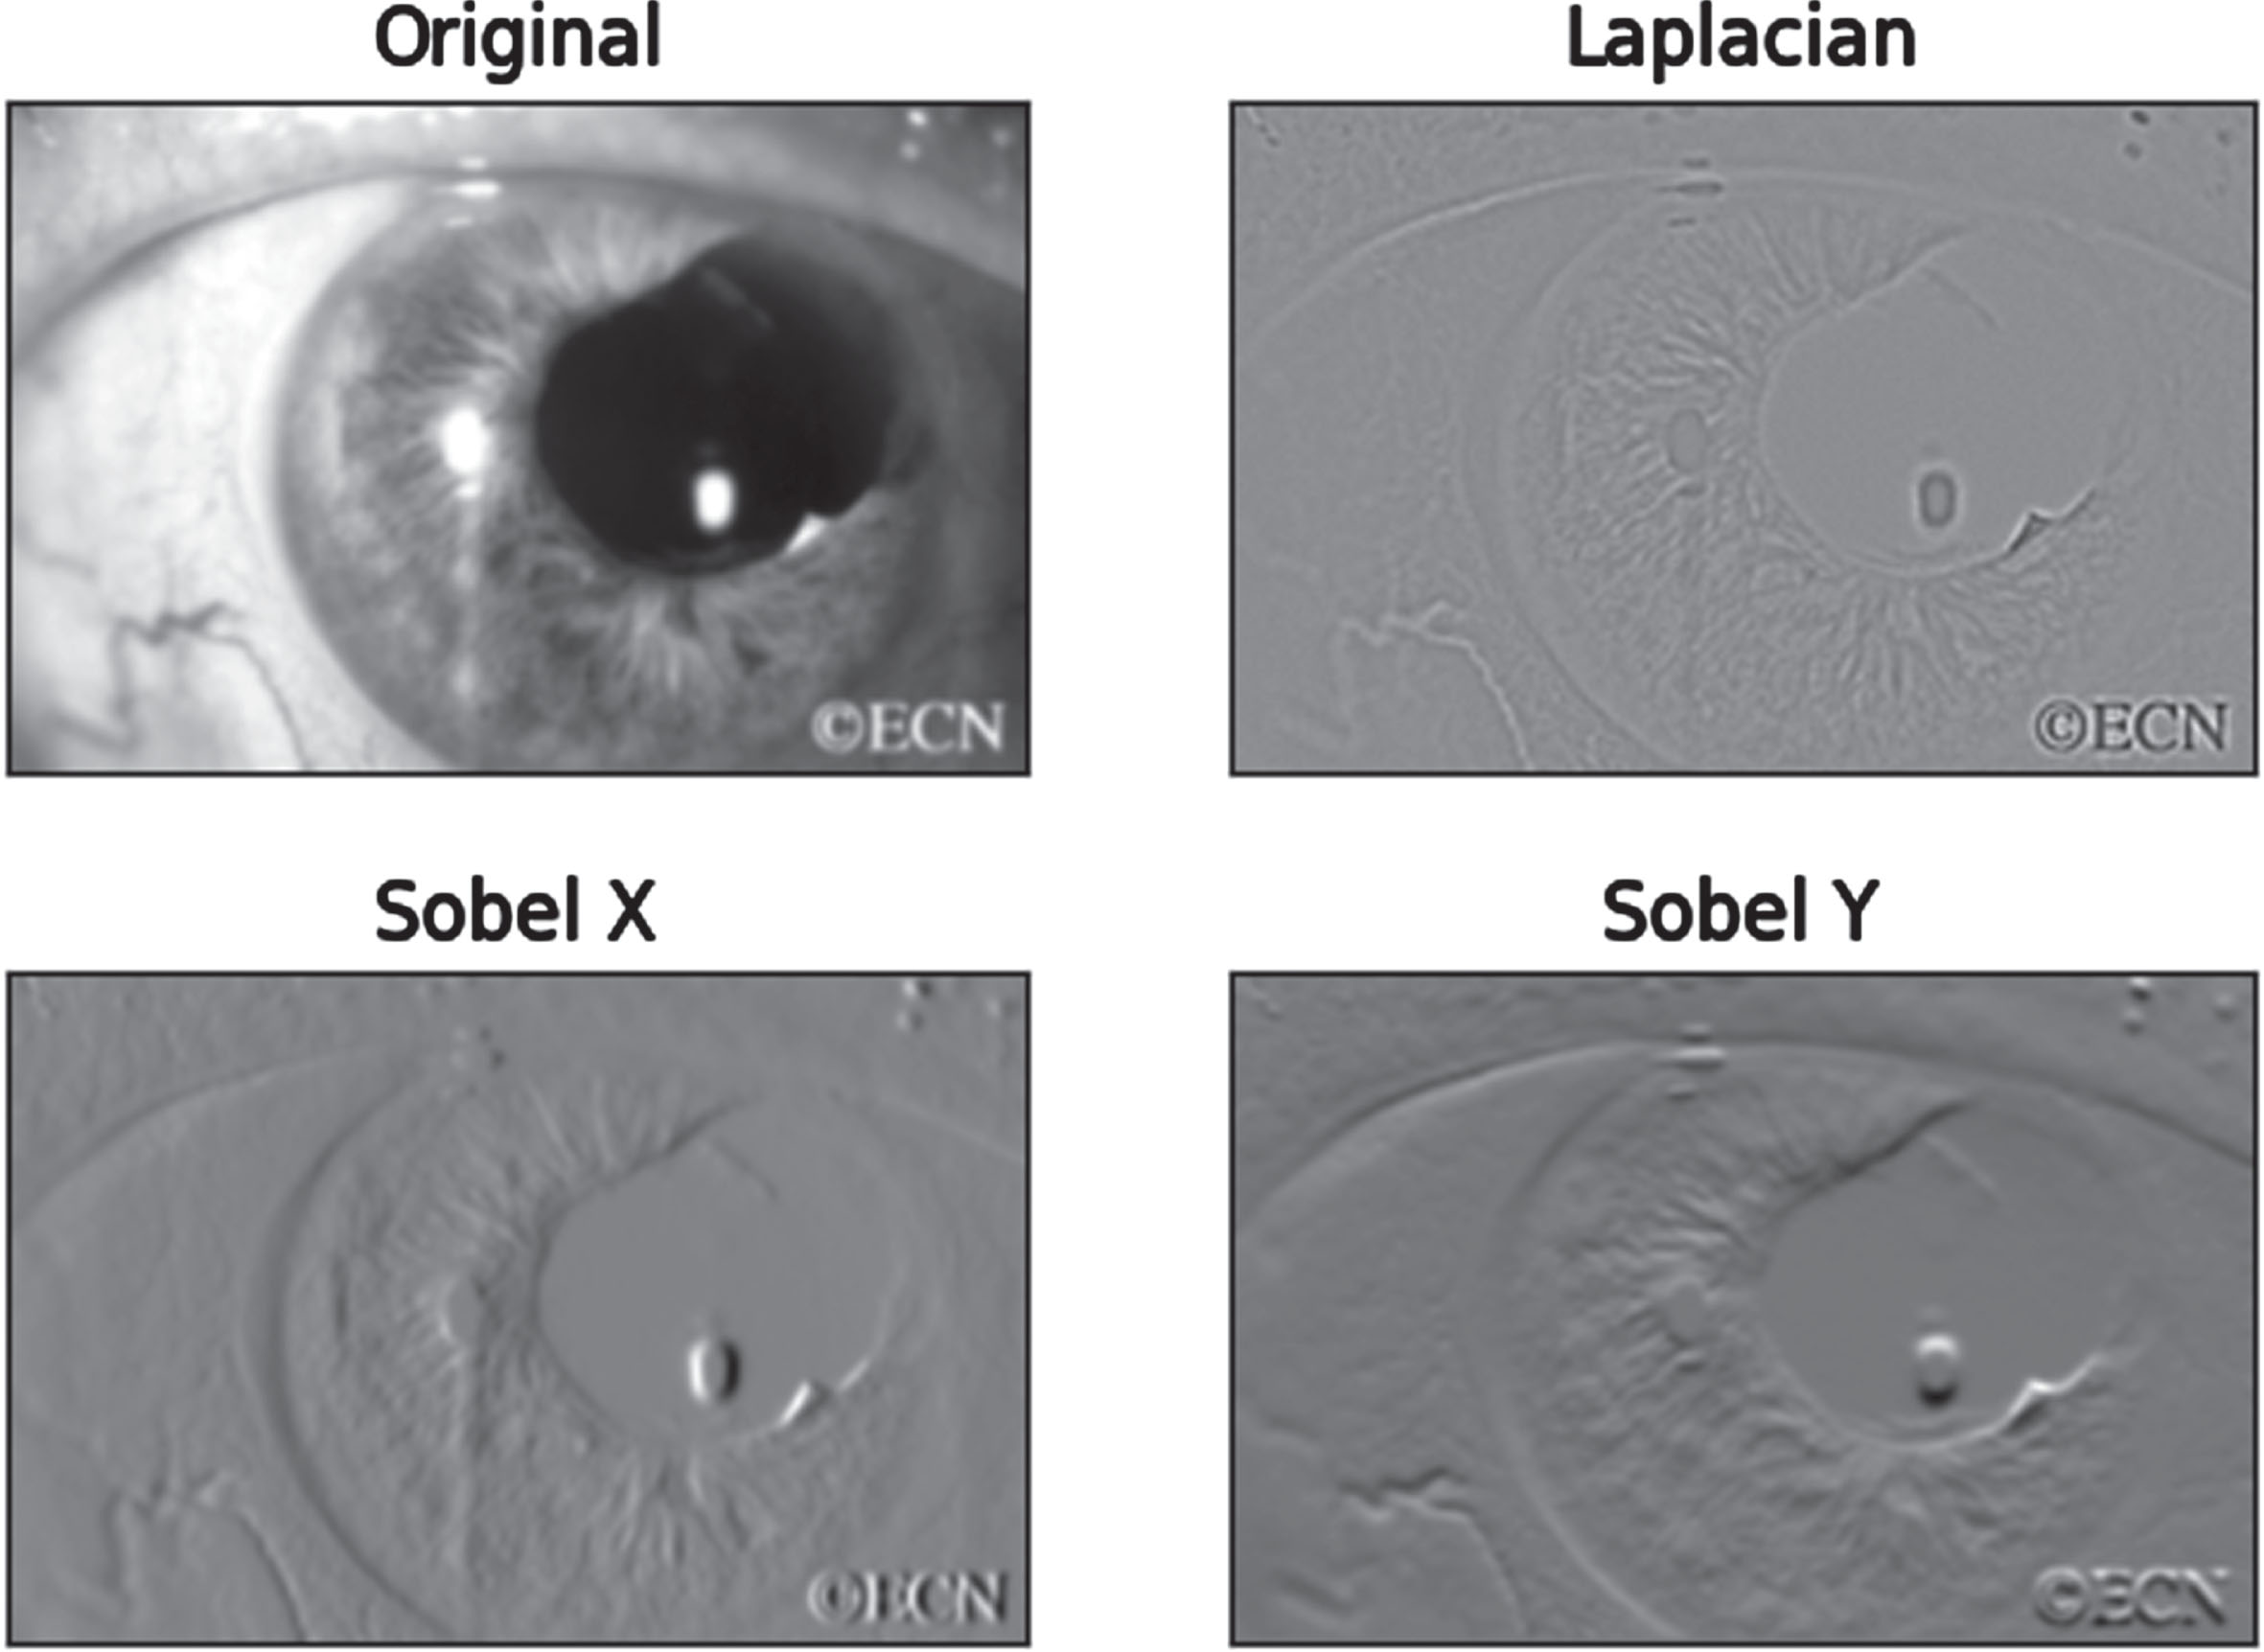
Laplacian and Sobel technique.
The magnitude is calculated is using
The gradient’s direction is calculated using
(v) Image Augmentation By modifying the existing data, image augmentation produces new data that can be used for model training. To put it another way, it refers to the process of improving the dataset that is made accessible for deep learning model training. Image Rotation The information of the image does not alter even though, the image is rotated to some degree. Image Flipping The add-on to the image rotation is the technique called flipping. The images can be in the form of inverted, left flip, right flip of the original image. Image Shifting
With the help of the geometric transformation known as “image shift,” each object’s position in the input image is translated to its new place in the output image. The effect is that, as seen below, an object that was at position o, p in the original image is now at position O, P. where the dl and dm of the letter represent the equivalent shifts in both directions.
The details on the outcomes obtained through the experimental analysis was presented. The key aspect of this work is to classify the benign and malignant iris tumor.
The original dataset is considered from New York Eye Cancer Center. To increase volume of the dataset, augmentation technique was applied over the images in the dataset. The total images present were 34. After augmentation technique, the images generated were 2400. Normal images are 1200 and abnormal images are 1200. 80% of the images were used for training. 20% images are used for validation and testing.
The training parameters are adjusted for both proposed methods to yield the best results. The learning rate of 0.001, batch size is 32 and the loss function employed is binary cross-entropy. The number of epochs for proposed method 1 is 80, where for the proposed method 2 is 60. The relu and SoftMax activation functions are used in the proposed method 2. The increase in the layers with Sine Cosine Fitness Gray Wolf Optimizer (SCFGWO) strives the better result compared with the other existing methods.
Hyper parameters
Hyper parameters
The proposed method 1 is described in the Fig. 10. The pre-processed image is fed into the CNN phases. The hyperparameters are adjusted and optimized based on the input from the SCFGWO algorithm.

Proposed Method 1 architecture.

Combination of 3XConPool.
The CNN consists of many layers where parameters are to be calculated. The order of layers is described below. Input Layer: The image with the size of 64*64 act as the input to the input layer. The total size of this layer is 4096. Convolution layer 1: This is the second layer of CNN where it begins the learning process. The filter size used is 5*5, stride is 1. Convolution layer 2 and 3: The filter size is 3 with stride = 1. Pooling Layers 1,2 and 3: Maximum pooling has no learning parameters. Soft-max layer: This layer calculates its parameter value by considering the current layer filtee3gbn7r and previous layer filter.
The Sine and Cosine algorithms with Grey Wolf Optimizer are used to optimize the hyperparameter. The algorithm is described in Algorithm 2. The population with size n is divided into two parts called exploration n1 and exploitation n2 where n1 to find the possible solutions in the search space. This n2 group acts as an objective function for the derivation of the optimal solution. The fittest solutions are represented as
A = 2a . r1 - a and C = 2r2 {r1 and r2 are randomly selected from [0,1]}, {a is from [0,2]},
The fitness function is estimated as
The proposed method 2 is described in the Fig. 12. The pre-processed image is fed into the CNN phases. The hyperparameters are adjusted and optimized based on the input from the SCFGWO algorithm. The convolution layer is followed by the pooling layer with 5 times and at least the fully connected layer is there for the classification.

Proposed method 2 architecture.
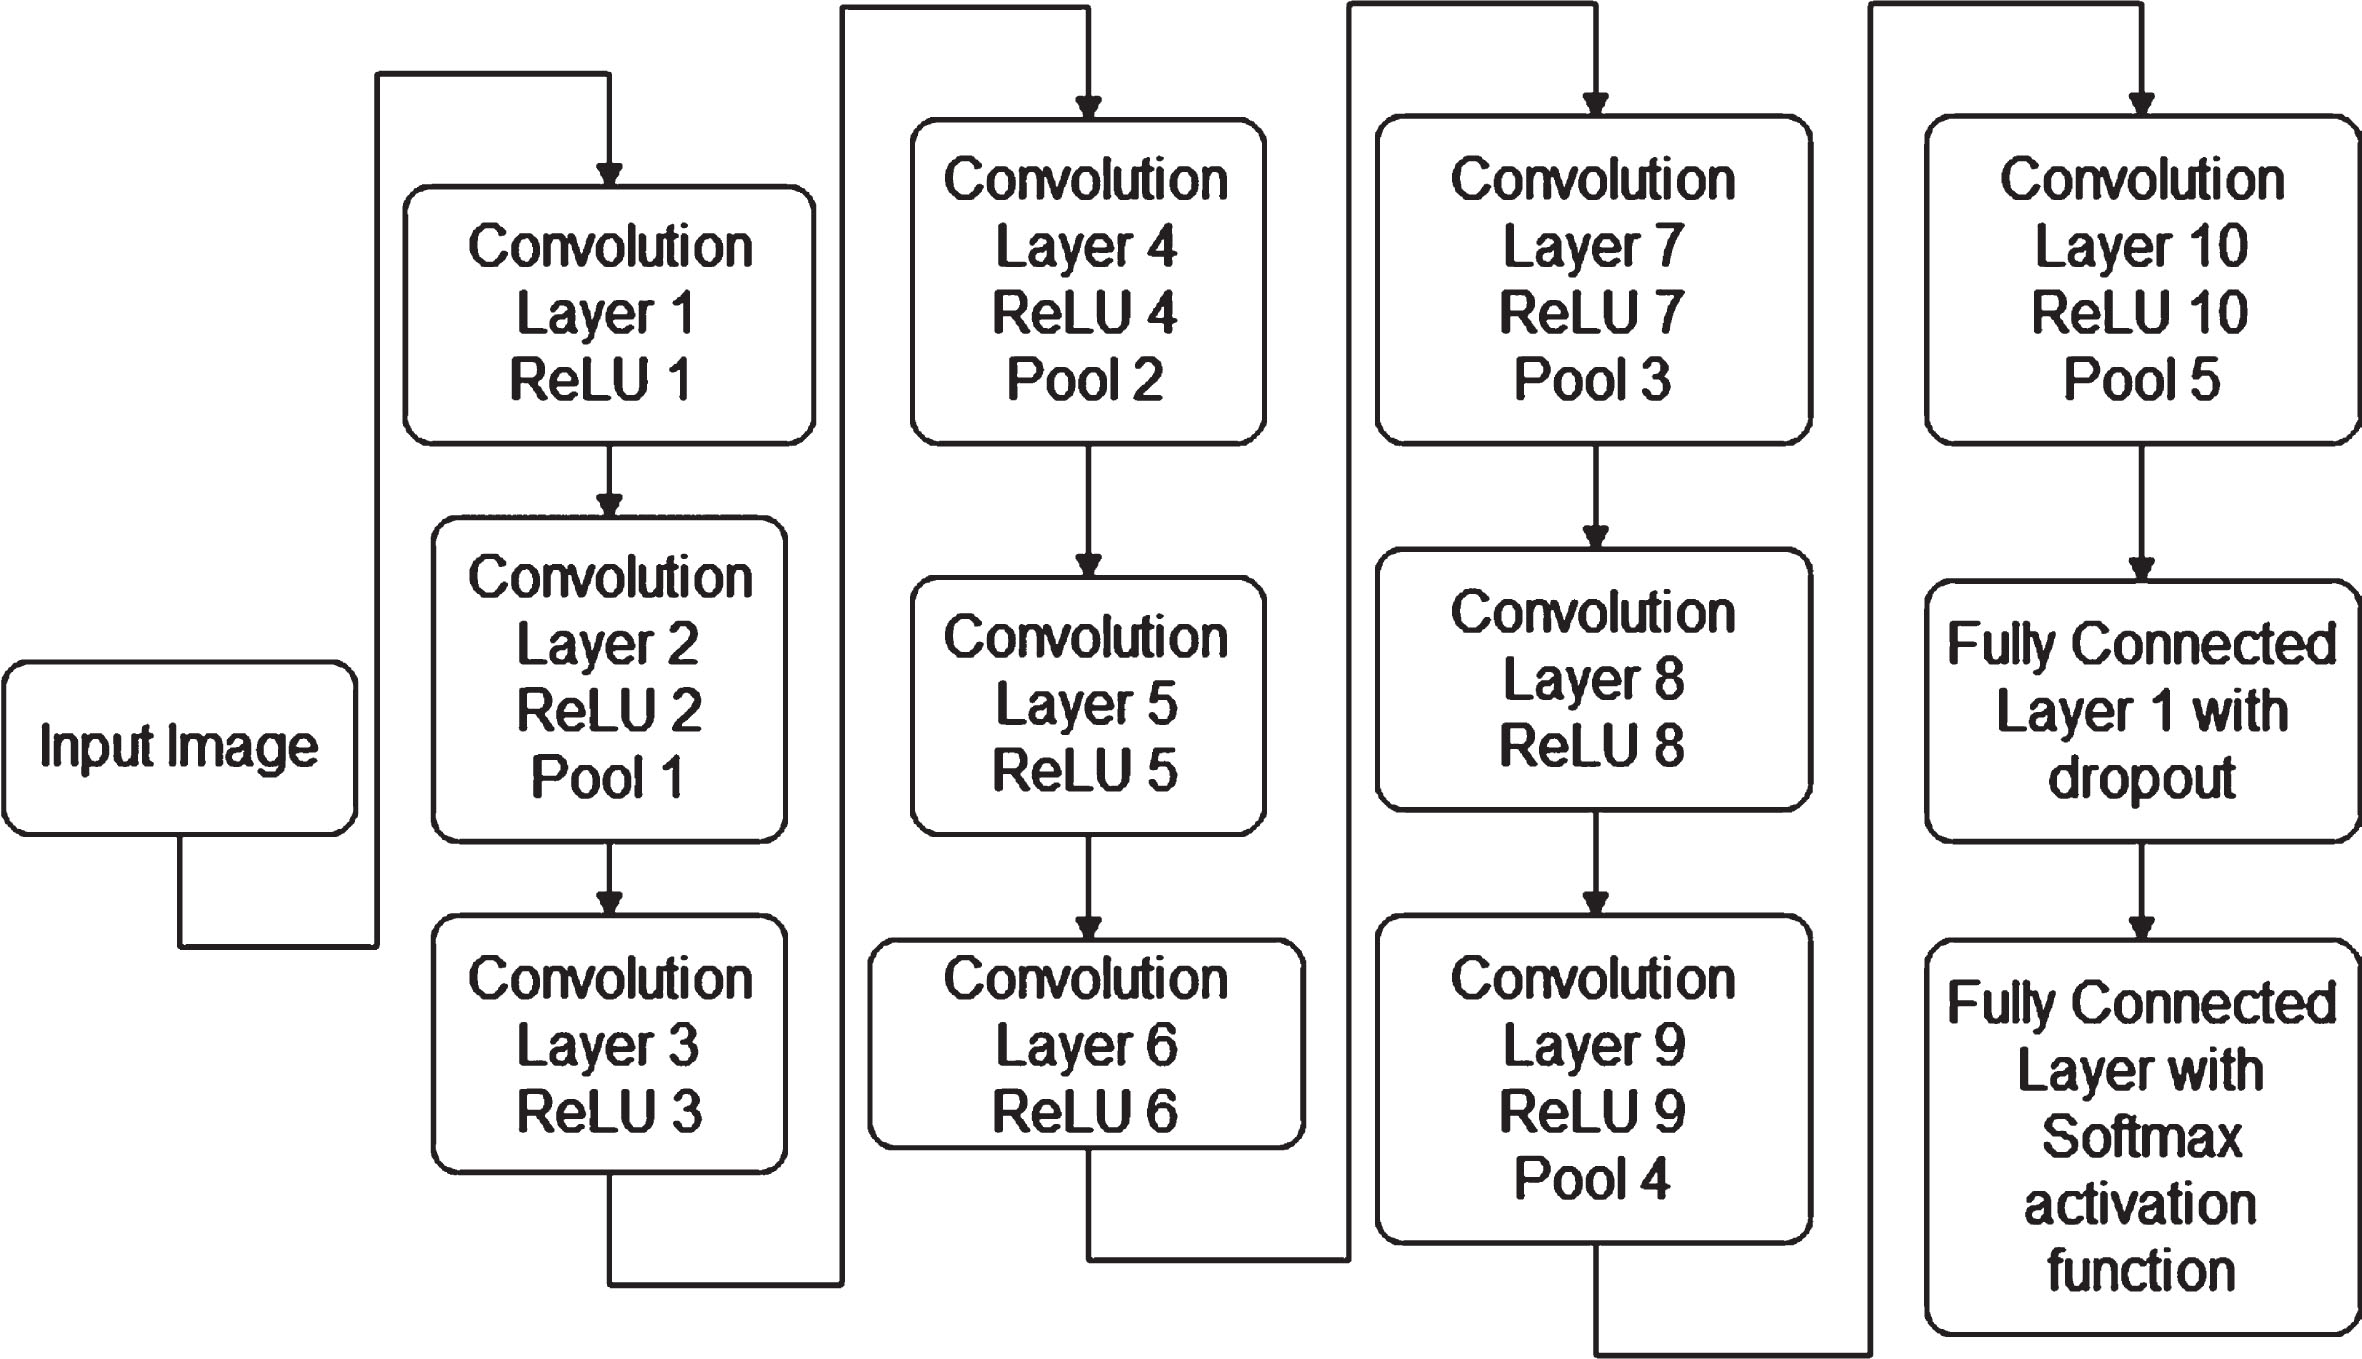
Combination of 10XCon5XPool.
The gradient problem which is common error occurs during training phase can be eliminated by using relu activation function. This Relu function is faster compared to other activation functions. The input image of size 64*64 is passed to the first convolution layer. The convolution layer 3 with Relu activation function and Pooling is used. This is continued up to convolution layer 8. The convolution layer 9 and 10 are configured with Relu and Pool. The result from final layer is connected to FC layer 1 with drop out. The soft-max function is the important factor in the FC layer is at before the resultant layer. The output layer has two outputs.
The outcomes are evaluated using True Positive, False Positive, True Negative, True Positive.
The Fig. 14 shows the comparison of accuracy with training and testing data for two proposed configurations. The Fig. 15 indicates the comparison of recall for the proposed configurations. The Fig. 16 shows the precision metrics for the projected configurations. The Fig. 17 shows the f-score for the configured layers.
The accuracy of the proposed systems is compared with the existing systems and it is shown in Fig. 18. The Table 3 shows the comparison of accuracy for the proposed methods during training and testing stages. The Table 4 shows the comparison of recall for the proposed methods during training and testing stages. The Table 5 shows the comparison of precision metrics for the proposed methods during training and testing stages. The Table 6 shows the comparison of F-Score for the proposed methods during training and testing stages. The proposed architectures contain 3XConPool with SCFGWO and 10XCon5XPool with SCFGWO. The Grey Wolf Optimizer with increased convolution, pooling layer obtains better accuracy compared to other existing systems.
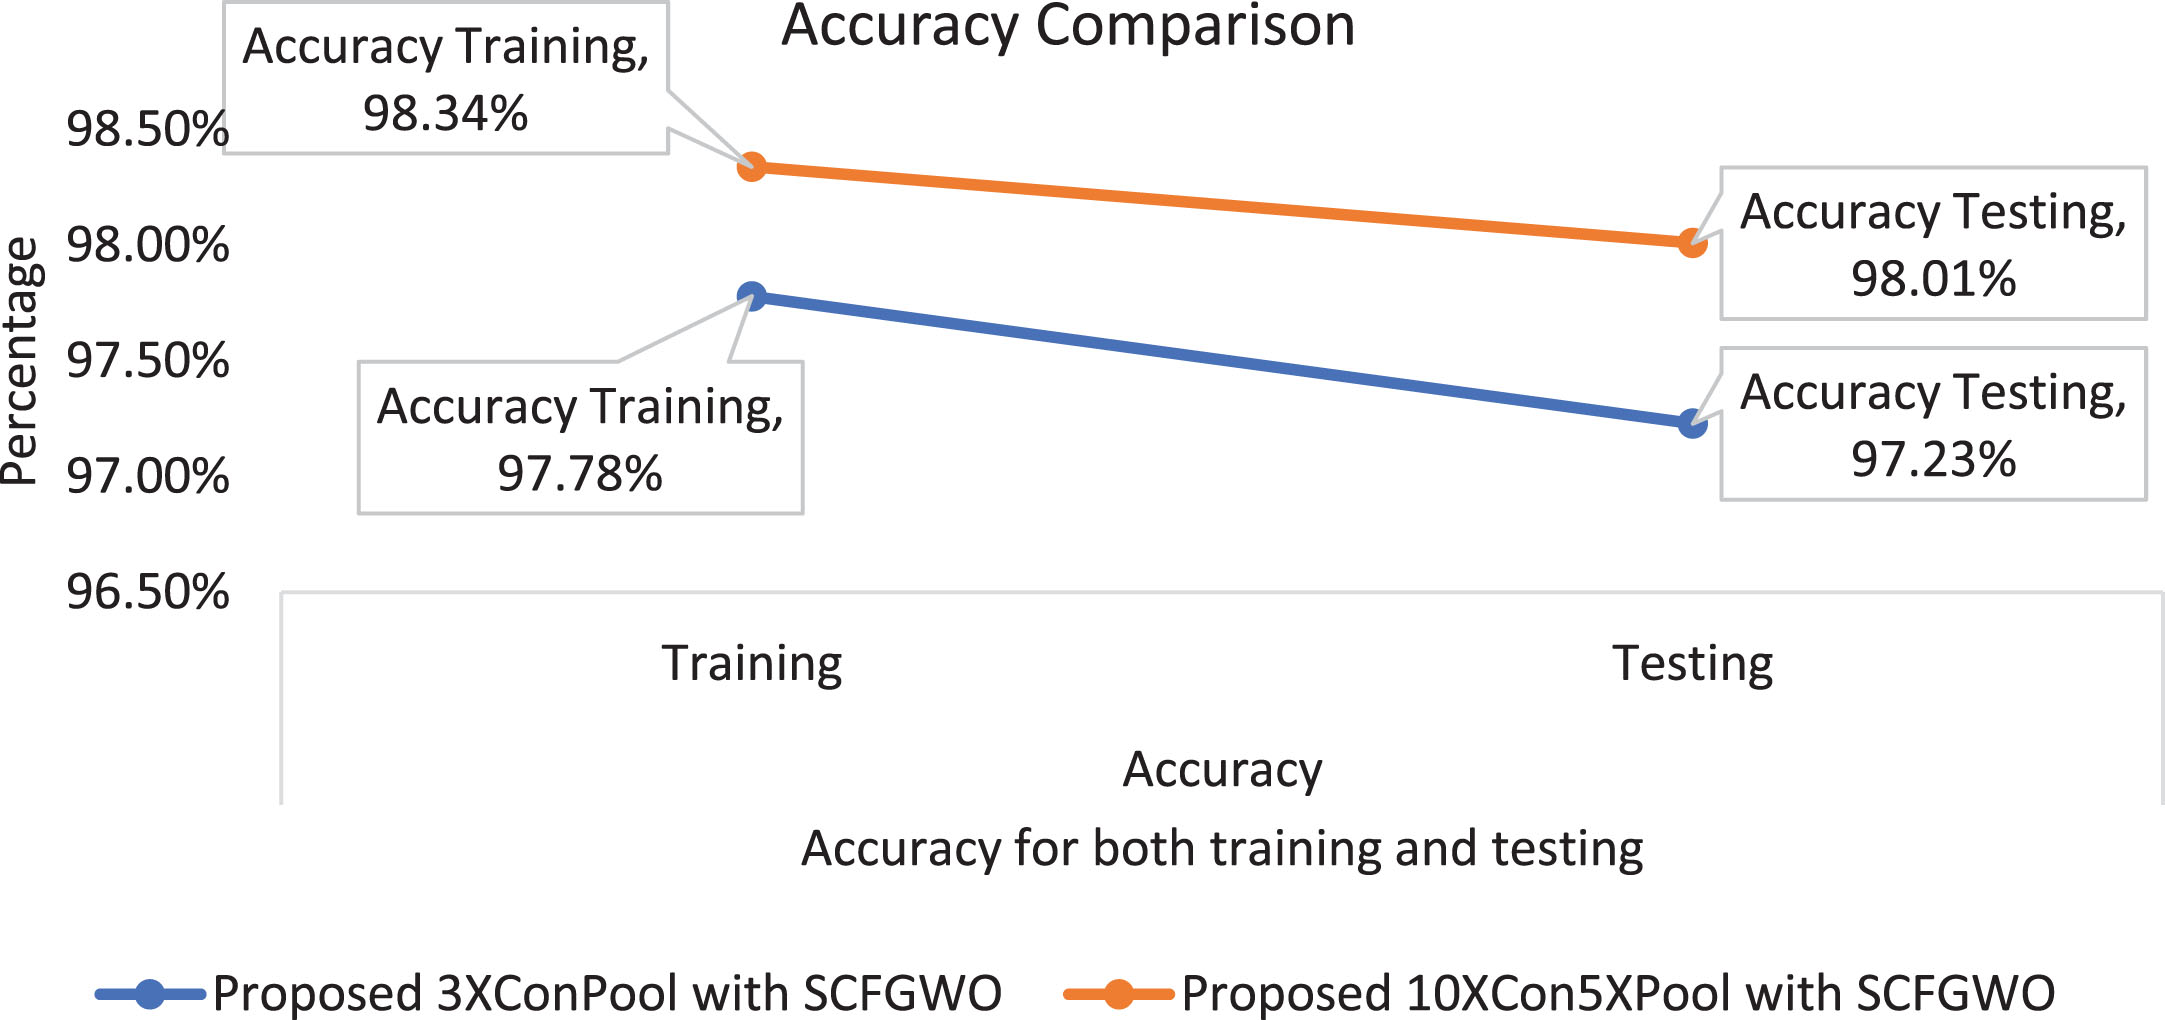
Comparison of Proposed Method 1 and 2 with their respective accuracy.

Recall for configuration I and II.

Precision for Configuration I and II.

F-Score for Configuration I and II.

Comparison with existing systems.
Comparison of accuracy metrics
Comparison of recall metrics
Comparison of precision metrics
Comparison of F-score
The eye cancer detection is the difficult challenge in the early stage for the experts, which has flagged the path for the efficient technique. In this article, an efficient and effective configured CNN is developed with the tuning of Sine Cosine Fitness Gray Wolf Optimizer method to detect the eye cancer from the dataset. The hyper parameters are implemented with the CNN architecture to address the eye cancer detection problem. The image from the dataset is pre-processed. In the pre-processing stage, the noise removal technique like Weiner filter and image enhancement strategy like Adaptive Histogram Equalization are applied. Further, the image segmentation like Otsu thresholding and edge detection like Circle Hough Transform (CHT) are applied. In addition to that, in order to increase the dataset size, rotation, flipping and shifting methods are utilized. After the first stage, i.e pre-processing, the hyper parameters are adjusted with the configured CNN. A configured CNN with Sine Cosine Fitness Grey wolf Optimization algorithm-based approach is proposed for the eye cancer detection. The Proposed Method 1 and Proposed Method 2 is compared here, where Proposed Method 2–5 times convolution layer with pooling layer yields high accuracy compared to proposed method 1. The main contribution by the SCFGWO algorithm resulted in the achievement of accuracy. The efficiency of the proposed methods is compared with the existing methods like InceptionV3, MobileNet, VGG16, Xception, CNN, Deep Learning, Modified LeNet and BPNN.
A crucial step in the detection of eye cancer is spotting abnormal growths or abnormalities in the eye. Early detection significantly improves both the prognosis for eye cancer and the likelihood of effective therapy. A complete eye exam, imaging tests such an ultrasound, CT scan, and MRI, and other methods are available for the identification of eye cancer. The optimal method of identification depends on the stage of the cancer as well as the patient’s overall health and medical history. A combination of procedures can help to produce a diagnosis that is more accurate even though no single method of detection is 100% reliable. In conclusion, improving the prognosis of eye cancer requires early detection and timely treatment.
In future, the proposed work can be extended by including hyper-parameters like training size, optimizer, loss function and activation functions. Further, optimization algorithms like Arithmetic Optimization Algorithm and Grasshopper Optimization Algorithm can be applied to improve the performance. In addition to that, the work can be extended to achieve the multi-class problem.
Conflict of interest statement
The authors declared that they have no conflicts of interest.