
Abstract
BACKGROUND:
Many people with disabilities gain and retain paid employment through vocational rehabilitation (VR) services. Some empirical research has indicated that self-employment can be a viable employment option for people with disabilities.
OBJECTIVE:
We examined factors of successful self-employment of people with disabilities who had received vocational rehabilitation (VR) services across a recent five-year span.
METHODS:
We analyzed extant federal VR data from 2008 to 2012 from the Rehabilitation Services Administration using a special type of Structural Equation Modeling (SEM) technique known as the Multiple Indicators Multiple Causes (MIMIC) modeling to conduct validation and invariance testing.
RESULTS:
The national model produced reasonable fit, but there was some regional misfit in the invariance models. These results were similar to those from another similar study that used MIMIC modeling on earlier federal VR data from the RSA.
CONCLUSIONS:
The generalizability of the MIMIC models in this study is limited; no causal inferences were or should be drawn. Using these results, further research should examine modification indices and test alternative MIMIC models of VR self-employment. Implications of this study for VR and policymakers and recommendations include changes to service provision for clients and greater flexibility in supporting self-employment based on individualization.
Keywords
Introduction
Employment disparities continue to persist between people with and without disabilities. The unemployment rate for people with disabilities is more than double the rate for people without disabilities, 9.0% versus 4.3% (December 2016, www.dol.gov/odep/). The labor force participation rate for people with disabilities is less than one-third of people without disabilities, 20.1% to 68.1% (www.dol.gov/odep/). Unfortunately, these problems have lasted for decades, and the consequences are evident. The U.S. Census Bureau (2012) reported a 14.3% poverty rate for persons without a disability ages 15 to 64, compared to 17.9% for persons with a non-severe disability, and 28.6% for persons with a severe disability. Further, 12% of persons without a disability received some form of public assistance (e.g., TANF, SNAP) compared to 22.9% of persons with a non-severe disability and 59.0% of persons with a severe disability.
Federal and state initiatives have sought to remedy the problem of low employment rates and labor-force participation of people with disabilities. One major action was the enactment of the Rehabilitation Act of 1973 (P.L. 93–112) and subsequent amendments; this mandated vocational rehabilitation (VR) counseling services through states. The purpose of this law was “to empower individuals with disabilities to maximize employment, economic self-sufficiency, independence, and inclusion and integration into society… and to ensure that the Federal Government plays a leadership role in promoting the employment of individuals with disabilities.” The Act established a mandate for state vocational rehabilitation (VR) agencies to provide employment-related services to individuals with disabilities, to help them obtain and retain employment, including self-employment. Section 103(a)(13) of the Act defined VR services in self-employment, including “technical assistance and other consultation services to conduct market analyses, develop business plans, and otherwise provide resources… to eligible individuals who are pursuing self-employment or telecommuting or establishing a small business operation as an employment outcome.” Given the prominence and effect of VR in supporting the employment of individuals with disabilities, this study specifically focused on the role of VR services in the self-employment of individuals with disabilities.
Vocational rehabilitation and self-employment
Since the mid-1970 s, employment of people with disabilities with the assistance of VR services across the U.S. has occurred in greater numbers, but refereed studies about VR self-employment in the research literature are sparse (Yamamoto & Alverson, 2013). Most of these studies are qualitative in design, with in-person interviews or surveys of small numbers of VR clients and counselors. Despite the small number of studies in the literature, there are indications self-employment may be a viable employment option for people with disabilities. In part, the prevalence of self-employment over the last two decades can be explained by (a) shift in the U.S. economy from industrial manufacturing to a high-technology, information and service-oriented economy, and (b) philosophy and movement of consumer choice and self-determination in employment for people with disabilities (Colling & Arnold, 2007; Palmer, Schriner, Getch, & Main 2000; Rizzo, 2002; Schriner & Neath, 1996; Seekins, 1992; Walls, Dowler, Cordingly, Orslene, & Greer, 2001). Moreover, for many people with disabilities, self-employment may provide an opportunity to “create an employment circumstance specifically tailored to their personal situation” (Griffin & Hammis, 2008, p.4).
One major focus of these qualitative studies about self-employment is the obstacles and challenges faced by those becoming or staying self-employed. These challenges include (a) lack of access to adequate financing from conventional sources, (b) perceived or actual reduction in government benefits due to their self-employment income, (c) societal prejudice, (d) negative public attitudes and low expectations, (e) educational barriers in inadequate school transition and vocational programs, (f) technological barriers in the access and use of devices, and (g) policy and regulation in business and personal supports (Callahan et al., 2002; McNaughton et al., 2006; President’s Committee on Employment of Individuals with Disabilities, 2000; Rizzo, 2002). Another major focus of these studies in the research literature is reasons people with disabilities choose or prefer self-employment over other employment options: (a) lack of opportunity and discrimination (Blanck, Sandler, Schmeling, & Schartz, 2000; Hagner & Davies, 2002), (b) less stigmatization than other employment in the pursuit of “the American Dream”, (c) unsatisfactory previous employment experiences (McNaughton, Symons, Light, & Parsons, 2006), and (d) an expression of personal choice (Callahan, Shumpert, & Mast, 2002).
The qualitative studies in the research literature help to describe how or why self-employment of people with disabilities may occur (see Gall, Gall, & Borg, 2003), but moving beyond descriptive studies to predictive and explanatory studies, which contribute knowledge to interventions and causality, requires identifying relations between variables and testing theories (Pedhazur & Schmelkin, 1991). Utilizing existing, large-scale databases enables complex analyses of variables that could also be cost effective. To date, however, only two quantitative refereed studies have examined self-employment by analyzing extant federal VR data over multiple years (see Yamamoto & Alverson, 2013, 2015). In the first study, two significant (p < 0.001) predictors, ethnicity and gender, were reported to have the largest effects. The study also reported national VR self-employment rates between 2% and 2.5% across the five years of analysis. Those rates were similar to previous studies that reported national rates between 2% and 3% since the 1990 s (see Ipsen, Arnold, & Colling, 2005; Schriner & Neath, 1996). Some states, such as Mississippi and Vermont, however, have had higher rates for many years (Revell, Smith, & Inge, 2009). In the second study, a model of successful VR self-employment was tested to analyze the relationship among the three most influential factors indicated in the research literature: (a) individual characteristics, (b) accountability systems, and (c) level of supports. The results while compelling were tentative, as a first-of-its kind study based on a limited number of years, 2003 to 2007. Therefore, in this study we sought to gain further understanding of the factors that contribute to VR self-employment outcomes nationally and differences across states/regions. Further, by analyzing data that included the years during and after the historic recession, we also sought to uncover important patterns or changes. Thus, we posed and investigated three a priori research questions: What was the relationship of accountability systems, individual characteristics, and level of supports to self-employment success for fiscal years 2008 to 2012? Did the relationship of accountability systems, individual characteristics, and level of supports to self-employment success differ across the fiscal years 2008 to 2012? Did the relationship of accountability systems, individual characteristics, and level of supports to self-employment success differ by location across the fiscal years 2008 to 2012?
Method
Research design
In discussing research contributions to a field such as education, Gall, Gall, and Borg (2003) describe “four types of knowledge”: (1) description, (2) prediction, (3) improvement, and (4) explanation” (p.3). Because previous research on self-employment for individuals has fallen almost entirely within the area of “description”, and there is an insufficient empirical base to test theories associated with self-employment for this population, our goal in this study was to further explore a previously identified set of predictors of VR self-employment, guided by our review of the research literature. To this end, we utilized a non-experimental, exploratory statistical analysis of extant data. Utilizing a large number of VR cases (i.e., more than 500,000) in any single year, we sought to determine whether the factors identified in the previous study occurred by random chance based on the specific five years that were analyzed, or the factors identified in this study through the analysis of newer RSA data (i.e., replication) were predictive of VR self-employment for people with disabilities, establishing a pattern of findings across studies.
Data collection
We received extant federal data for 2008 to 2012 from the Rehabilitation Services Administration (RSA). We considered using data from 2013 to 2015, however, the RSA made some changes to their datasets and variable definitions starting in 2013. Therefore, we decided to exclude those years. The RSA provided the data in plain text format and de-identified (i.e., no personal identifiable information about clients). The RSA defines a client case as the official record generated by a VR services counselor for each prospective client (RSA, 2008). A counselor can close a client case for any reason (e.g., death, incarceration, moving to another state). A successful case closure occurs only after a client has achieved an employment outcome, demonstrated by ‘stable employment’ (decided by a VR counselor’s discretion) for at least 90 days (Oregon Department of Human Services, 2011). Successful VR self-employment rate is defined as the number of cases closed with a self-employment outcome divided by the total number of all employment closures.
Data analysis
We inspected the data for missing and impossible values (e.g., keystroke errors) and for distributional assumptions. Data met the assumptions for using a type of multivariate statistical analysis method known generally as Structural Equation Modeling (SEM). More specifically, we utilized one type of SEM known as a Multiple Indicators Multiple Causes (MIMIC), which allows statistical analysis to be performed simultaneously on manifest (i.e., directly observed) variables and latent (i.e., not directly observed) variables that are continuous (e.g., dollar amounts) and categorical (e.g., gender) types of variables (Kline, 2005). This method enabled us to analyze the complex relationships of these different types of variables (related to VR client, services, outcome), based on our literature review, across states, regions, and years. We used the AMOS v.20 statistics software (IBM-SPSS, 2013) to conduct the MIMIC analysis.
As in a previous study that used MIMIC to analyze RSA data for 2003-07 (Yamamoto & Alverson, 2015), we used MIMIC in this study (Fig. 1) to analyze individual characteristics, accountability systems, and level of supports. The latter two were specified as latent and were both specified as both endogenous variables with disturbances and as exogenous variables with residuals with indicator variables they predict, as required for the analysis (Byrne, 1998). Each indicator represented some hypothesized facet of the underlying factor. Three indicator variables (from the RSA data set) were specified for the latent factor of accountability systems (a) cost of VR services, (b) average weekly hours worked at case closure, and (c) average weekly earnings at case closure. Also, three indicator variables (from the RSA data set) were specified for the latent factor of level of supports (a) number of VR services at case closure, (b) dollar amount of public supports at case closure, and (c) number of medical supports at case closure.

MIMIC Model of VR Self-Employment Successful Case Closures from FY 2008 to FY 2012.
To answer the three a priori research questions in this study, the SEM MIMIC model testing comprised two steps. First, we tested a national MIMIC model (i.e., all 50 states and D.C.) in each year for the relationship among individual characteristics, accountability systems, and level of supports in successful VR case closures in self-employment. Second, we tested the model in each year for invariance across the four U.S. Census Bureau Regions – South, Midwest, Northeast, and West (see Table 2). Statistical significance (i.e., alpha) was first set a priori at p < 0.01 due to the nonexperimental design and the exploratory nature of this study. This would also minimize Type I Error (see Kerlinger & Lee, 2002; Pedhazur & Schmelkin, 1991) and reduce the likelihood of capitalizing on chance (MacCallum, Roznowski, & Necowitz, 1992). This initial alpha needed further correction in the invariance testing because multiple tests were conducted on the same data (see Keppel & Wickens, 2004).
With 10 measured variables, 10(10+1)/2 = 55 MIMIC model parameters were estimable: 26 parameters were estimated: 8 regression paths from the exogenous categorical variables to the latent factors, 4 categorical variables variances, 4 factors loadings, 2 disturbance variances, 1 disturbance covariance, 6 indicator residual variances, and 1 residual covariance. Disturbances were specified to correlate, reflecting the assumption that “… the factors have common omitted causes” (Kline, 2005, p.308). Residuals for cost of VR services and number of VR services at case closure were also specified to correlate. The unit-loading constraints of 1.0 were applied to the paths from disturbances to factors, required for scaling and identification. One regression path for each factor was fixed to 1.0, the “unit loading identification” (ULI) constraint (Kline, 2005) required for unstandardized coefficients model identification and scaling (i.e., constraints are not estimated). Model degrees of freedom (df) were computed as 29 (55 minus 26) producing a recursive model, over-identified with more data observations (df) than parameters freely estimated, which is required for an admissible solution (Byrne, 1998; Kline, 2005).
Assessing national model fit
Model testing in SEM is used “to determine the goodness of fit between the hypothesized model and the sample data… there will necessarily be a discrepancy between the two” (Byrne, 1998, p.7). That is to say, how well does our specified model of successful VR self-employment, which includes individual characteristics, accountability systems, and level of supports, actually explain the RSA data and the relationships among the variables in the model? Across the five years, we assessed the fit of the national model to the RSA data using four widely recommended SEM goodness-of-fit indexes (a) Pearson’s likelihood Chi-Square, (b) Comparative Fit Index (CFI), (c) Root Mean Square Error of Approximation (RMSEA), and (d) Standardized Root Mean Square Residual (S-RMR). Each fit index, described in detail below, examines a different part of the model and assigns a value unique to that index as a measure of how well the model fits the data (Byrne, 1998; Hu & Bentler, 1999; McDonald & Ho, 2002).
The Pearson’s likelihood Chi-Square or model Chi-Square χ2, tests the fit between the restricted covariance matrix, representing the hypothesized structure of relationships among the variables, and the unrestricted sample covariance matrix, representing actual relationships among variables in the observed data (Arbuckle, 2009; Byrne, 1998). As χ2 value increases, model fit becomes worse. This statistic, however, is highly sensitive to large sample sizes (Byrne, 1998; Kline, 2005). The model χ2 degrees of freedom (df) is a measure of model parsimony. The associated p value indicates whether the specified model should be rejected as a test of the null hypothesis that the model has perfect fit (Byrne, 1998; Kline, 2005). Comparative Fit Index (CFI) indicates improved fit of the specified model over the baseline or independence model, which assumes no population covariances among observed variables, with CFI of 0.90 or greater indicating good fit (Hu & Bentler, 1999). Root Mean Square Error of Approximation (RMSEA) measures the discrepancy between the population covariance matrix and specified model (Byrne, 1998), with values less than 0.05 indicating good fit, 0.05 to 0.08 indicating reasonable fit, and 0.10 or greater indicating poor fit (McDonald & Ho, 2002). Standardized Root Mean Square Residual (S-RMR) measures “the mean absolute correlation residual, the overall difference between the observed and predicted correlations” (Kline, 2005, p.141), with less than 0.10 “generally considered favorable” (Kline, 2005, p.141).
Assessing regional model fit
Invariance testing comprises hierarchical steps in fixing certain parameters to be equal across comparison groups and determining whether model fit significantly changes (Arbuckle, 2009; Cheung & Rensvold, 2002; Hoyle & Smith, 1994). The model invariance testing involved several steps: (1) allowing freely estimated parameters across the four regions, (2) fixing factor loadings, (3) fixing structural weights, (4) fixing factor variances and covariances, (5) fixing disturbances, and (6) fixing residuals. Beginning with step 3, the previous steps were fixed in place. In step 3, factor variances and covariances were fixed to be equal across the regions, and factor loadings from Step 2 were also kept fixed. Each step was compared with the previous step for model-fit change using Chi-Square χ2 and degrees of freedom, CFI, and RMSEA (see Byrne, 1998; Cheung & Rensvold, 2002; McDonald & Ho, 2002). The SRMR index is not available for invariance model testing in the AMOS 20 software (IBM-SPSS, 2013).
Results
Data screening revealed no impossible values, and approximately 3% to 4% of analyzed variables across the five years were missing data. Missing data were missing at random, or MAR and imputed with Multiple Imputation (see Schafer & Graham, 2002). Client demographic characteristics (see Table 1) were very similar across the five years of analysis. The majority of the VR clients with successful self-employment case closure were male (54-55%), white (76%), had a high-school level education or less (56% to 57%), and a significant disability (93% -94%).
Client characteristics (%) of VR employment case closures for FY 2008 to FY 2012
Client characteristics (%) of VR employment case closures for FY 2008 to FY 2012
U.S. Census Bureau Regions
Referring to Table 3, the largest number of VR employment case closures occurred in 2008 (N = 202,297); the smallest number occurred in 2010 (N = 169,258).
VR employment closure and case status for FY 2008 to 2012
Research question 1
This question asked, “What was the relationship of accountability systems, individual characteristics, and level of supports to successful VR self-employment closure from 2008 to 2012?” In all five years, the MIMIC model converged to an admissible solution. Table 4 contains the standardized (i.e., X ∼ N (μ, σ2), Z ∼ N (0, 1)) regression estimates for each path. Most of the same regression paths were statistically significant (p < 0.001) across the five years. The strongest regression effects occurred for the path from the accountability systems factor to the average weekly hours worked at case closure indicator variable, and the path from the factor level of supports to the dollar amount of public supports at case closure indicator variable. Table 5 contains estimates for the correlations and variances. All correlations were significant (p < 0.001), while most of the variances were also significant (p < 0.001). The largest variances were found for the residuals of the three “monetary” variables – cost of VR services, average weekly earnings at case closure, and dollar amount of public support at case closure, indicating very wide differences among clients in terms of the cost of their VR services, the amount of money they earned, and the dollar amount of public assistance they received. Table 6 contains the computed (not estimated) squared multiple correlations of endogenous variables, indicating effect size (i.e., percent of variance explained). Across the five years, the indicator, variable average weekly hours worked at case closure had the most explained variance, followed by the indicator variable, dollar amount of public supports at case closure.
MIMIC model standardized regression path estimates for FY 2008 to FY 2012
MIMIC model standardized regression path estimates for FY 2008 to FY 2012
*Significant at p < 0.001.
MIMIC model correlation and variance estimates for FY 2008 to FY 2012
*Significant at p < 0.001.
MIMIC model squared multiple correlations of endogenous variables for FY 2008 to FY 2012
This question asked, “Did the relationship of accountability systems, individual characteristics, and level of supports to successful VR self-employment closure differ from 2008 to 2012?” Referring to Table 7, based on the model-fit indices, represented as numerical values (see Methods section), overall national model fit was best in 2009 and worst in 2010. Variances explained by the MIMIC model are represented as squared multiple correlations (i.e., effect sizes). Referring to Table 6, across the five years, explained variances ranged from modest to small for level of supports (9% to 19%) and accountability systems (4% to 6%) latent factors. Explained variances were moderate for the number of medical supports at case closure (29% to 36%) and average weekly earnings at case closure (19% to 26%) variables. Explained variances were substantial for dollar amount of public supports at case closure (41% to 48%) and average weekly hours worked at case closure (79% to 99%) variables. Conversely, the explained variances were low for the number of VR services at case closure (8% to 12%) variable and nearly zero for the cost of VR services variables (0% to 1%).
MIMIC model fit statistics for FY 2008 to FY 2012
MIMIC model fit statistics for FY 2008 to FY 2012
The third research question asked, “Did the relationship of accountability systems, individual characteristics, and level of supports to successful VR self-employment closure differ by location from 2008 to 2012?” For each year, the MIMIC model was tested for invariance across the four Census Regions, so this required alpha correction (i.e., adjustment of the level of statistical significance) for the six invariance-testing steps, 0.01/6 = 0.00167. These results are presented in Tables 8 12 for each year. Across the five years the same pattern was found. Step 1 of the invariance test, in which parameters were freely estimated, the MIMIC model indicated a reasonable model fit. In step 2, a small change in CFI and significant change in χ2 occurred, indicating that the four Census regions had significantly differed in model fit. In step 3, this decline continued, indicated by a small change in CFI, and significant change in χ2. In step 4, because the model fit was poor further invariance testing was not required (see Cheung & Rensvold, 2002).
MIMIC model invariance results for FY 2008
MIMIC model invariance results for FY 2008
MIMIC model invariance results for FY 2009
MIMIC model invariance results for FY 2010
MIMIC model invariance results for FY 2011
MIMIC model invariance results for FY 2012
Lastly, the national and regional VR self-employment case closure totals in each fiscal year are presented in Table 13. Across the five years, the largest number of VR self-employment closures was 4003 in 2008; the smallest was 3909 in 2011. The highest VR self-employment closure rate was 2.33% in 2010, and the lowest rate was 1.98% in 2008. These rates (see Fig. 2) are based on the total number of successful VR self-employment closures divided by the total number of successful VR closures for all employment in each year. The region with the largest VR self-employment closures was the South; its highest total was 2181 in 2012. The South accounted for more than 50% of all VR self-employment closures nationally each year.
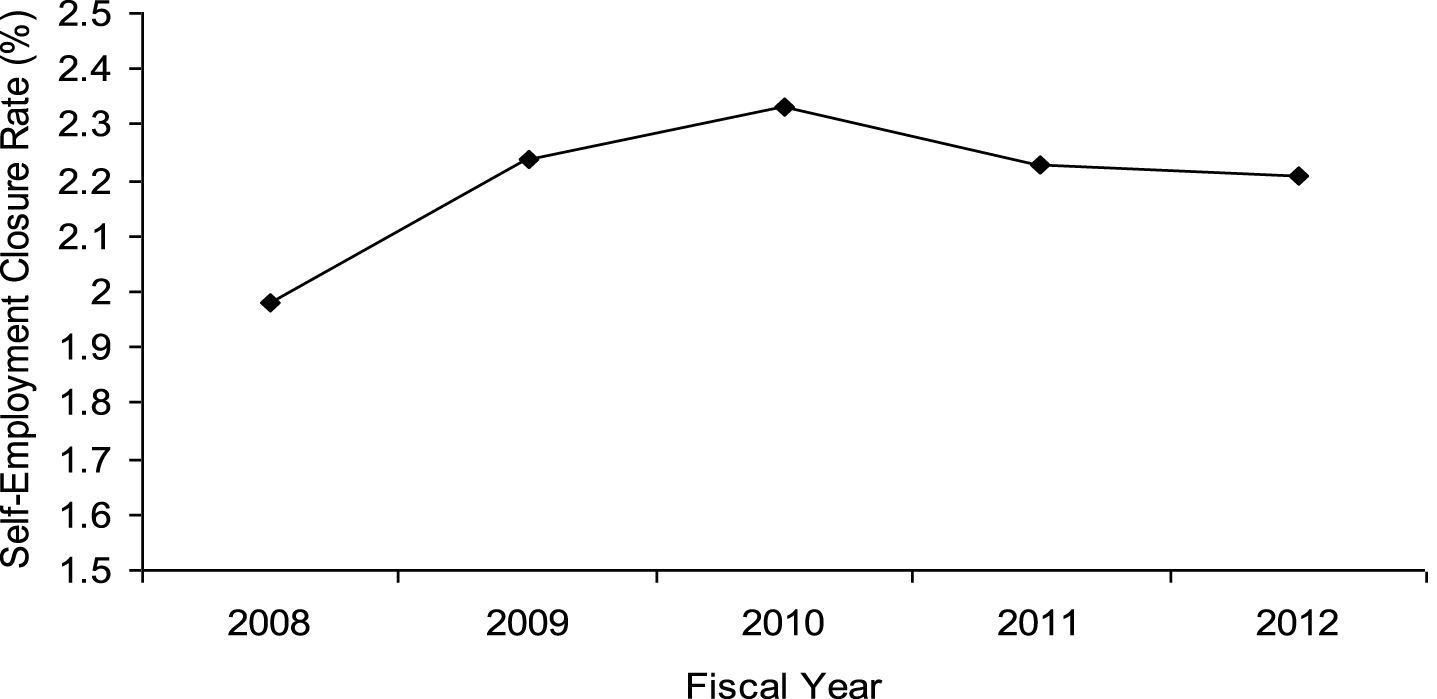
National VR Self-Employment Case Closure Rates for Fiscal Years 2008 to 2012.
National and regional self-employment closures for FY 2008 to FY 2012
*Includes all VR employment closures.
The purpose of this study was to analyze factors most influential in a successful VR self-employment case closure. Next, we discuss the results, study limitations, recommendations for further research, and implications for researchers, VR, and policymakers.
Research question 1
This question asked, “What was the relationship of accountability systems, individual characteristics, and level of supports to successful VR self-employment closure from 2008 to 2012?” The national MIMIC model produced the best fit in 2009 based on the four model fit indices (i.e., lowest values of Model Chi-Square, RMSEA, and S-RMR, and highest value of CFI). Compared to the previous study of MIMIC model of VR self-employment analyzing 2003–2007 RSA data (Yamamoto & Alverson, 2015), the model fit results in this study are slightly less favorable. The model fit in 2011 and 2012 were the worst across the two studies. That is, the relationship among the model factors of individual characteristics, accountability systems, and level of supports slightly better explain the 2003–2007 RSA data than they did the 2008–2012 RSA data. The influence of the great recession on VR self-employment from 2008–2012 is one likely explanation, although there is no direct way to test that within the RSA data. It would require the RSA data to be merged with employment and labor data. Also, because this study utilized a nonexperimental and exploratory design, there are undoubtedly other factors and variables affecting model fit (i.e., variance not explained). These are “outside” influences that cannot be controlled in a study with a non-experimental research design; their effects on the model are indirectly indicated by the extent of the model misfit. Nevertheless, the similarities in the results across most of the model variables in the two studies suggest that at least some of these variables are associated with VR clients’ successful self-employment case closure.
Research question 2
This question asked, “Did the relationship of accountability systems, individual characteristics, and level of supports to successful VR self-employment closure differ from 2008 to 2012?” The MIMIC model differed over time, with more model misfit from 2010–12. McDonald and Ho (2002) assert, “the presence of categorical variables or indicators may cause nonnormality”, however, “ML estimation and its associated statistics seem fairly robust against nonnormality” (p.70). Overall, the model misfit in 2008–12 is more likely about misspecification than variable types. The models captured some aspect of the relationship of the three factors (individual characteristics, level of supports, and accountability systems) to successful VR self-employment closure for clients, but also left some of that relationship unexplained.
Notably across all five fiscal years, the regression paths were significant (p < 0.001) for the factor indicators of level of supports (i.e., loadings), but not for accountability systems. The loadings for level of supports were moderate to high. Having all high factor loadings would represent strong evidence for convergent validity (Byrne, 1998; Kline, 2005), which would mean that those indicator variables (number of VR services at case closure, dollar amount of public supports at case closure, and number of medical supports at case closure) represent important facets of that factor. Strong evidence of convergent validity, however, is lacking here. Misspecification of indicators with factors and factor structure are likely, particularly with one indicator variable, number of medical supports at case closure. The other two indicator variables appear to capture some important facets of the factor, level of supports; that VR clients in self-employment with a higher number of VR services and financial support outside of VR, such as Social Security Income (SSI), may be more likely to achieve successful case closure.
Across the five years, the regression paths for the categorical predictors comprising individual characteristics were significant (p < 0.001): gender predicting accountability systems, significant disability predicting level of support, and educational attainment predicting level of support. One explanation for the significant relationship of gender and accountability systems is that male VR clients in self-employment were more likely than female VR clients to have higher average-weekly earnings. The negative significant regression estimates are due to the coding of males as 0 and females as 1 in the data. The relationship of significant disability and educational attainment variables to level of supports factor suggests that (a) increased services and public supports were more likely for clients with a significant disability due to their increased support needs, and (b) clients with post-high school education, on average, may have had greater access to information about and awareness of VR and public services, and, thus, more likely advocate for those needs than clients with high-school education or less. This pattern of results is similar to those previously reported by Yamamoto and Alverson (2015) in their MIMIC analysis.
For the latent factor of accountability systems, the residual of its lowest loading indicator variable, cost of VR services, is correlated with the residual for number of VR services, a indicator variable of the factor, level of supports. One explanation for the nearly zero effect of the cost of VR services variable is that it is unlikely to represent a facet of accountability systems, but rather, a facet of level of supports factor. This suggests that the amount of money spent by VR to help a client to achieve successful self-employment case closure is an important facet of support, rather than a facet of responsibility or obligation (i.e., accountability) by VR for a successful case closure represented by the dollar amount of services spent on clients.
The correlation between residual terms for cost of VR services and number of VR services variables represent a moderately strong association. The negative correlation between the disturbance terms for the accountability systems and level of supports factors indicates common but unanalyzed and external (i.e., outside the model) sources that better indicate these factors (see Kline, 2005). These significant correlations, linking the two factors together, suggest they are associated in some way, but not explained more precisely by the model; other variables are needed to more clearly explain the association of these two factors to each other.
The large variances of the disturbance for the accountability systems factor and the residuals for the (a) average weekly earnings at case closure, (b) cost of VR services, and (c) dollar amount of public supports at case closure indicator variables indicate that much more of the variance of the factor is unexplained by the model. These three indicators are all “monetary” variables, and thus it is not surprising that VR self-employment cases widely vary in terms of service costs, client earnings, and the external financial support clients receive based on types of business activities, technical and material needs, and the clients’ personal financial resources.
The four categorical predictors for individual characteristics accounted for much more explained variance of the level of supports factor, even with the correlation of the disturbances of the two factors. This suggests there were other unidentified variables influencing the accountability systems factor in VR self-employment, but also further indicates some MIMIC model misspecification. The patterns of significant correlations between the residuals and the disturbances are nearly identical to those previously reported by Yamamoto and Alverson (2015). This also suggests that the same, common unanalyzed sources external to the model could account for more of the explained variance. These variables may be ones that are in the RSA data sets that we did not analyze in this study, and/or variables “outside” the data sets.
Research question 3
This question asked, “Did the relationship of accountability systems, individual characteristics, and level of supports to successful VR self-employment closure differ by location from 2008 to 2012?” In the MIMIC models, state-specific effects were present, but only indirectly measured as residual variance or as unanalyzed (i.e., external) sources of variation. Model misfit may also be related to differences in sample size across regions. For example, the South produced more than 50% of all VR self-employment closures each year, and regional effects could be explained by a number of economic, social, cultural, and political factors. Yamamoto and Alverson (2013) reported differences among rural and urban VR populations, the availability of other employment options, and VR counselors’ differing beliefs about self-employment. They also reviewed studies that found significant differences between counselors in rural and urban areas and their views on self-employment, which were explained in part by differences in agency policies and counselor flexibility for client employment options. Yamamoto and Alverson (2013) also found differences among client reasons for pursing VR self-employment. One key context for understanding VR self-employment from 2008–12 is the “great recession” of 2007 to 2009 (see United States Department of Labor, 2012). Rissman (2003) asserts that “flows into self-employment occur during recessions and flows out of self-employment occur during economic expansions” (as cited in Hipple, 2004, p.14).
Across the five years, the significant worsening of MIMIC model fit after step 3 of the invariance testing, after more parameters were constrained to be equal rather than freely estimated, demonstrates differences by regions (i.e., Northeast, Midwest, South, and West). Revell et al. (2009) also reported differences among states in other VR employment outcomes. They found that Mississippi consistently had the highest VR self-employment rates ever year, in double-digits, and nearly double the rates of Vermont, the state with the second highest rate. A number of factors could be contributing to these differences, such as counselors’ approach, and state-specific cultural, economic and social factors that make self-employment a more viable employment option for VR clients. That study, however, did not statistically test RSA data across all states and compare regions in order to more clearly identify some of the possible reasons for those outcomes, such as was done in this study. That said, the fact that the MIMIC model produced a reasonably good fit only when parameters were allowed to freely vary across regions suggests there may be several different models, perhaps one for each region or one for most regions or states. Thus the specified model, with its relationships among individual characteristics, accountability systems, and level of supports factors, with indicator variables from the RSA data, explain successful VR self-employment in certain regions and states better than in others. That could also mean there may never be one model capturing the relationships of those factors and RSA variables throughout the entire nation and across all regions and states.
Limitations of this study
One limitation of this study is its research design – nonexperimental and exploratory. With such a design, cause-and-effect relationships (i.e., causal inferences) among the analyzed variables in the study cannot be confirmed, as other explanations or causes (e.g., other factors and variables not analyzed) of those relationships cannot be ruled out because their influences were not taken into account or controlled by the design (Shadish, Cook, & Campbell, 2002). Nevertheless, because the research literature on VR self-employment is still nascent and sparse, there is a theoretical foundation that needs to continue to be built. This study was one such attempt analyzing extant national VR data to establish some associations among the variables in the RSA data over multiple years, and they appear to establish some of those associations. The empirical information gathered in this study, while tentative and not determinative or conclusive, nevertheless contributes to the development of the empirical base in this area of inquiry and incrementally advances the field of vocational rehabilitation research.
Although the national data analyzed in this study represent the U.S. population of those in VR self-employment, the sample size issue is relevant for the invariance testing where certain regions (e.g., Northeast and West) had much smaller samples in all five years, which could have produced less reliable estimates. The Maximum Likelihood estimation used for model parameters in the invariance testing is robust against nonnormality (McDonald & Ho, 2002), but works best for large samples, especially in complex regression-based (e.g., SEM) analyses (Kline, 2005; Tabachnick & Fidell, 2007). Perhaps, the use of robust standard errors and corrected statistics (e.g., Satorra-Bentler) or Asymptotic Distribution Free estimation could be applied in future MIMIC modeling (see Kline, 2005), even if to simply compare the results and determine the degree of correction that was actually necessary. While some evidence of construct validity may be present, it was not strong evidence.
Another limitation of this study is the number and types of RSA variables as factor indicators for accountability systems, individual characteristics, and level of supports. Variables not yet identified may represent important facets. There may be facets that are not represented by variables available in the RSA data but nevertheless need to be analyzed. Any analysis of extant data is limited to the variables and structure of the dataset. Given that “reliability and validity are attributes of scores in a particular sample, not measures” (Kline, 2005, p. 58), the interpretations of the statistical models emerging from this study are likely to be accurate within the limited scope and constraints of this study. As Gelman (2007) notes, “all models are wrong, and the purpose of model checking (as we understand it) is not to reject a model but rather to understand the ways in which it does not fit the data” (p.349).
Recommendations for further research
This study leaves several areas to be explored. First, an expanded review and synthesis of relevant literature beyond the realms of vocational and disability intervention would further develop our understanding of self-employment for people with disabilities. For example, one line of inquiry could be investigating the role that a disability condition plays in employment success and understanding the influence of career education and development on shaping the choices or decisions individuals make about employment options and career pursuits (Szymanksi & Ritter, 2010; Ritter, Strauser, O’Sullivan, Reid, Khosravisnasr, & Cronin, 2014).
Second, different factor indicators and structures should be examined. Equivalent models were not analyzed in this study. These are models that do not differ in fit from the original, but are “represented by different relationships among the variables” (MacCallum, Wegener, Uchino, & Fabrigar, 1993, p.185), which change interpretations and meaning of the model structure (MacCallum et al., 1993). Modification Indices from this study could also be used to derive a different set of a priori research questions or hypotheses, which then could be tested and cross-validated on future RSA data, especially for invariance testing across U.S. regions or states. Such a process would not only avoid capitalizing on chance (see MacCallum et al., 1992), but also likely uncover important findings and improve model fit.
Third, further research should clarify and increase understanding of how individual characteristics, accountability systems, and level of supports relate to successful VR self-employment. Knowing there are disparities in employment opportunities and outcomes across multiple categories of VR clients (i.e., intersectionality), research can more closely analyze such effects over time. This inquiry would involve testing model invariance across and within the four regions for client characteristics to examine differences in the levels of funding or other service supports. To understand the variation in VR self-employment outcomes, there needs to be further analysis of variables such as counselor approaches, and cultural, economic and social factors that make self-employment a viable option for VR clients. For example, recent research has identified staff trainings, development and partnerships as organizational characteristics and cultural factors of high performing VR agencies (Sherman et al., 2014). Thus, encouraging and supporting VR counselors to attend trainings and develop knowledge specific to self-employment will better position them to help VR clients achieve a successful outcome that matches their vocational aspirations and employment goals. Uncovering and testing these new variables and factor structures would enable developing and testing of theories. Such a process is necessary in scientific research, and would contribute significantly to this sparse area of inquiry.
Implications of this study
Implications of this study are focused on VR and policymakers in two important ways. First, understanding and using data, especially extant ‘big data’, at state and regional levels empowers decision-making that is relevant, timely, and responsive. Given the fiscal challenges states continue to face, knowing the amount of resources typically used to support clients in self-employment provides an empirical basis from which to develop or change service provision and resource allocation and utilize cost/benefit analyses. This would also help VR counselors, who may be faced with twin priorities of helping as many VR clients achieve successful employment case closure, while also maximizing the efficiencies of VR agency-resource usage. Greater interagency collaboration could also be spurred with local businesses, Small Business Development Centers, and community colleges to assist VR clients succeed in self-employment cases and create a more favorable entrepreneurial climate for other clients. Furthermore, regions and states with consistently higher VR self-employment case closure rates warrant an examination of policies and procedures to learn how and why those rates are occurring. Understanding the relationships among certain variables of individuals (e.g., gender/ethnicity) and services (e.g., quality of support and/or services) is critical to developing testable theories and eventually, interventions.
Although the results of this study are limited in its generalizability because of its nonexperimental research design, they nevertheless provide strong empirical information that adds to the sparse research literature on VR self-employment, developed over a recent ten-year period. With the ever-evolving economy and the need to address persistent and ongoing challenges in employment for people with disabilities, the results of this study have pointed to a few areas in which those challenges can be met, but also the ways in which VR self-employment can continue to remain viable as an employment option for VR clients and sustainable for VR agencies all across the country.
Author information
Dr. Yamamoto is a campus associate in the College of Education at the University of Oregon. His research interests are big data and advanced analytics, vocational rehabilitation and employment of people with disabilities.
Dr. Alverson is an Associate Research Professor in the Department of Special Education and Clinical Sciences at the University of Oregon. Her research interests are school-to-work transition of young adults with disabilities and post-school outcomes of people with disabilities.
Conflict of interest
None to report.
Footnotes
Acknowledgment
This study was supported by a research fellowship from the National Science Foundation grant number SMA-1103370.