Abstract
Web growth, especially in social networks, is continuously increasing every day. Multiplicity of products offered and web pages has made picking up relevant items a tedious job. On the other hand, different tastes and behaviors of users is creating the probability to find a similar user among a large group of users difficult. As a result, automated software systems have difficulty to discover what is interesting to users.
We have proposed a new approach to adapt to this flow. We will exploit domain knowledge of training data set to create a summary matrix. The summary matrix consists of new and few columns according to the attribute values of the selected feature. We fill the summary matrix with the average ratings based on the number of times that the attribute values appear in the user’s profile for rated items.
We use the summary matrix in two hybrid recommender systems. In our approach, we use meta-level technique which is one of the pipelined hybridization techniques.
The proposed approach will reduce the effects of sparsity, cold start, and scalability which are common problems with the collaborative recommender systems. Furthermore, the proposed approach will improve the recommendation accuracy when there is comparison with the Collaborative Filtering Pearson Correlation approach and it will be faster as well.
Keywords
Introduction
Due to the ubiquity of e-commerce, recommender systems have become an exciting area to work on recently. There are many different recommender systems. However, the researchers have yet to create and develop algorithms to reach satisfactory results for users. Often, users do not have a clear idea about what items are good for them because the qualitative boom is accompanied by an increase in high-resolution throughput data. Big data or large-scale data are the output of the qualitative boom in computing, communications, and digital storage technologies. Big data reflects to a data set that is growing rapidly, because of the spread of digital computers, mobiles, and the growth of the Internet.
Digital information storage capacity doubles every 40 months, roughly since the 1980s [45]. The storage capacity reached to 2.5 Exabyte (the sixth power of 1000 bytes) every day in 2015 [46], and it nearly reached to 3 Exabyte in 2016 [46]. The Cisco forecasts indicate a steady increase in the storage capacity of the coming years [46].
Big data faces several challenges such as storage, transfer, visualization, querying, and updating. These challenges require more predictive analytics, user behavior analytics, or other advanced data analytics methods to discover a useful pattern [47].
Big data is characterized through the quantity and quality of generated and stored data [48, 49]. Increase of the number of users is directly proportional to the increase in the amount of data.
Figure 2 shows the increase of Internet users over the past decades.
Cisco forecasts of data growth [46].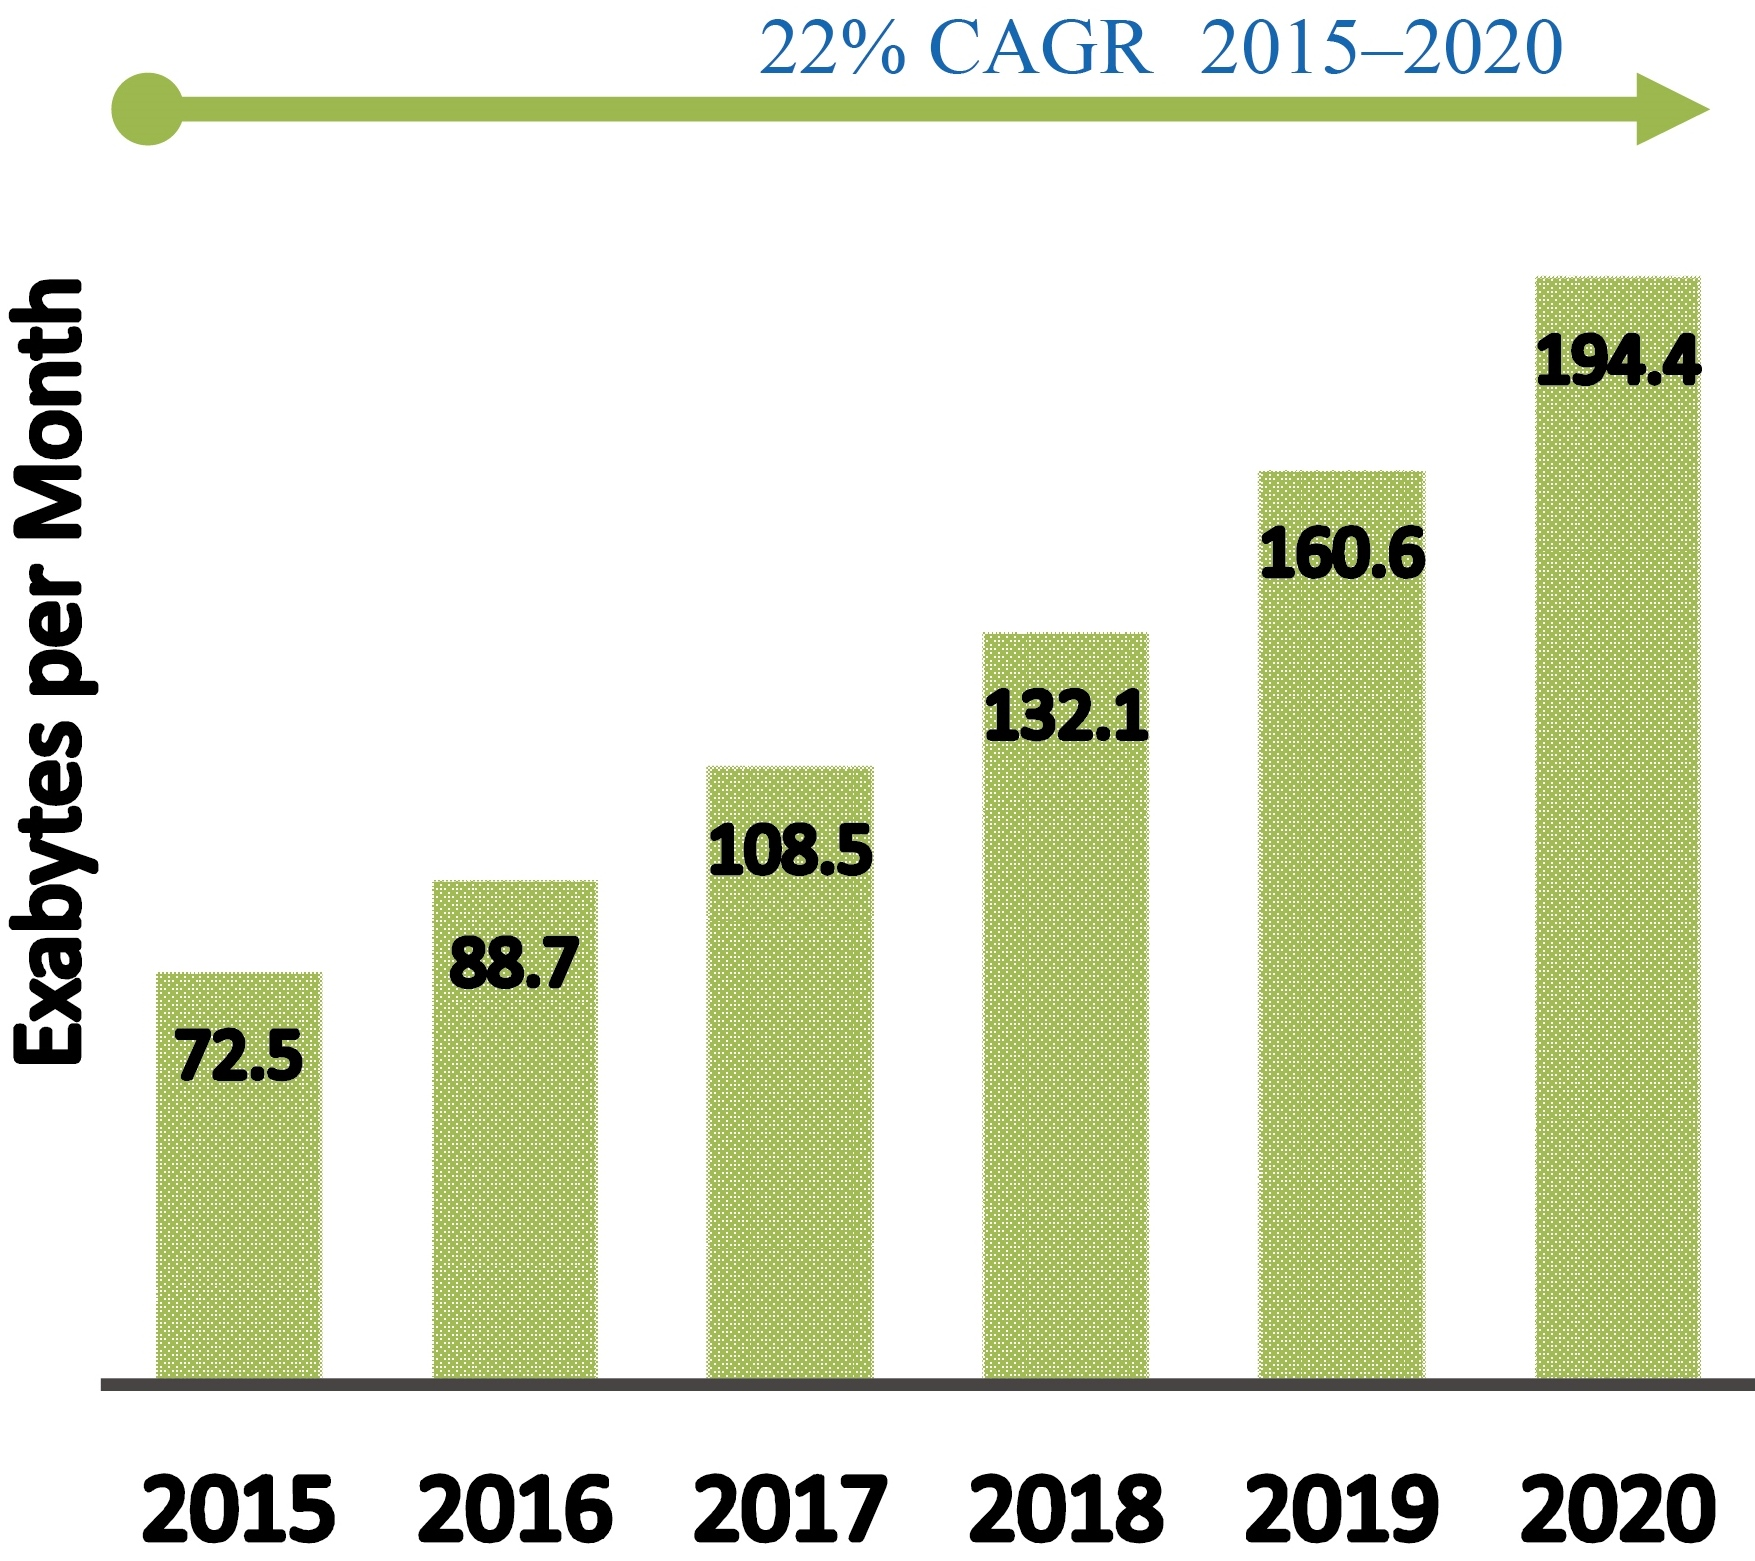
Internet users per 100 inhabitants [50].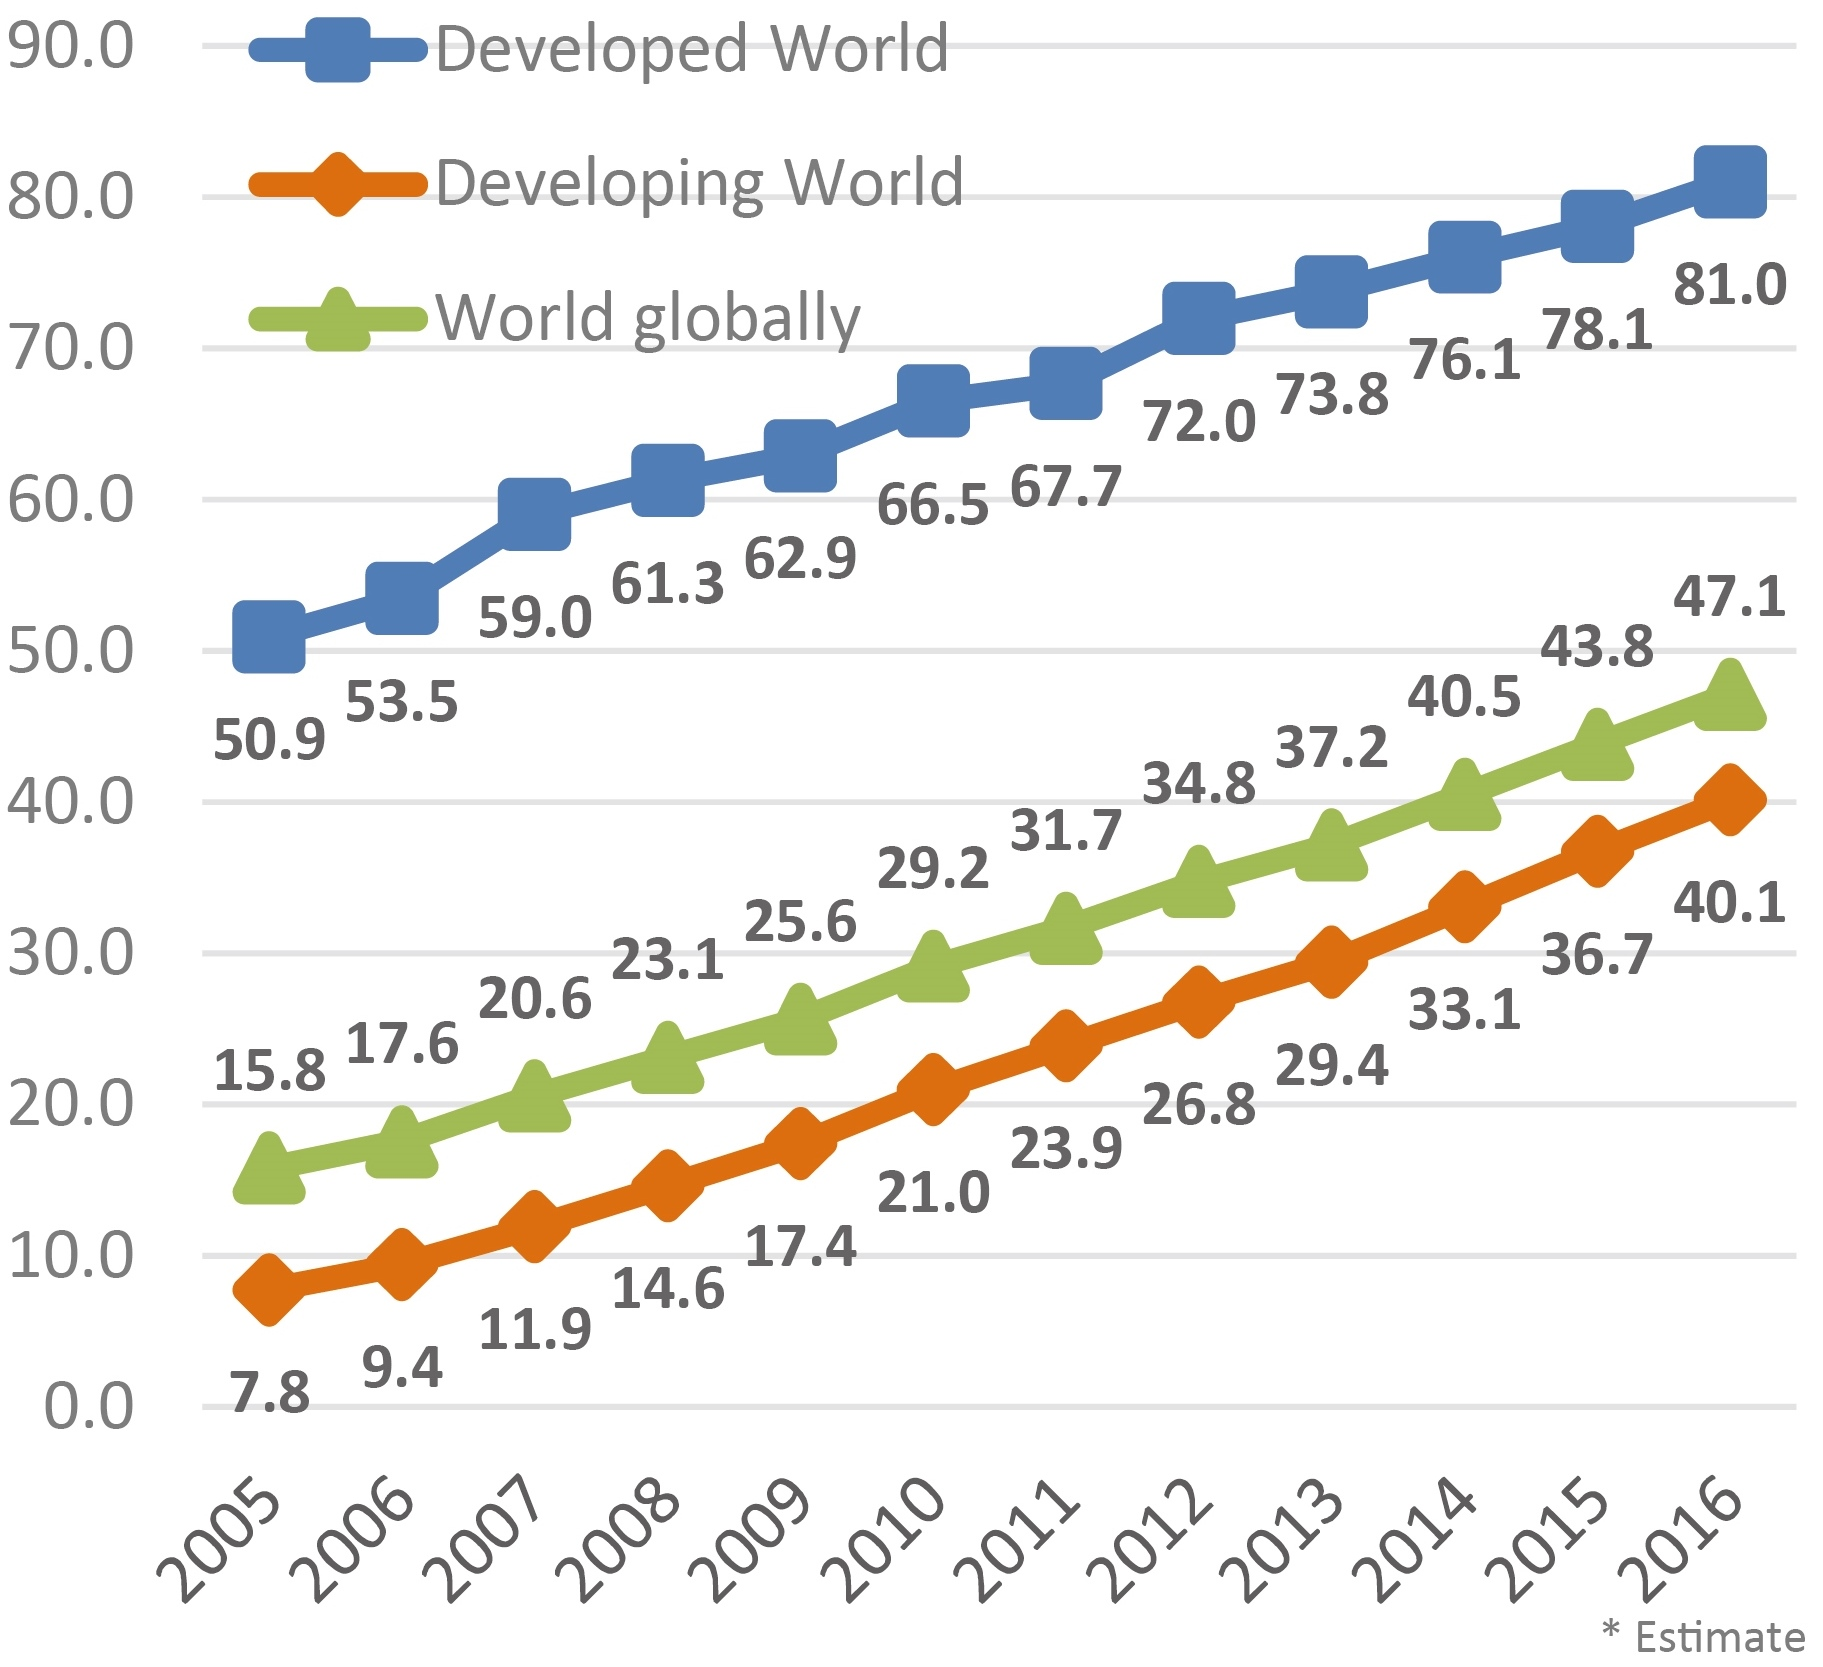
Recommender systems are popular intelligent software systems that are applied in various domains such as in movies, music, books, jokes, restaurants, financial services [8], and Twitter followers [9], and recommends interesting items to users [4, 6, 7, 10, 11, 13]. These personalized suggestions are a useful alternative to searching algorithms.
Recommender systems are personalized information agents that have become interesting in recent years. It applies in the domains of academia and industry increasingly. Recommender systems are a subclass of software information filtering systems, which analyzes user profiles to predict what the user preference is.
Recommender systems that incorporate data mining techniques get its recommendations by using knowledge learned from actions and attribute values of users and items. Recommender systems are based on previous information about interaction of the users with items to get the recommendations [21]. The past user concerns determine the user future choices.
Recommender systems rely on discovering the historical profiles of users. These profiles include information such as rates, item features, tags, and shared files. This profile is compared with other users. It can be distinguished from other information retrieval systems by semantics and systematic analysis to user interactively. Recommendations resulting from recommender systems are interpreted as responding to a user’s query at information retrieval systems, therefore the recommender systems can be seen as an information agent [41, 42, 43, 44].
There are four techniques of recommender systems: collaborative, content-based, knowledge-based, and demographic [16]. Two main categories are most popular: content-based and collaborative recommender systems [1, 10]. Most recommender systems that apply hybrid recommender systems is a combination of content-based and collaborative recommender systems.
Content-Based Filtering approaches are based on a description of item features and user preferences in his/her profile [3, 14, 15, 21]. It recommends items similar to the same type of items that a user already liked. Content-Based Filtering may be defined as an algorithm of searching and comparing therefore it is similar to processes that are used in information retrieval systems, but without needing user queries. Content-Based Filtering obtains the information from two knowledge sources: item features and its rating that is given by users.
Collaborative Filtering generates the recommendations based only on the past users database of ratings that represents full information about users’ past rates. Collaborative Filtering predicts preferable items for users by calculating the similarity scores between users. These scores will be interpreted according to the used algorithms.
Nevertheless, Collaborative Filtering often suffers from three common problems: sparsity, cold start, and scalability
In many of environments, we need much time to find a similar neighbor when we use Collaborative Filtering. Because, data sets contain millions of users and items. Further, the number of users and items are increasing, so it becomes computationally difficult to find similar neighbors. This increasing in the number of users and items is called scalability problem.
Sparsity
Mostly, users don’t rate items. Even popular items that user liked or bought still unrated. Because of increasing number of users and items with few ratings, most entries of data sets remain zero. This situation is called sparsity problem. The level of sparsity is determined by the ratio of the number of zeros to the total number of matrix.
Cold start
We can consider the cold start problem as a special case of the sparsity problem [12]. The cold start problem happens because the user doesn’t have enough rating or any rating at all. To avoid this problem, some companies offer to the consumers some of popular items to evaluate it when they login to the company’s accounts at first time. Otherwise, it is difficult for recommender systems to provide an accurate recommendation to users.
In this paper, we propose summary matrix through exploits the domain knowledge of the data set to create new features, which called feature engineering [17, 18, 24, 27, 28]. The feature is a piece of information in the data set. This piece might contain many attribute values which are useful for prediction and will influence recommendations.
Purpose of create summary matrix to reduce the effects of sparsity, cold start, and scalability problems and improving the recommendation accuracy. We fill the summary matrix with the average ratings based on attribute values of the selected feature. Then, we will apply two approaches of hybrid recommender systems to get the recommendation.
Related work
In this Section we review some examples of hybrid recommender systems that are applied in various domains. Netflix Inc. [26] for movie recommendations combines collaborative and content-based filtering through similar habits of users and higher rates of shared movies characteristics. Netflix Inc. released a challenge in 2006 and offered a grand prize of one million US dollars to enhance the recommender system of the company [26]. The person or team who could successfully decrease RMSE for data set by 10 percent, would win [1, 2, 5]. Bellkor’s Pragmatic Chaos team succeeded in achieving an RMSE of 0.8554 with a 10.06% improvement over the Netflix Inc. system [2].
Lawrence et al. [20] described a personalized recommender system to shoppers in supermarkets. This recommender system relies on shoppers’ previous behavior towards purchases to suggest new products for them. The IBM researchers developed this recommender system to implement it as a part of SmartPad which was developed as a personal digital assistant for remote shopping.
Vaz et al. [22] presented a hybrid book recommender systems based on Collaborative Filtering and author’s rankings by users. This hybrid recommender system improves book recommendations through sending proposals for book readers to decide which book to read next.
MovieLens data set [31] is the online movie recommendations data set that we used in our approach. MovieLens proposes some of the most popular movies to new users to evaluate it. These ratings are exploited to recommend other movies to the user. In addition, MovieLens uses Collaborative Filtering based on these ratings to create personalized recommendations.
We can apply several techniques in the same recommender systems to get the recommendations. For example, two different Content-Based Filtering could work together in hybrid recommender systems such as News Dude. News Dude uses both Naive Bayes and K-Nearest Neighbor classifiers in its news recommendations [16].
Consequently, hybrid recommender systems become increasingly interesting for researchers. Theoretical work focused on how to hybridize the algorithms and which situations can expect to benefit from hybridization [1]. Hybrid recommender systems represent the door to improving the recommendations, overcome some of the problems, and improve the performance of algorithms.
Our approach tries to reduce these above-mentioned problems. Many researchers over the past several years have come up with different solutions to resolve scalability, cold start, and sparsity problems. These problems are inherent in collaborative recommender systems. Reducing the data set dimensionality is one solution approaches. Sarwar et al. [33] applied singular value decomposition for matrix factorization that provides lowest rank approximations of the original matrix. Singular value decomposition expresses the matrix as the product of three “simple” matrices, which result in the singular values in decreasing order.
Lu et al. [35] proposed a Confidence Weighted Online Collaborative Filtering (CWOCF) approach. The key idea of the CWOCF approach is to follow the low-rank matrix factorization and exploit confidence weighted classification in optimizing the low-rank matrixes. The CWOCF approach will update the distributions of matrix factorization vectors.
Meta-level technique [16].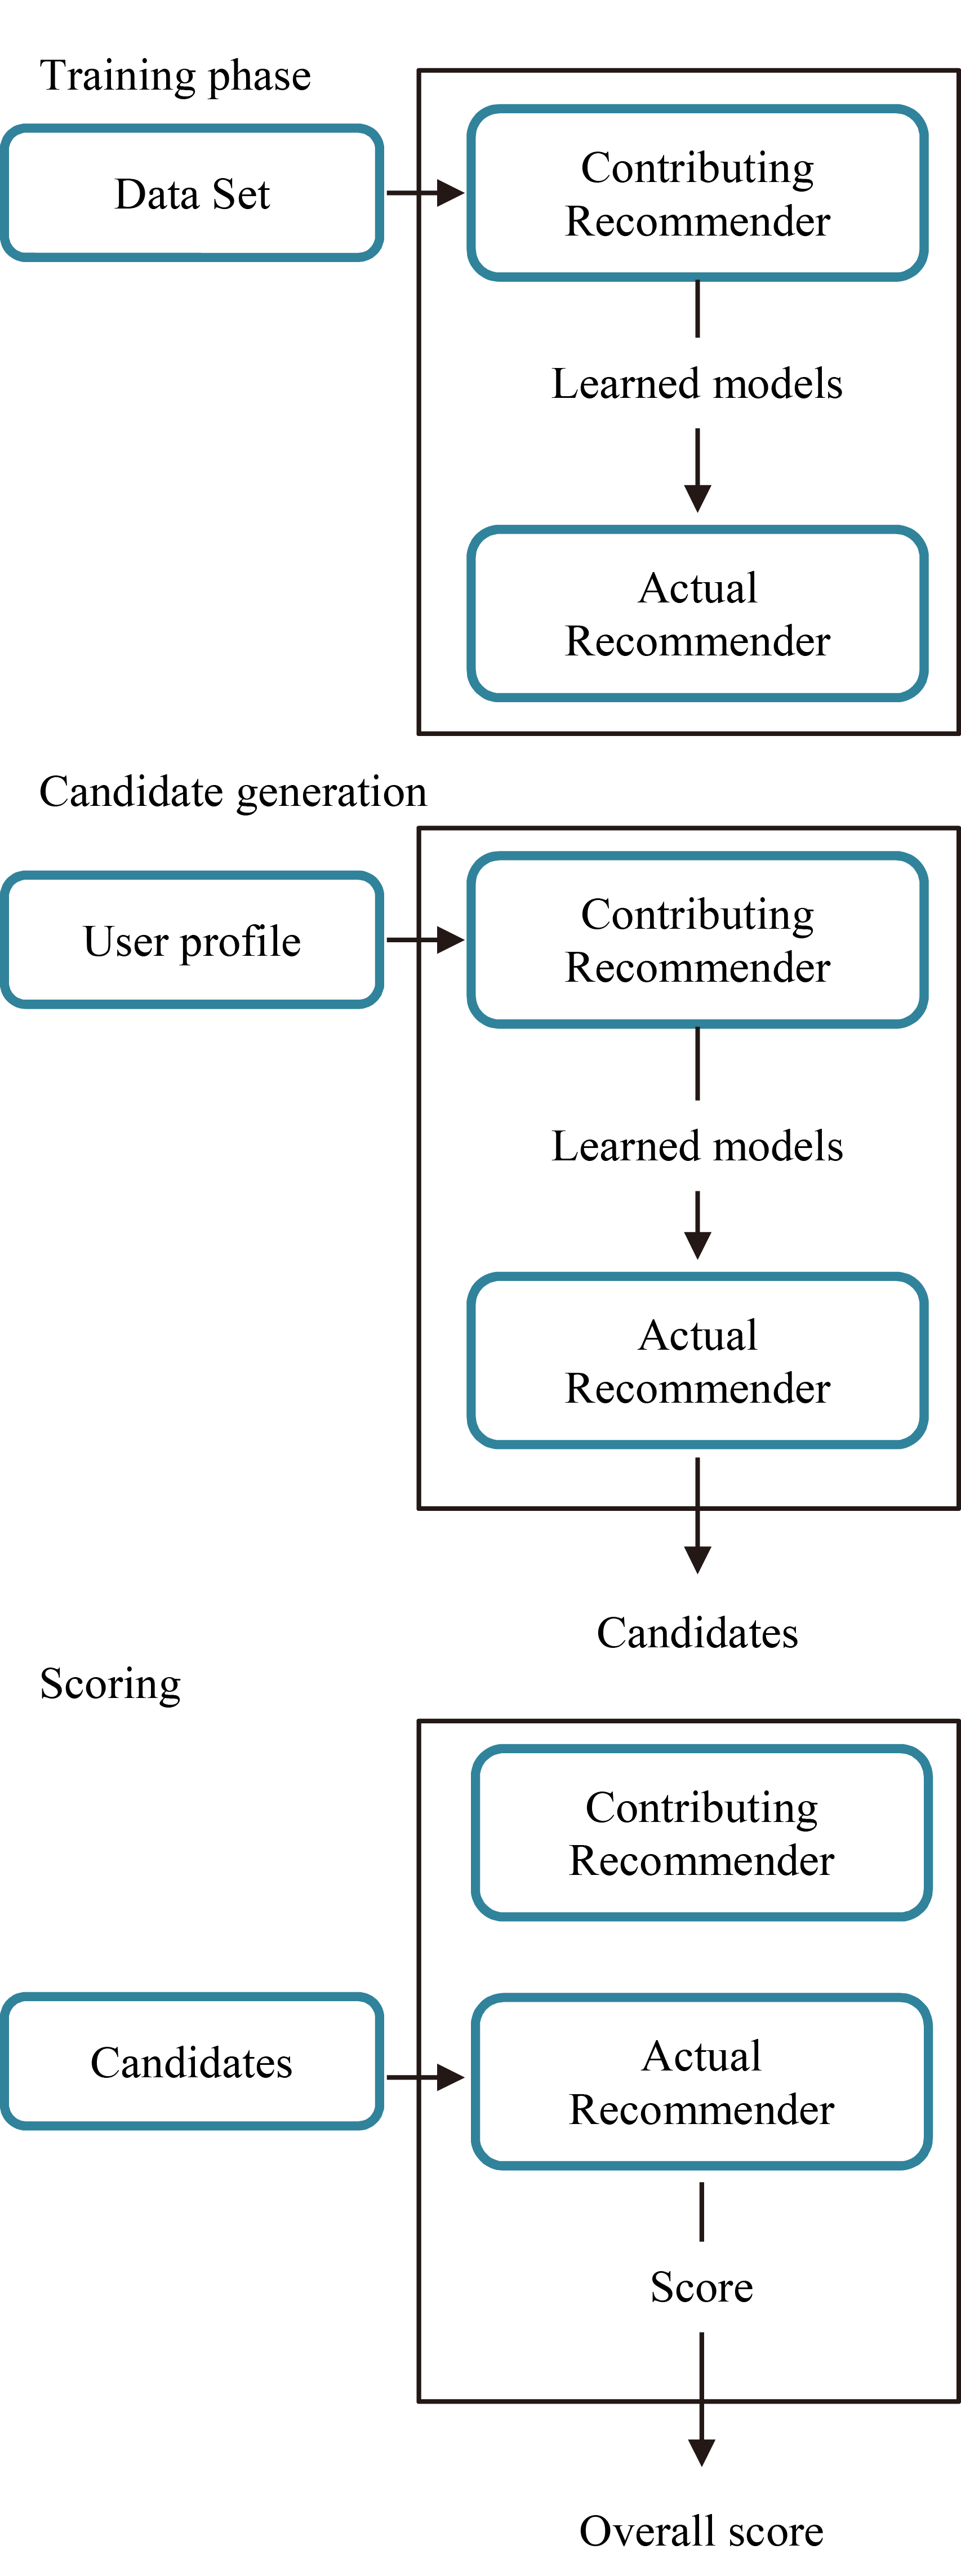
Chen et al. [36] proposed to compute the similarity matrix based on relative distance between user ratings to solve the sparsity problem in recommender systems.
Moghaddam and Selamat [38] proposed a clustering method to solve scalability problem. This method is a hybrid recommender system, which comprises of users’ demographic information and Collaborative Filtering.
Cantador et al. [37] proposed a hybrid recommendation model which combines Content-Based and Collaborative Filtering according to relations among users. The proposed approach is based on clusters that are used to find similarities among individuals at multiple semantic layers.
Smith et al. [29] proposed a latent neural network (LNN) with latent input variables as a hybrid collaborative filtering technique. LNN is a hybrid recommendation algorithm that leverages the advantages of collaborative filtering and content based filtering to achieve much lower error when recommending previously unrated items also to addressing the cold-start problem.
In this Section, we introduce the outline of the research concerning the meta-level technique, data sets, feature learning and computing the summary matrix.
Meta-level technique
Hybrid recommender systems are defined as a combination of various knowledge sources and different techniques together to obtain the outputs. Knowledge sources consist of user profiles, community data, and item features. Hybrid recommender systems can be divided into three different major categories (monolithic hybridization, parallel hybridization, and pipelined hybridization) with seven hybridization techniques [1].
Meta-level technique is one of the seven hybridization recommendation techniques in the pipelined hybridization design category. Meta-level technique makes the outputs of previous recommender system become inputs of subsequent one and the final system produces recommendations for users. As a result, the contributing recommender completely replaces raw data with the learned models and resulting data is used as input in the calculation of the actual recommender.
Overview of the summary matrix.
In this Section, we introduce each data set that we used in our approach. As well as, we describe some basic statistics of the training data sets. The two data sets that used in this study are available to download from the GroupLens Research website [30].
MovieLens 1M data set
GroupLens Research collected rating data sets from the MovieLens website [31]. The data sets were collected over various periods of time. The rating values range between 0.5 and 5. The data set consist of around 6,040 users and 3,883 items.
HetRec 2011 data set
The 2nd International Workshop on Information Heterogeneity and Fusion in Recommender Systems (HetRec 2011) [32] released data set from Delicious, Last.fm Web 2.0, MovieLens, IMDb, and Rotten Tomatoes. This data set contains social networking, tagging, and individual information from sets of around 2,113 users. The rating values range between 0.5 and 5. The data set consist of around 2,113 users and 10,197 items.
Statistics of training data sets
Statistics of training data sets
In Table 1, the statistics of training data sets: HetRec 2011 and MovieLens 1M are listed. Average number of users who gave ratings for items and average number of items that were rated by users can be seen in Table 1.
In machine learning, feature learning (or representation learning) is a set of techniques that learns features [19, 23]. The new representation should make machine learning algorithms simpler and more flexible.
The data set in our paper consists of two major categories: users and items (movies). Each one of the data set contains many features which include many attribute values. For example, user’s category contains gender, occupation, age and ZIP code, item’s category contains title, genres, actors, and year of release. Gender feature contains two attribute values: male and female. Genre feature contains many attribute values such as action, comedy, and drama.
Feature creation is a process to generate new features based on existing attribute values. For example, say, we have genre (action, comedy, crime, romance) as an input values in a data set. We can generate new features like action, comedy, crime, and romance that may have a better relationship. This step is used to highlight the hidden relationship in the attribute values.
Feature engineering is the science of extracting more information from existing data [18]. We are not adding any new data here, but we are making the data we already have more useful. There are various techniques to create new features, as is done in [18]. The summary matrix is based on selected feature for movie data set, in our approach the genre feature is good.
An illustration of obtaining the summary matrix and the techniques that we will apply on this matrix to get the recommendations is given in Fig. 4. It can also be described as follows:
Extract all attribute values of the selected feature. Extract the attribute values of the selected feature without repetition. Create the summary matrix with new columns based on attribute values of the selected feature. Fill the summary matrix with the average ratings based on attribute values of the selected feature. Compute similarity scores between users in the summary matrix by using Collaborative Filtering, as in Eq. (1).
Get the recommended item by using Eq. (2).
Get top
Below we explain our feature learning method. In this method we learn a “summary matrix” that has average rating values for a user on attribute values of a selected column. For this work we selected the genre column as an example.
Let
Where,
All entries are either textual or integers. Genre (
Likewise,
Likewise,
We can define
Statistics of the summary matrix
Term Frequency (TF) denotes the number of times that the attribute values of the selected feature
The summary matrix will be filled with average ratings for items that are rated by a user in the data set. The summary matrix consists of the same number of users (rows) in the data set, but new items (columns).
In Table 2, the statistics of the summary matrix after implementing Algorithm 1 are listed. The number of items in the summary matrix is reduced. Therefore, the rating density is increased, which contributes to solve the problems: scalability, sparsity and cold start.
Amount of decrease in the items.
The rating density.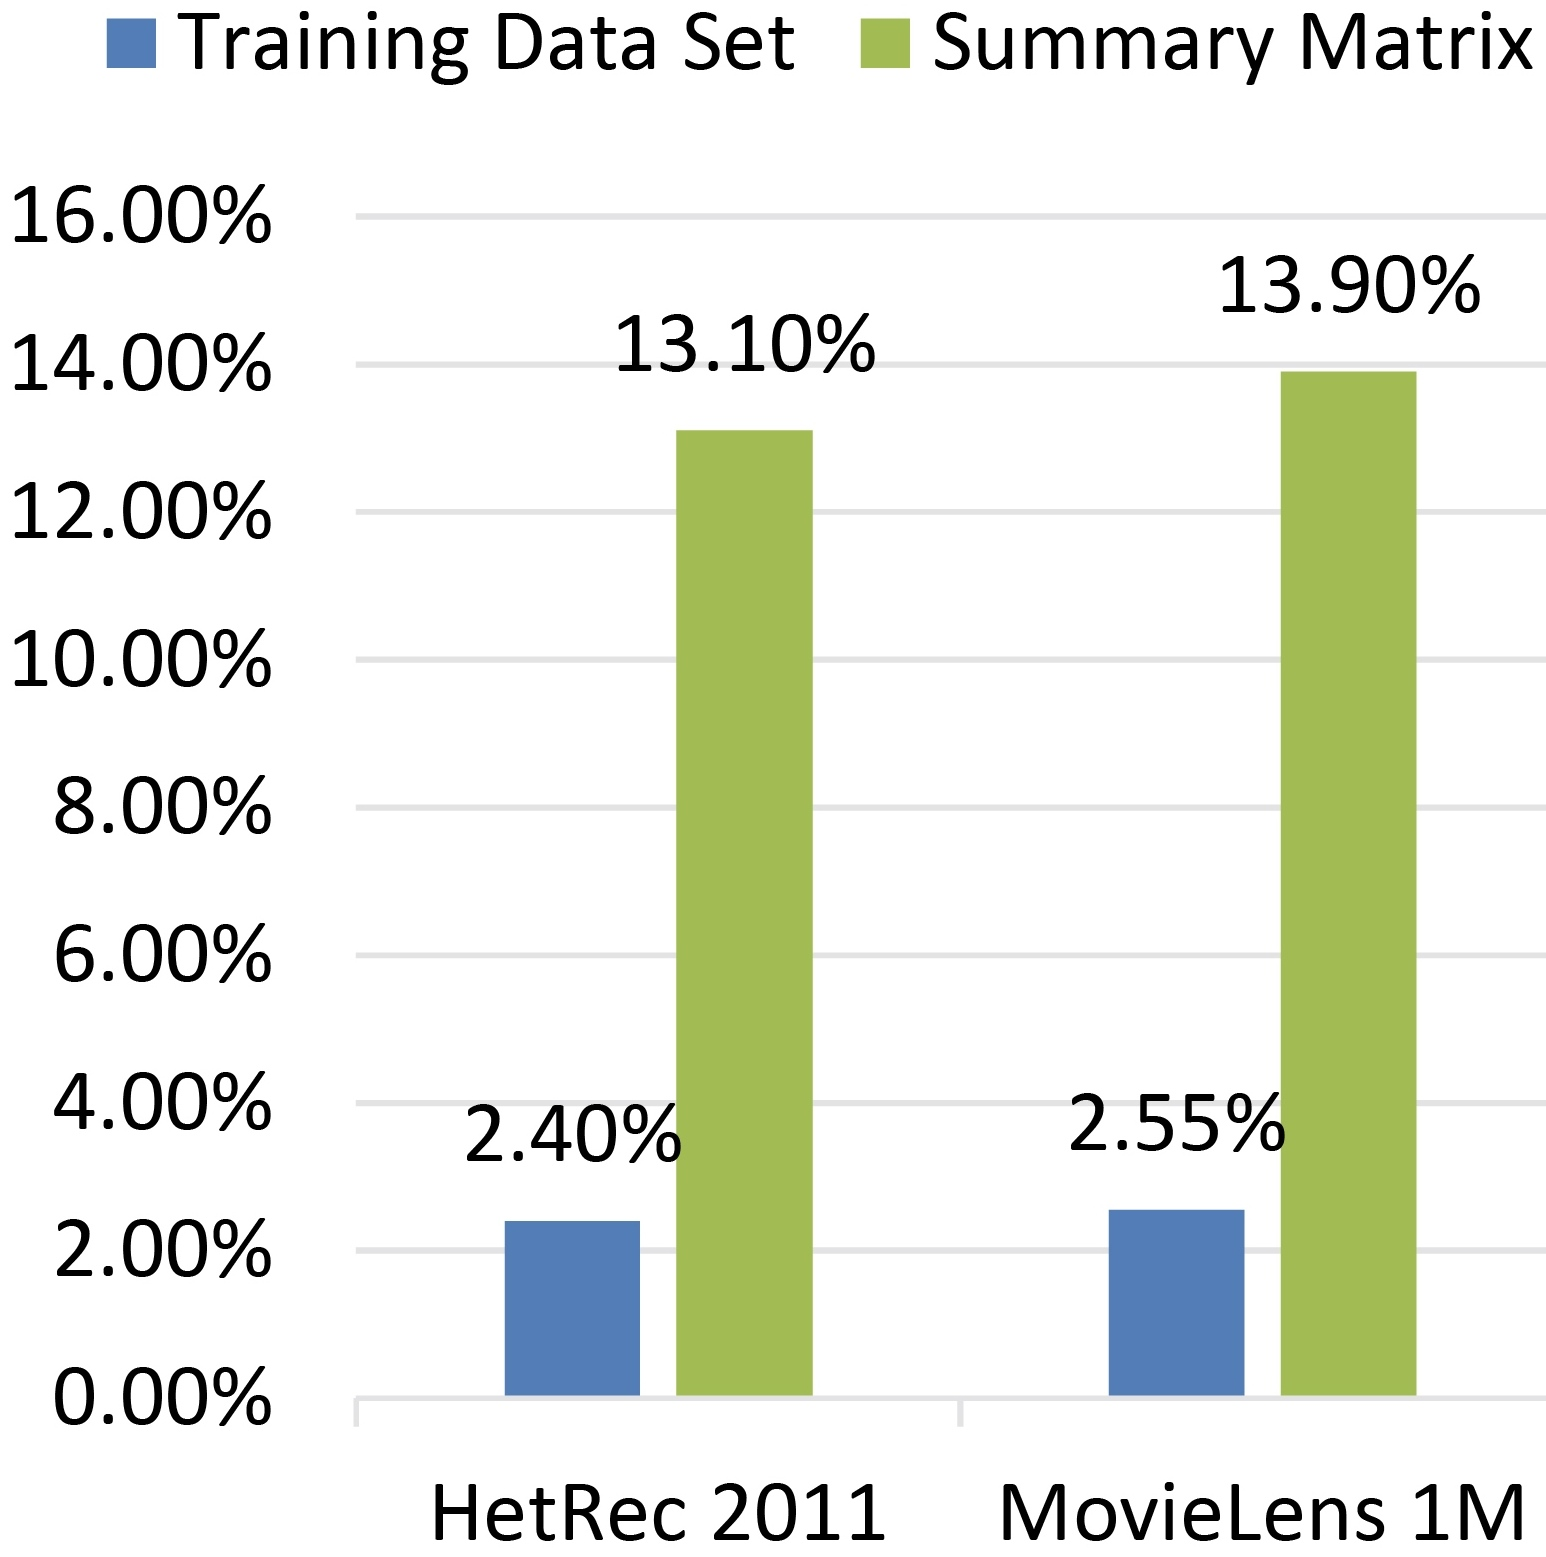
General schematic of techniques that we used.
The results obtained through creating the summary matrix can be summarized as follows:
Decreasing the number of items. Increasing the ratings matrix density. Increasing the ratings of users. Increasing the ratings of items.
Now, we have two important questions will be provable in the next Section:
How useful of reducing the items? Can the proposed approach improve the recommendation accuracy?
Time-consuming
In this Section, we re-predict the ratings of a testing data set. Following this, we will review the findings of comparing two techniques of hybrid recommender systems based on the summary matrix with the Collaborative Filtering Pearson Correlation approach based on a training data set. Each technique has a different pattern, which makes it vary in the strengths and drawbacks. Therefore, each technique has characteristic results.
Overview
Recommender systems have been evaluated in many different evaluation metrics over the past several years [1, 25, 34]. Recommender systems evaluation is difficult because the evaluation results are mutable, it is based on algorithms, data sets, and evaluation metrics together. Evaluation metrics are divided into two major categories according to desired recommendations results. The first category is based on numeric value (i.e. error ratio) that represents the difference of original rate and predicted rate, and is called predictive accuracy metrics. The second category is based on relevance (i.e. separating the range of rating into two groups) that represents the relevant or irrelevant relation between original rate and predicted rate, and is called classification accuracy metrics. There is motivation to use both types of evaluation metrics in this thesis because every category follows a certain pattern for evaluation.
Data sets and preprocessing
The summary matrix is created by implementing Algorithm 1 on two data sets MovieLens 1M and HetRec 2011, as we mentioned in Section 3. The purpose of creating the summary matrix is to improve the performance and get accurate recommendations.
We propose two techniques of hybrid recommender systems according to the summary matrix. Each one has advantages different from the other because the first technique combines two techniques and another consists of three techniques.
HRS-1 denotes combining summary matrix and Collaborative Filtering Pearson Correlation approach.
HRS-2 denotes combining summary matrix, K-Nearest User, and Collaborative Filtering Pearson Correlation approach.
CFP denotes to Collaborative Filtering Pearson Correlation approach.
Table 3 shows the advantage of reducing items, through reducing time-consuming for testing one sample (in second) to predict the rate.
Evaluation metrics
We applied five evaluation metrics belonging to two categories. It would be better to choose one or more evaluation metrics to compare the accuracy of different recommender systems [25].
Predictive accuracy metrics
Predictive accuracy metrics are based on numerical differences between predicted ratings and true ratings that users give to the movies. The rating is estimated by five-stars in the selected data set: HetRec 2011 and MovieLens 1M.
Recommender systems evaluation relies on how close predicted ratings are to true ratings. The recommender system is considered successful if the difference between the numerical values is small or vice-versa.
There are many evaluation metrics for evaluating the ability of recommender systems to correctly predict a specific item. Mean Absolute Error (MAE) and Root Mean Squared Error (RMSE) are two of the most important evaluation metrics [1]. These predictive accuracy metrics are used for recommender systems evaluation because it is easy to calculate and understand.
Evaluations of predictive accuracy metrics.
MAE for CFP, HRS-1, and HRS-2.
MAE Eq. (9) measures the average absolute deviation between predicted rating and true rating. RMSE Eq. (10) represents the sample standard deviation of the differences between predicted rating and true rating.
Where
RMSE metric used as a condition to determine the winner in the competition of Netflix Inc. [26]. The condition was to improve the results of RMSE metrics of a proposed algorithm 10% compared with the Netflix Inc. algorithm which is called Cinematch.
MAE and RMSE evaluations
Table 4 and Fig. 8 show the results of MAE and RMSE evaluation metrics of HRS-1 and HRS-2 in comparison with CFP.
The performance superiority of HRS-1, can be seen in Fig. 8.
In Fig. 9, MAE for CFP, HRS-1, and HRS-2 with 40%, …, 90% of the training data set is illustrated.
When we have 90% of the available ratings, the performance superiority of HRS-2, can be seen in Fig. 9.
In Fig. 10, RMSE for CFP, HRS-1, and HRS-2 with 40%, …, 90% of the training data set is illustrated.
When we have 80% of the available ratings, the performance superiority of HRS-2, can be seen in Fig. 10.
RMSE for CFP, HRS-1, and HRS-2.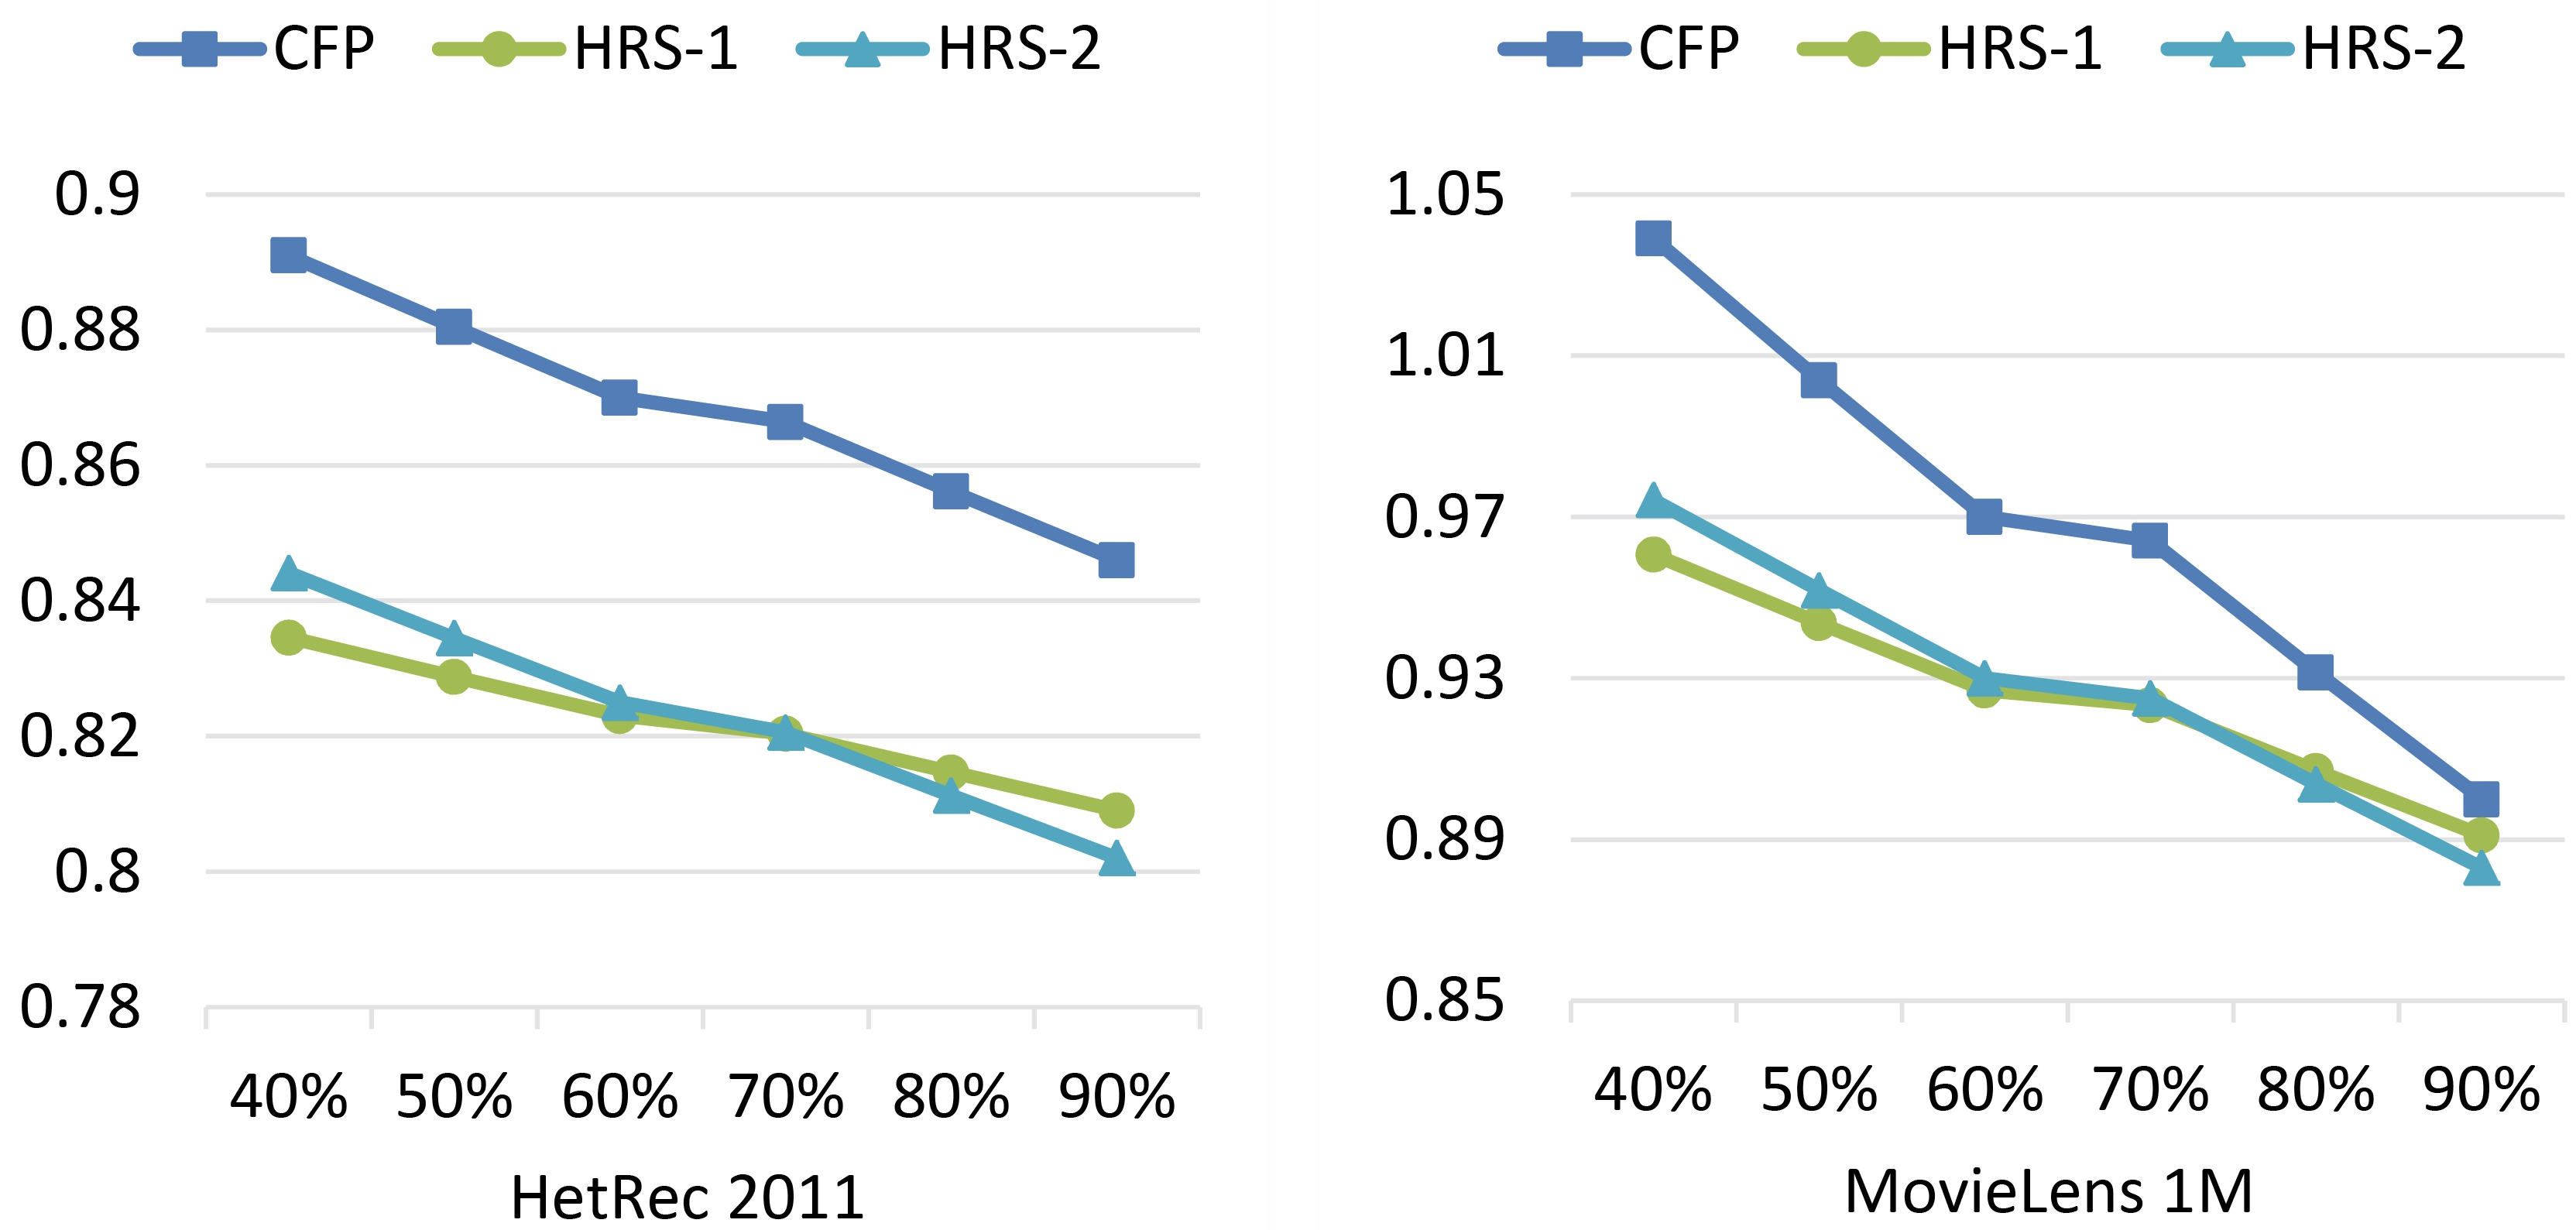
Evaluations of classification accuracy metrics.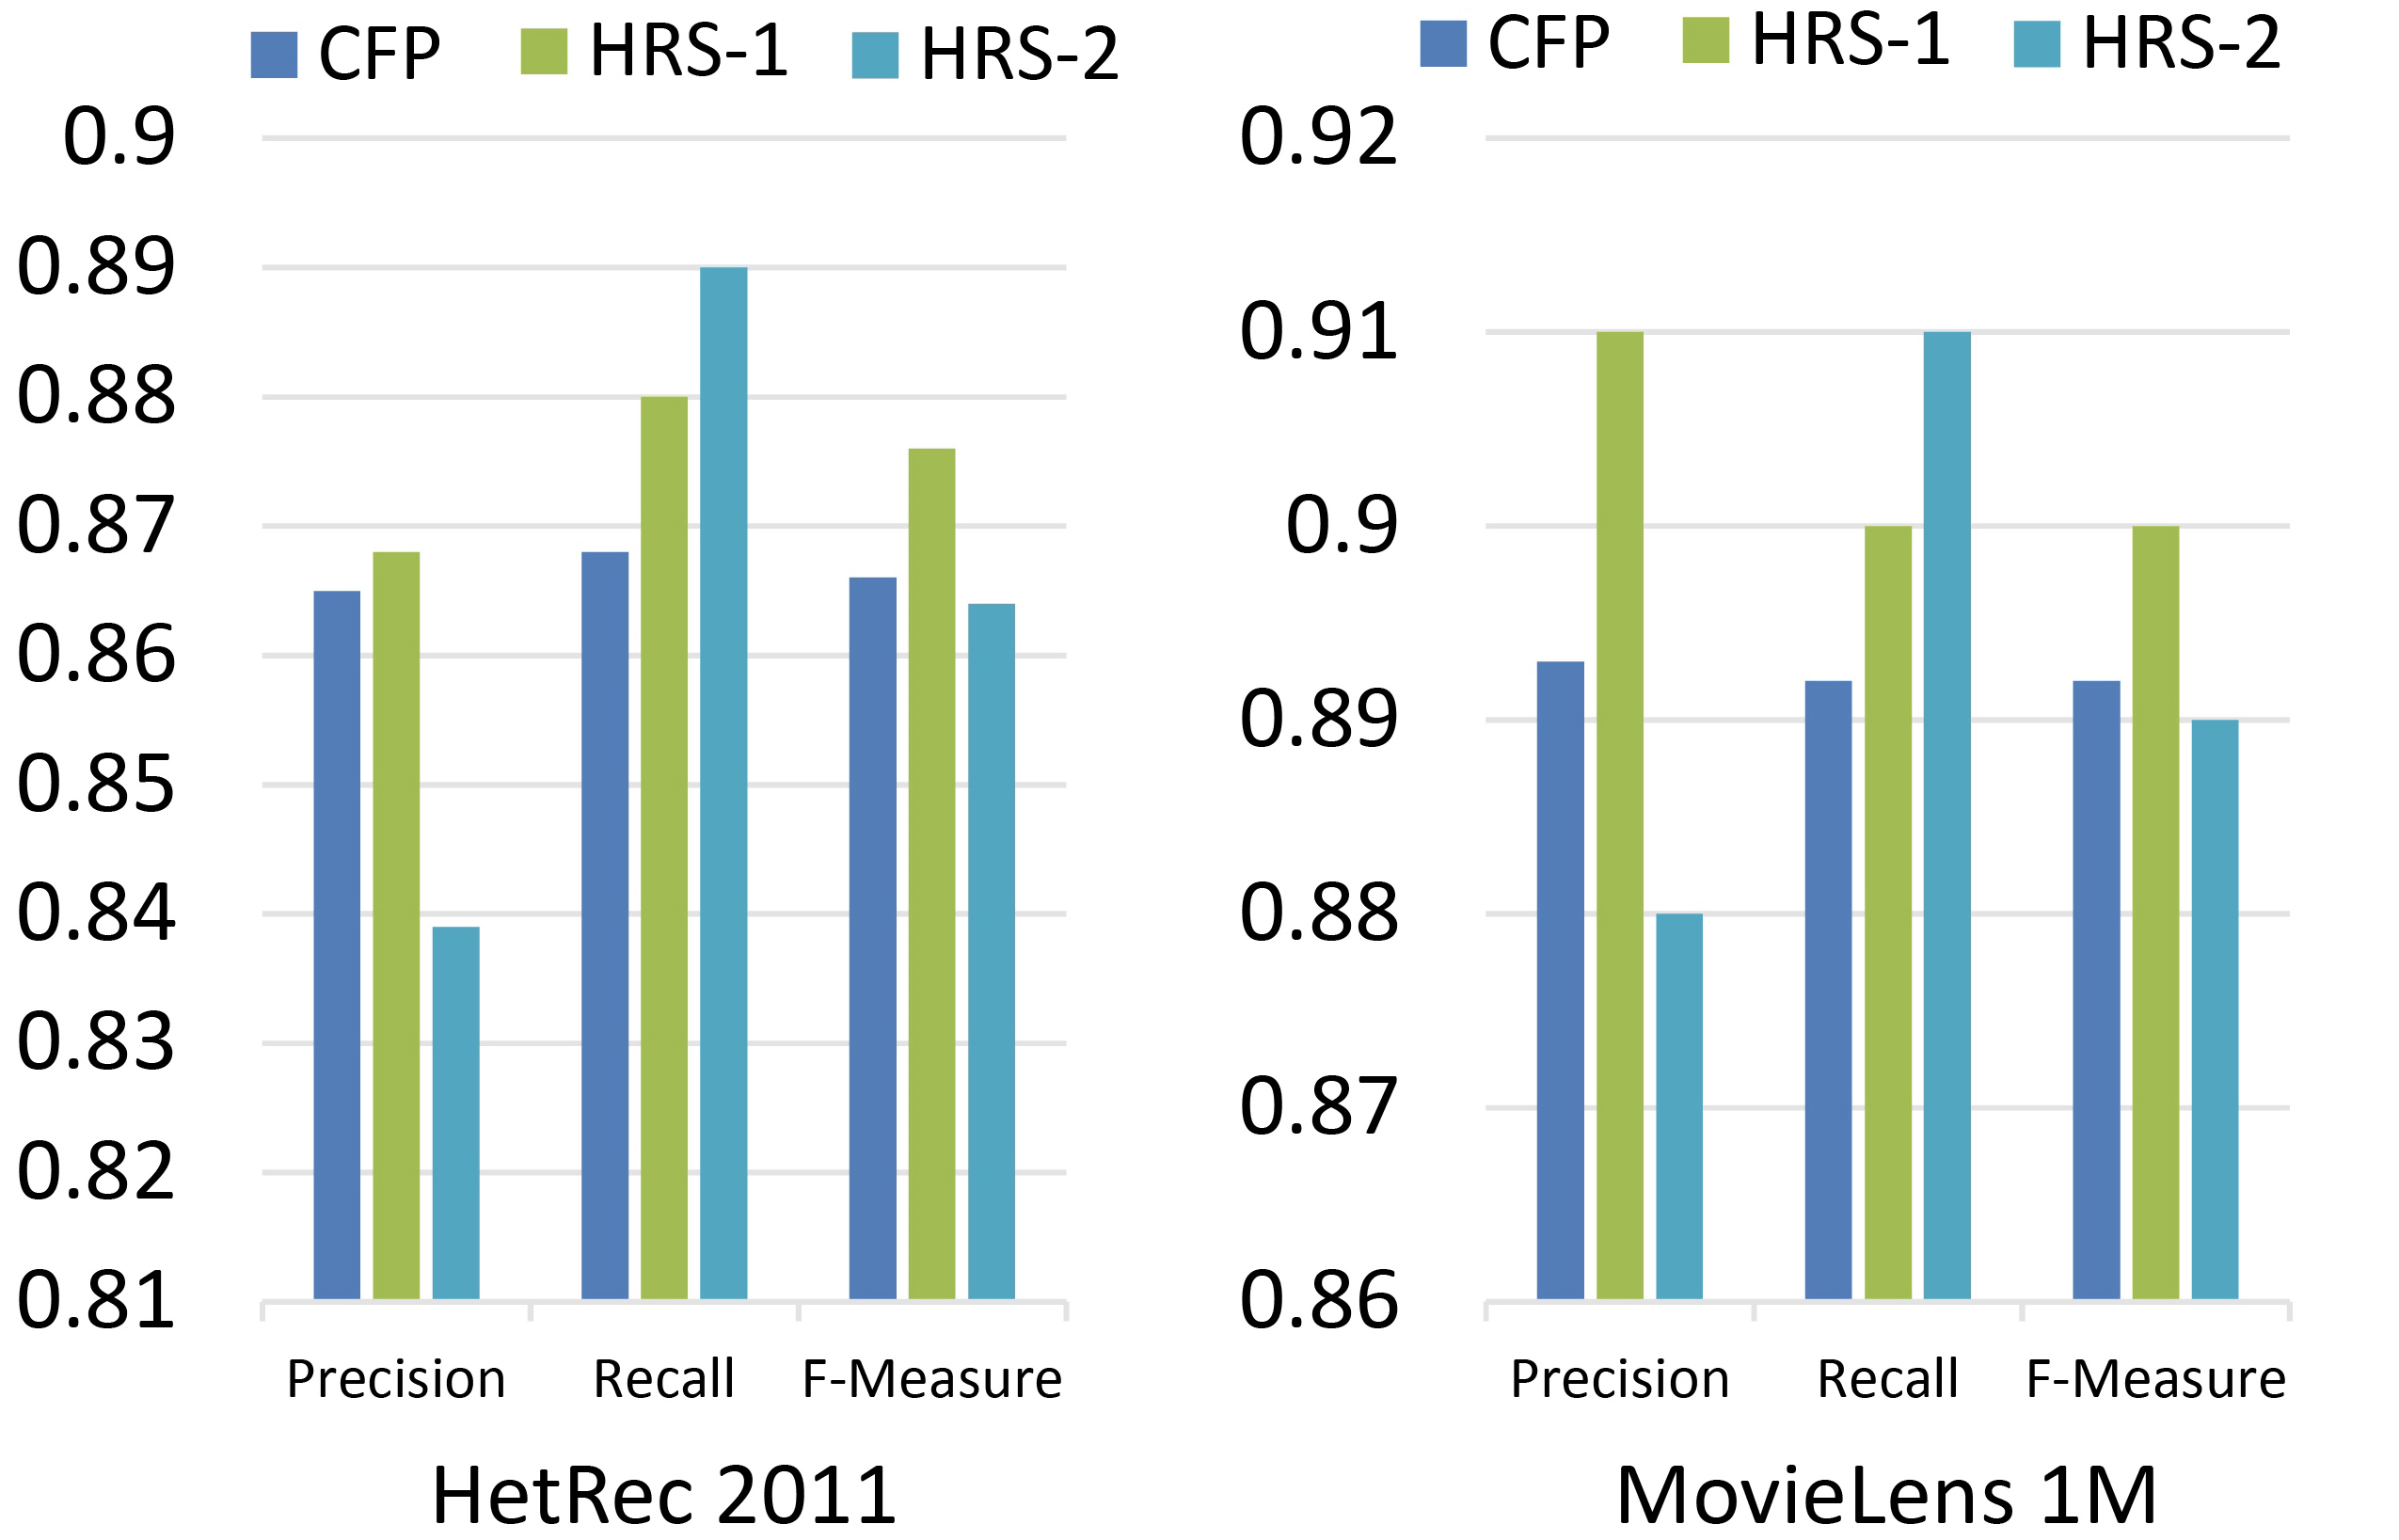
Classification accuracy metrics are based on relevance between predicted ratings and true ratings to determine which items are relevant (i.e. good) and which items are irrelevant (i.e. bad). We will separate the data set into two classes depending on a threshold. All ratings of 0.5 to less than 3 “irrelevant” and 3–5 “relevant”.
We can classify each recommendation such as [40]:
True positive, an acceptable item recommended to user. True negative, an unacceptable item not recommended to user. False positive, an unacceptable item recommended to user. False negative, an acceptable item not recommended to user.
Precision and recall are the most popular metrics in the information retrieval field and depend on separation between relevant “positive” and irrelevant “negative” items. Precision and recall are used in [33, 39]. F-measure allows for combining precision and recall into a single score.
Precision Eq. (11) is defined as the ratio of relevant items recommended to a number of items recommended. Precision represents the probability that a recommended item is relevant.
Precision for CFP, HRS-1, and HRS-2.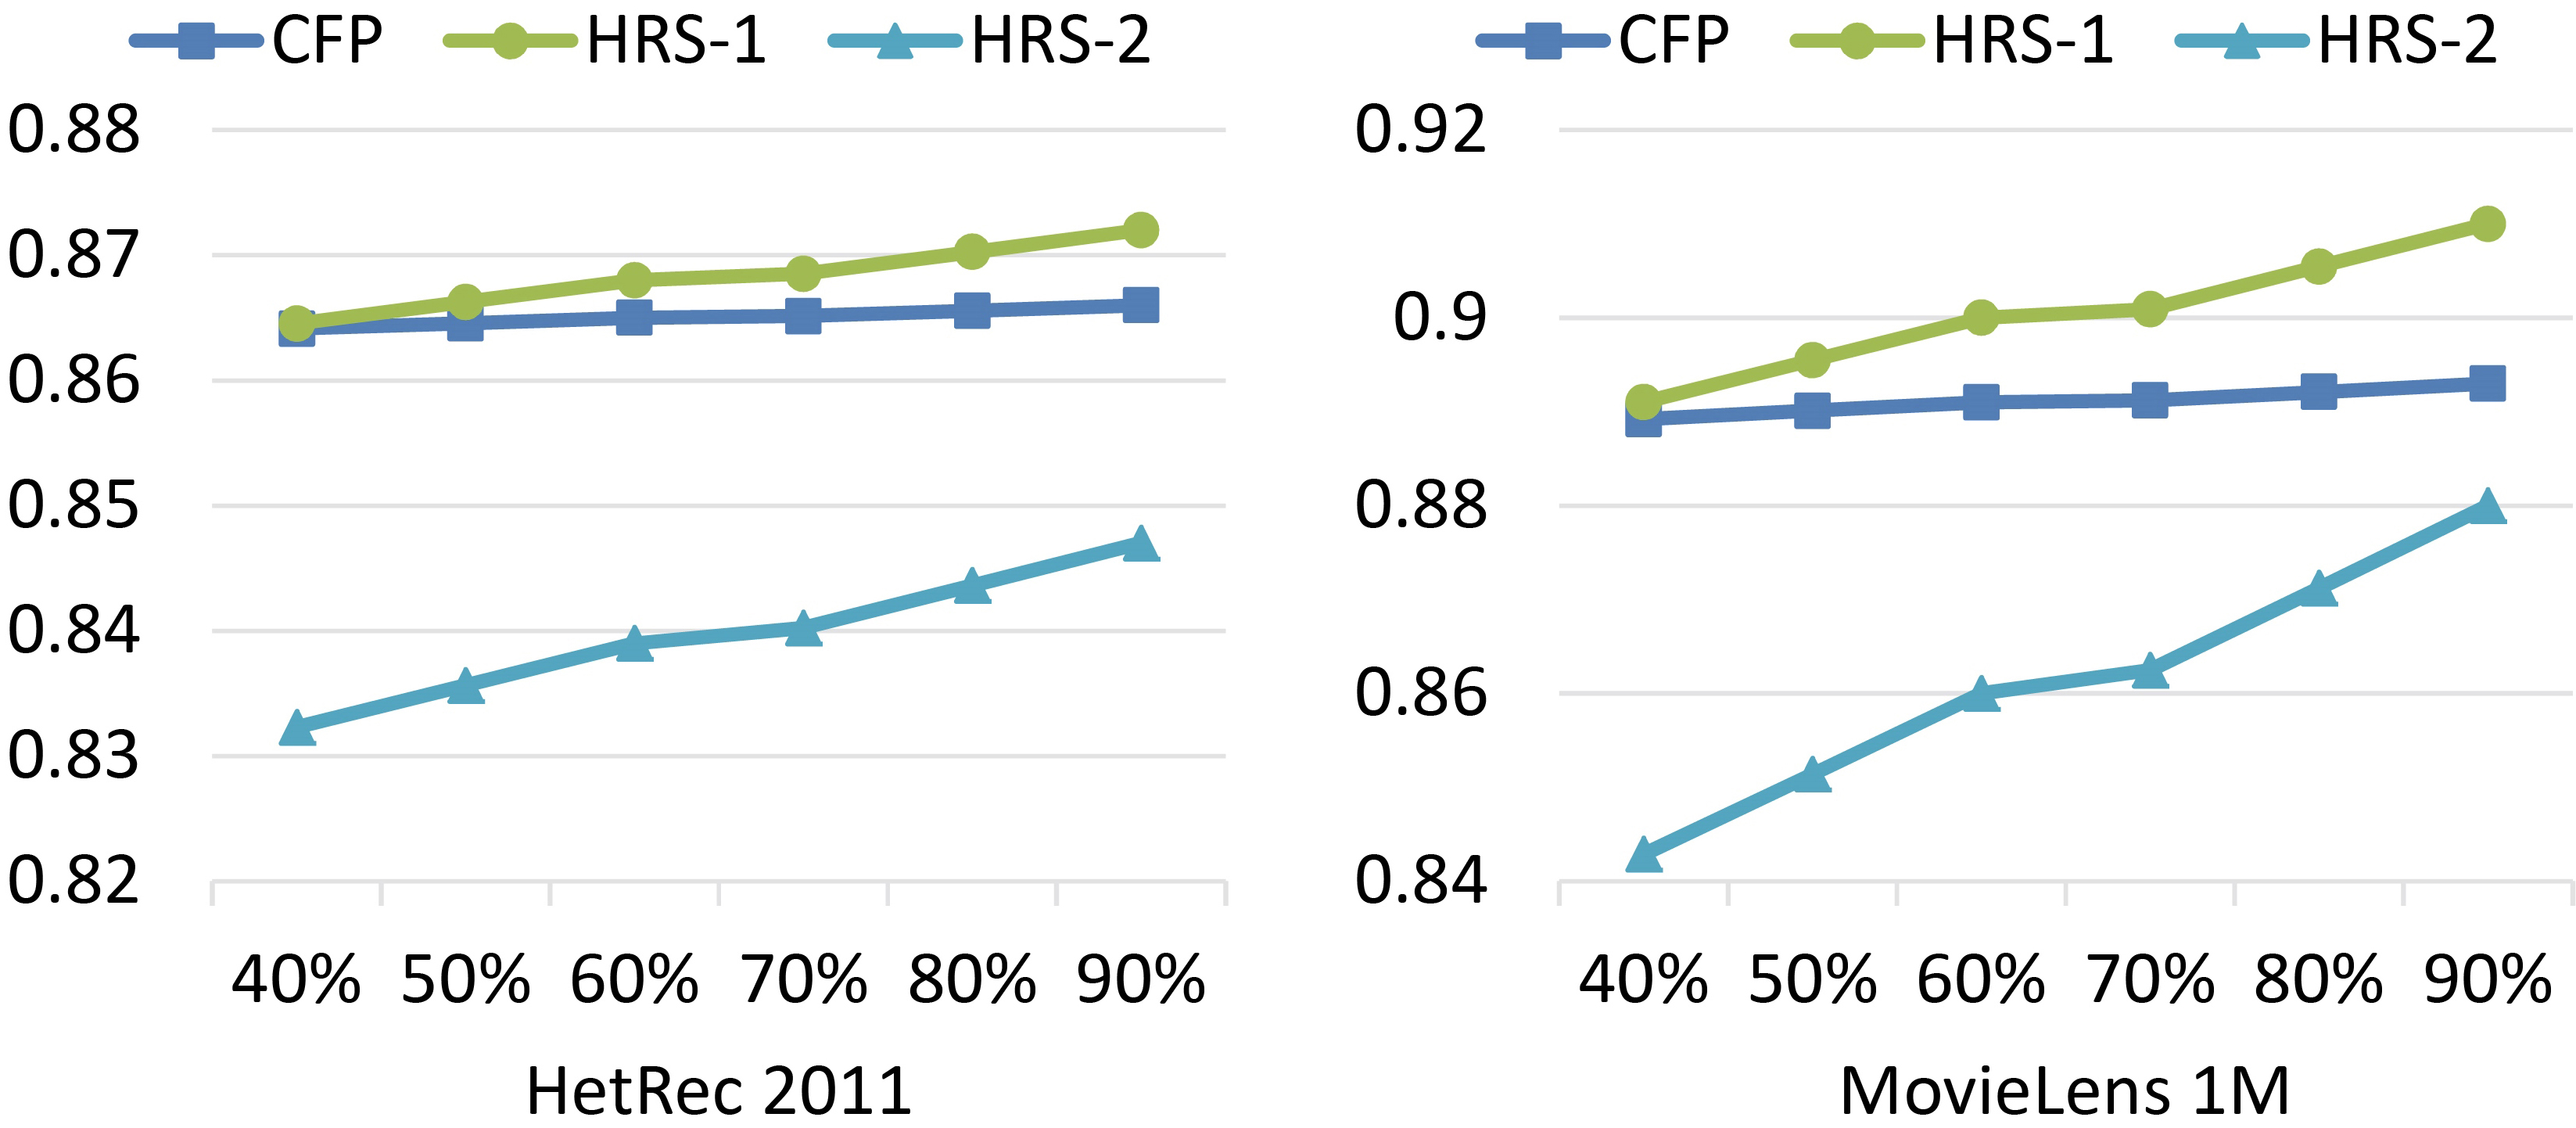
Recall for CFP, HRS-1, and HRS-2.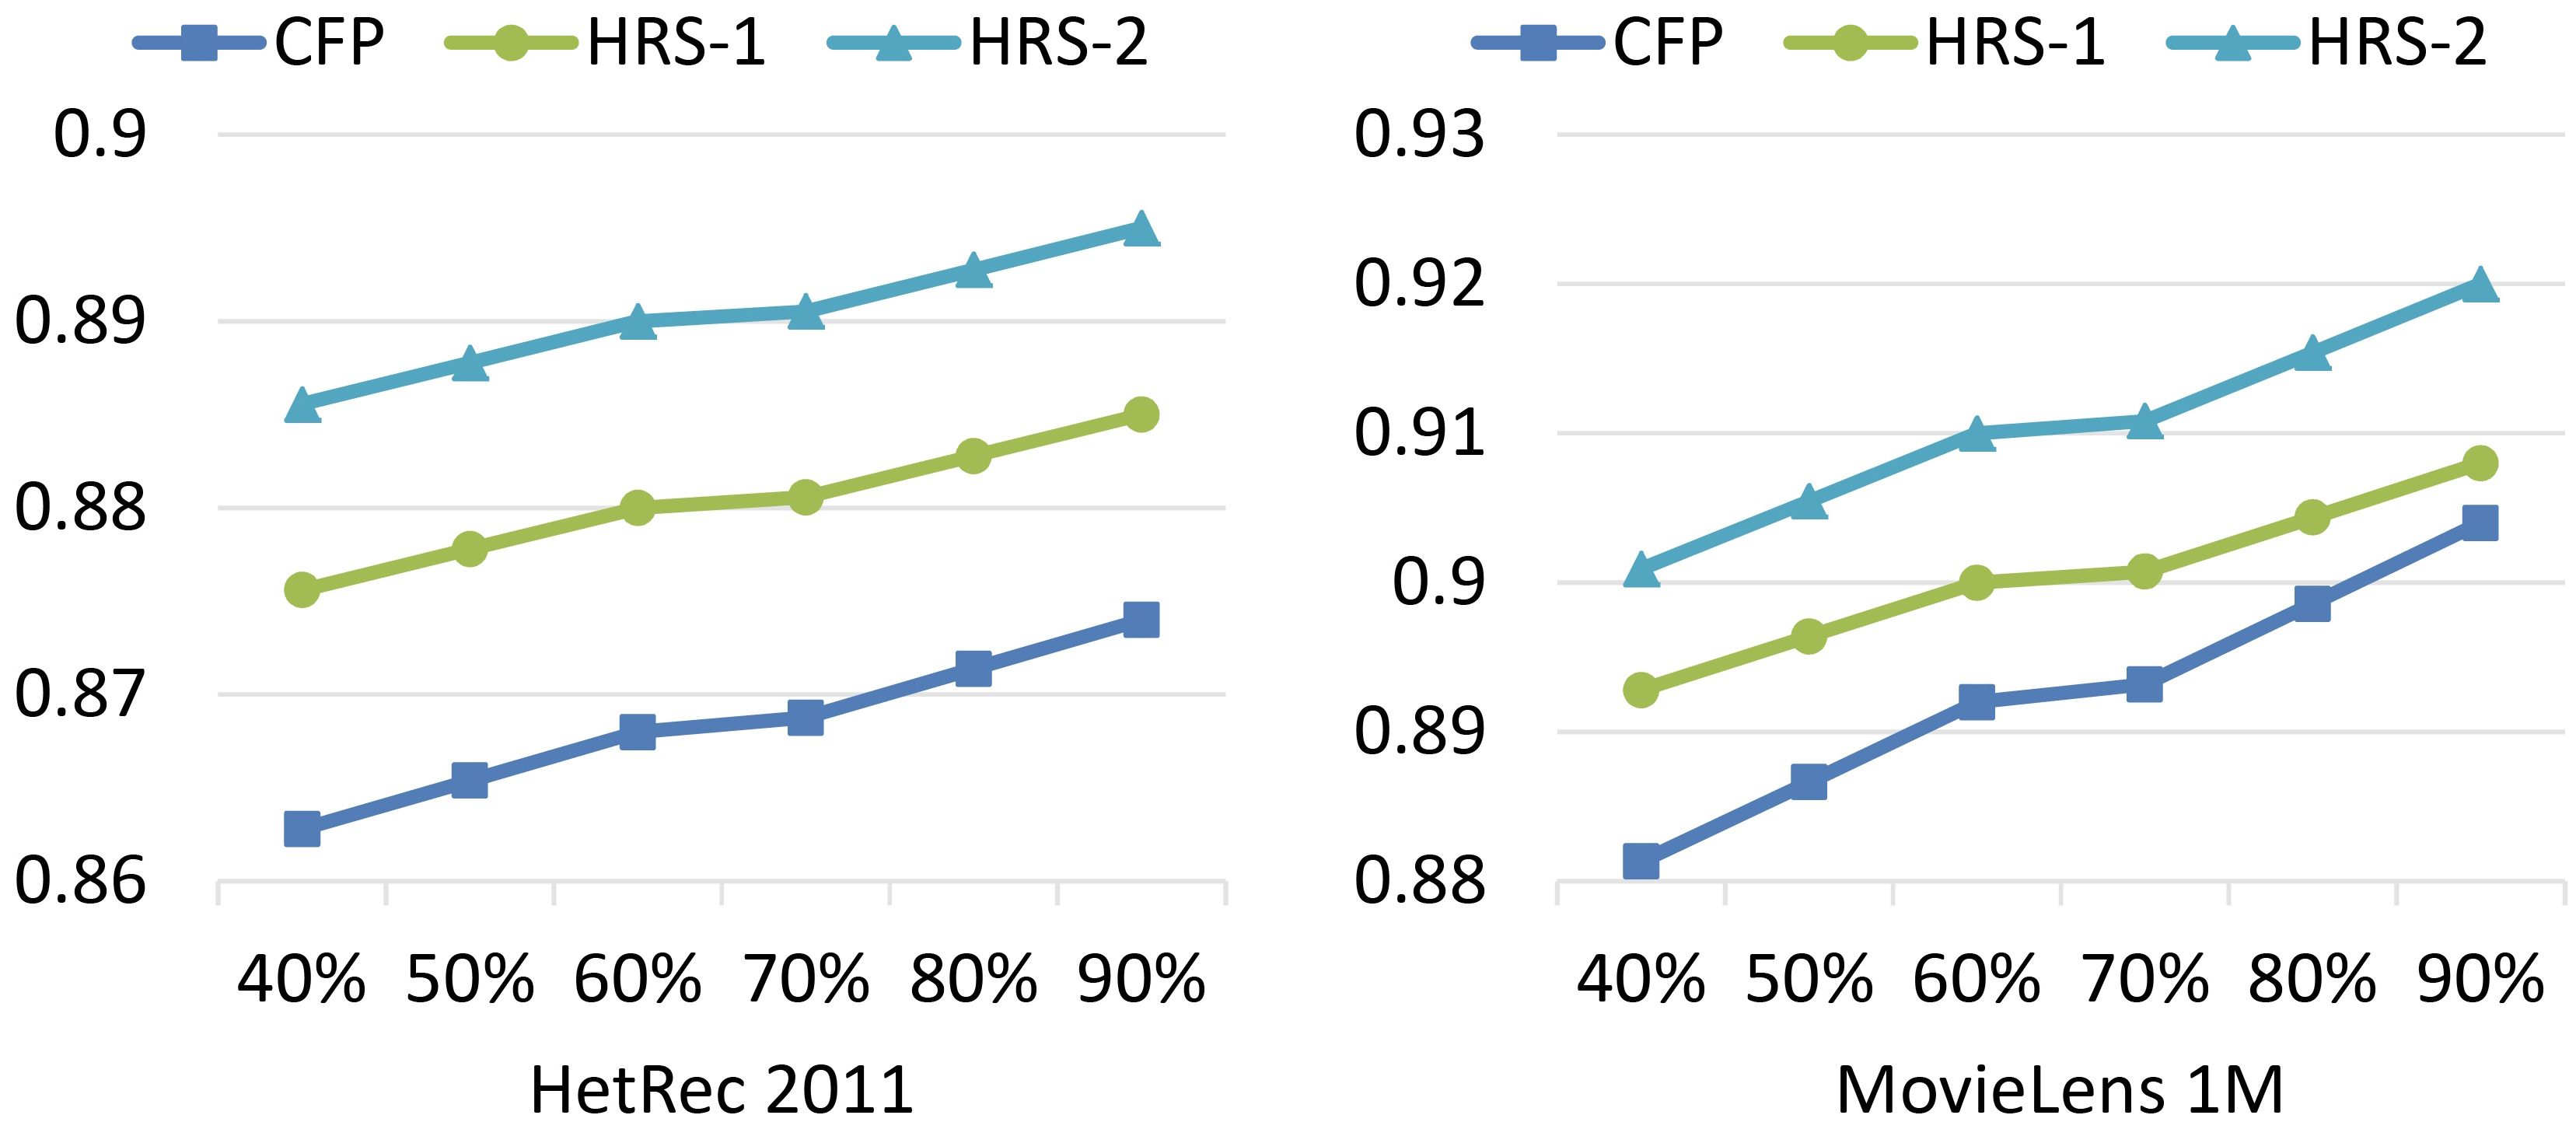
Recall Eq. (12), defines as the ratio of relevant items recommended to total number of relevant items. Recall represents the probability that a relevant item will recommend.
F-measure Eq. (13), defines as average number of the precision and recall. F-measure represents the balance between precision and recall.
Precision, recall, and F-measure evaluations
Table 5 and Fig. 11 show the results of precision, recall, and F-measure evaluation metrics of HRS-1 and HRS-2 comparing with CFP.
The performance superiority of HRS-1 in precision, recall, and F-measure and HRS-2 in recall, can be seen in Fig. 11.
In Fig. 12, precision for CFP, HRS-1, and HRS-2 with 40%, …, 90% of the training data set is illustrated.
The performance superiority of HRS-1 with 40%, …, 90% of the available ratings, can be seen in Fig. 12.
In Fig. 13, recall for CFP, HRS-1, and HRS-2 with 40%, …, 90% of the training data set is illustrated.
Comparison according to CWOCF approach
Comparison according to LNN approach
Percentage improvement of all results obtained
F-measure for CFP, HRS-1, and HRS-2.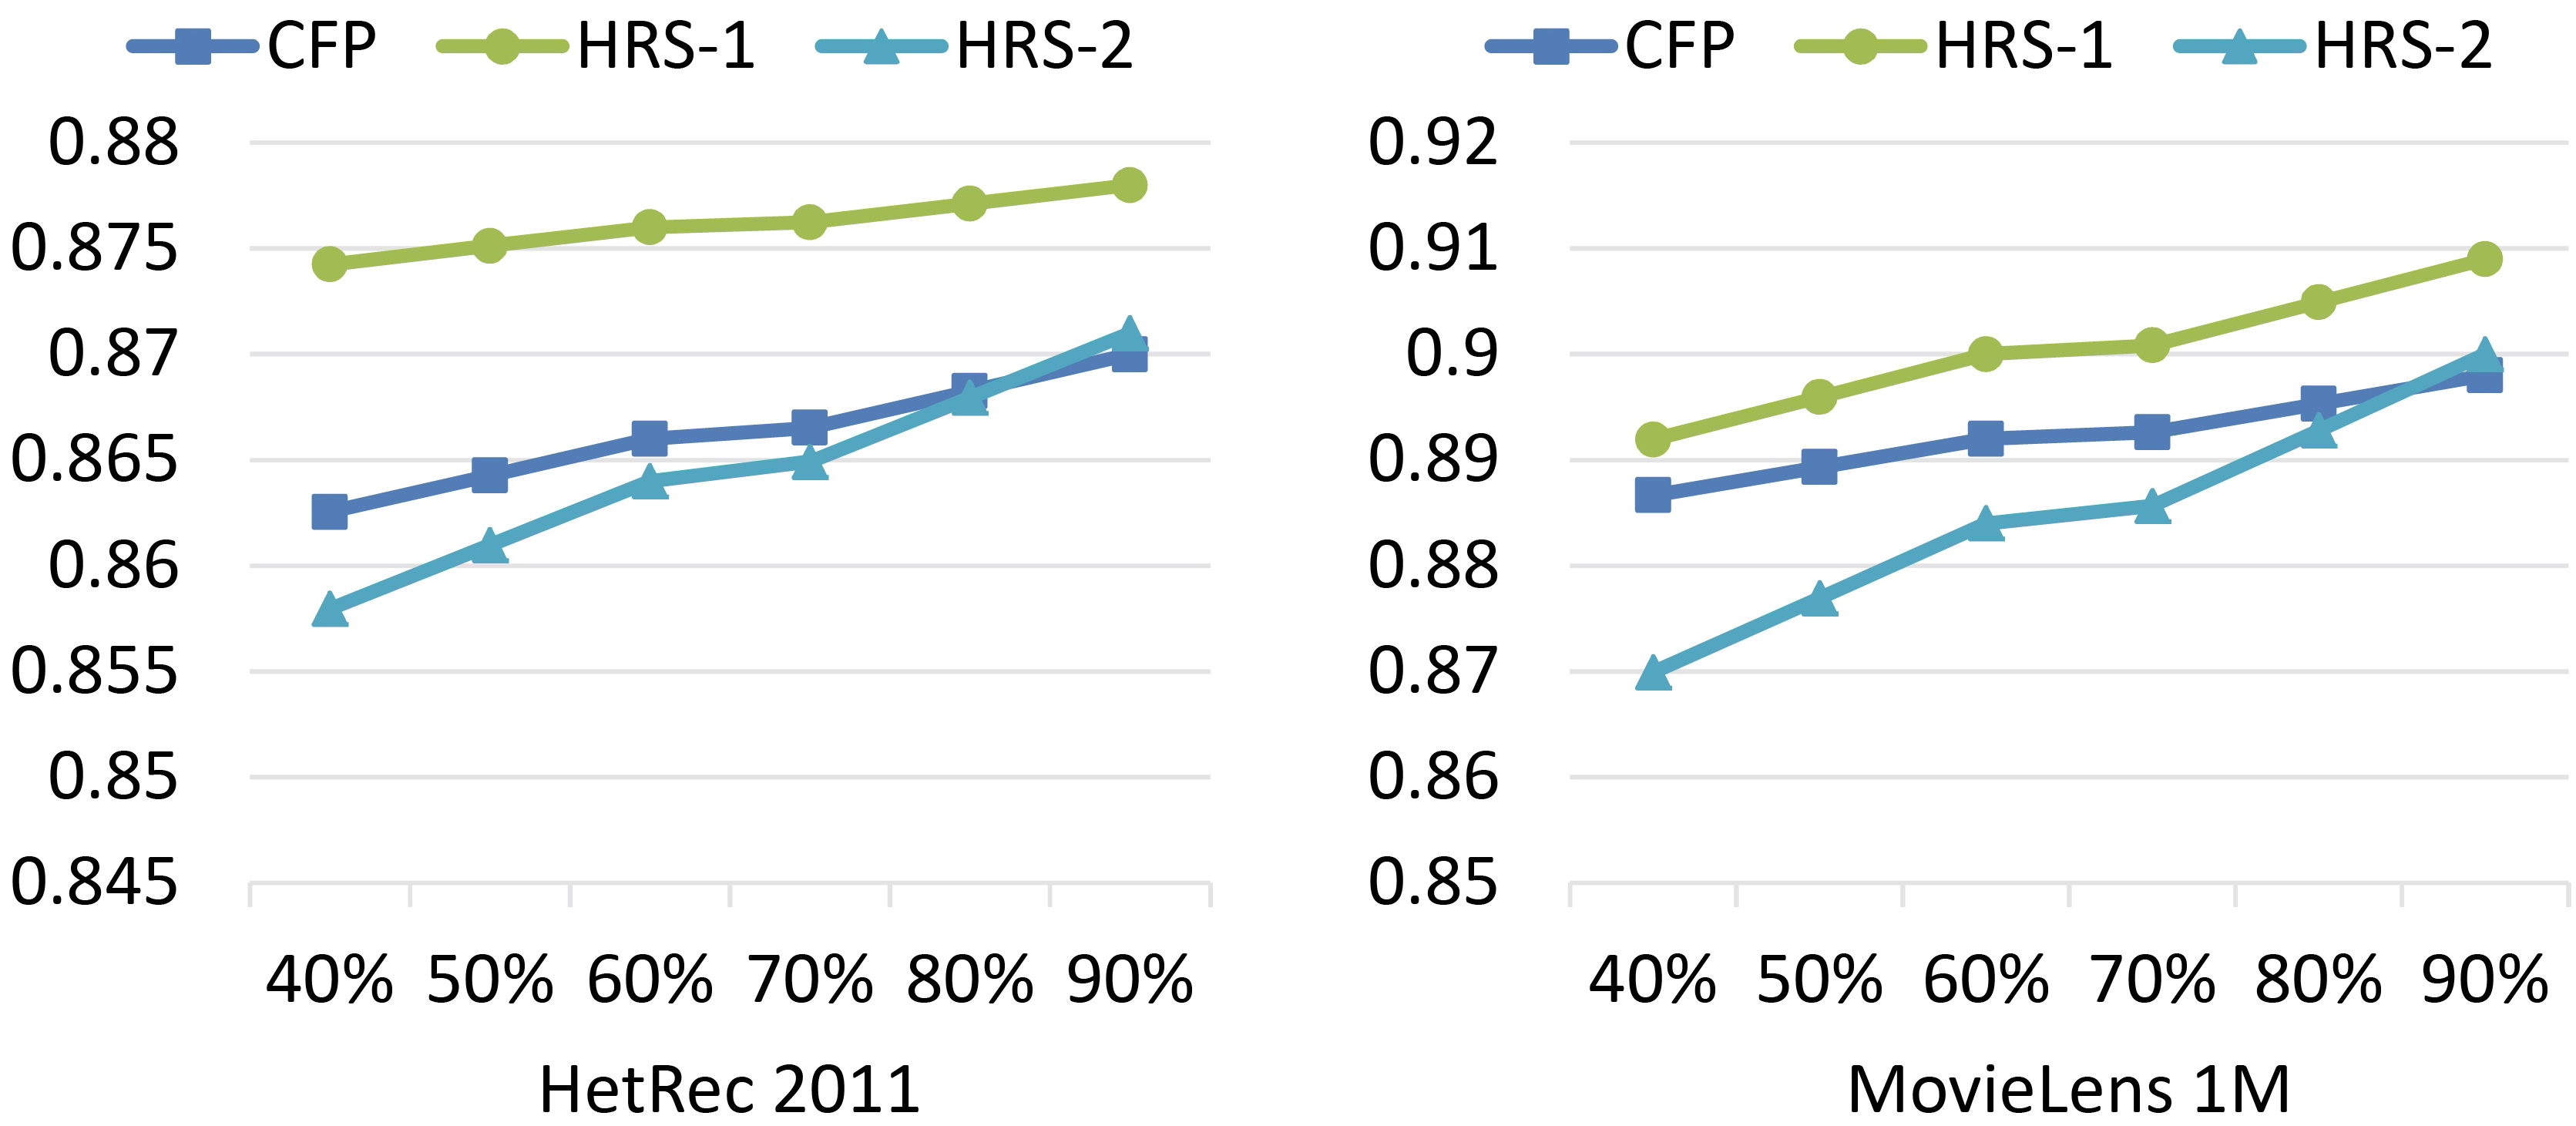
Comparison of up and up-q approaches with our approach.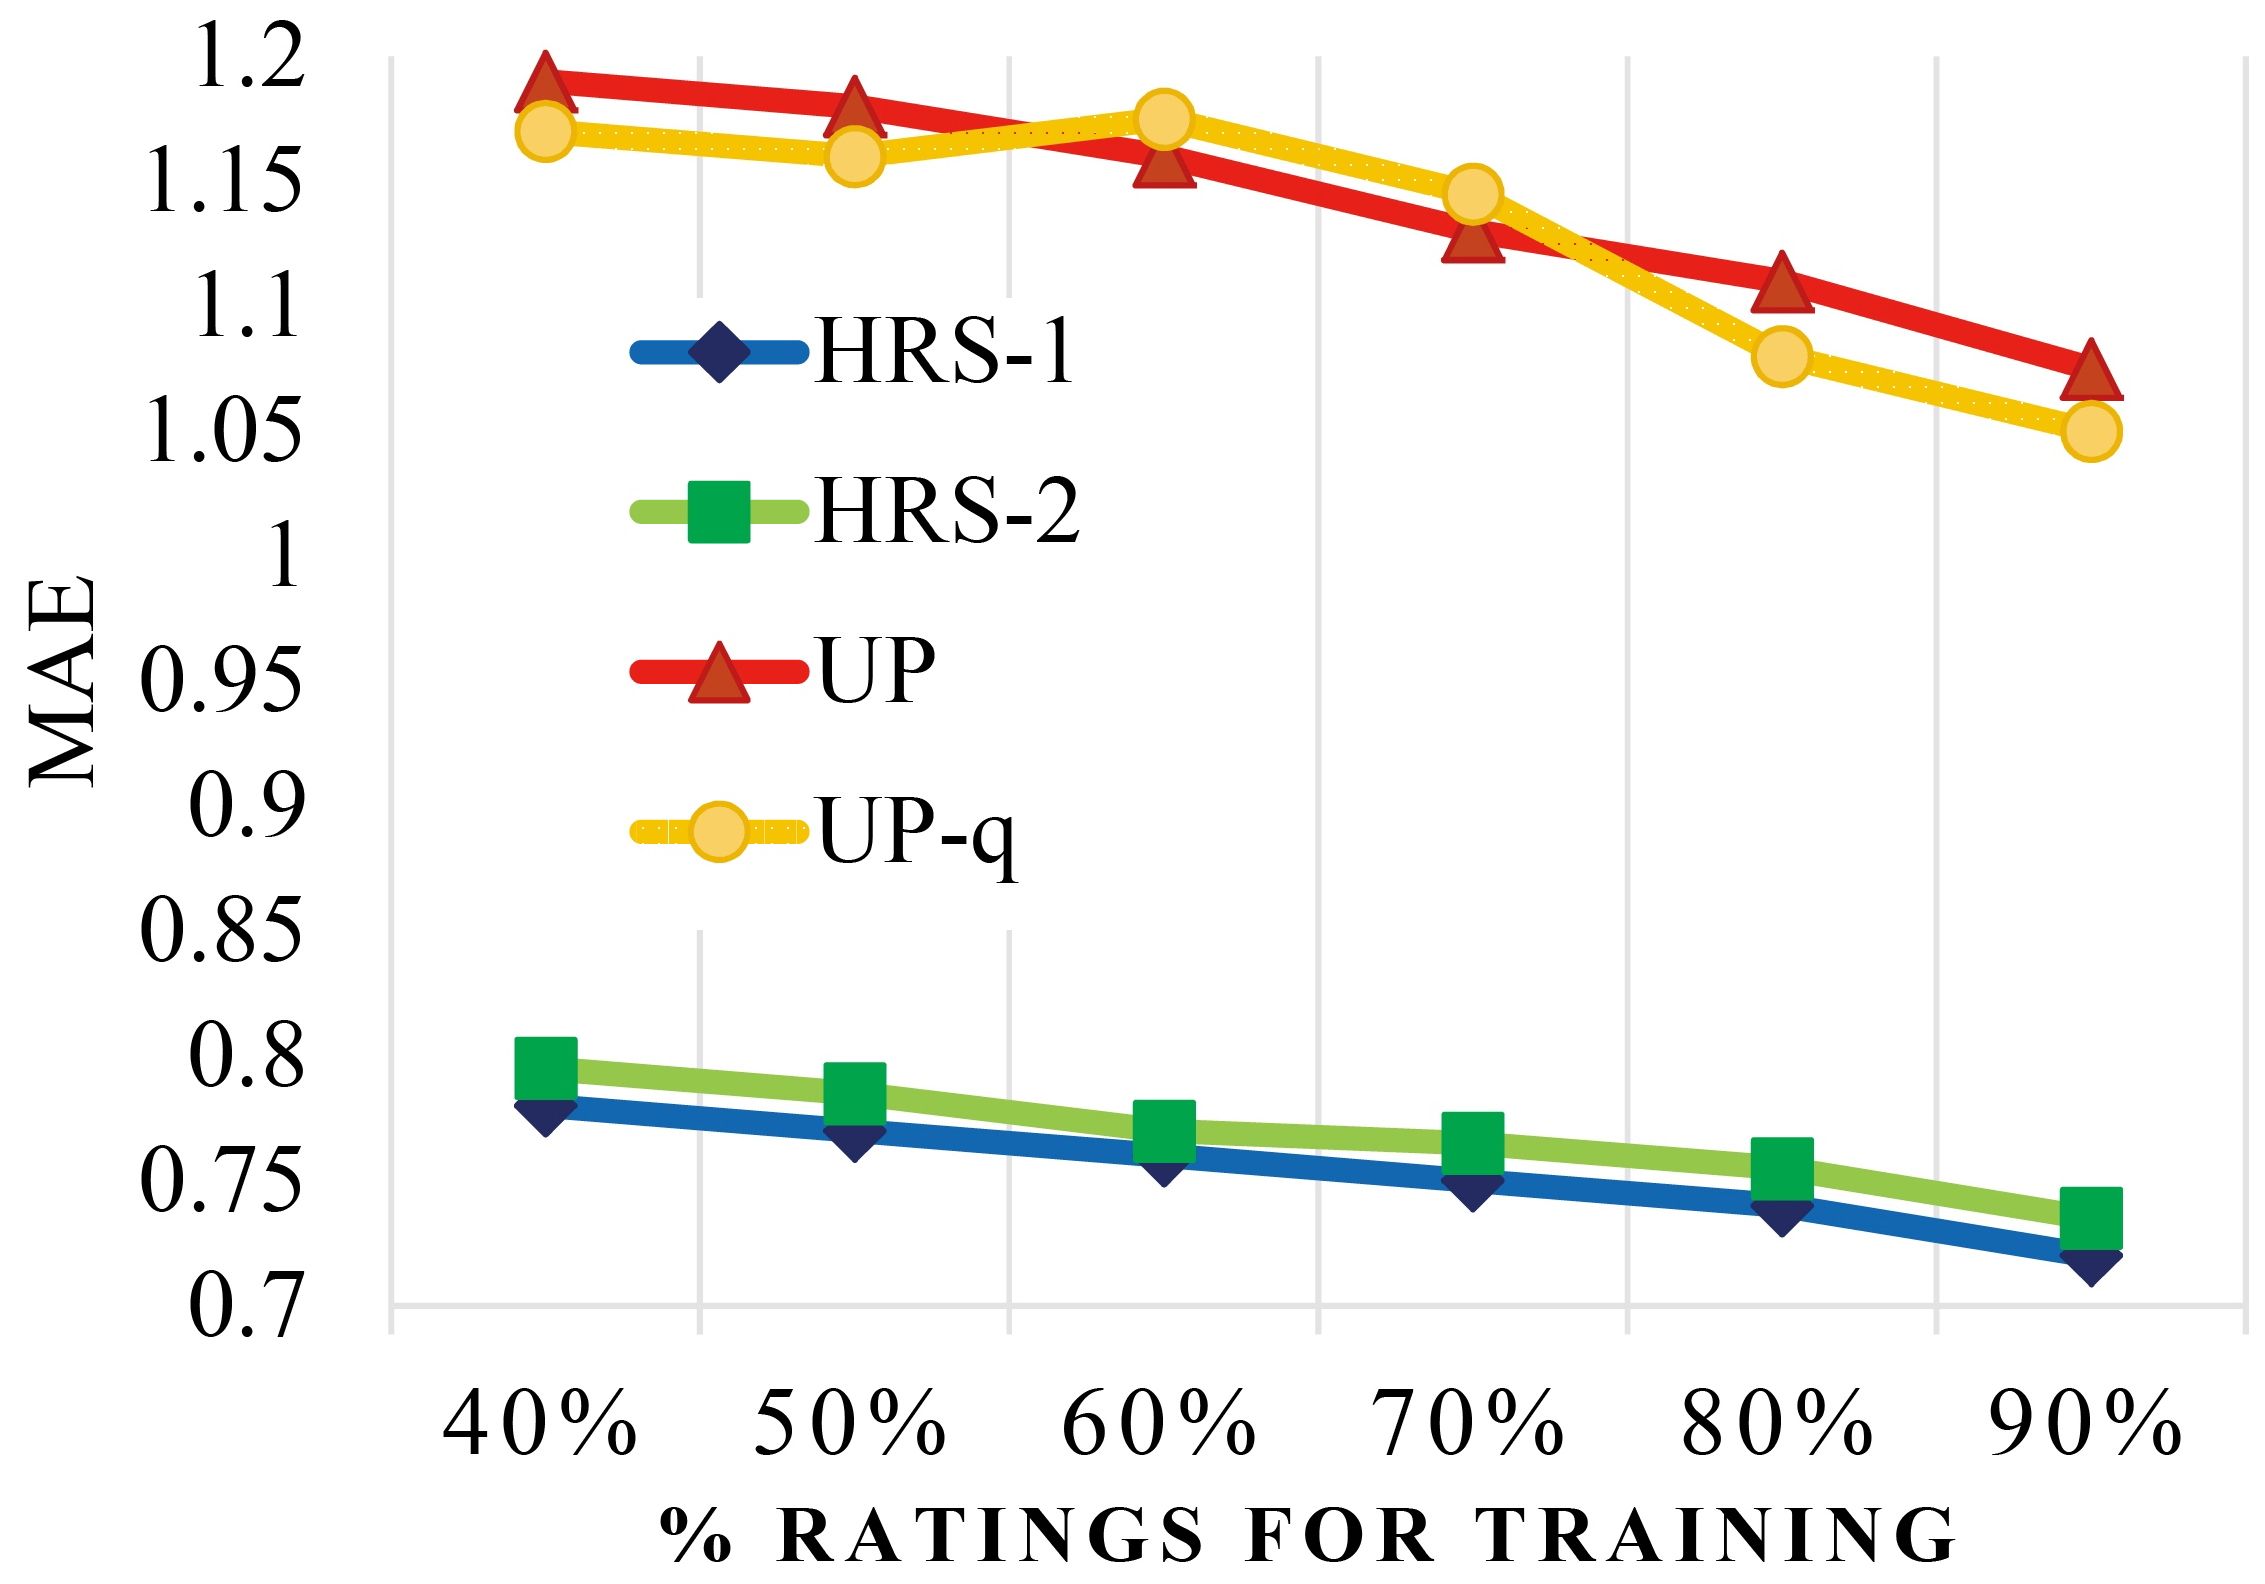
The performance superiority of HRS-1 and HRS-2 with 40%, …, 90% of the available ratings, can be seen in Fig. 13.
In Fig. 14, F-measure for CFP, HRS-1, and HRS-2 with 40%, …, 90% of the training data set is illustrated.
The performance superiority of HRS-1 with 40%, …, 90% of the available ratings, can be seen in Fig. 14.
In Table 6, a comparison of Confidence Weighted Online Collaborative Filtering (CWOCF) approach [35] depends on the same data set with our approach depending on the summary matrix is listed.
Note that as seen in Tables 6 and 7, and Fig. 15, our approach excelled in evaluations of predictive accuracy metrics.
In Fig. 15, a comparison of Up and Up-q approaches [37] depends on MovieLens 1M data set with our approach depends on the summary matrix is illustrated.
In Table 7, The MAE for the top 10 most rated movies based on Latent Neural Network (LNN) approaches [29] and our approaches is listed.
In this paper, we proposed to create a summary matrix that incorporates limited items to alleviate the impact of scalability, sparsity and cold start problems in recommender systems.
The proposed approach increases the rating density, which contributes to solving the aforementioned problems. We use the summary matrix in two hybrid recommender systems and evaluate the results. The results show our summary matrix was helpful in speed, increased the rating density, and got better recommendations. This work suggests several interesting directions for future work. We calculated the likeness between users based on user-user similarity. Item-item similarity may also be tried.
Additionally, we aspired to develop this work to apply it on diverse data sets such as music, books, jokes, and Twitter followers. We would like to conduct a study at a larger scale which would involve feature selection and feature creation.
Footnotes
Acknowledgments
The first author thanks the College of Engineering of Al-Iraqia University and gives special thanks to Mona Mohamed Wafy of Al-Iraqia University. Finally, the author thanks everyone that helped and supported him in bringing this research about.
Appendix-A
In Table A1, the percentage of rating that are given by one user to all items in the training data sets versus the summary matrix is listed. The percentage column of Table A1 shows the rating density. As, it is clearly been increase rating density in the summary matrix contribute to improve the recommendation accuracy.
Number of users versus number of items
HetRec 2011
MovieLens 1M
Training data set
Summary matrix
Training data set
Summary matrix
Ratings
Items
%
Items
%
Items
%
Items
%
1%–10%
9570
93.85
486
61.67
3385
87.17
176
58.47
11%–20%
423
4.148
120
15.22
125
3.21
72
23.92
21%–30%
132
1.29
63
7.99
16
0.41
23
7.64
31%–40%
61
0.59
43
5.45
357
0
11
3.65
41%–50%
11
0.12
28
3.55
9
2.99
51%–60%
22
2.79
6
1.99
61%–70%
10
1.26
1
0.33
71%–80%
9
1.14
1
0.33
81%–90%
5
0.63
2
0.66
91%–100%
2
0.25
Total
10197
788
3883
301
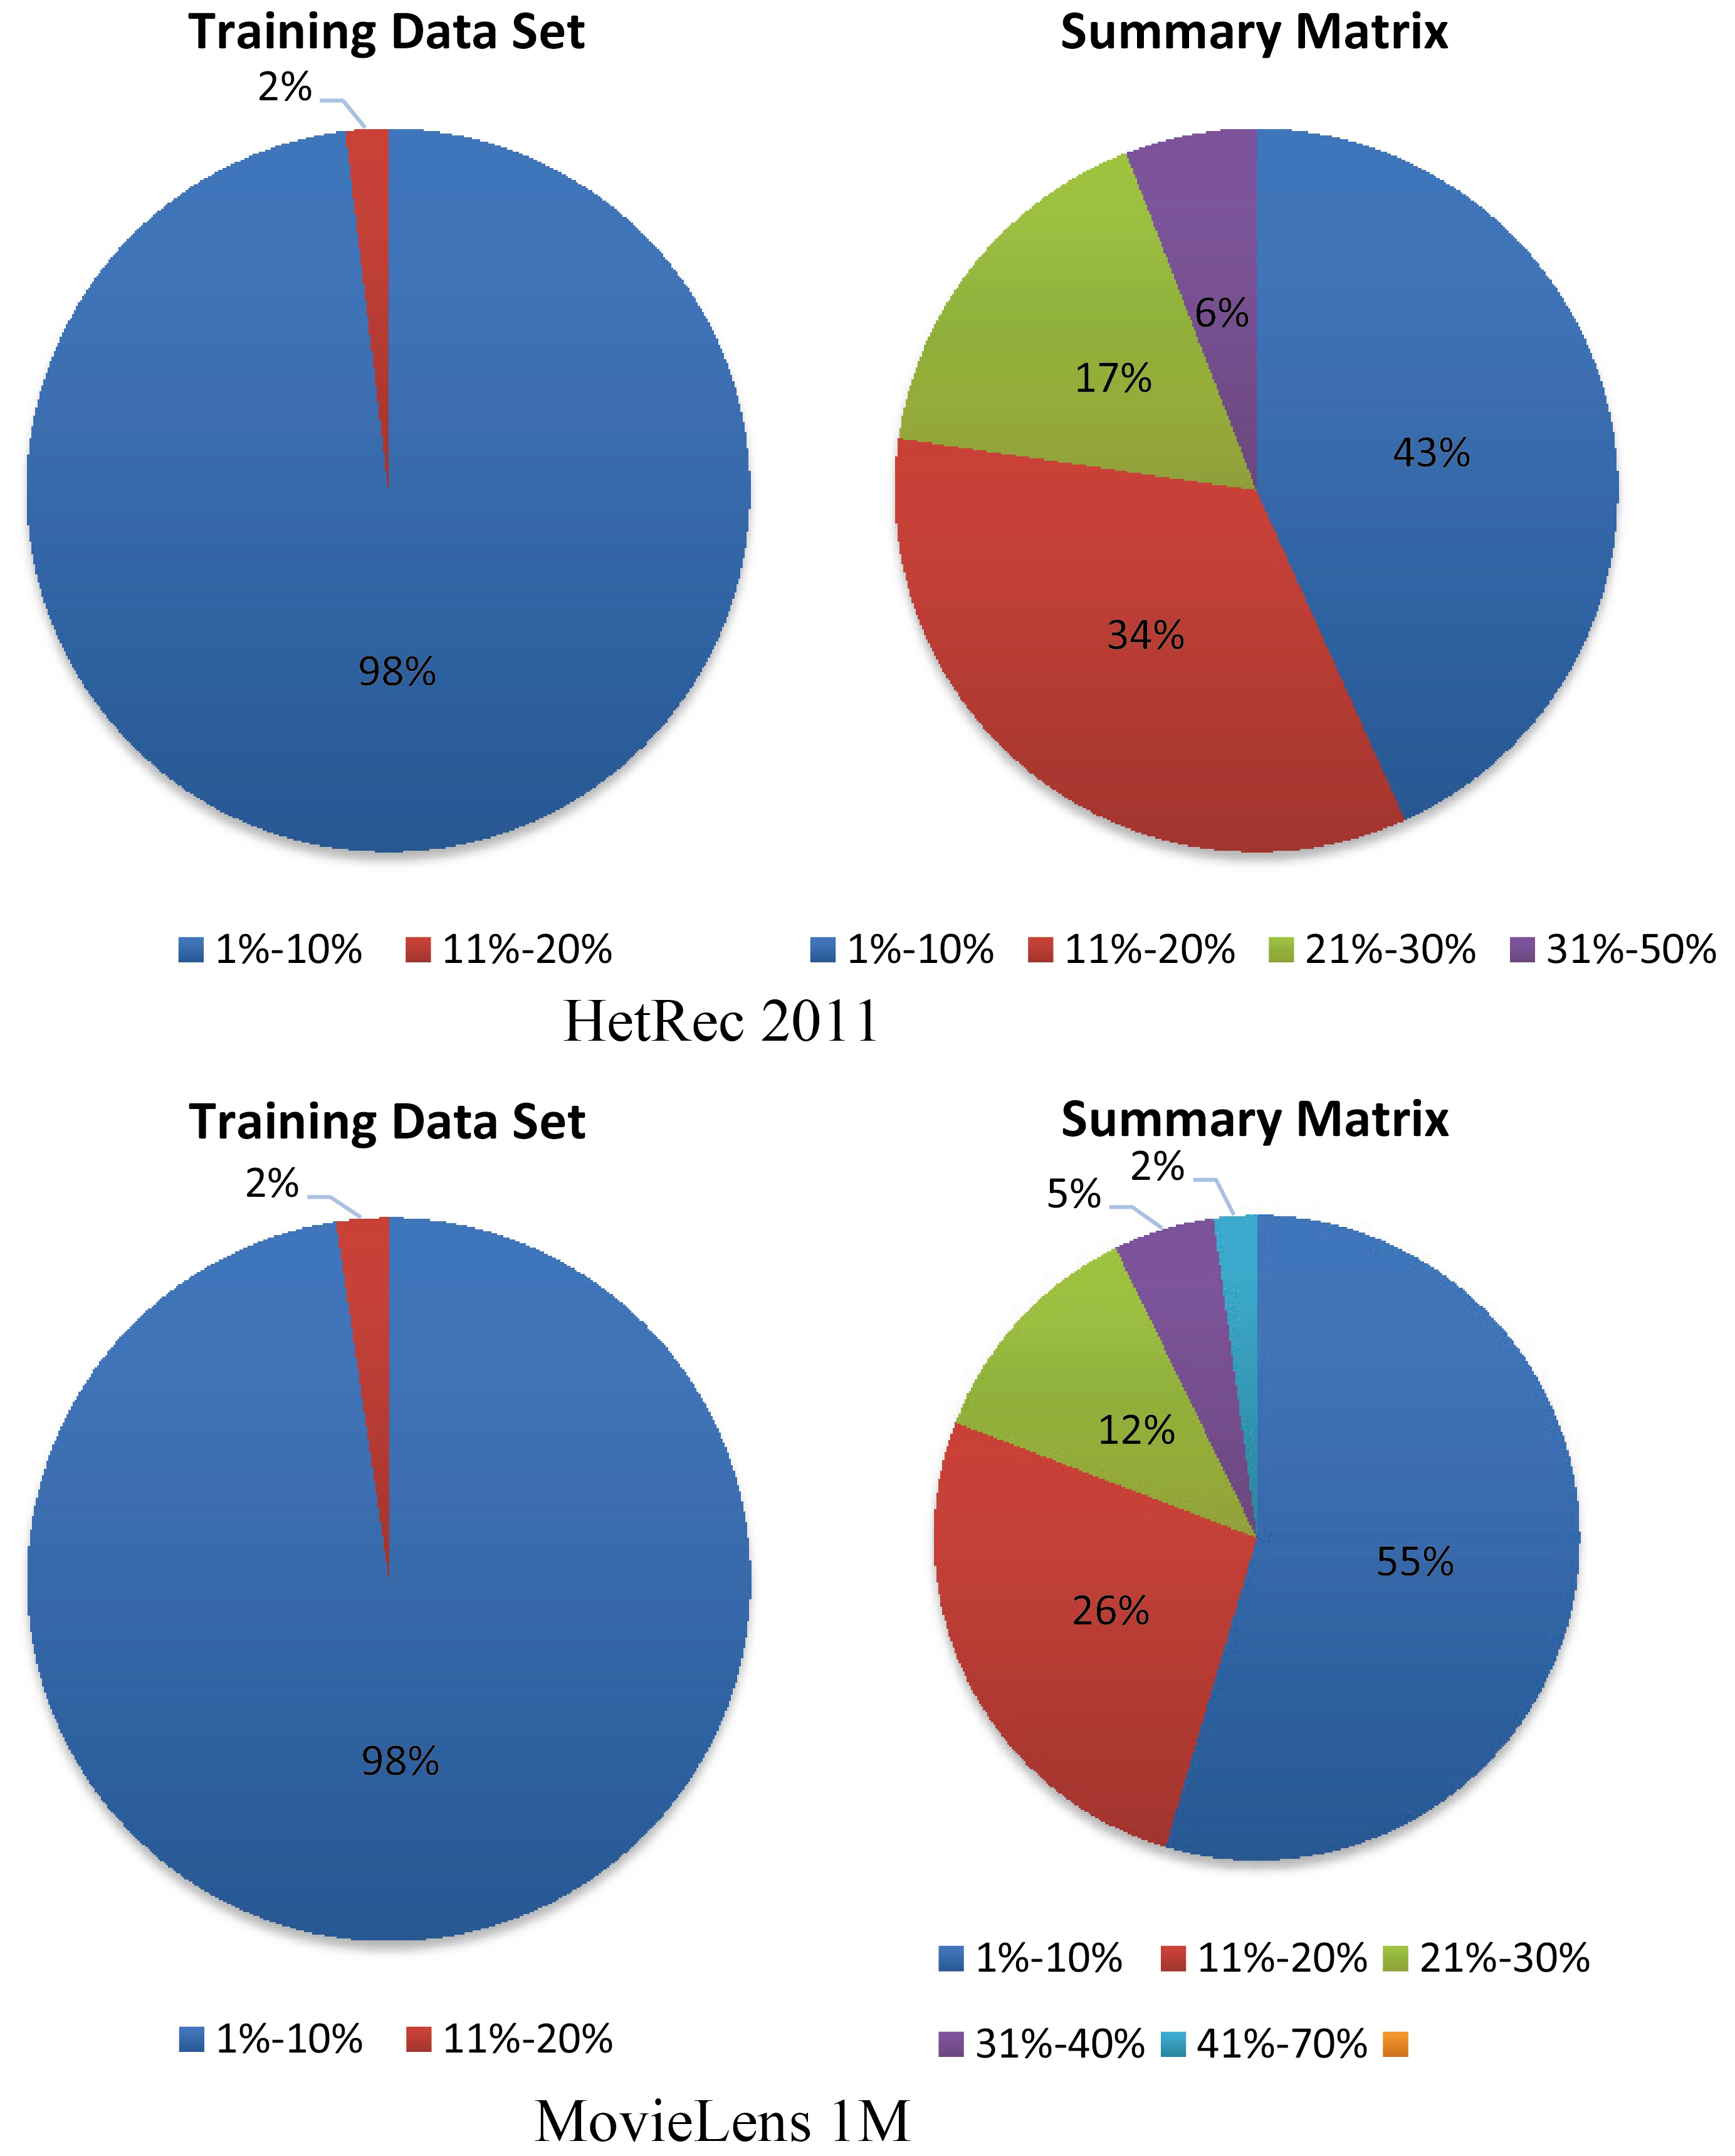
In Table A2, the percentage of rating that are given by all users to one item is listed.
Number of items versus number of users
HetRec 2011
MovieLens 1M
Training data set
Summary matrix
Training data set
Summary matrix
Ratings
Users
%
Users
%
Users
%
Users
%
1%–10%
2073
98.1
914
43.25
5894
97.58
3279
54.29
11%–20%
39
1.84
719
34.03
141
2.34
1577
26.12
21%–30%
1
0.05
356
16.85
4
0.06
719
11.9
31%–40%
111
5.25
1
0.02
305
5.05
41%–50%
13
0.62
129
2.14
51%–60%
26
0.43
61%–70%
5
0.083
71%–80%
81%–90%
91%–100%
Total
2113
2113
6040
6040
In Fig. A1, the percentage of the ratings that are given by one user to all items in the training data sets versus the summary matrix is illustrated.
Note that as seen in Fig. A1, 94%–96% of users rated less than 10% of all items in the training data sets. Also in Fig. A2, we notice that 98% of the items in the training data sets are rated by less than 10% of users. This percentage is very low and reduce the opportunities for getting accurate recommendations.
In Fig. A2, the percentage of the ratings that are given by all users to one item is illustrated.
Note that as seen in Figs A1 and A2, re-distribution of ratings in the summary matrix for users and items. All percentages of ratings increased over 10%. This means more opportunities for getting accurate recommendations for users.
Number of users versus number of items.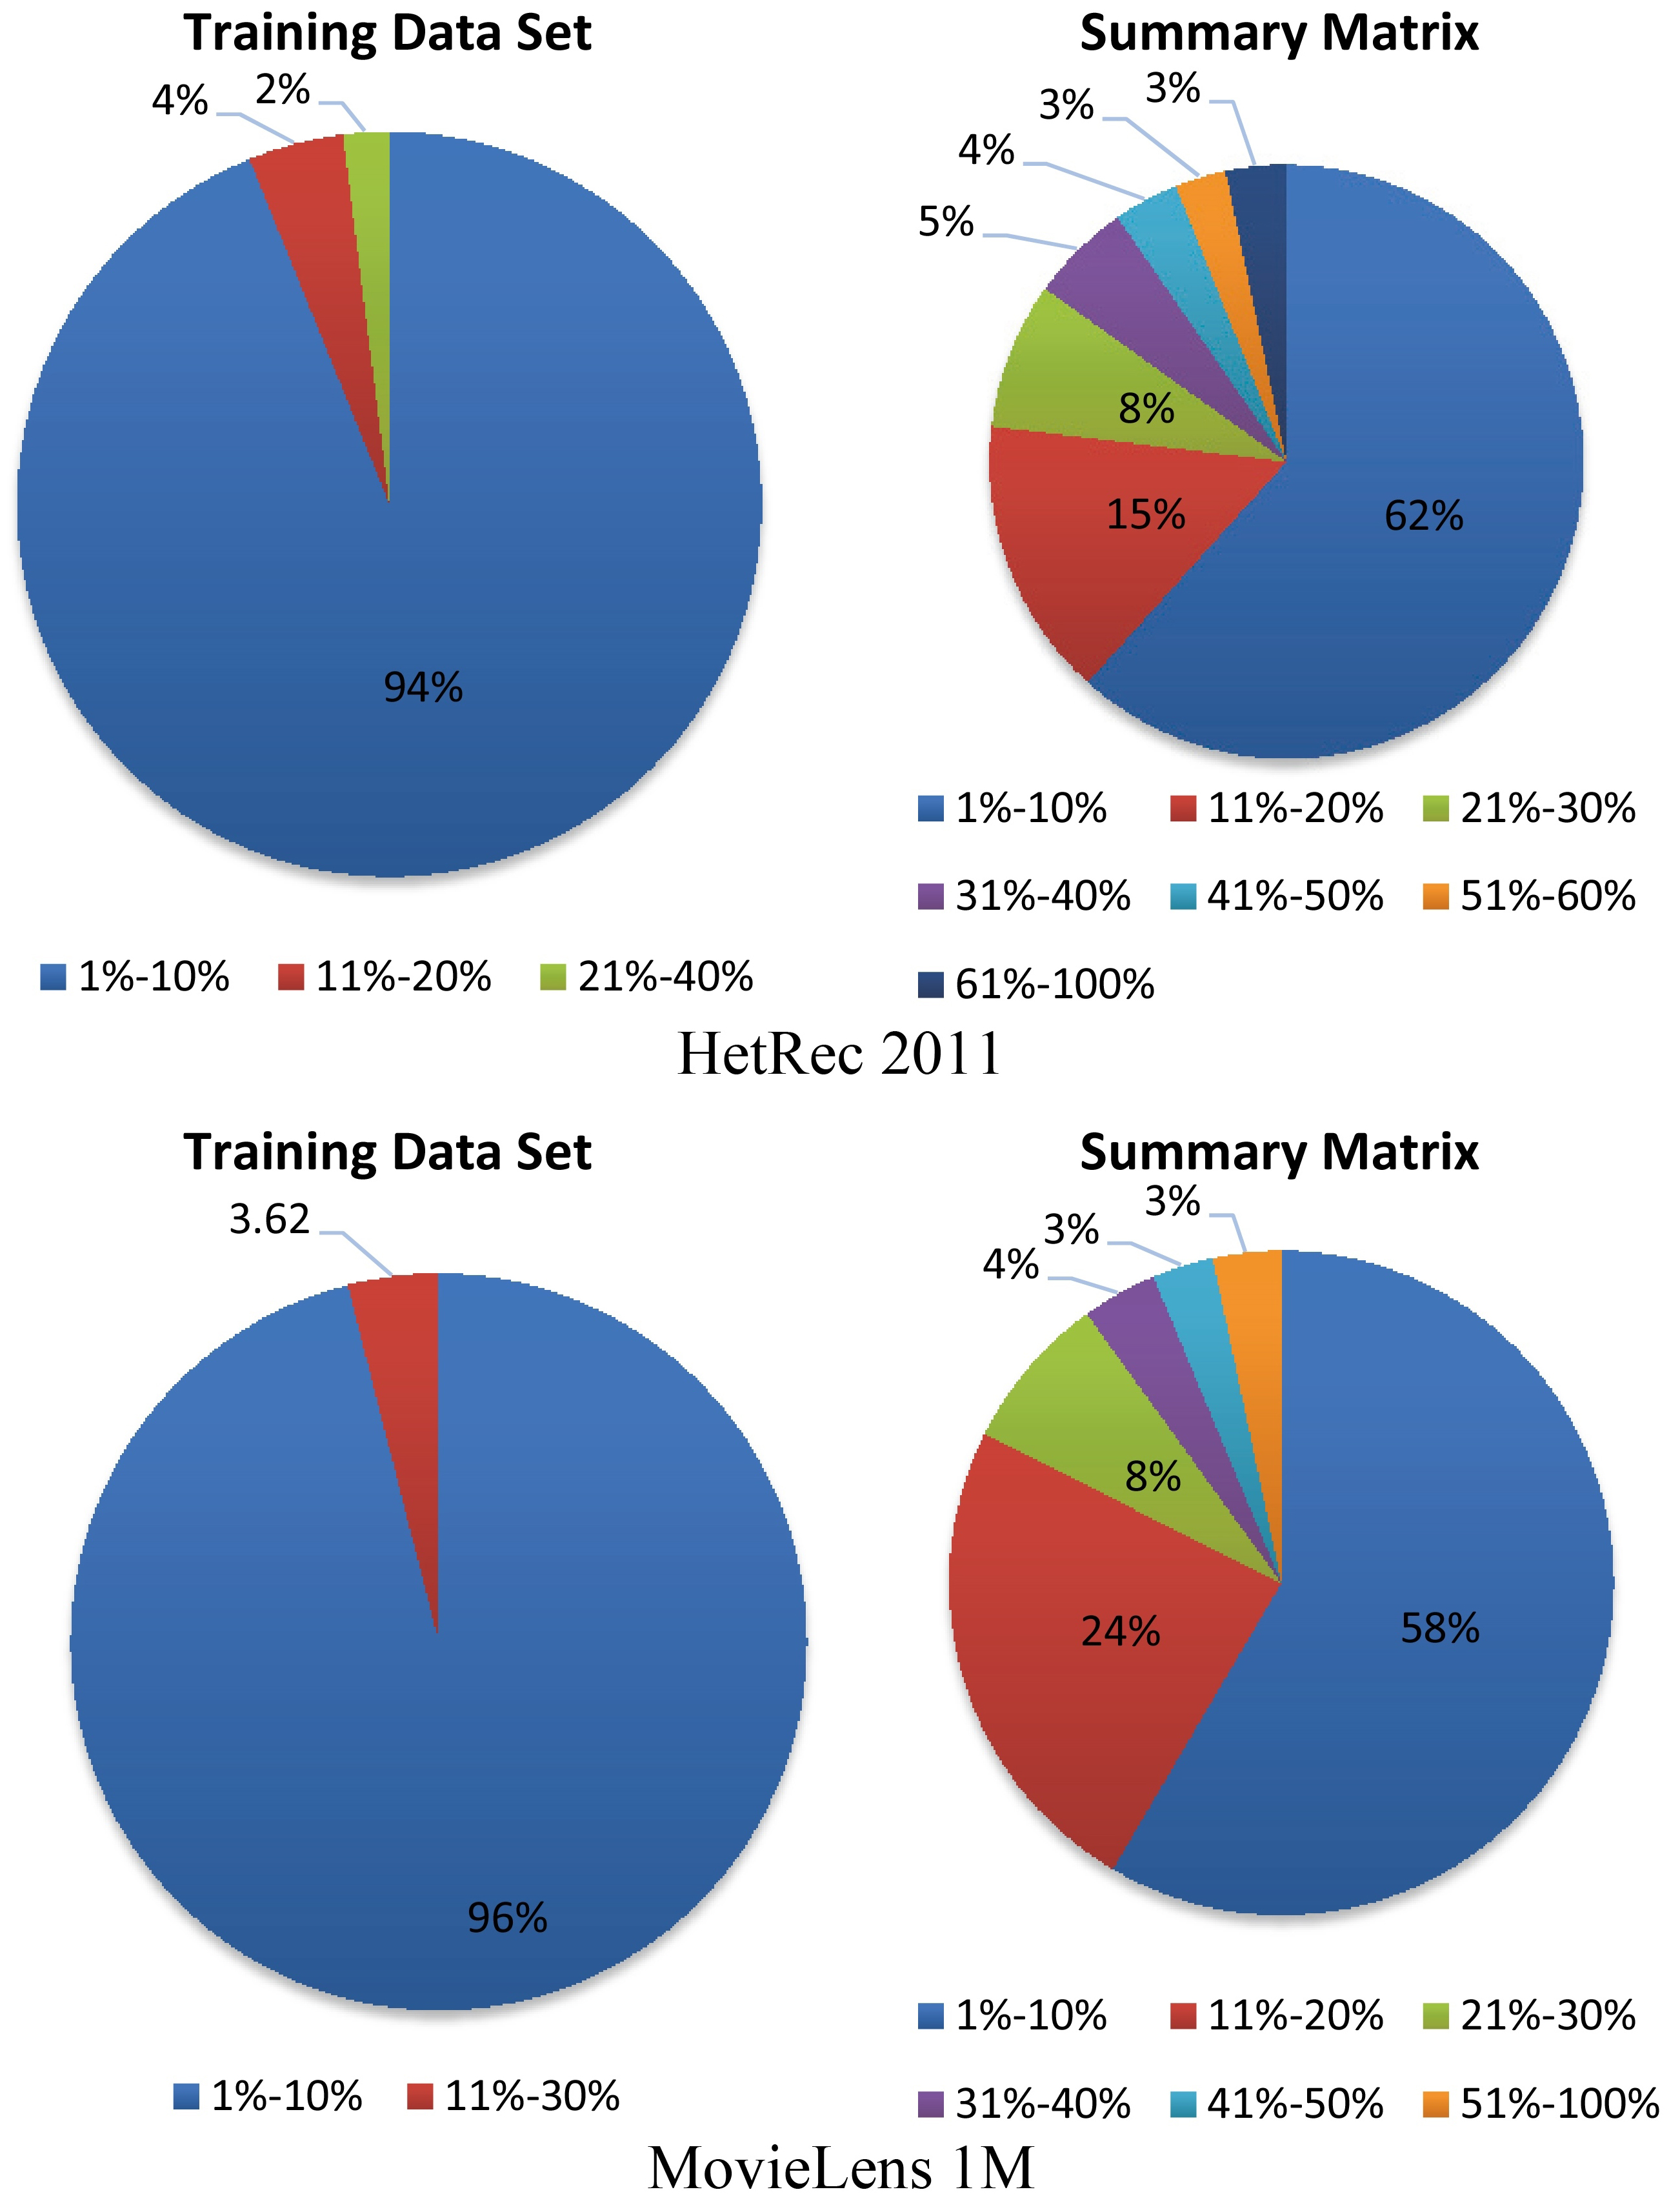
Number of items versus number of users.