
Abstract
In the manuscript, an automatic approach for analysis and detection of various stages of retinopathy defects in human eyes has been proposed. The approach consists of a robust preprocessing technique of the retina fundus image to mitigate the effects of noise and poor lightening in the image. To realize a compressive analysis of the defects, methods for extracting blood vessels and optic disc in the fundus image has also been developed. Adaptive Histogram Equalization (AHE), median filtering and Connected Component Analysis techniques were used in separating blood vessels and optic disc from each fundus image. The pre-processing utilizes canny edge detection and Morphological Closing on the fundus image. An interval type-2 fuzzy (IT2F) clustering is applied to segments an input image into four clusters. These four clusters from the fuzzy segmentation are further analyzed to extract various stages of retinopathy abnormalities (e.g., Hemorrhage, hard exudates etc.). The extracted blood vessels and optic disc are removed from the analysis to enhance the defects detection process. Experiments were conducted on DIARETDB1 database. The experimental results obtained are validated using the ground-truth images contained in DIARETDB1 database. Impressive results are recorded throughout the experiment. Hard-Exudates and Hemorrhage were detected from the fundus images and results from similarity indexes such as, accuracy (94.11%) sensitivity (93.03%) and specificity (98.45%) were recorded.
Keywords
Introduction
In medical imaging, research on automatic diagnosis of eye defects (diabetic retinopathy) from digital fundus images has been active for a very long time. The vast interest vested by researchers in this field is largely due to the prevalence medical needs and urge for new products in the medical industry that will significantly reduce the health care costs and improve diagnosis accuracy. Diabetic retinopathy, sometimes referred to as diabetic eye diseases, presents a serious threat to human sights and potential loss of vision. The process of detection of such abnormalities in the retina is known as diabetic retinopathy and has become quite significant to be carried out at its early stage of manifestation. To detect retinopathy, segmentation, and identification of key tissues such as blood vessels and eye disc are of great importance.
Segmentation of blood vessels are mostly divided into two techniques, namely: rule-based and pattern recognition-based techniques [1]. According to [2, 3], rule-based techniques mainly include matched-filtering technique, tracking of vessel, morphological operations, multi-scale methods and model-based methods. Techniques based on Pattern Recognition (PR) are subdivided into two namely: supervised and unsupervised techniques. Both methods require clustering and classification processes. In supervised approach a labeled training data with ground-truth images are required and after clustering each pixel can be identified and grouped into pixel vessels or non-pixel vessels. On the contrary of the case of supervised method, in the unsupervised method, no previous labelled training data are needed. Both methods (supervised and unsupervised) involve clustering techniques, that divides the data into groups of clusters [4].
The labeled training and testing data are mainly the basis of supervised techniques. The method categorizes pixels into two groups as vessel pixel or non-vessel by deploying the training data of the labeled sample images. Supervised techniques are identified with higher precision scores for well labeled and annotated dataset and are seriously affected for a poorly curated dataset. On the other hand, supervised techniques are considerably susceptible to false edges [4].
Roy Chowdhury et al. [5] proposed a three-level retinal blood vessel segmentation algorithm. The first, a threshold binary image is obtained using HPF and the other binary threshold image is gotten by top-hat reconstruction of the red fields in a green plane image. Thereafter, the common region from both binary images is extracted and merged. The classification process is obtained from the image after merging. All pixels that are classified as vessels are merged with dominant vessels to obtain the vascular structure. Furthermore, improving the image is done using post-processing methods. The major vessels and the fine vessels are accurately segmented using the suggested technique. It has low dependency on the trained-data and contain less calculations.
Hassanien et al. [2, 3] proposed fuzzy cluster fitness function, together with artificial optimization of bee colony technique to identify and extract the thickness of blood vessels. The approach utilizes two different stages in the formation of clusters. For the first clustering, optimization techniques based on artificial bee algorithm which was implemented with the aim of extracting blood vessels. The authors used Fuzzy C-Means (FCM) and the objective function. The next phase significantly improves the location of cluster centers by utilizing local search to extract blood vessels with a thinner and well as small in diameter.
Emary et al. [4], applied possibilistic FCM clustering technique on the classical FCM objective function. For an improved result, a search technique based on cuckoo search was applied. This search method was used purposely to optimized possibilistic FCM clustering method. Finally, results were obtained by implementing the approach on a DRIVE dataset. It was claimed to have been capable of detecting abnormalities such as hemorrhages, exudates, and changes in epithelium pigment.
Franklin et al. [6] suggested a technique based on blood vessels recognition in retinal images by using a multi-layer perceptron neural network. The method derived input from the basis three-color channels. Despite some success recorded their approaches, the problem is far from being solved due to some drawbacks such as low performances of the proposed approaches, complexity in implementation and overall lack of comprehensiveness.
Authors in [7] a proposed a method for Diabetes Classification using type-2 fuzzy inference systems with better parameter designs based on genetic algorithm. The optimized the parameter values of Type-2 Trapezoidal membership functions and the type of model (Mamdani or Sugeno) with genetic optimization techniques. Results using their techniques was compared with type-1 fuzzy systems on PIMA Indian Diabetes. An improved performance was reported.
There are several variants of fuzzy clustering algorithms such fuzzy c-means (FCM), possibilistic c-means (PCM) and fuzzy possibilistic c-means FPCM have been reported in the literature and used in many applications requiring clustering and classification such as Diabetic retinopathy [4, 8]. However, for better handling of uncertainty within the dataset an improvement of such techniques is required [9]. The is achieved through application of Type-2 Fuzzy Logic techniques to baselines (FCM and PCM), which produces Interval Type-2 Fuzzy C-means (IT2FCM) and Interval Type-2 Possibilistic C-Means (IT2PFCM) [8]. In recent times extension of other baseline clustering algorithms (PCM and FPCM) using Type-2 Fuzzy Logic techniques were also proposed [8]. Similarly, researchers on Diabetic retinopathy are also emerging using deep convolutional neural network (DCNN) learning. Authors in [10], proposed a method Diabetic Retinopathy Classification based on convolutional neural networks and Hierarchical Genetic Optimization. The used several pre-processing with a hierarchical genetic algorithm (HGA) with the pre-processing method to obtain higher classification accuracy using CNN model.
In this manuscript, an automatic process for extraction and detection of various stages (e.g., hard exudate and [2] Micro aneurysms and hemorrhage) of eye diabetic retinopathy has been proposed. The proposed techniques implemented a variant fuzzy-type 2 clustering (Interval Type-2 fuzzy IT2FCM) for anomaly extraction in fundus image. Prior to IT2FCM clustering an effective technique for blood vessels and optic disc segmentation was as so proposed. The method includes extractions of the blood vessels and optic disc from the fundus image. Using results from interval type-2 fuzzy (IT2FCM) clustering, various categories of retinopathy were analyzed and detected. The major contributions of the are as follows:
Proposed an efficient and effective techniques for blood vessels and optic disc segmentation via adaptation of computationally efficient, existing image processing techniques. Proposed a method for exudates region extraction and eventual detection of retinopathy using background subtraction and adaptation of IT2FCM.
The article is organized into sections as follows: Section 1 contains introduction with review of literature, Section 2 presents some theoretical background and motivation of the algorithms used. In Section 3, proposed approach is presented while Sections 4 and 5 contain experimental results and discussion and Section 6 presents the conclusion.
Theoretical background and motivation
The motivation of this research is to performs both feature extraction (extraction of blood vessels, optical disc, exudates etc.) and classification of the retinopathy diseases using computationally efficient image processing techniques that would produce an acceptable and competitive performance levels with other available techniques. For instance, the choice of IT2FCM over other variants is due to its capacity to handle uncertainty and noise in the data with less computation. Under this section several algorithms relevant to the proposed approach are discussed in summary.
Fuzzy c-means (FCM)
Fuzzy clustering techniques is a kind of soft decision classification approach whereby a data point is allowed the flexibility of belonging to more than one classes with different degrees of membership to each data class or cluster. It is essentially a kind of unsupervised learning algorithm and one of the well-known variants of this algorithm is fuzzy c-means (FCM) clustering [11].
Consider a dataset
The objective of the fuzzy c-means is partitioning the data points into
Whereby the term
The membership function matrix
Where
The center of each cluster is also updated at each iteration as given by Eq. (5).
The membership matrix and the clusters centers are continuously updated as the objective function is minimized through the iterative means.
Interval Type-2 Fuzzy (IT2FCM) is basically an extension of FCM clustering by applying Type-2 Fuzzy techniques. IT2FCM is capable of modelling uncertainties using what is referred as Footprint of Uncertainty (FOU), where such uncertainties cannot be modeled by type-1 fuzzy sets. It uses two fuzziness parameters
Where
As a result of each pattern or data point has two membership functions
The Connected Component Analysis (CCA) is an image processing technique that has useful applications in many fields. It is applicable to different format of image being grey, colored, or binary [13, 14]. The algorithm begins with a scan for the entirety of the image on a pixel-by-pixel operation from the top leftist pixel of an image to the bottom pixel on the furthest right corner of an image. In the process all, neighboring pixels found to have shared same designated intensities are marked as a single connected object. Each marked connected pixel possess a unique label in the output image. For instance, in binary images, only pixels with intensity value equals to logical ‘1’ are designated as an object whereas those with logical ‘0’ as intensity values are marked as non-object pixels. For grayscale images range of intensity value is used (i.e., 0–50, 60–80) to designate an object pixel if its intensity falls within the predetermined range otherwise is labelled as non-object. A slight alteration to the described approach is used when CCA operates in a color-space images (i.e., RGB). The algorithm operates on basically two different level of connectivity windows within the neighborhood of the center pixel (i.e., 4 and 8 connectivity). Figure 1 shows an example of CCA algorithm on a binary image with 4-neighborhood connectivity to extract Binary Large Objects (BLOBs)
4-Neighborhood connectivity operator.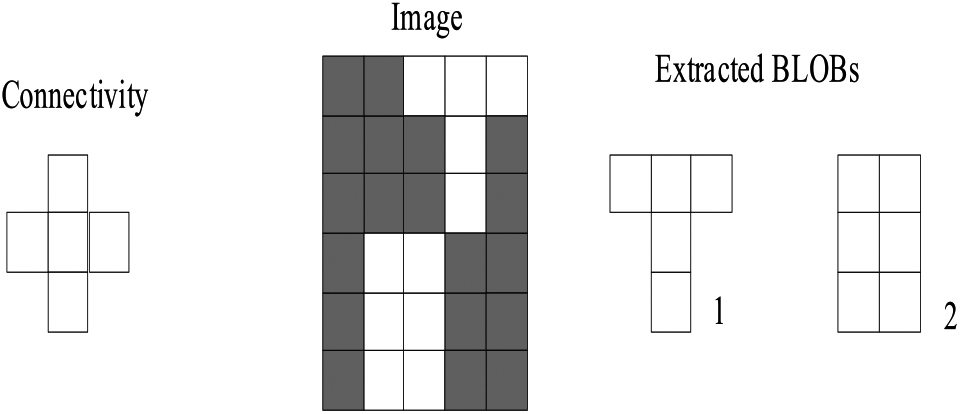
For every marked object during the operation, it is treated as a unique BLOB and with its labeled values and corresponding indices. For each object in the CCA vector, numerous geometrical features are computed. These features include the area, perimeter, centroid, eccentricity and so on for each object which vital for different analysis.
Morphological operation, in the context of computer vision, refers to the operation carried out in two dimensional (2D) spatial domains of an image to describe the properties, shapes and area of objects on the image plane. The operation becomes useful in the processing task of a set of points to reveal vital features of an object. The set of points in the image spatial domain represents an object. Four major morphological operators include dilation, erosion, opening and closing. While dilation increases the size of the image, erosion thins the image. Morphological opening and closing are compound operators which allow to fill an inner hole or help in getting rid of a small fragment on the image, respectively [13, 14]. The two major inputs to the morphological operators are the input image and, a specially created image called, Structural Element (SE). The choice of the SE is arbitrarily and mostly depending on the type and the nature of the operation intended. In most instances, SE is much smaller than the processed image since it is a form of area description of sets of binary points (object) within the image plane [13, 14].
Canny edge detection
Canny Edge Detection operators is one of the most prominent and effective edge detection operators proposed in [15]. The operator uses five basic steps in detecting edges in image: (1) Preprocessing where Gaussian filter is used to smoothen and remove noise from the image, (2) Compute the intensity gradients of the image, (3) Non-maximum suppression approach which is to remove spurious response to edge detection, (4) Double threshold is use to determine potential edges in the image and (5) Detect edges using Hysteresis by dropping all edges that are weak and have no connection to strong edges [15, 16, 17, 18].
Flowchart of the proposed algorithm.
There are basically three fundamental parts in the proposed approach which includes (a) extraction of features (b) retinopathy defects detection (c) classification of stages and evaluation. The feature extraction encompasses the segmentation of blood vessels, optic disc. They provide a comprehensive result, so the subsequences analysis is made easier. The proposed approach starts with the input RGB fundus image and extracting green channels. This followed with features extraction to segment regions of blood vessel and optic disc. Th segmented blood vessels and optic disc were utilized with background subtraction techniques and IT2FCM clusters to identify a stage in retinopathy. The second stage of the proposed approach applies a sequence of preprocessing (median filtering, gamma-transformation, canny edge detection and morphological operation) to enhance the image quality. IT2FCM is then applied on the enhanced image to group it into four clusters. The choice of the number of clusters 4 is based on the experimental trials with different clusters numbers like 2, 6 and 8 but the results were not as good as with 4. The final stage is exudate detection. Figure 2 provides the overview of the proposed method and the intermediary results.
Features extraction
The feature extraction includes blood vessel segmentation and optic disc segmentation and finally the IT2FCM for getting best clusters. The entire process was carried out on a public database DIARETDB1. The DIARETDB1 database consists of 89 color fundus images. Out of these images 84 of them consist of a minimum of one mild non-proliferative signs of the diabetic retinopathy. In accordance with the experts involved in the evaluation process, 5 of the images are considered normal without any signs of the diabetic retinopathy [19].
Blood vessel segmentation
Blood vessels segmentation is one of the fundamental aspects of automatic retinal image analysis. Even though some attributes of the blood vessels like branching patterns and vessels width play important role in diagnosis, moreover it’s also useful that when removed from the retinal image, it enables better analysis of retinal defects that occurs in a non-blood vessels portion.
To extract the blood vessels, series of image processing techniques were applied. Firstly, the RGB colored fundus image is separated into three channels (R, G and B). Green channel is used due to its higher information contents compared to others. A median filter is applied to the G-channel to smoothen it. This operation is being followed with Adaptive Histogram Equalization (AHE) [20]. AHE ensures that the contrast within the retinal fundus images are adjusted and suppresses some of the inherent uneven lightning during the acquisition of the image as shown in Fig. 3d.
Pre-processing. (a) original fundus image (b) Green-Channel of Fundus image (c) Histogram of G-Channel (d) AHE of G-channel (e) Histogram of (d).
The next stage is to estimate the background information including the optic disc from the contrast-adjusted image (Fig. 3d). Morphological opening operation is applied to the compliment version (negative) of the input image (Fig. 3d) using a structural element of ‘ball’ type since the aim is to initially remove the optic disc region and then the background from the input image. The output of this operation is subtracted from the inverse of image (Fig. 3d) to give a mask image with optic disc removed. Thereafter, background information is obtained by firstly applying median filter to the mask image to further suppress noise. secondly morphological opening used with a structural element of ‘disk’ shape and a bigger radius than in the previous operation. Since the output of these two operations estimates the background information of the image, the background image is removed from the output of the median filter image which leaves behind an image whose foreground contains the blood vessels and some noises. This estimate is adjusted and eventually converted to binary image (Fig. 4a). This estimate of the blood vessels come with noise which can easily be removed. The method used here to remove this noise is using CCA. Initially all the BLOB objects areas within the image are identified and then any BLOB whose area is less than 2% of the larges BLOB within the image is revived. This operation gives the noise-free blood vessels in Fig. 4b.
Blood vessels. (a) noisy blood vessels (b) noise-free blood vessels.
The optic disc represents the optic nerve head, and it is the brightest region in the retinal fundus image where blood vessels converge. Locating Optic disc becomes paramount because it provides useful information in identification of defects in the fundus image. To achieve that, the estimate of the optic disc determined during the blood vessels segmentation is used. It is obtained by applying morphological operation to the compliment of image in (Fig. 3d) using a structural element of ‘ball’ type (Fig. 5a). The contrast of this image is adjusted which results in the image in Fig. 5b. The optic disc region becomes much distinct in the low intensity regions, a hard decision thresholding is applied to remove all pixels of higher intensity magnitude greater than 50. The hard thresholding results in the output image in Fig. 5c. The final stage is to remove some noise using CCA in a similar way to blood vessels extraction. The only difference here is that areas and centroids of each BLOB object is estimated and two area thresholds (upper
Optic disc. (a) optic disc estimate (b) intensity adjusted optic disc estimate (c) noisy optic disc (d) extracted optic disc with drawn ellipse.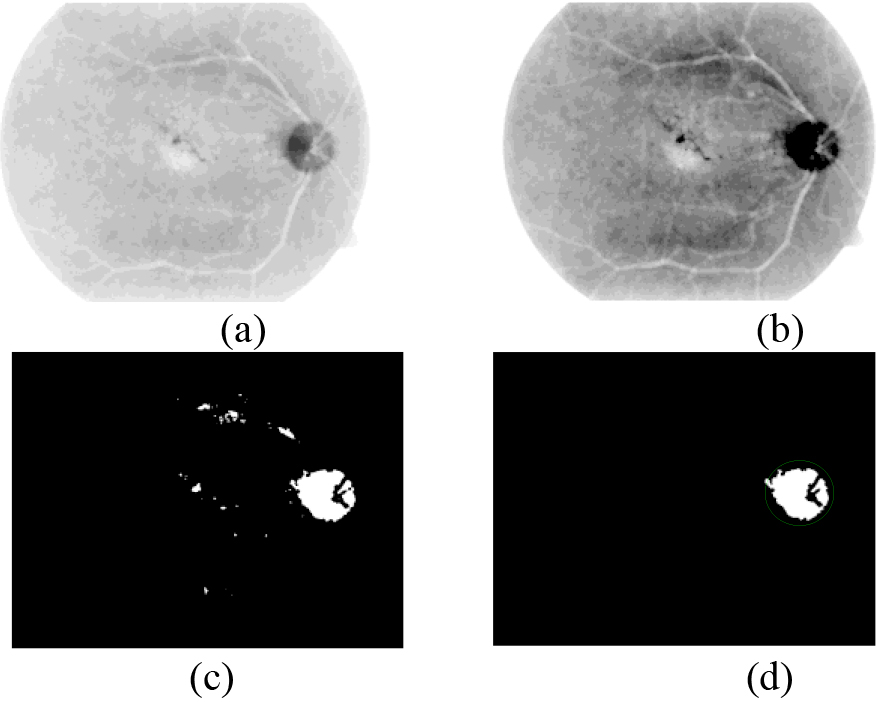
In the clustering stage a further preprocessing is applied. Median filtering is applied to the green channel (Fig. 3b) to reduce the effect of noise. To mitigate the effect of poor contrast in the image. Power Law (Gamma) transformation which is a pixel-wise operation is used to transform the intensity of a particular pixel based on the Power Law (Gamma) transformation equation in Eq. (10).
Where
It is interesting to note that the four clusters have all the important features associated to the retinopathy diseases and they all share correlations among themselves. For example, the cluster number 4 contains all the blood vessels in the original fundus image. Similarly, cluster 4 is exact compliment of the summation of the remaining 3 clusters. Therefore, most of the detection and classification of the various stages in retinopathy are drawn from these clusters.
Clusters segmentation using Interval Type-2 fuzzy (IT2FCM).
These are lipid parts of the retina defects which are yellowish and bright. To extract Exudates from the cluster results, all the features extracted from a particular image are considered (i.e., Optic disc, Blood Vessels and IT2FCM clusters). For exudate detection experimental results from IT2FCM reveals that always all the information related to region containing exudates are found in Cluster 1 group (Fig. 7c). Hence only Cluster 1 group are considered from the 4 groups extracted using IT2FCM. It is also noted that additional information found in the Cluster 1 group are traces of either Optic Disc or Blood vessels. Therefore, Exudates detection is now reduced to removal of any trace of blood vessels or optic disc from the cluster 1 group (Fig. 7a–d). This is realized by subtracting both the blood vessel (Fig. 7a) and optic disc (Fig. 7b) from the cluster using logical AND gate operation. The operation resulted in the detection of exudates in Fig. 7d. It is also worth noting that the blooded vessels are dilated a bit before being used to ensure effective removal of any trace of vessels in the cluster.
Exudates detection. (a) extracted optic disc (b) extracted blood vessels (c) IT2FCM cluster 1 result (b) detected exudate using background subtraction.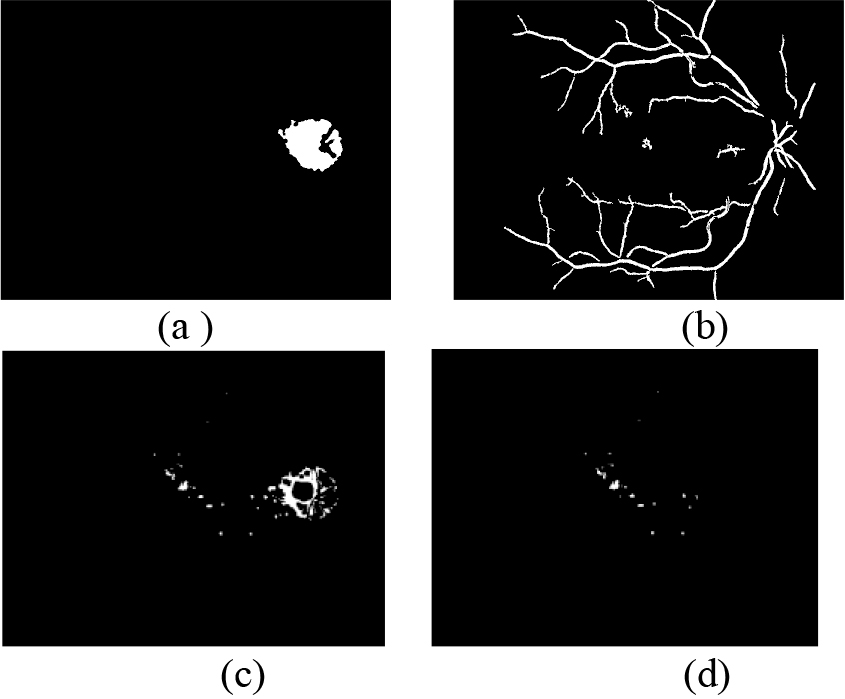
The entire process was carried out on a public database DIARETDB1. The DIARETDB1 database consists of 89 color fundus images. Out of these images 84 of them consist of a minimum of one mild non-proliferative signs of the diabetic retinopathy. In accordance with the experts involved in the evaluation process, 5 of the images are considered normal without any signs of the diabetic retinopathy [19].
The images were taken in the Kuopio university hospital. The images were selected by the medical experts, but their distribution does not correspond to any typical population. During the experiments all sample fundus images were used in accordance with the proposed procedures to finally obtain four clusters for each sample fundus image. The evaluation of the results is based on the stages of the diabetic retinopathy developments (e.g., micro-aneurysms, hemorrhage, exudates, etc.). Since the ground-truth results are supplied in the database [19], these ground-truth images are used to compute the accuracy of the proposed method.
Evaluation
To evaluate our findings of the proposed approach, some standard evaluations procedures were adopted. Initial six different similarity indexes were used to compare the detected abnormalities with the ground-truth images in the database. The similarity measures deployed includes Sensitivity, SpecifityAccuracy [19], Dice index [21], Jaccard index [22] and Structural Similarity (SSIM) index [23] and Positive Prediction Value (PPV) [24]. The indexes were computed both at image level and the overall database. On the other hands a similar comparison was made between the results obtained using the proposed method and other state-of-the-arts algorithms in the literature with similar work. The original ground-truth images in DIARETDB1 database supplied come with annotation marks made by the medical expert on them. These annotations are firstly removed before comparison is drawn. Figure 8 presents a sample of annotated ground-truth image containing hard-exudate defects.
Annotated ground-truth hard exudates image.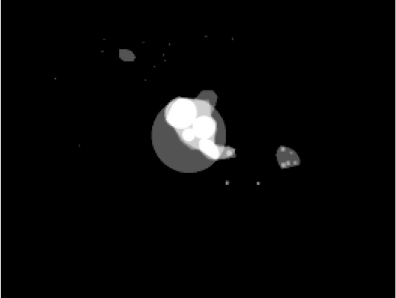
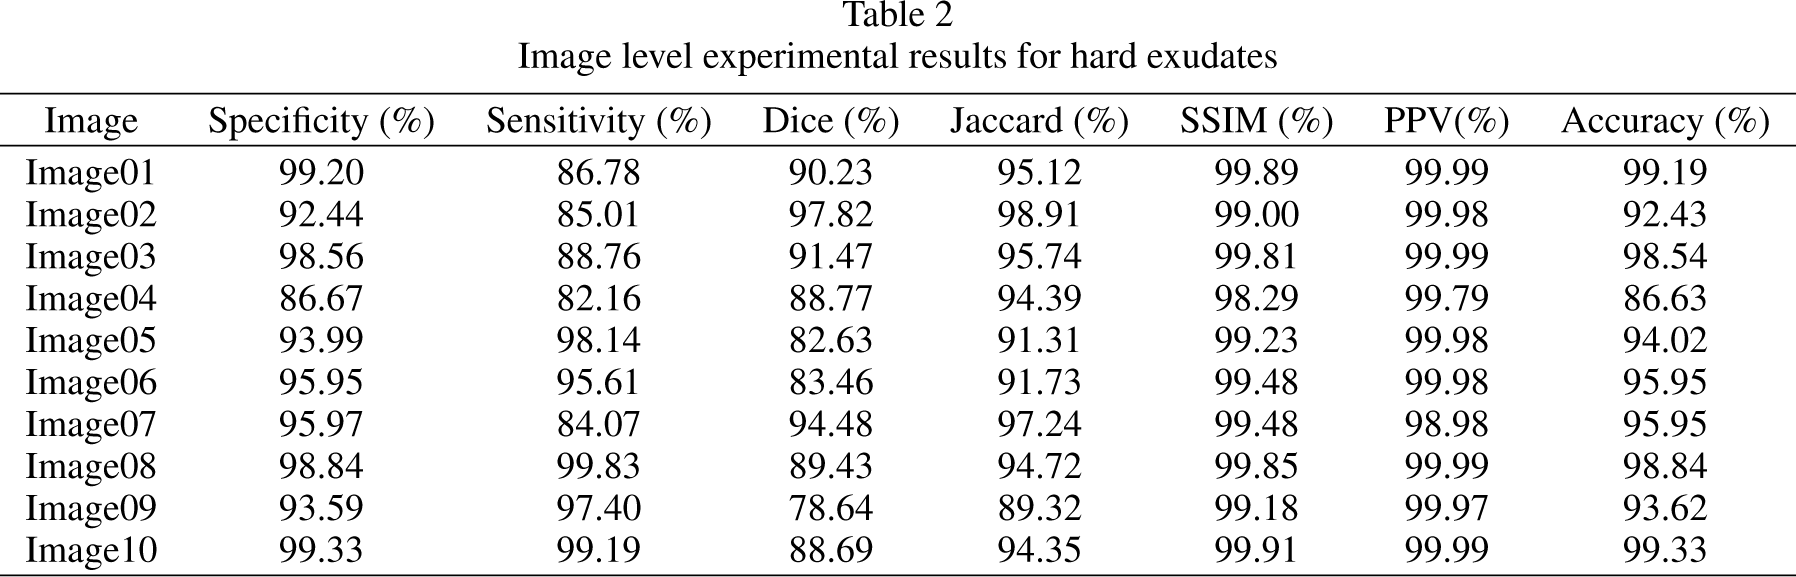
In Table 1 experimental constants used during the experiments are tabulated where Table 2 present experimental results of exudates detection in some of the images from the database (in Fig. 9). In Table 3, we provided comparison between the proposed method and the results obtained by other authors in the literature.
Experimental constants

Image level experimental results for hard exudates
Samples fundus images from the database whose results are presented. The first row is the original fundus images, second row is the groundtruth responding images results, the third row is our target and the final row is our responding results images.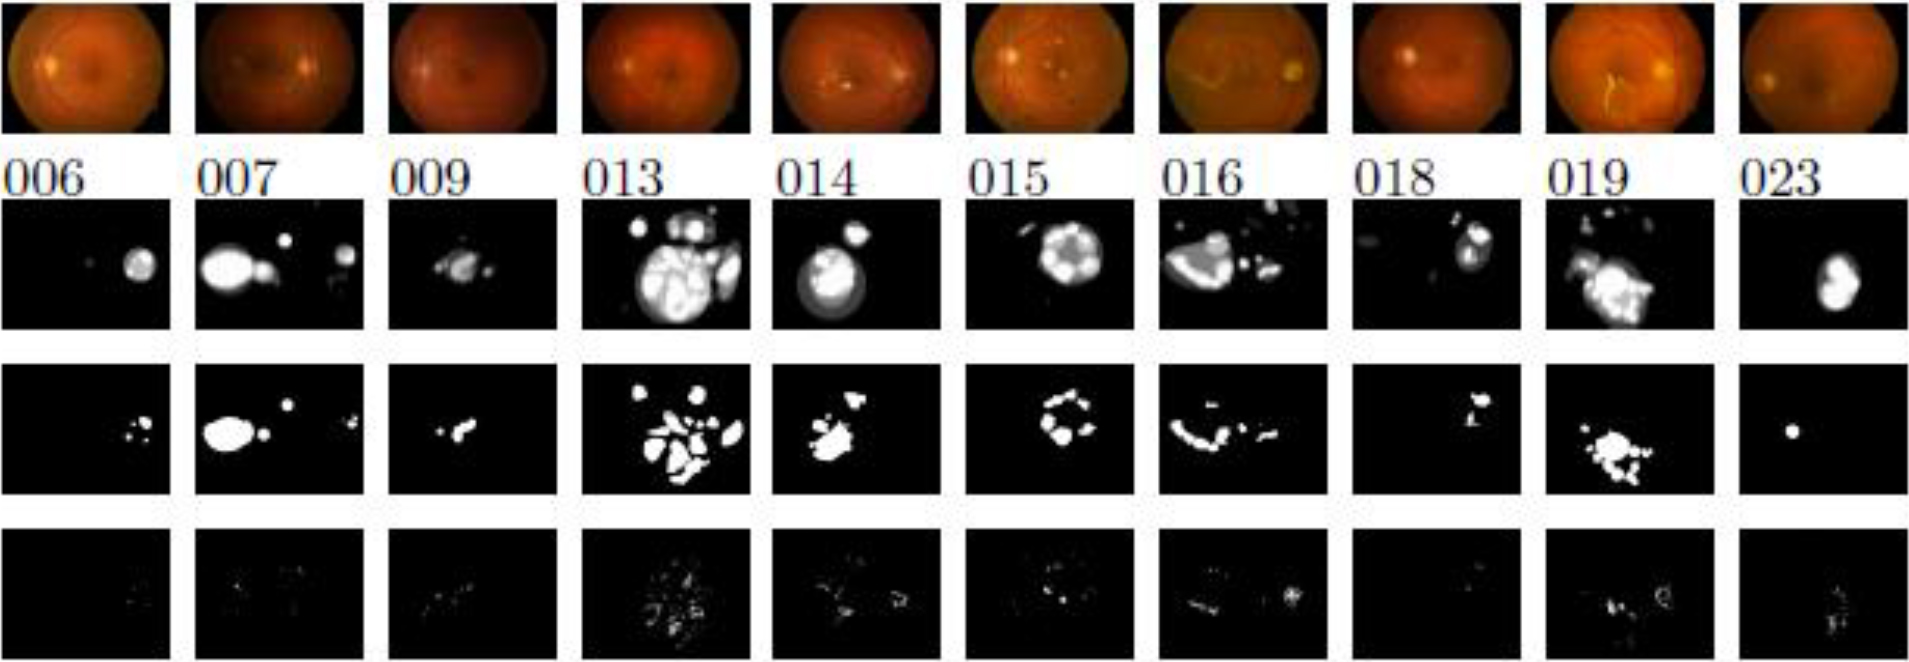
The Retinopathy diabetes is a very serious problem which begin to manifest itself as a tiny blood dot in the retina blood vessels (microaneurysms) which mostly go unnoticed. Prolonged microaneurysms degenerate into hemorrhages and eventually exudates. These are very vital stages which when not early and properly attended to may leads to serious degeneration to other stages which difficult to treat and may result in total or partial blindness.
It is quite a big challenge detecting early stages of these process. This is because at early stages their textures resemble that of the other parts of the retina like macula and blood vessels. To be able to detect any of that at early stage, a very robust algorithm is needed which can make distinction between different textures and features of the fundus image despite their similarities.
In order to achieve that, the proposed approach has taken many scenarios into account and provide a comprehensive approach to segmentation of major features in the fundus image (e.g., optical disk, blood vessels) to reduce the effects of false detection in the classification process. The approach utilized a much robust feature extraction process (using Interval Type-2 FCM) which has performed significantly well
Comparisons with different methods
Comparisons with different methods

compared to most of the similar literary works we compared with in the Table 3. The process of separately segmentation of Optical disk and blood vessels have been very challenging aspect of the retinopathy diabetes detection which has been handle with a lot of success by the proposed algorithm.
The results obtained from the process are consistent across all the metrices used to evaluate the algorithm and it can clearly be seen that a lot of improvement has been recorded over the other methods that have mainly used Fuzzy Logic and other segmentation algorithms as compiled in Table 2.
A method for feature extraction, detection and evaluation of retinal diabetic has been proposed. A comprehensive and through analysis of the retinal images using Interval Type-2 fuzzy techniques with segmentation capability of vitals features such as blood vessels, optic disc has been presented. To realize the desired performance, the proposed approach has taken many instances into account by designing effective approach to segmentation of major features in the fundus image (e.g., optical disk, blood vessels) to reduce the effects of false detection in the classification process. The approach utilized a much robust, better noise and uncertainty handling clustering method IT2FCM to obtain competitive results which significantly works well. The process of separately segmentation of Optical disk and blood vessels have been very challenging aspect of the retinopathy diabetes detection which has been handled with a lot of success by the careful design and use of existing image processing techniques. Other effective state-of-the-art methods using variants of fuzzy type-2 techniques and deep convolutional neural networks can perform excellently well and even better but comes at the cost of increase in computation and memory usage. Future works can deploy such techniques with optimization of computation and memory usage.
The results obtained from the process are consistent across all the metrices used to evaluate the algorithm and it can clearly be seen that a lot of improvement has been recorded over the other methods that have mainly used Fuzzy Logic and other segmentation algorithms. The detection and identification method for defects has also been developed with higher efficiency. The results are validated using the ground-truth image and the standard performance matrices which is the gold-standard for evaluating new algorithms. The results are impressive and competitive with relevant state-of-the-arts research as shown from the experiments.