
Abstract
Increasing the human capital development index of Indonesia is needed to realize the country’s dream to become a developed country in the world. Quality education is needed for that purpose, and this should start from an early age. School is a formal institution for knowledge transfer, which is very useful in building the quality of an Indonesian’s character. Since 2000, Indonesia has made enormous effort to improve the quality of education, which is measured by increased learning outcome, which is measured by mean national examination score. Indonesia has focused on three major aspects, namely, improving equity and access, enhancing quality and relevance, and strengthening management and accountability. These three aspects are translated into eight standards accreditation score. Education quality is believed to have spatial characteristics that follow the Tobler law. In general, schools close to each other, especially in one administrative area, have the same quality characteristics. The spatial characteristics need to be included in modeling the national examination score. Because of the normality assumption problem, we use a Bayesian spatial autoregressive model (BSAR) to evaluate the effect of the eight standard school qualities on learning outcomes and use
Introduction
Indonesia is one of the developing countries in Southeast Asia and has the ambition to be one of the developed countries in the world. For that purpose, human capital development is crucial. Despite the high regional diversity, the quality of education throughout the territory of Indonesia has always been a top priority. According to the Indonesian education system, the grades of school education consist of elementary, junior, and senior high school levels (OECD, 2015; Firman & Tola, 2008). Since 2000, Indonesia has made enormous efforts to improve the quality of education, which is measured by increased literacy (Tobias et al., 2014). To develop the quality of education, Indonesia has focused on three major aspects, namely, improving equity and access, enhancing quality and relevance, and strengthening management and accountability. These three aspects are translated into eight standard accreditations score, which include standard of contents (Q1), standard of process (Q2), standard of graduate competence (Q3), standard of education (Q4), standard of facilities and infrastructure (Q5), standard of management (Q6), standard of financing (Q7), and standard of assessment (Q8). Improvement of these standards is expected to improve the human capital development index, which, for schools relate to the learning outcome and can be measured by the national examination score. To map the quality of education, in 2000, the government reestablished the national examination that was once abolished.
The national examination (Ujian Nasional-UN) is an assessment learning outcome by the government, which has become the benchmark of student success in following the process of learning in school. The purpose of the UN is to know and measure students’ level of mastery of a certain subject matter nationally and the quality level of education in every province in Indonesia (Elfiza et al., 2016). The national examination score is a value generated from the national examinations held nationally at the final levels of elementary, junior, and senior high schools. The high level of diversity of the national examination score among junior high schools in Indonesia indicates that the quality of education is not the same in different parts of the country and needs to be improved. Improving the quality of education in Indonesia is a big challenge because it is a vast and diverse country that has the fourth largest population in the world, comprising 34 provinces and over 500 districts with roughly 55 million students, 3 million teachers, and 236,000 schools (MoEC, 2013).
West Java is one of the largest provinces in Indonesia with the highest number of junior high schools. However, a lot of schools still have a medium level of accreditation status. The West Java government has taken great efforts to improve the quality of education; however, these efforts need to be defined accurately. Policy makers should be more focused on the weakest indicators of education quality. Improving the quality indicators of education will increase the national examination score and the percentage of students graduating. A better understanding of the effect of school characteristics, which are measured by the eight standards of quality on learning outcomes, is important because the Ministry of Education and Culture (MoEC) may use this information to decide what policy should be taken to improve learning outcomes. As a first step toward understanding the determinants of learning outcomes in West Java and also Indonesia, this paper focuses on how the eight standards of quality in junior high school influences their academic achievement, which is measured based on the national examination score (Newhouse & Beegle, 2005) in West Java. For that purpose, we build a model that can identify which indicators are most dominant in influencing the national examination score, which represents learning outcomes.
The education quality is believed to have spatial characteristics following the Tobler law. Tobler (1970) introduced the first law of geography; that is, everything is related to everything else, but near things are more related than distant ones. These spatial characteristics are usually measured by means spatial dependence and spatial heterogeneity (Jaya et al., 2018; Elhorst, 2014). In general, schools close to each other, especially in one administrative area, have the same quality characteristics so that modeling the national examination score needs to include the spatial characteristics for reliable estimation (Anselin, 2003; Elhorst, 2014). The spatial econometrics model is a powerful model that can be used to accommodate the spatial characteristics especially for spatial dependence and explain the spillover (i.e., the effect of variable changes at one location on the outcome variables in other locations).
Spatial econometrics are widely used in regional, economic, social, and epidemiological fields, among others (Jaya et al., 2017; Klotz, 2004). There are several models in spatial econometrics (i.e., spatial autoregressive model, spatial error model, and spatial Durbin model). These models are developed based on the structure of spatial dependencies and heterogeneities (Vega & Elhorst, 2015). Based on the Tobler law, we believe that the national examination score has spatial dependence characteristics that can be patterned after the spatial autoregressive model (SAR). The parameters of the spatial econometrics model can be estimated by the mean of the maximum likelihood estimation (Anselin, 1988). However, for large sample size, the maximum likelihood is not a better choice because the complexity in calculating the standard error estimates for hypothesis testing (LeSage & Pace, 2009), the purpose, and the strict assumption of the normality distribution is needed. To overcome these problems, we introduce an alternative using a Bayesian approach. A Bayesian approach has several advantages. It provides a convenient way of combining prior information with data using the appropriate statistical framework. Bayesian inference is conditional on the data and is exact without dependence on asymptotic approximation so that the normality distribution of the error term is not an issue. For practitioners, the result of the Bayesian estimation is more interpretable and easier to understand. It provides understandable interpretations, such as “the true parameter
Besides the sample size and normality assumption problem, how to present the spatial dependence structure in spatial econometrics is still a big challenge. The spatial dependence structure is represented as a spatial weight matrix (
This paper focuses on the application optimization of the
Method
k-Nearest Neighbors algorithm (k-NN)
In pattern recognition, several techniques are usually used (i.e.,
The label class of
In spatial data analysis, Moran’s index is used to measure the spatial autocorrelation, which detects whether a determined variable has a spatially dependent structure or occurs in a random pattern. The index takes the values of
where
Spatial econometrics is a subfield of econometrics dealing with spatial effects among geographical units. Its methods were developed to accommodate the spatial interaction in the determined variable related to spatial locations (Anselin, 1988). Several models have been introduced, namely, spatial autoregressive model (SAR), spatial error model (SEM), spatial autoregressive combined model (SAC), spatial Durbin model (SDM), spatial error Durbin model (SEDM), spatial lag exogenous model (SLX), and spatial general nesting model (SGNS). The SAR model is widely applied for spatial lattice data (Li et al., 2007).
Spatial autoregressive model (SAR)
The spatial autoregressive (SAR) model can be presented as (Anselin, Spatial Econometrics: Methods and Models, 1988)
where
Using Bayesian methods through the definition of a prior distribution can solve incomplete information obtained from the data (Congdon, 2013). The Bayesian method gives good results for small sample sizes compared with the ML method and similar results for a large sample size. ML gives unfavorable results for a small sample size because it is difficult to get the optimum value of autoregressive parameters. However, for large sample size, the ML estimation is difficult to use to find the standard error estimate because of the large size of the Hessian matrix. The Bayesian method is well suited in cases of nonnormality, and homoscedasticity assumptions of the error term are violated. Those conditions are very common in spatial data analysis (Anselin, 1988). Equation (4) can be written in the matrix notation as follows:
where
where
The likelihood function By assumption of the learning, outcome follows a normal distribution, the likelihood function can be written as
with Prior distribution,
Prior distribution,
Joint prior distribution, Joint prior distribution
Prior distribution
Based on the likelihood function and prior distribution above, the joint posterior distribution is as follows:
The combined joint posterior distribution Eq. (12) can be written in the following form:
where
The parameters (
Conditional distribution
Conditional distribution of
Conditional distribution of
Conditional distribution of
Conditional distributions
Computational algorithm
To get an estimation of SAR model parameters, calculate with the algorithm as follows:
Define the initial values (initial value) { Generate parameter Generate parameter Generate parameter
Define the candidate distribution Do the sampling process:
with Do the 2–4 process as much as M iteration. Generally, M
All the computational processes are done in R software with our own packages. The R code is available upon request
The parameter inference in a Bayesian method is based on the sequence of MCMC samples that are derived from the true posterior distribution. Validity inference needs to be checked using convergence diagnostic. The convergence diagnostic relates to determining the minimum sample required to ensure a reasonable approximation to the target posterior density. The graphical approach usually used for convergence diagnostic includes trace plot, ergodic mean plot, and autocorrelation plot. The convergence of the algorithm is shown by the stabilizers of those plots after some iterations (see Ioannis, 2009, for detail).
Spillover effect
Spillover effects are mainly interesting in spatial econometrics. It explains a change in covariate in a particular region potentially impacting the outcome in all regions that, according to the spatial weight matrix (W), are unconnected. The spillover effect of the
Results
We use educational data from 2012. These data are complete to be able to support the analysis of the quality of education in junior high schools in West Java, Indonesia.
Statistics of the national examination score of junior high school in West Java
Statistics of the national examination score of junior high school in West Java
The national examination score is obtained from four subjects: English, Indonesian, Mathematics, and Natural Sciences. The minimum national examination score from 415 schools is 17.30, and the maximum score is 35.55. The Fig. 1 below shows the distribution of the national examination score for 415 schools in West Java.
The distribution of the national examination score of junior high schools in West Java.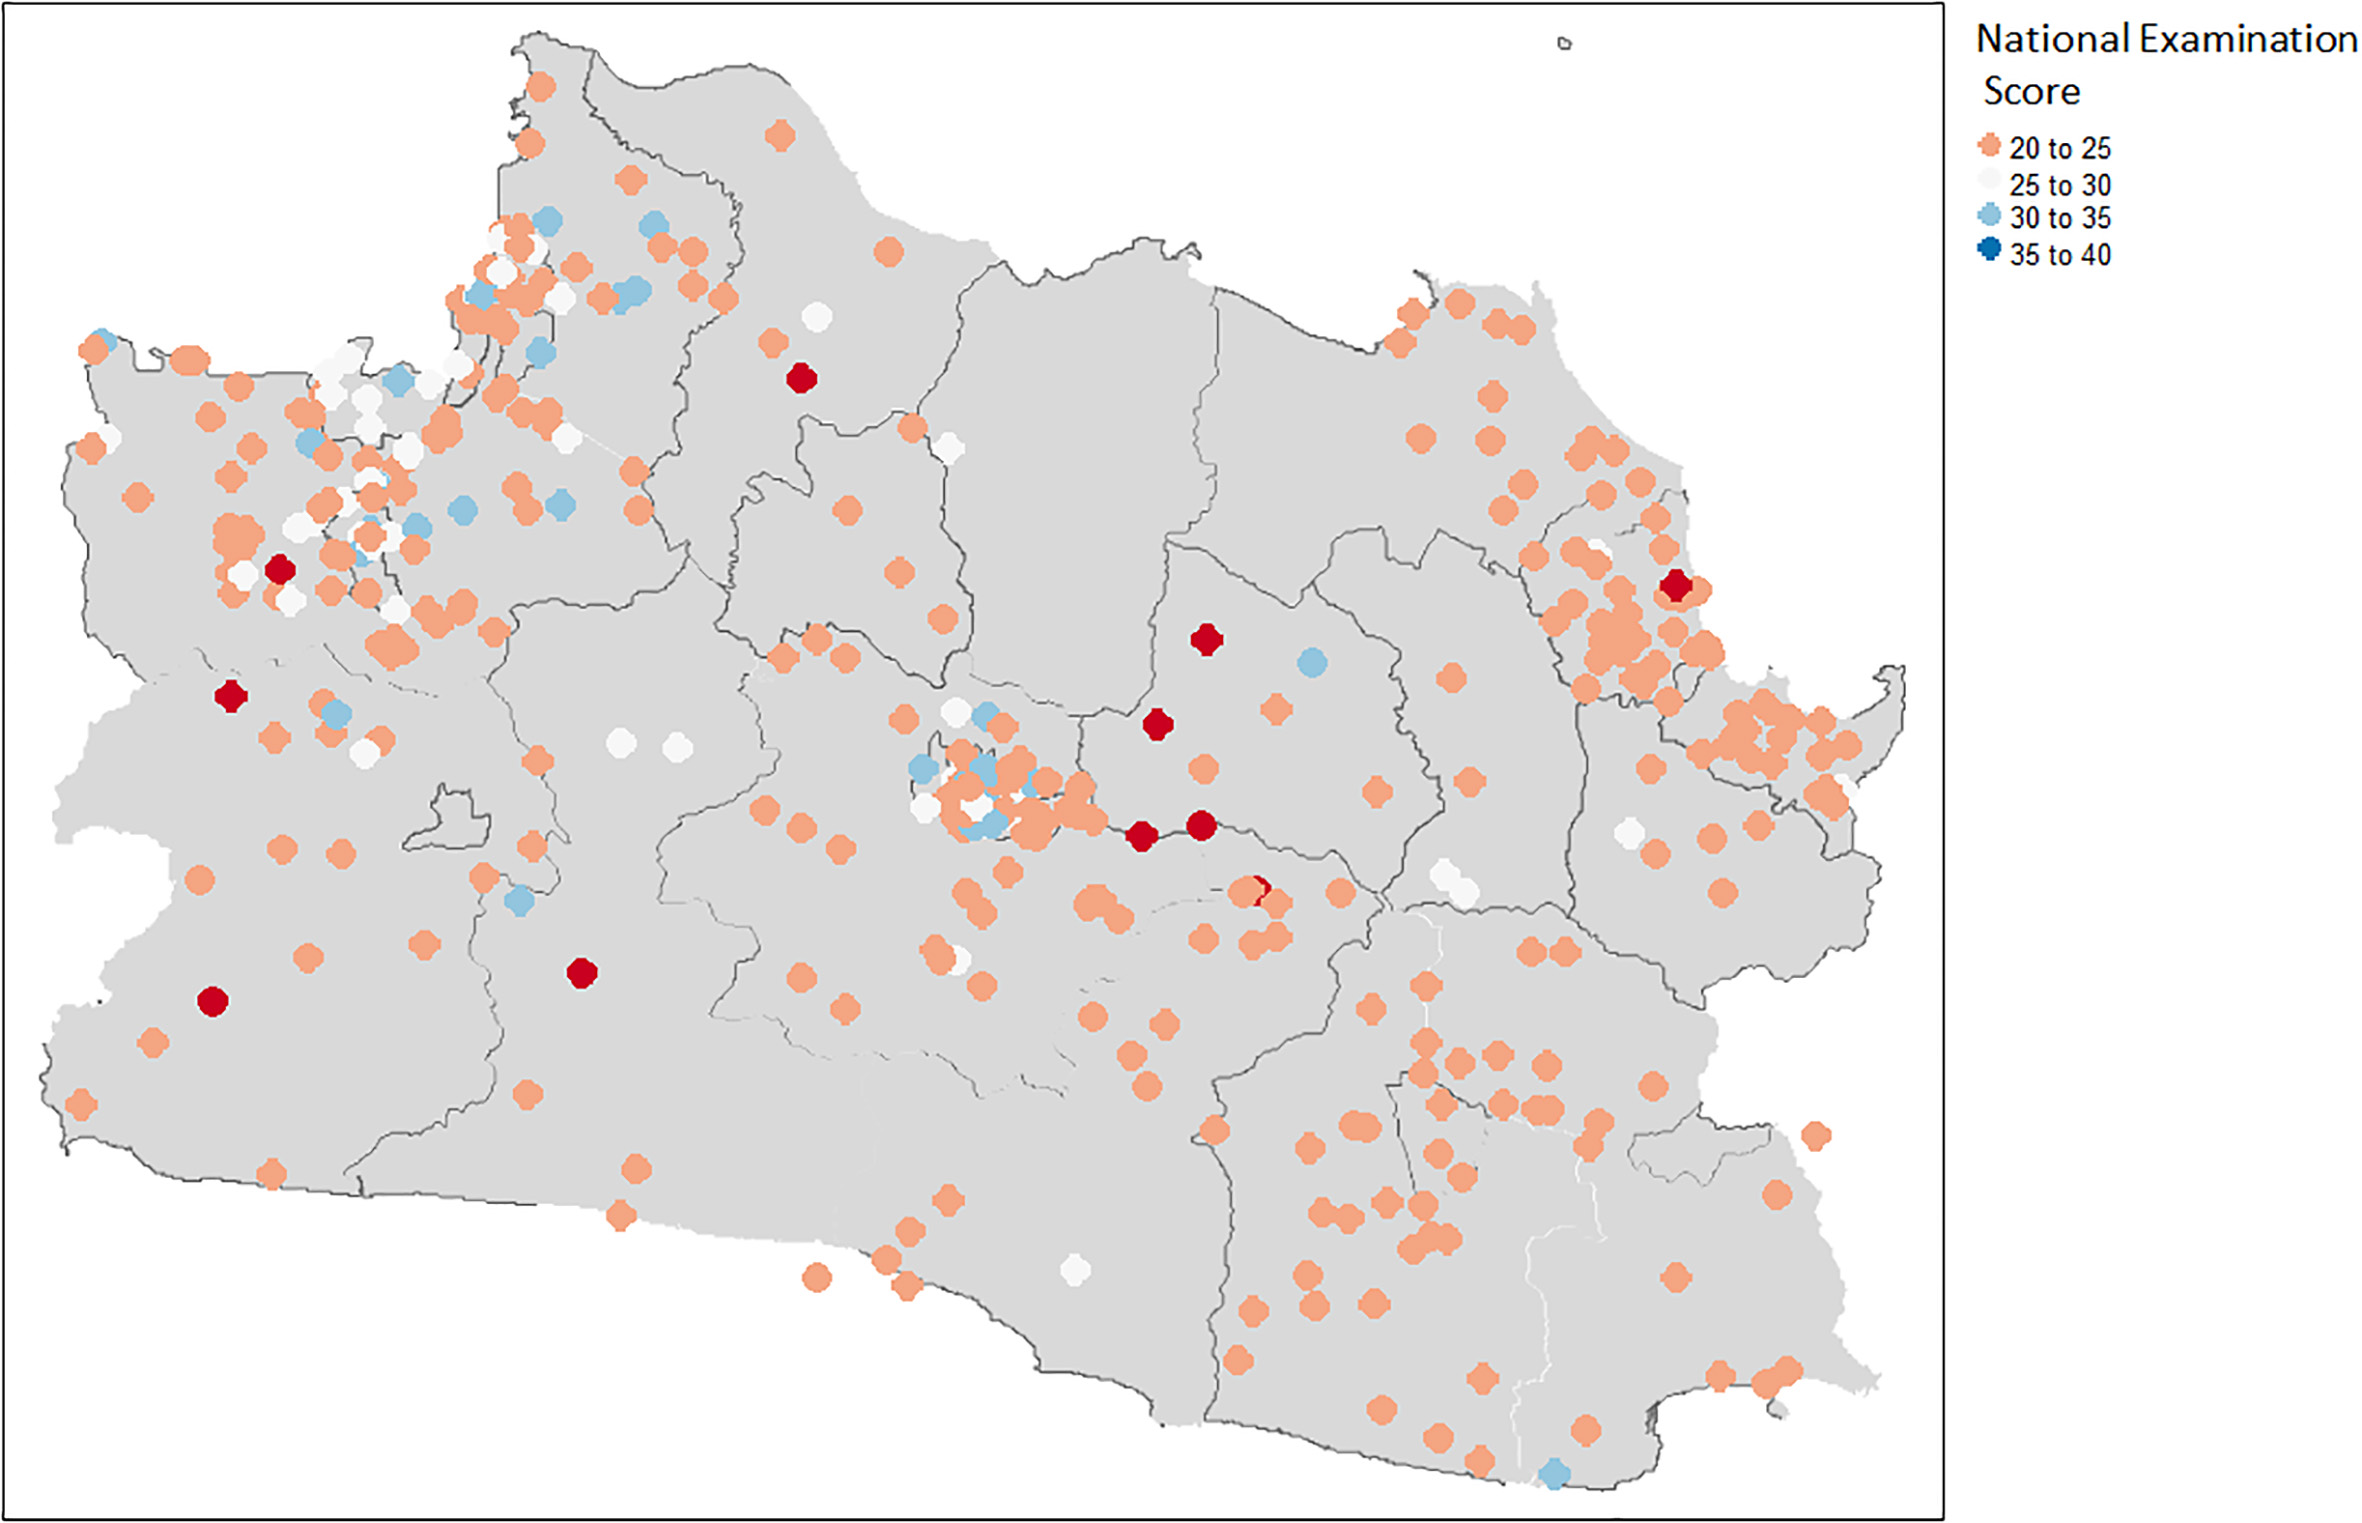
In 2012, the majority of junior high schools in West Java got an average of national examination scores that was less than 25. It means that the average scores in four subjects were lower than 6. Figure 1 shows that there is spatial clustering of the national examination score, where schools with a low score become one group and high-score schools become another group.
Statistics of the eight standards accreditation score of junior high school in West Java
Table 2 shows that the score for standard of contents (Q1), standard of process (Q2), standard of graduate competence (Q3), standard of education (Q4), standard of facilities and infrastructure (Q5), standard of management (Q6), standard of financing (Q7), and standard of assessment (Q8) varies from very small and large value (26.67 to 100). This means that the quality of education in junior high schools in West Java have large variation.
The distribution of the eight standard accreditation scores of junior high school in West Java.
Figure 2 shows the distribution of the eight standard accreditation score of junior high school in West Java Map. We can see that the map present the spatial clustering. The map informs that the schools have the similar quality will close each other. The hypothesis in this research is that the standard quality education, which is measured by the eight standard scores, influences the national examination score. For this purpose, we develop a spatial autoregressive model (SAR). The SAR model is built based on 415 junior high schools in West Java. In the SAR model, constructing the spatial weight matrix (
The simulation to find the optimum 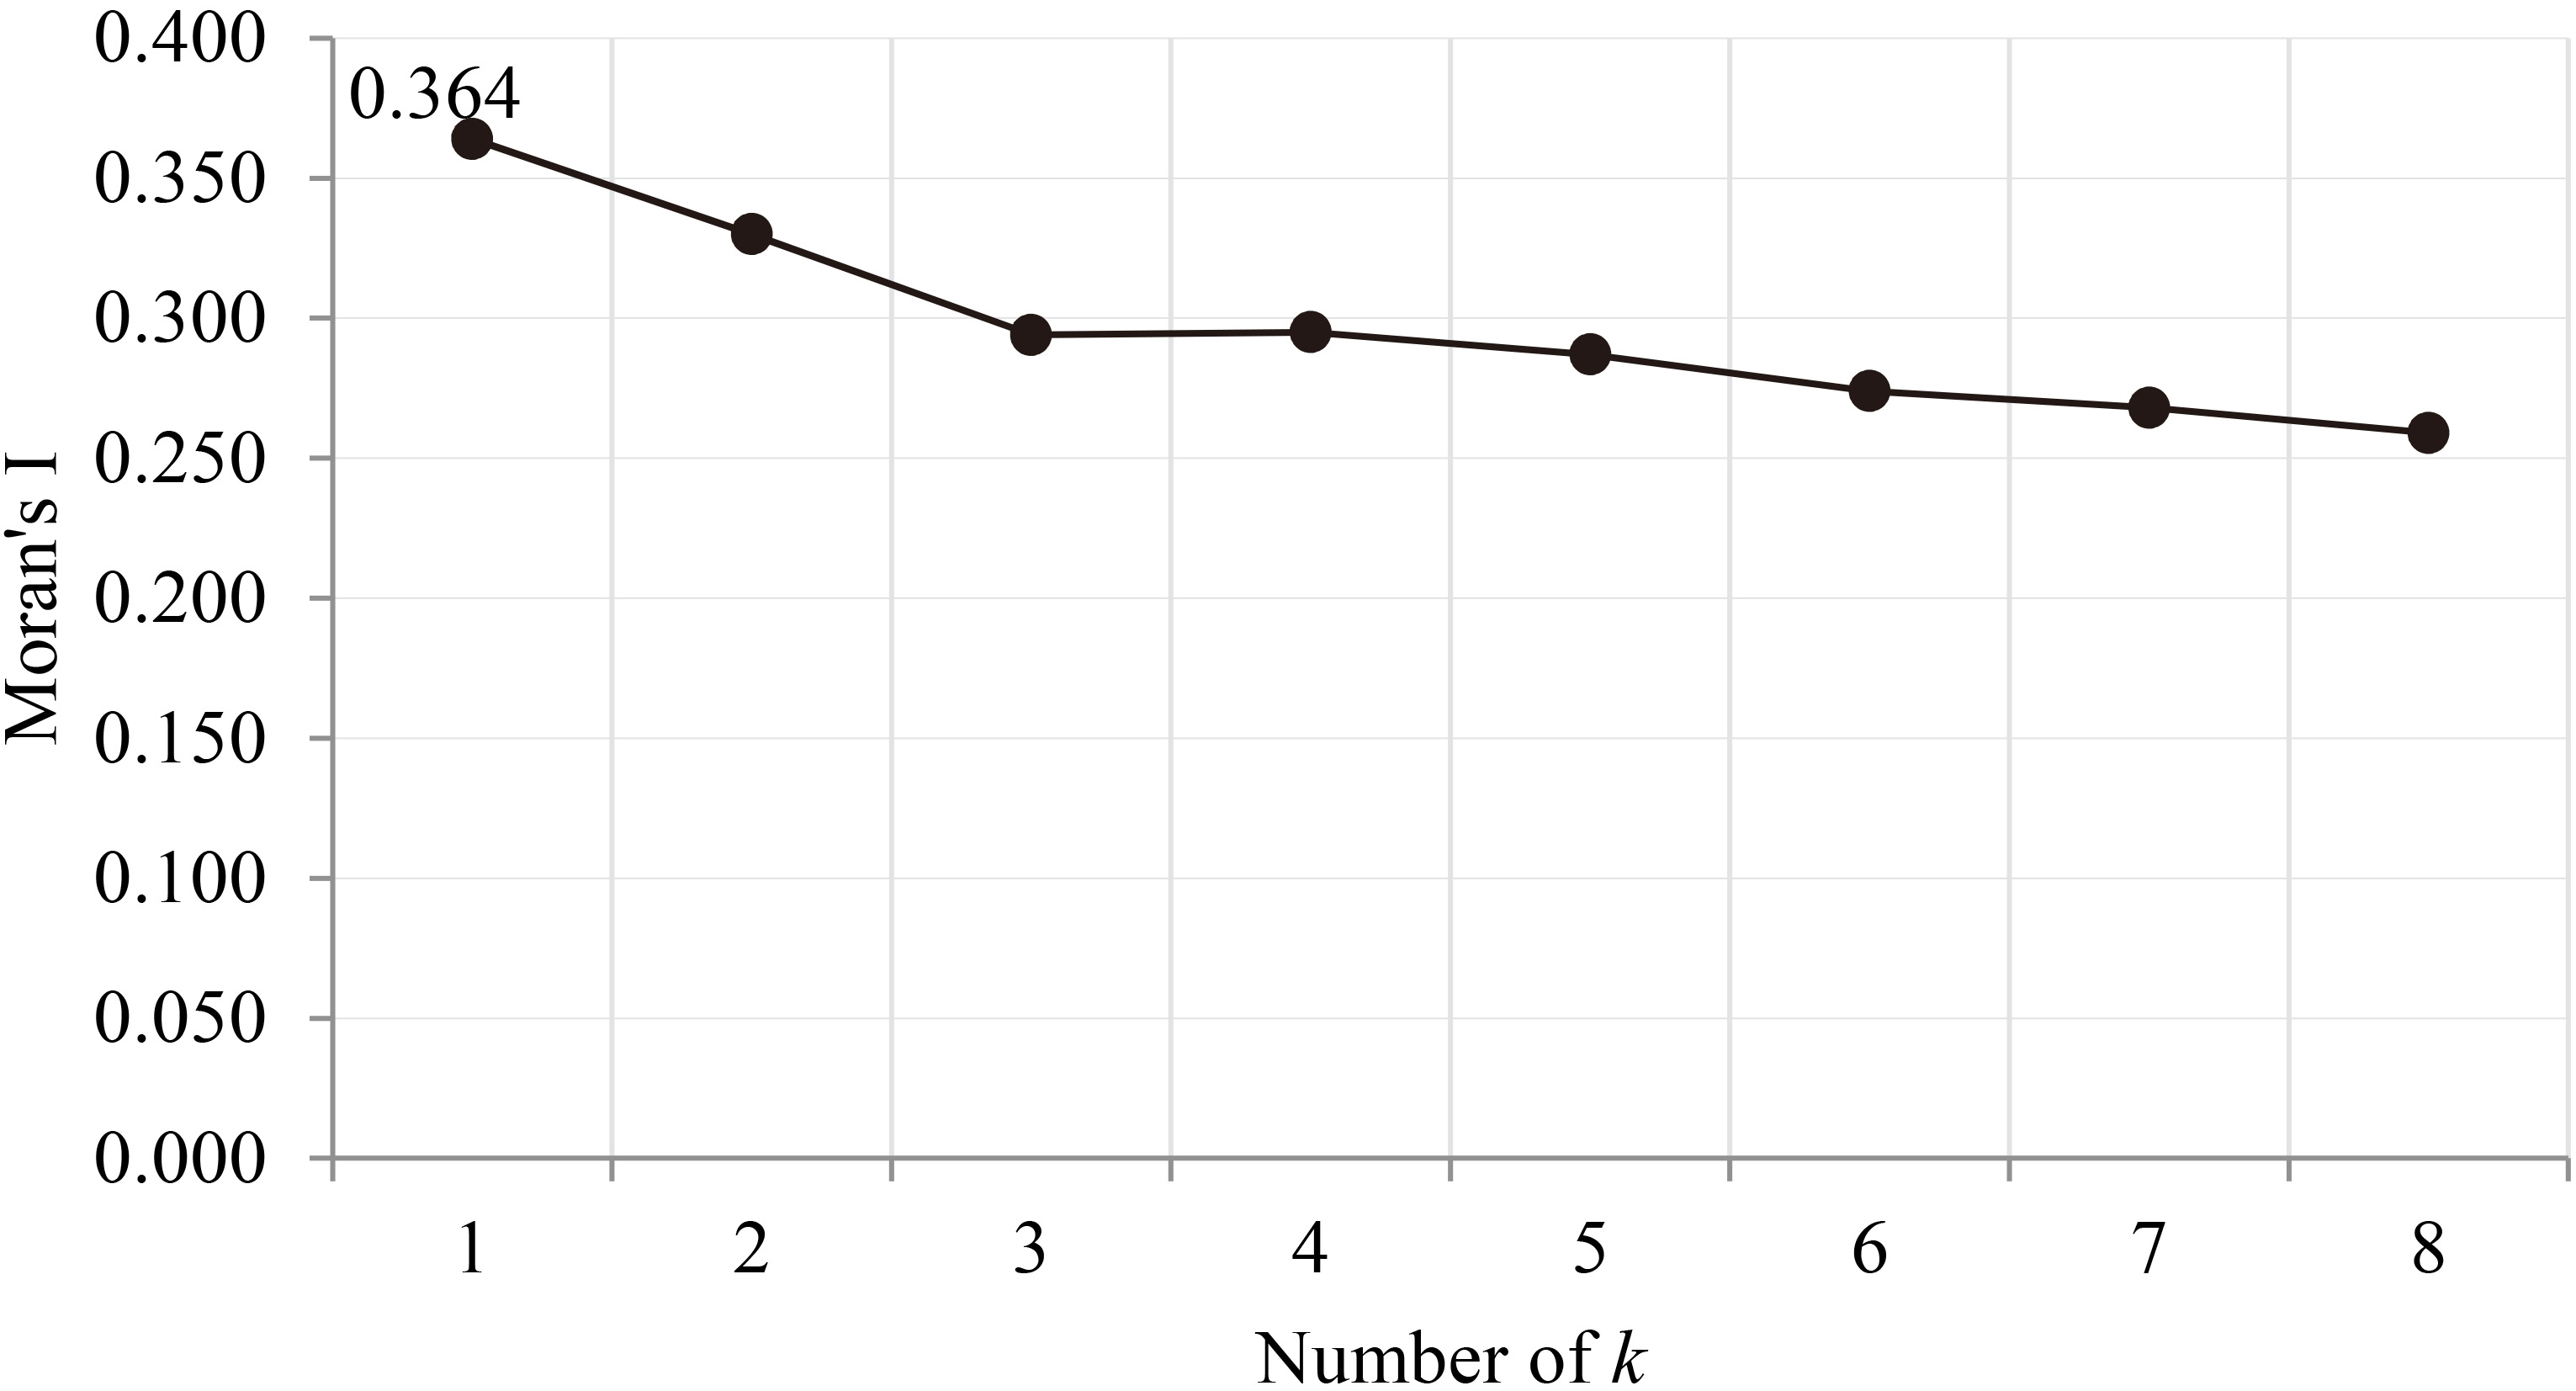
Figure 3 shows the maximum value of Moran’s index that is obtained form
Testing of normality assumption. (a) Normality testing for response variable (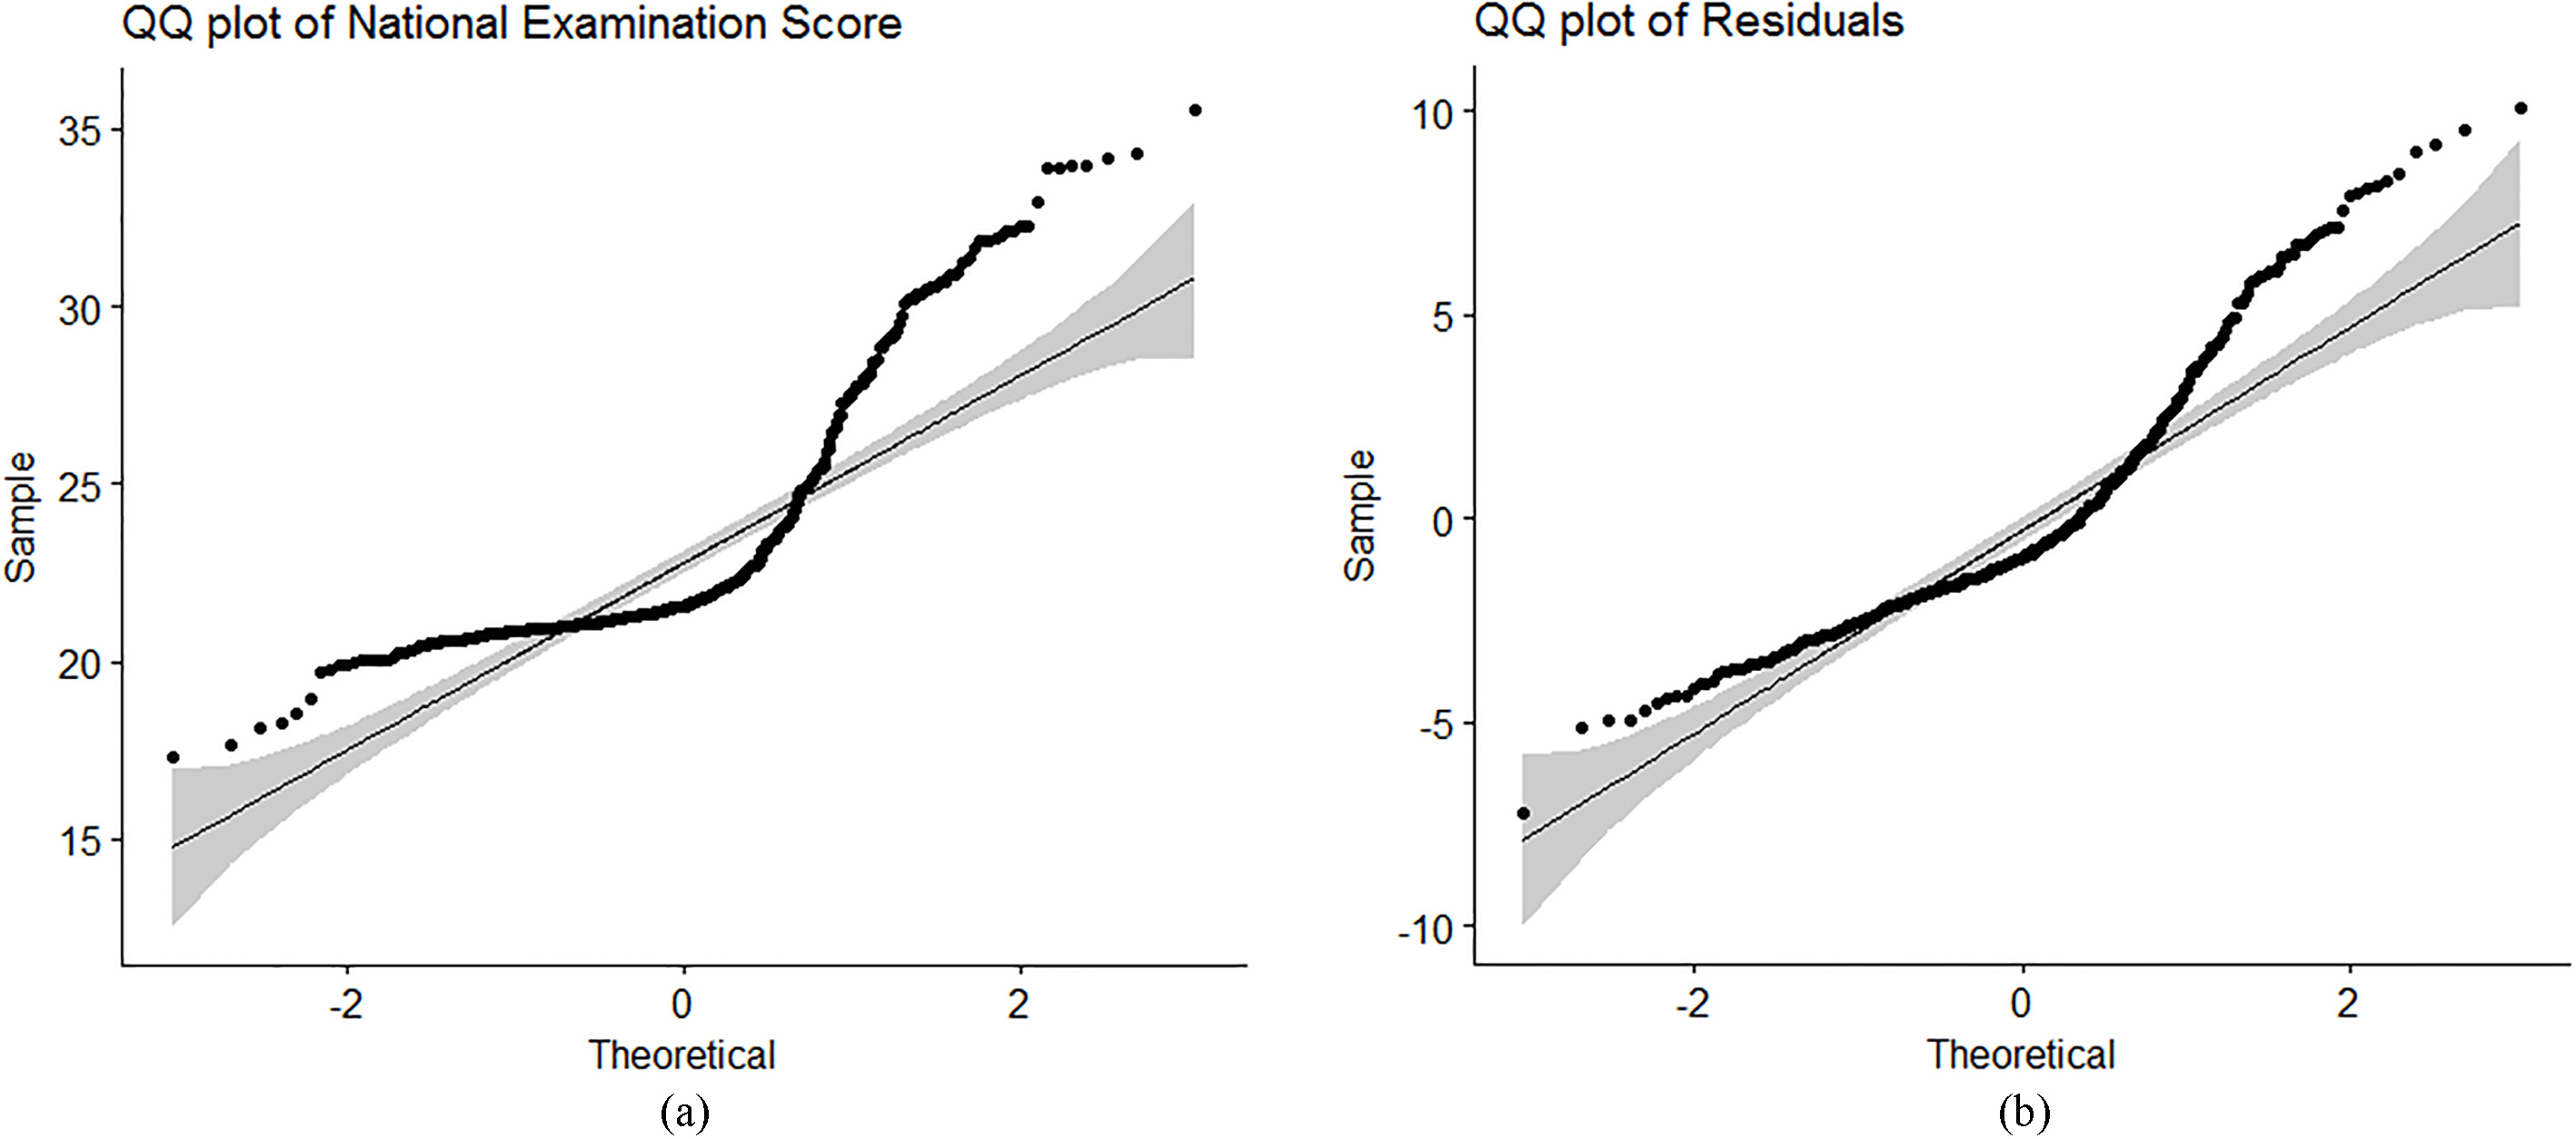
The maximum likelihood estimation strictly needs the determined response variable and the error term following the normal distribution. If the normality assumption is violated, the estimation result may be invalid and the hypothesis testing with
MCMC of convergence diagnostics.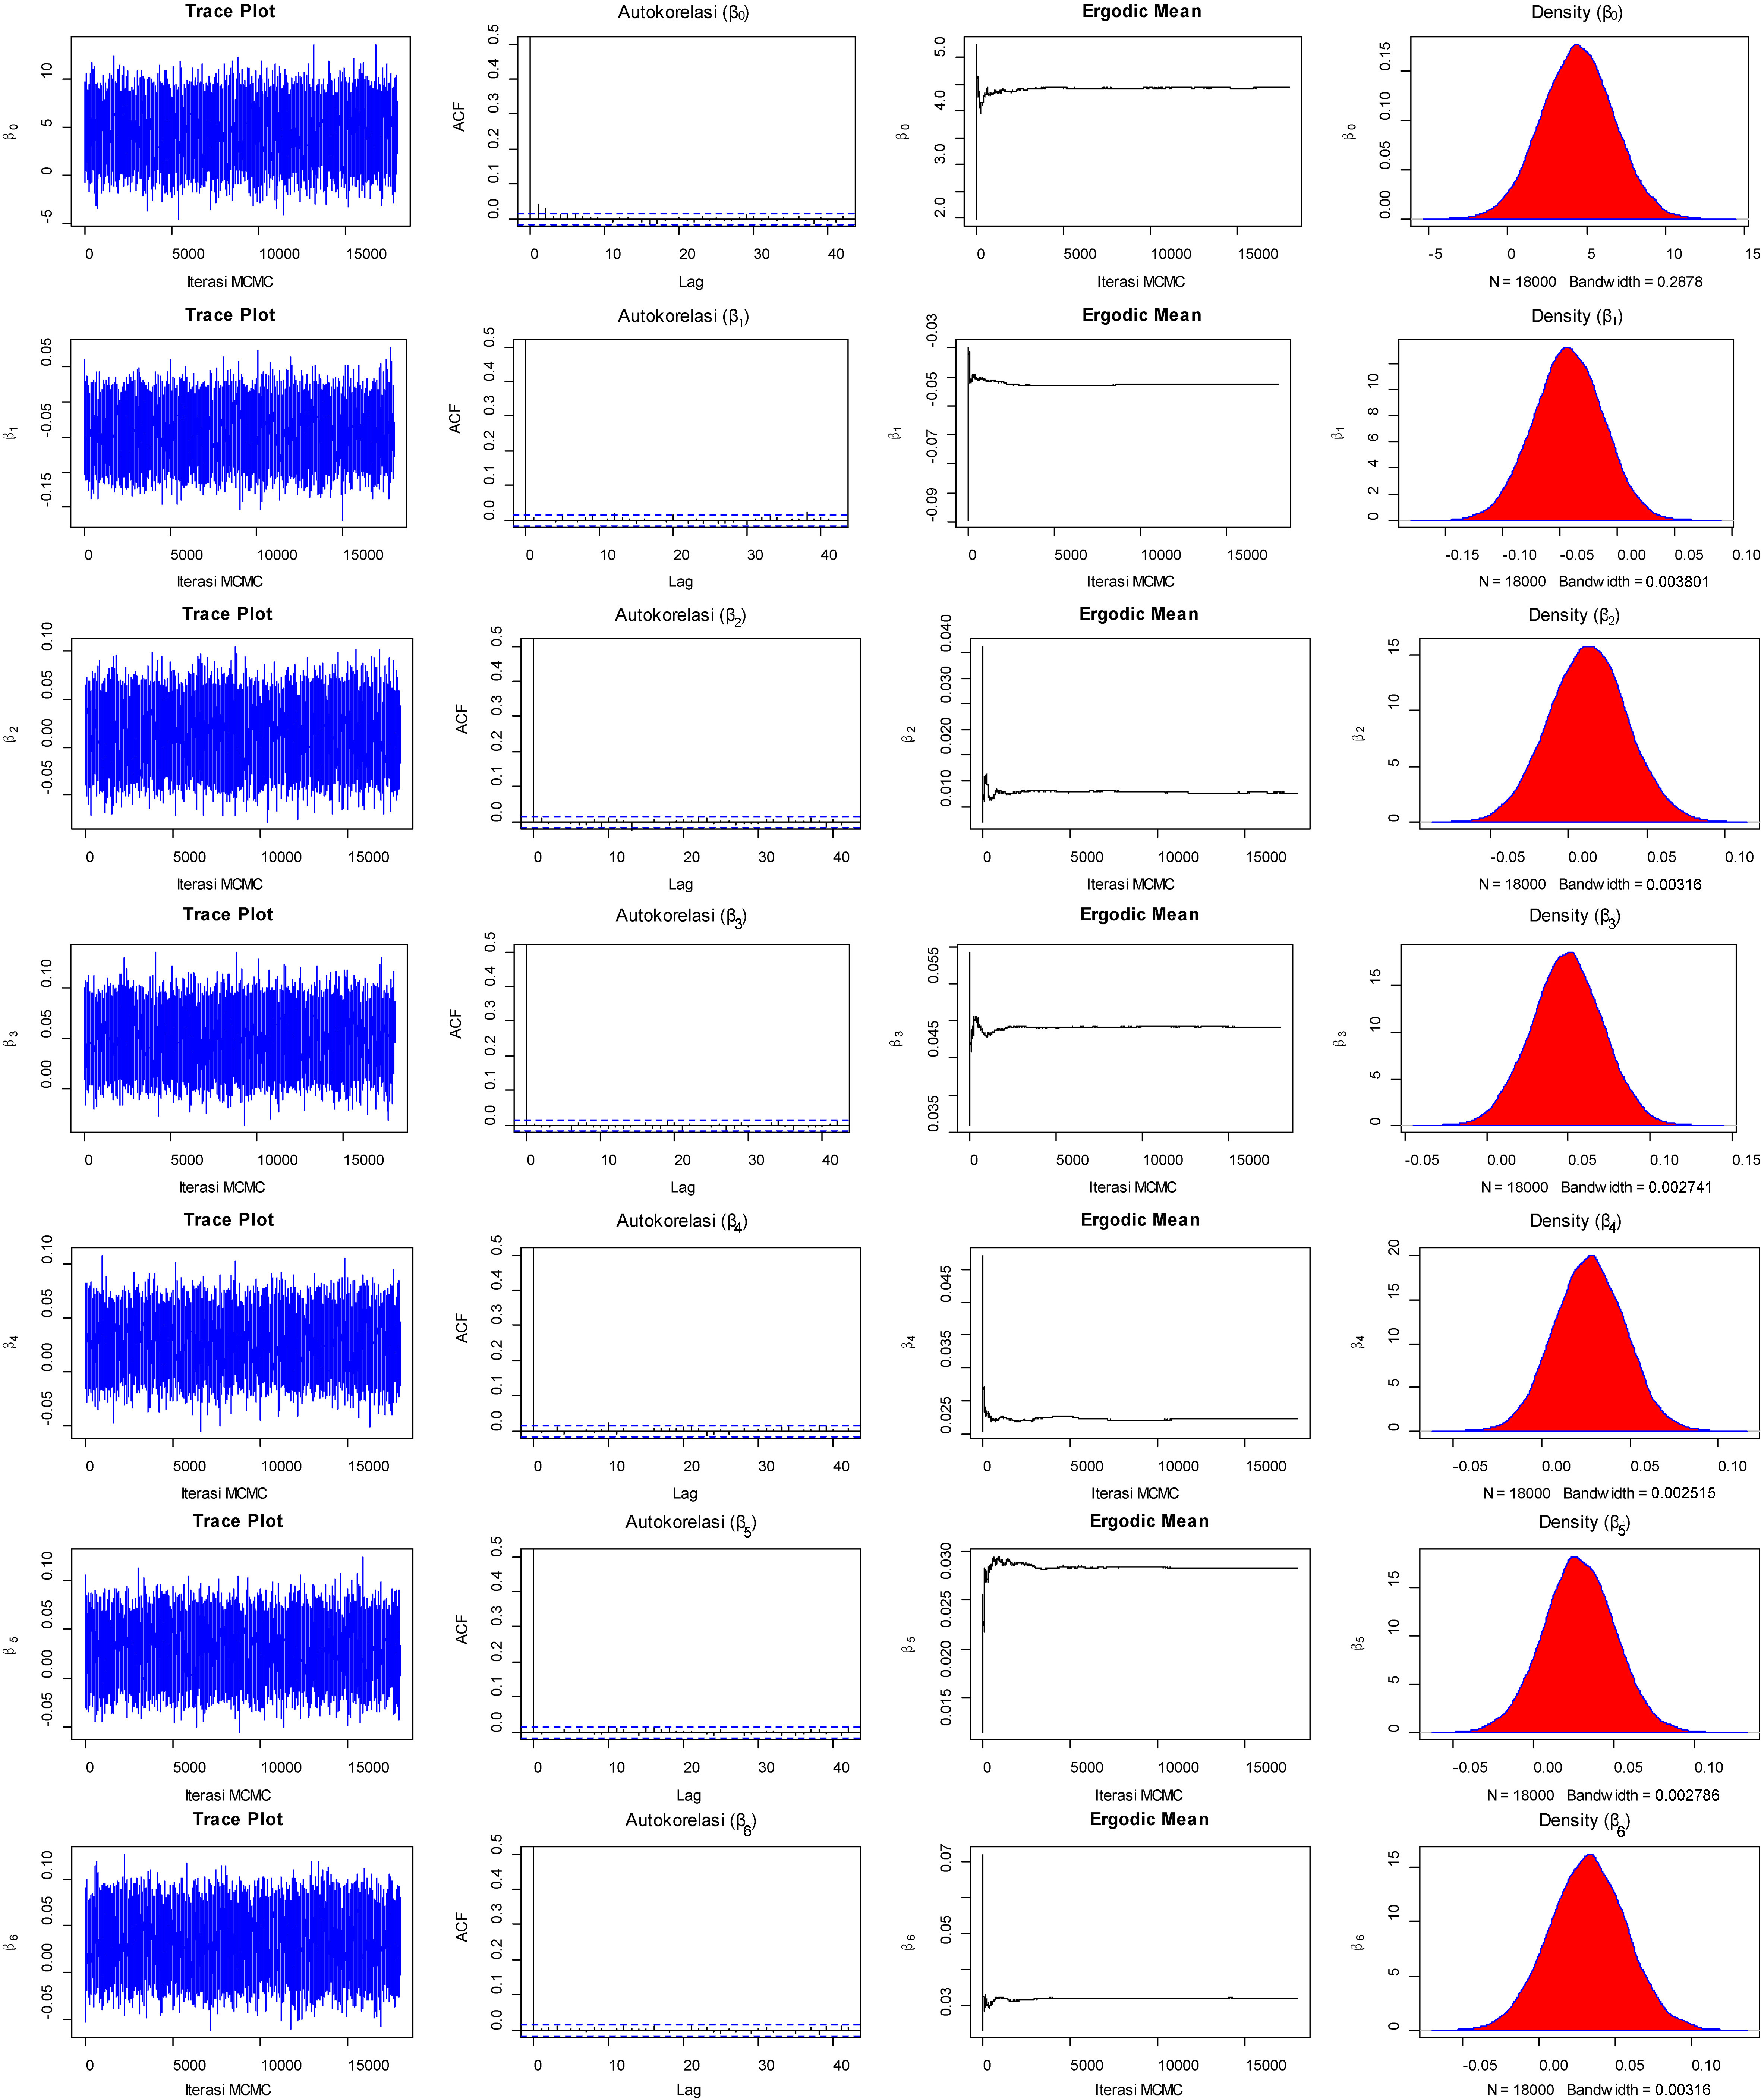
continued.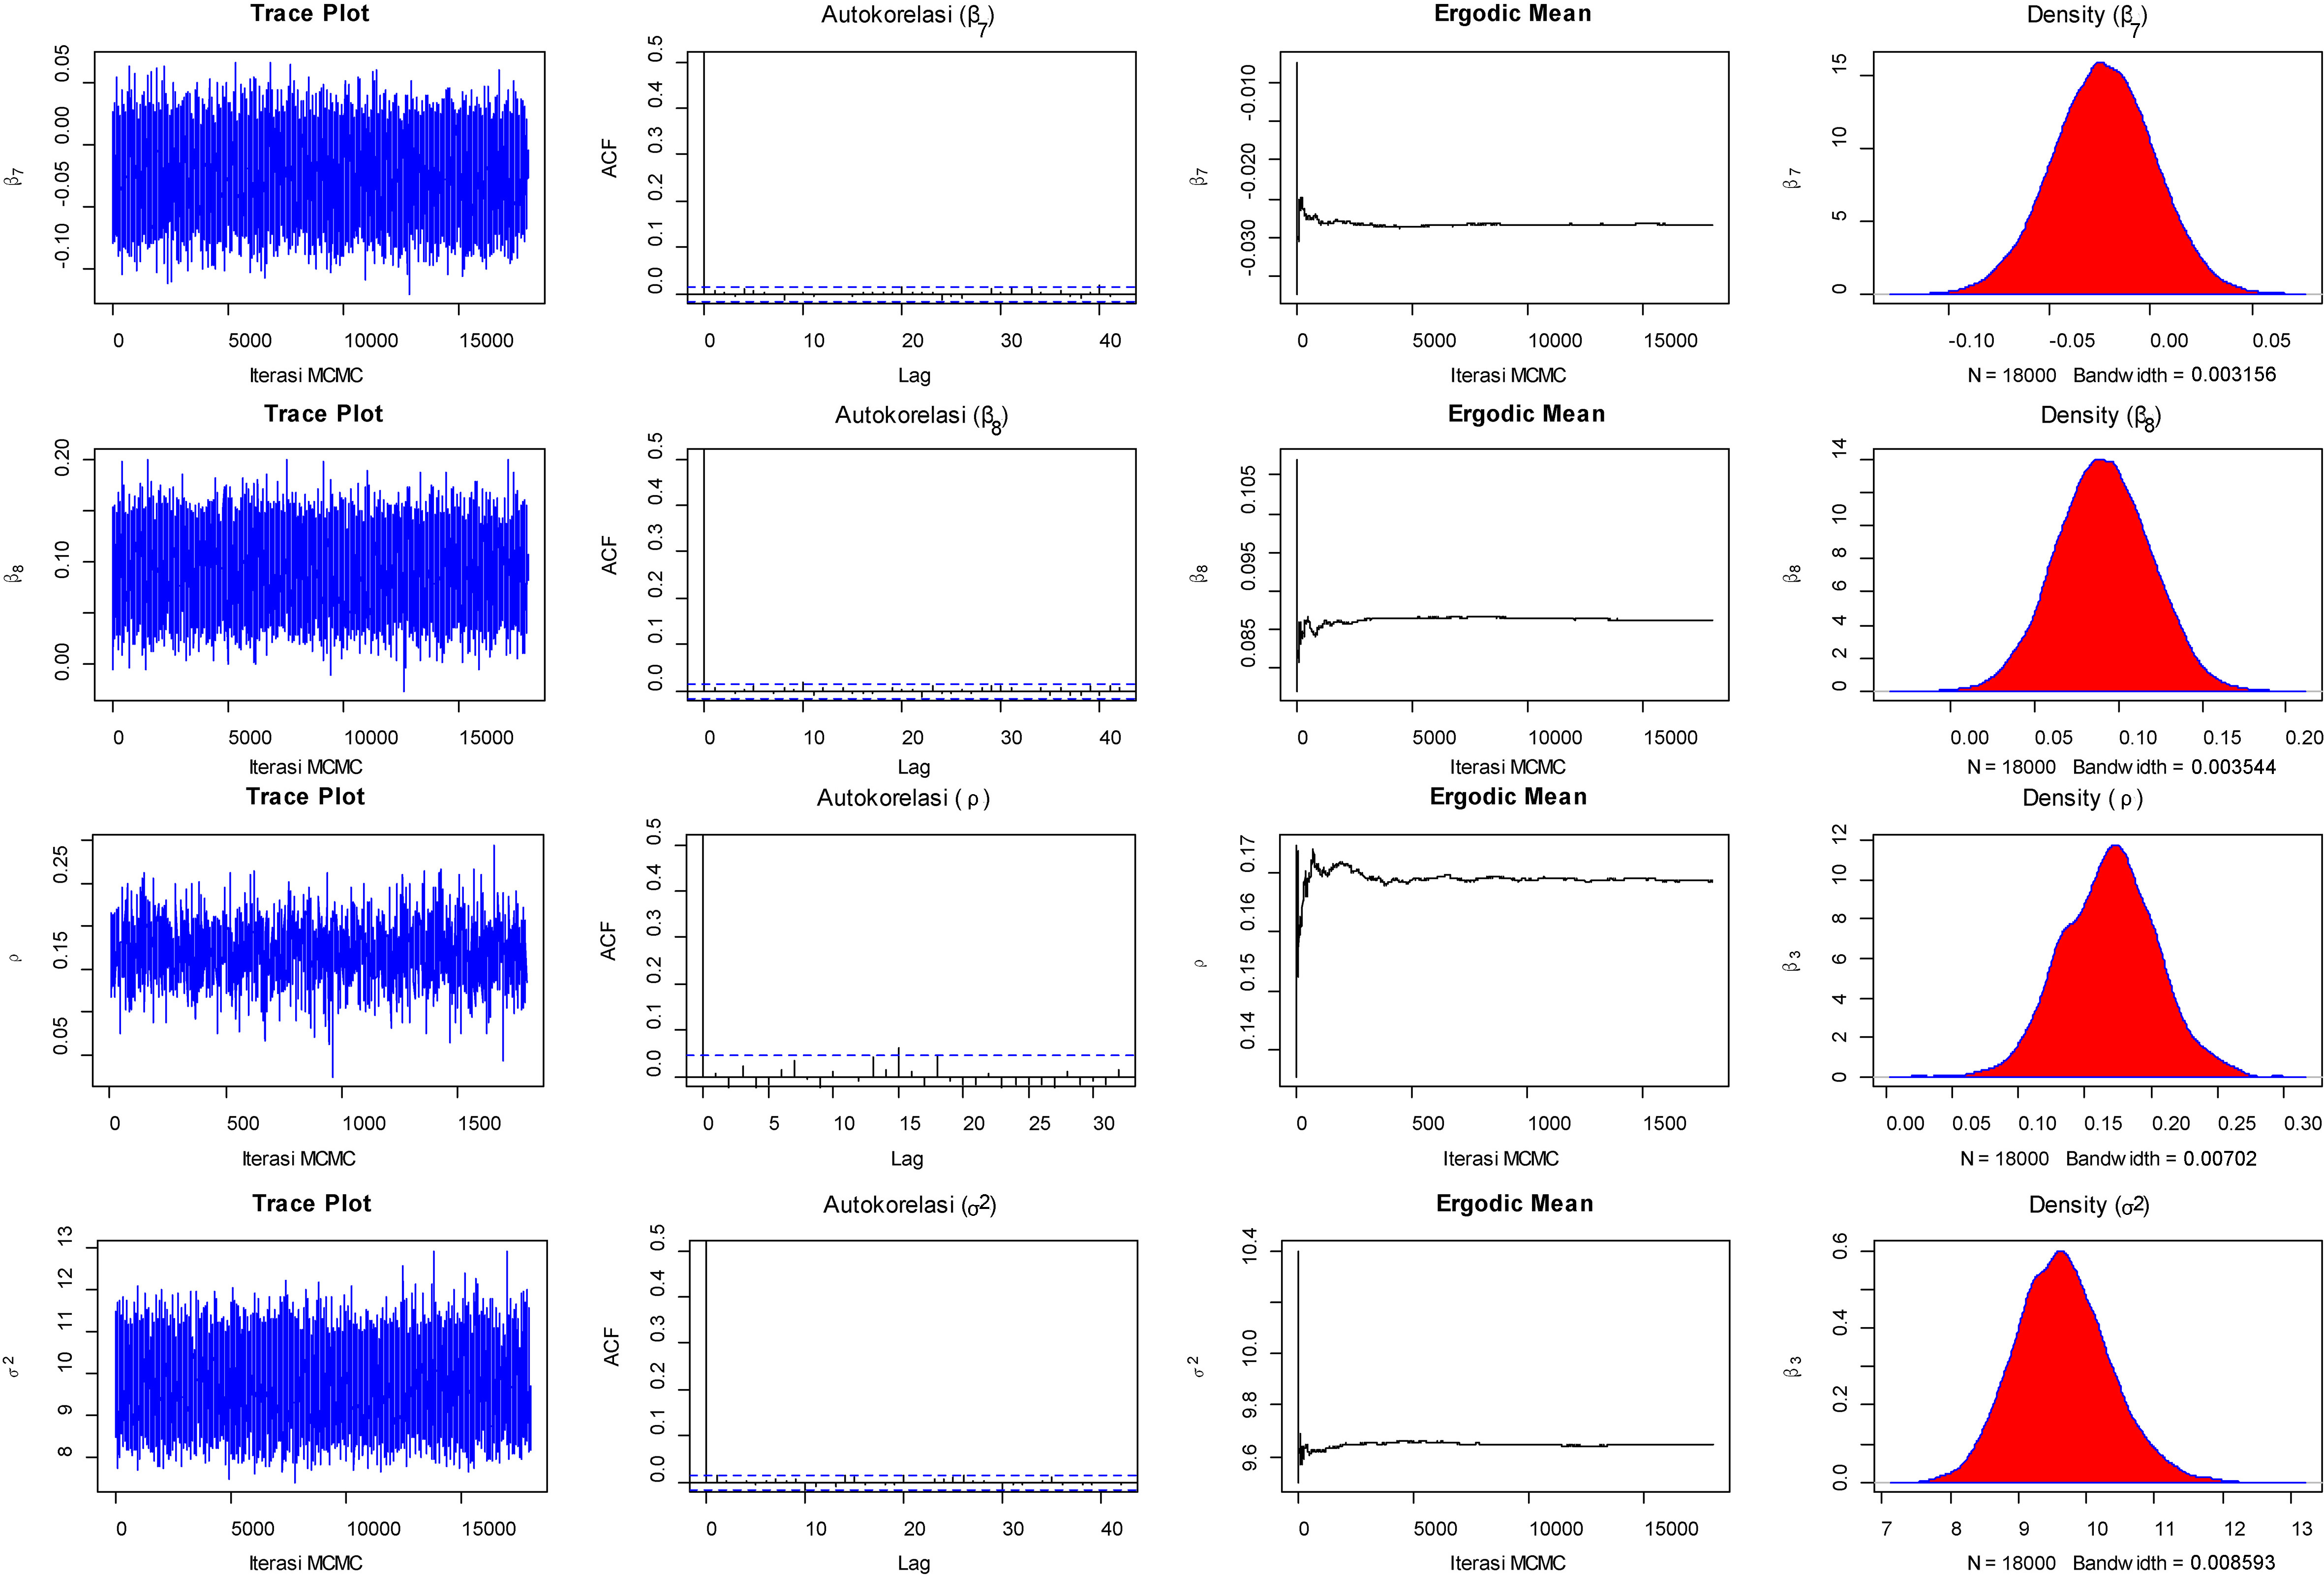
Figure 5 shows four different MCMC convergence diagnostic plots. The first column of the plots includes trace plots. Trace plots show the values that the parameter took during the runtime of the chain. The convergence patterns of all the trace plots show the ideal pattern. All trace plots present rapid up-and-down variation with no long-term trends or drifts. This result indicates that the convergence in distribution takes place rapidly. The next plots are the autocorrelation plots. Those autocorrelation plots also present the ideal pattern, or there is no significant lag. It means that the MCMC sampling process is drawn independently. Another way to check for the convergence of MCMC sampling is the ergodic mean. The third column presents the ergodic mean plots. The ergodic mean plot presents the stationarity condition. After 1,000 iterations, we can see that the ergodic mean has a convergence pattern. The right plot is a marginal density plot. The histograms present the distribution of the values of the parameter in the chain. Here, the distribution is close to the normal distribution. In general, all the diagnostic plots present the convergence pattern. It means that the estimation and inference processes are valid. The parameters estimate of the Bayesian spatial autoregressive model is presented in Table 3.
Parameters estimate based on the ML and Bayesian approaches
Table 3 display the parameters estimate of SAR model of junior high school in West Java by means ML and Bayesian approaches. Both estimations present similar results. It means that the Bayesian estimation gives an accurate estimate, which is similar to the maximum likelihood. In other words, the Bayesian estimation may be the best alternative for the ML if the normality assumption is violated. Two standards have a significant effect on the national examination score. The first standard is graduate competence (
The advantage of the SAR model compared with that of the standard regression model is that we can calculate the global spillover effect. The global spillover effects of those variables are 0.050 and 0.0926, respectively. It means that the change of graduate competence and assessment in one school gives impact on the change of learning outcomes in all schools with sizes of 0.050 and 0.0926, respectively.
The model optimization based on the
Footnotes
Acknowledgments
This paper is funded by HIU-RKDU Unpad 2017. The authors thank Rector Universitas Padjadjaran and to the anonymous referee for valuable checking to improve this paper.
Appendix
The R code is available upon request.