
Abstract
We currently see a large increase in e-commerce sector; it is becoming a central trend in the banking industry. Fraudsters keep up with modern technologies, and use weak points in human psychology and security systems to steal money from regular users. To ensure the required level of security, banks began to apply artificial intelligence in their anti-fraud systems. Fraud detection can be formulated as a classification problem with a case-based reasoning or knowledge extraction task with unbalanced classes. In this paper we present a framework of models based on various approaches of artificial intelligence, such as neural networks, decision trees, copula models and others to recognize payment behavior of fraudster. The considered framework is evaluated with different metrics and implemented in an actual anti-fraud system, which leads to an improvement of the system performance. Finally, the interrelation between the anti-fraud system indicators and banks operational risks is discussed in this paper.
Introduction
The growth of the transactional business in the banking sector has led to the fact that clients in an online format using smartphones conduct the bulk of transactions (transfers, payments). Banks developing their own mobile applications in which a client can get banking services as quickly and conveniently as possible. However, this convenience is associated with an increase in the risk for cybersecurity, in particular, it becomes easy for fraudsters to use social engineering methods and trick the client into transferring funds to the fraudsters’ accounts. The client is always with a smartphone, and during a telephone conversation with fraudsters in a critical situation, the client becomes vulnerable. Separating this social engineering fraud from legitimate transfers and blocking this transaction is a very difficult task: the client makes the operation himself, and the classic patterns for detecting fraud, such as a change of geolocation or a new IMEI number at the client, stop working. To reduce this risk, banks are developing fraud monitoring systems, with elements of artificial intelligence.
The problem of increase in the volume of fraudulent transactions is global. The Nilson Report (2020) predicts $ 40 billion in global fraud by 2027.
In March 2021, the Basel Committee revised its Principles for Sound Operational Risk Management to make the following changes:
Align principles with the recently revised Basel III operational risk framework; Update guidance, where necessary, in the areas of risk management related to information and communication technology; Increase the overall clarity of operational risk management principles.
Thus, information security risk management becomes as necessary a component of risk management as other operational risks.
Introducing the elements of artificial intelligence to bank process follows validation and continuous assessment of the quality of the model. This quality is directly related to the bank’s financial losses for the formation of a fund for payments to affected customers, the formation of a minimum regulatory capital to cover losses. Low quality model may cause reputational losses, which lead to an outflow of customers and, as a result, an increase in operating costs of marketing activities, growth of the salary fund for attracting additional specialists in the field of sales of banking products.
Evaluation for fraud risk in money transfer use various indicators, obtained from the client’s banking profile and mobile application. When a transfer is made between clients of the same bank, additional information for making a decision can also be obtained by evaluating the payee. Most often, when a fraudulent transfer occurs, it is difficult for attackers to determine the region of residence of the victim, his counterparties, detailed account information etc. For this case a random dropper bank account is used as the recipient. In the terminology of bank transactional anti-fraud, a drop is a person who, for a small fee, has a bankcard issued for himself and gives this card to the fraudster. These droppers cannot imitate the behavior of regular clients, so the factors of an atypical payee become a key in identifying such persons.
For a data sample for the study, we used the result of the work of the fraud monitoring system of one of the biggest banks in Russia. The system evaluates the transfer between two clients of this bank, and if it recognizes risk patterns, it blocks transactions. It is proposed to improve the efficiency of fraud detection, and reduce numbers of false positives that negatively affect the customer experience when using the bank’s mobile application. In addition, some clients who became fraudster victims may stop trusting a financial institution and stop using remote banking by withdrawing funds from their bank accounts.
The main presupposition for our framework is that fraudsters, having a large number of drop cards, are limited in creating a full client profile for these cards. Legitimate customers who use bankcards for their intended purpose make purchases in various stores, pay bills in restaurants, buy baby products, pet supplies, refuel cars etc. Fraudsters cannot fully imitate such client profile for their dropper cards. It is proposed to consider how the enrichment of the transfer payee’s profile will affect two main indicators of the effectiveness of the fraud monitoring system - the numbers of false positives and the recall of fraud detection. The novelty of this research is implementing classification of payments behavior of fraudster and regular payees to managing fraud monitoring indicators.
The application of machine learning methods in fraud monitoring discussed in Kewei et al. (2021), in which the authors compare traditional machine learning methods such as Naive Bayes and SVM with their approach based on multiple techniques, including feature engineering, memory compression, mixed precision, and ensemble loss. Izotova et al. (2021) are considering detecting financial credit card fraud in unbalanced data. The authors consider the homogeneous and heterogeneous Poisson process to determine the probability of fraudulent operations, and compare the metrics of classification algorithms using various ensemble methods like LGBM, XGBoost, CatBoost. The authors also consider the problem of false positives, which are also discussed in our paper. Dubey et al. (2020) are considering using the Neural Network algorithm with Backpropagation to score customer credit card transactions. Dornadula et al. (2019) in their research are using sliding window to aggregate the transactions made by users from different groups to recognize behavioral pattern of the group to choose the fraud pattern. Therefore, they compare metrics of different algorithms such as Isolation Forest, Logistic regression, Decision tree. Amarasinghe et al. (2018) shows a review of machine learning and outlier detection algorithms, like Bayesian Networks, Recurrent Neural Networks, SVM, Fuzzy Logic, Hidden Markov Model, K-Means Clustering, K-Nearest Neighbor that can be integrated into anti-fraud systems.
Han et al. (2013) presented a high dimensional classification method, named the Copula Discriminant Analysis (CODA). The method includes joint distribution of parameters in the naive Bayes classifier with a decision rule that assigns a class label for some observation. He et al. (2016), and Wang et al. (2019) also presented some other researches about CODA. This method is also mentioned in the paper of Eva Scheungrab (2013), who discusses the use of copulas in the discriminant analysis algorithm. In this paper, the author analyzed standard methods for classification like linear discriminant analysis and quadratic discriminant analysis compared with CODA method.
Data structure and framework
In our research, we use such bank metrics like Fraud Basis Point (FBP) and False Positive Ratio (FPR). To classify drop person in our research we use such methods as Logistic Regression (Logit), Linear Discriminant Analysis (LDA), Quadratic Discriminant Analysis (QDA), Artificial Neural Network (ANN), Random Forest, Gradient Boosting and CODA. The structure of ANN, Random Forest and Gradient Boosting hyperparameters and description of CODA algorithm are shown below.
Notation
To evaluate performance of anti-fraud system we use Fraud Basis Point (FBP) and False Positive Ratio (FPR) as measure of lost or saved money and quality of algorithms. FBP – indicates the level of fraudulent transactions missed by the system. It is measured in basis points (0.01%). The main task of the antifraud monitoring system is to minimize this indicator.
FPR – indicates the ratio of false fraudulent transactions detected by system to sum of all transactions, which passed by the system and it is measured in percepts.
The system for online transfers monitoring between bank clients for possible fraud should evaluate these transactions in a split second. This fact imposes certain restrictions on the use of machine learning methods to detect fraudulent transactions. In particular, in the chosen method, the model should be executed almost instantly for a large number of operations. It is proposed to consider an approach in which the FBP and FPR indicators are managed offline using machine learning methods and these restrictions will not affect the response time of the anti-fraud system.
It is proposed to evaluate all clients who actively use remote banking service in the mobile application for their similarity to the drop profile. This evaluation can be realized on a regular basis and then use the result as an additional parameter in an anti-fraud system online. Note that this approach, provides no limitations in the choice of machine learning methods, and it also becomes possible to use data for analysis from other sources, not only the history of using the mobile application and signs of the current transaction, but also, for example, the history of customer card transactions from other systems.
The idea of evaluating a client’s profile for similarity to a drop based on the observations of employees who investigate cases of fraud in banks. Example of a legitimate client’s transaction history shown in Table 1, Example of a dropper’s transaction history shown in Table 2.
Example of a legitimate transaction history
Example of a legitimate transaction history
Example of a dropper transaction history
Customers who actively use card services and make purchases naturally make a legitimate transaction history. Scammers do not have such an opportunity and their transaction history consists of only technical operations, such as requesting a balance, transfers for small amounts, connecting additional banking services, etc.
For data set in our study, we selected transfer transactions of a large Russian bank in a week, which the fraud monitoring system detected as a suspicious pattern and launched one of the processing scenarios for such transactions, for example, warning a client about possible fraud or completely rejecting an transaction. We also added transaction without triggers of the fraud monitoring system, but during the period under review, the client left a complaint that this operation was fraudulent. The missed and detected fraudulent transaction were combined and considered as a target class for binary classification. False positives are referred to as other class.
We mark fraud as 1, false positives as 0 and get the following table (hits_fm):
An example of a dataset (hits_fm) formed of a fraud monitoring system triggers
An example of a dataset (hits_fm) formed of a fraud monitoring system triggers
The data set does not include operations that the fraud monitoring system did not consider suspicious. This follows from the purpose of our paper which is not to build a new classifier to detect fraud, but to study the possibility of managing the FBP and FPR risk indicators using machine learning methods.
We have included all fraudulent transactions and the share of class 1 in our sample is 1.2%. Therefore, we build a baseline from the parameters of the initial classifier of the fraud monitoring system, which we use in evaluation of performance of our framework by calculating the FBP and FPR.
Assuming that in the original classifier precision equals 0.012, and recall equals 1, we calculate f1 measure:
We consider this
Next, we assume that if class 1 is specified in the hits_fm table, then the payee’s profile can be referred to as a drop, in case of 0, the payee’s profile is legitimate. For each payee, we can collect data with history of card transactions (Table 4). In order to approximate the experiment to the real transaction history, we use the history of operations that occurred in the two-week period before the first transfer to the client from the hits_fm. For example, the column “Transaction amount in group MCC_1” by client “ cl_2 ” contains the amount of all payments by the client that he made two weeks before the operation from Table 3. Selected groups of Merchant Categories Code shown in Appendix A.
Clients profile data set collected from customer card transactions history
We mentioned that feature selection and feature engineering is not the main aim of this paper. In this case, Table 4 collect to check our proposition about the difference in behavior between a legitimate client and a drop. Finally, this data was filtered by following criteria:
Excluded transactions blocked by the system for which bank did not receive feedback from the client about legitimacy of the operation. Excluded false positive transactions blocked by the system. Excluded transactions for which the history of card transactions by payee were not found.
After these filters our data set decreased by 3.9%. We split our data set to test and train sample in a ratio of 80% to 20%. It should be mentioned that algorithms were not validated for out-of-time samples.
In addition, we did not apply oversampling methods to increase the size of the minor class. Descriptive statistics, feature importance and correlation matrix within classes are shown in Appendix B.
The idea of the CODA is to build maximum likelihood functions, taking into account the copula density of explanatory variables within the class. Therefore, CODA discrimination rule is:
To realize CODA method, the following actions were performed:
Determined the distribution function of the values of each explanatory variable within the class, Determined the prior probabilities of the class, Determined copula family for explanatory variable within the class, Determined the values of the distribution density of the known copulas for each of the observations Build a classifier, which takes previously calculated values, and returns a class label for each class.
To build CODA classifier source data was reduced to 6 features, selected by ANOVA method with maximum score on these features, which shown in Appendix B. Those features are payments in:
Banking services in the office, Cash withdrawals, money transfers, Gambling, Money transfers, Flights. For these explanatory variables, CODA discrimination rule may writes as:
To build ANN we used MLPClassifier from sklearn library for Python. We transform our data with “power_transform” approach from module sklearn.preprocessing. “Power transforms” are a family of parametric, monotonic transformations that applied to make data more Gaussian-like. This is useful for modeling issues related to heteroscedasticity (non-constant variance), or other situations where normality is desired. Currently, PowerTransformer supports the Box-Cox transform and the Yeo-Johnson transform. The optimal parameter for stabilizing variance and minimizing skewness estimated through maximum likelihood. We also try “normalize” and “minmax_scale” transform, but it was not affected well. “Lbfgs” solver with “Relu” activation function used. Relu – the rectified linear unit function, returns
ANN have the following structure: 5 neurons on Input Layer, 4 neurons on Hidden Layers 1 and 2, 2 neurons on Output Layer.
Also, source data was reduced to 5 features, selected by ANOVA method.
To build Random Forest classifier, we used RandomForestClassifier from Sklearn. We select “log2” as max_features, which means that the number of features to consider when looking for the best split in tree is equal of base 2 logarithm from number of features in data. We select default parameter n_estimators equals 300 which means number of trees in the forest. For Gradient boosting we used GradientBoostingClassifier from Sklearn with n_estimators equals 300, max_depth equals 7 which means The maximum depth of the individual regression estimators with “deviance” loss function. This loss function used for classification with probabilistic outputs. Logit, QDA, LDA selected from “statsmodels” library in Python.
Classification metrics and framework conclusions
Classification metrics are show in Table 5. We select F1 score as a measure of performance for our classification. Therefore, Random Forest and Gradient Boosting shows better performance by this metric, for these methods we plot a precision-recall curve (Fig. 1).
Classification metrics
Classification metrics
Precision-recall curve for Random Forest and Gradient Boosting.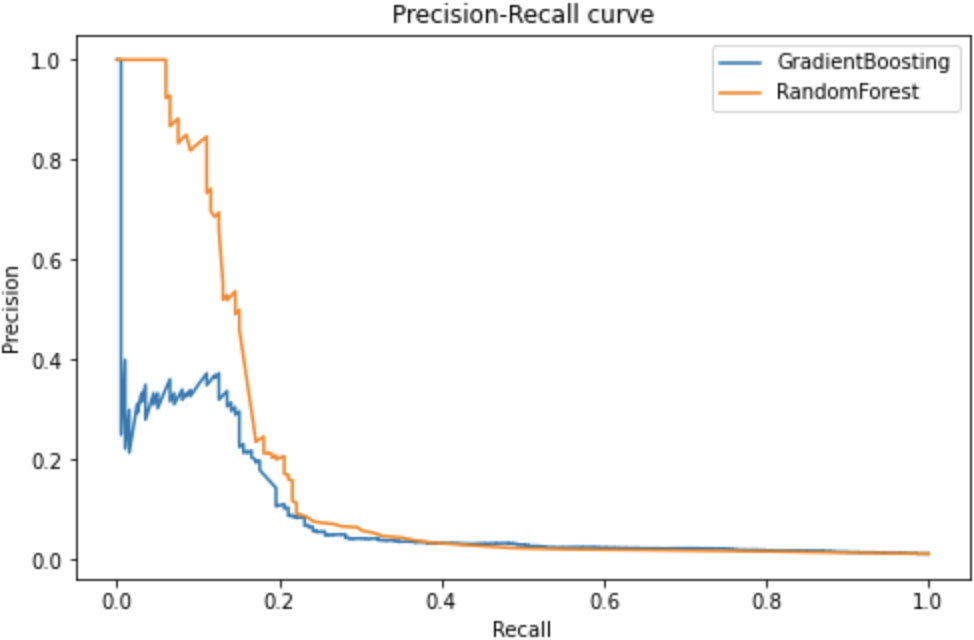
The results of experiments showed the efficiency of the proposed framework – integrating the history of customer card transactions as additional features in evaluation of transfers initiated in the bank’s mobile application. This approach can be developed to improve the performance indicators of FBP and FPR by generating new features from history of card transactions and search for the best parameters for machine learning classifier. At this stage, we can conclude that classifiers based on decision tree analysis show the best result in terms of managing FBP and FPR indicators.
Previously, we did not consider the parameters FBP and FPR in terms of business value. These indicators are useful in assessing the quality of the anti-fraud system and in managing the risks associated with remote banking processes. FBP shows the overall efficiency of fraud monitoring systems in terms of missed funds and allows you to assess how close the bank is to the critical values of international payment systems or local banks regulator. FPR also shows the effectiveness of the system, however, the bank always has to balance the FBP and FPR, choosing the best ratio of these indicators. Bank also has to follow the constant level of approval rate, determinable by international payment systems and other members of e-commerce. Theoretically, a fraud monitoring system can block all operations, and then FBP will tend to a minimum, but high FPR value leads to increases of reputational risk, which may lead to customer churn and negative reviews in mass media, and increased costs for offline analysis of suspended operations. The load on the fraud monitoring system and related remote banking systems is also increasing, which can lead to disruption of servers and provoke IT incidents. Including machine learning methods in bank process follows continuous validation and assessment of the quality of the model. This quality is directly related to the bank’s financial losses for the formation of a fund for payments to affected customers and the formation of a minimum regulatory capital to cover losses. Suppose a case in which the volume of fraudulent attempts tripled in a calendar year, and the bank’s turnover increased by 52%. Each line reflects the dynamics of the FBP indicator, depending on three different scenarios:
The model is not validated or updated. The model is validated, but its performance remains constant. This case is better than the previous one in relation to the FBP dynamics; however, with the growing volume of fraud, the dynamics remains negative. The model is validated, the performance is growing, and FBP has a positive trend.
Three different scenarios of FBP dynamics.
Due to the growth of the market for remote banking systems, it becomes necessary to introduce regulatory requirements from the regulators and FPB and FPR can become such indicators. These indicators can be decomposed within a financial institution, taking into account its organizational structure, for example, antifraud system downtime costs, call center costs, IT equipment costs, hiring specialists, etc. Therefore, a framework for the dependence of the macro indicators FBP and FPR on the work of the company’s structural divisions can build.
In this article, we have proposed a possible scenario for managing cyber risk using machine learning techniques. A framework for improving the antifraud system using data enrichment from the history of the client’s operation is presented. The proposed framework showed an increase in the quality metrics of the algorithm compared to the previous solution, which led to an increase in the macro indicators FBP and FPR measured at F1-score (Table 5). The importance of FBP and FPR management from the point of possible losses in realization of cyber risks of external fraud is shown.
Further, the authors plan to extract more features from a client’s transaction history, try to optimize hyperparameters of machine learning algorithms. In addition, we will decompose FBP and FPR indicators to show approaches to managing of cyber risks.
Footnotes
Appendix
Colleague, this is the second reference in the link.
Card Fraud Losses Reach $28.65 Billion (2020), n.d. URL https://nilsonreport.com/mention/1313/1link/ (accessed 7.2.21).
The information about “$ 40 billion in global fraud by 2027” is in the full version of a report that I got on my Job.
This is a link to the full report.
Appendix A: Description of Merchant Category Code group
Description of MCC groups
Column label
Merchant Category Code group
A
Car rent
C
Cash withdrawals, money transfers
F
Restaurants, fast food
H
Hotels
J
Utilities
O
Professional services (medicine, healthcare, etc.)
R
Retail Stores
T
Wholesale Stores
U
Gambling
X
Flights
Z
Money transfers
Q
Banking services in the office
Appendix B: Data description
Descriptive statistics for data in class 0
A
C
F
H
J
O
Q
R
T
U
X
Z
Mean
110
417560
2345
1729
222
24
749
73161
420
296545
3737
250011
Std
2931
1028781
122660
81139
2768
1150
15540
260628
17320
924418
78068
1150206
Min
0
0
0
0
0
0
0
0
0
0
0
0
25%
0
4230
0
0
0
0
0
2475
0
1500
0
300
50%
0
37975
0
0
0
0
0
11317
0
20600
0
16904
75%
0
310000
950
0
0
0
0
42673
0
150732
0
114501
Max
4,23E+05
2,37E+07
3,49E+07
7,75E+06
2,50E+05
1,99E+05
1,48E+06
2,20E+07
3,33E+06
2,52E+07
1,99E+07
2,37E+08
Descriptive statistics for data in class 1
A
C
F
H
J
O
Q
R
T
U
X
Z
Mean
16
192822
902
117
111
0
5211
70896
149
131215
323
153351
Std
415
531192
3444
1229
1461
0
47155
221827
1024
436348
2858
451968
Min
0
0
0
0
0
0
0
0
0
0
0
0
25%
0
3000
0
0
0
0
0
1297
0
0
0
953
50%
0
19800
0
0
0
0
0
7494
0
5071
0
11900
75%
0
99800
431
0
0
0
0
36972
0
33510
0
68801
Max
1,26E+04
4,58E+06
7,26E+04
2,76E+04
2,98E+04
0,00E+00
5,40E+05
2,57E+06
1,57E+04
4,78E+06
5,69E+04
5,65E+06