
Abstract
Different methods for obtaining new probability distributions have been introduced in the literature in recent years, for example, (Gupta et al., 1998) proposed an interesting uni-parametric lifetime distribution, Exponentiated Gamma (EG), which hazard function has increasing and bathtub shapes. In this paper, we build a new two-parameters distribution, the Marshall Olkin Extended Exponentiated Gamma (MOEEG) distribution, which is derived from the Marshall-Olkin method and the EG distribution. The hazard function of this new distribution can accommodate monotonic, non-monotonic and unimodal shapes, allowing a better fit to greater data variability. In addition to the great flexibility of fitting the data, it contains only two parameters providing a simple parameter estimation procedure, unlike other distributions proposed in the literature that have three or more parameters. Some properties of the new distribution considered in this paper are presented such as
Keywords
Introduction
Survival analysis is an area of Statistics which statistical methods are used in data analysis where the variable of interest is the lifetime or failure of a particular item under study. This branch, in general, deals with the usual parametric and non-parametric methods for analyzing time-in-event data that are useful when some observations are censored, that is, the event of interest was not observed in all items during the follow-up period. The most used procedures include life tables, the Kaplan-Meier estimator for the survival function, the Cox proportional hazards model and parametric survival models.
In general, parametric models are more flexible than Cox proportional hazards model, especially when there is no proportionality of risks between groups and are based mainly on two important functions, the survival and hazard functions. These techniques are described in several textbooks as (Klein & Moeschberger, 2006; Kleinbaum & Klein, 2010; Kalbfleisch & Prentice, 2011). However, some parametric models as the exponential distribution, that is widely used for data analysis, is preferable for situations in which the hazard rate is constant. In case of monotonous failure rate, Weibull and Gamma distributions are often used (Singh et al., 2015). Different hazard function are necessary to model the various studies case, that is, according to (Hjorth, 1980), one or two parameters distributions have some important limitations such as the inability to model data that presents a bathtub risk function. On the other hand, more flexible distributions with a large number of parameters may have inaccurate estimates when sample size is small.
The construction of new distributions providing different hazard functions that can be applied to various types of data is an important research topic. Thus, our main goal in this paper is to create a new lifetime distribution that allows fit different datasets with few parameters and non-monotonous failure rates taking various shapes.
We propose a new two-parameters lifetime distribution, as a direct extension of the one-parameter Exponentiated Gamma distribution (EG) introduced by (Gupta et al., 1998). The distribution is obtained by compounding the EG distribution with a Geometric distribution based on competing and complementary risks method. It will be referred as the Marshall Olkin Extended Exponentiated Gamma (MOEEG) distribution. The hazard function of the MOEEG distribution can assume various shapes for different values of the parameters, such as increasing, bathtub and unimodal. This distribution can be very well applied to reliability/survival problems and its properties are investigated in this paper. We also explore two important inference approaches to estimate the parameters of MOEEG distribution as maximum likelihood and Bayesian methods. Based on simulation studies we compare their performance.
The paper is organized as follows: in Section 2, we present a brief description of Marshall-Olkin, competing and additional risks, and composition methods for the generation of a probability distribution. Section 3 presents the proposed distribution and some mathematical properties. The estimation of parameters are based on Bayesian and classical approaches provided in Section 4. A simulation study is carried out along with its results and presented in Section 5. An application involving survival data related to exposition of rats to poisons is shown in Section 6 to illustrate the usefulness of the proposed distribution. Finally, Section 7 closes the paper with some concluding remarks.
Methods for generating probability models
In this section some methods are presented based on the literature to generate continuous probability models. The first and most commonly used for building a new distribution is the method of composition between models. The second and third methods are based on competitive and additional risks. They are not very common but can derive good flexible models for survival data. In addition to these, we have the Marshall-Olkin method also widely used to build a new continuous probability model, even in the multivariate case (de Oliveira & Achcar, 2020).
Composition between distributions
From the Exponentiated Gamma distribution and by the composition of the distributions process, we obtained a new distribution called Geometric Exponentiated Gamma. For this, consider a random sample
Considering the theory of competing risks, the shortest lifetime is observed among all failure factors, while with the theory of additional risks, the longest time is observed among the same factors, assuming
Let
Thus, the marginal pdf of
In the sum obtained in the Eq. (3), we have
and consequently, the marginal pdf of
The random variable
Let
In the same way competing risks, we have the marginal pdf of
The distribution of
Marshall and Olkin (1997) presented a method for generalizations probability distributions assuming a new parameter
where
and the hazard function is given by:
Marshall and Olkin (1997) modified the exponential distribution based on the Eq. 9 denominated two-parameters Exponential Distribution, which can be an alternative of two parameters distributions introduced in the literature as the Weibull, Gamma and Log-normal distributions. The same modification was applied for the Weibull distribution, resulting in the Weibull distribution with three Parameters. Marshall and Olkin also developed bivariate versions of these distributions.
The three parameters Weibull distribution, obtained by Marshall Olkin extension, was studied by (Zhang & Xie, 2007). One of the important properties of this distribution is the functional form of hazard function which could be increasing, decreasing or bathtub shaped, and its particular case is the Weibull distribution for
On other hand, using the method proposed by (Marshall & Olkin, 1997), (Thomas & Jose, 2004) introduced the Marshall-Olkin bivariate semi-Pareto distribution (MO-BSP) and Marshall-Olkin bivariate Pareto distribution (MO-BP) and studied several characteristics of these distributions. (Ghitany et al., 2007) investigated the properties of the inclusion of a new parameter by the method of Marshall and Olkin, based on Lomax model, also known as Pareto distribution second type. The authors showed that the proposed distribution can be expressed as a mixture model of exponential distribution using the maximum likelihood method to estimate the parameters of the distribution.
Considering now that
and
where
Both survival functions can match if we made a new re-parametrization
In order to understand the geometric-extreme stable property it should be remembered that the extreme value distributions are limiting distributions for extreme, hence they are sometimes useful approximations. In practice, a random variable of interest may be the extreme of only a finite, possibly random, number
The function in Eq. (13) is the pdf of the new proposed distribution called Marshall Olkin Extended Exponentiated Gamma (MOEEG). The behavior of the pdf Eq. (13) is illustrated in Figs 1 and 2, for different values of
Density function for different values of 
Density function for different values of 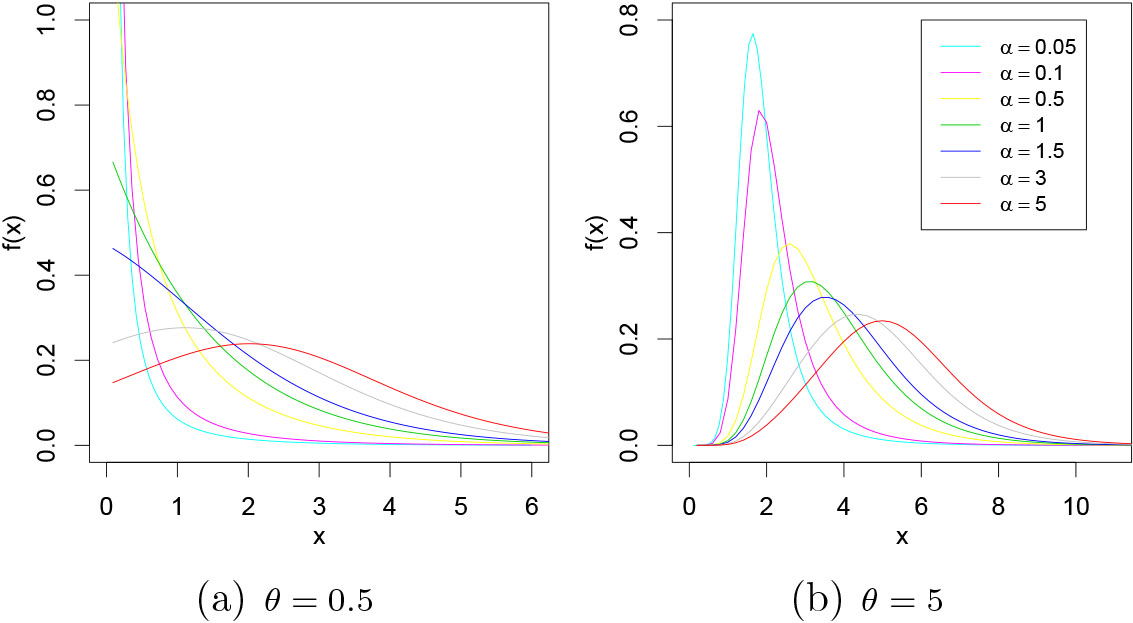
The MOEEG hazard function is given by:
where
Hazard function for different values of 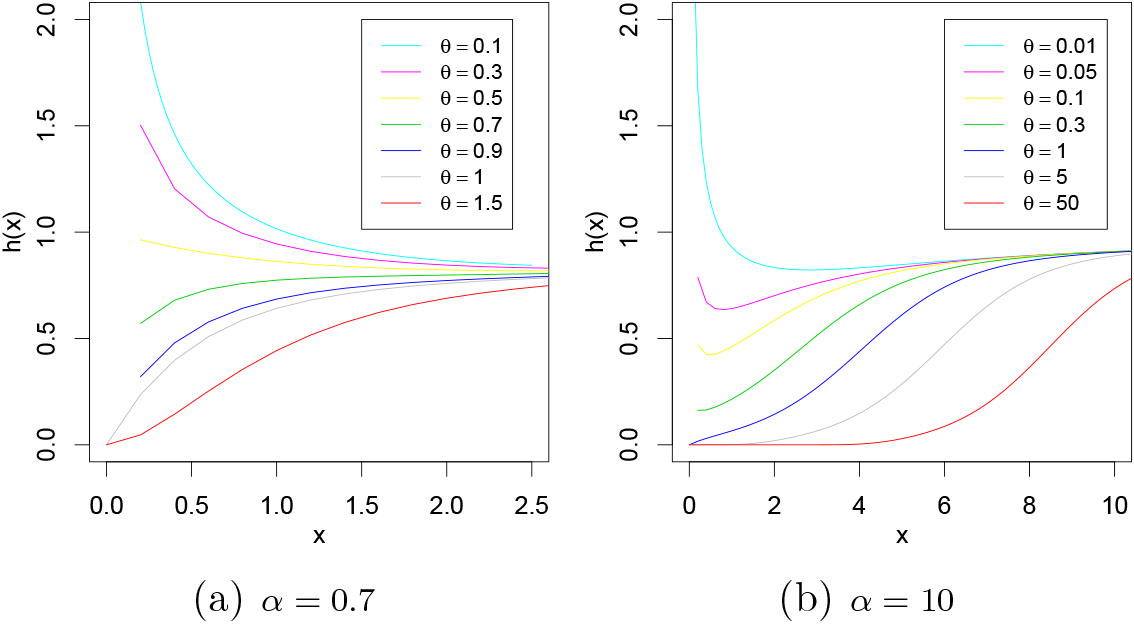
Hazard function for different values of 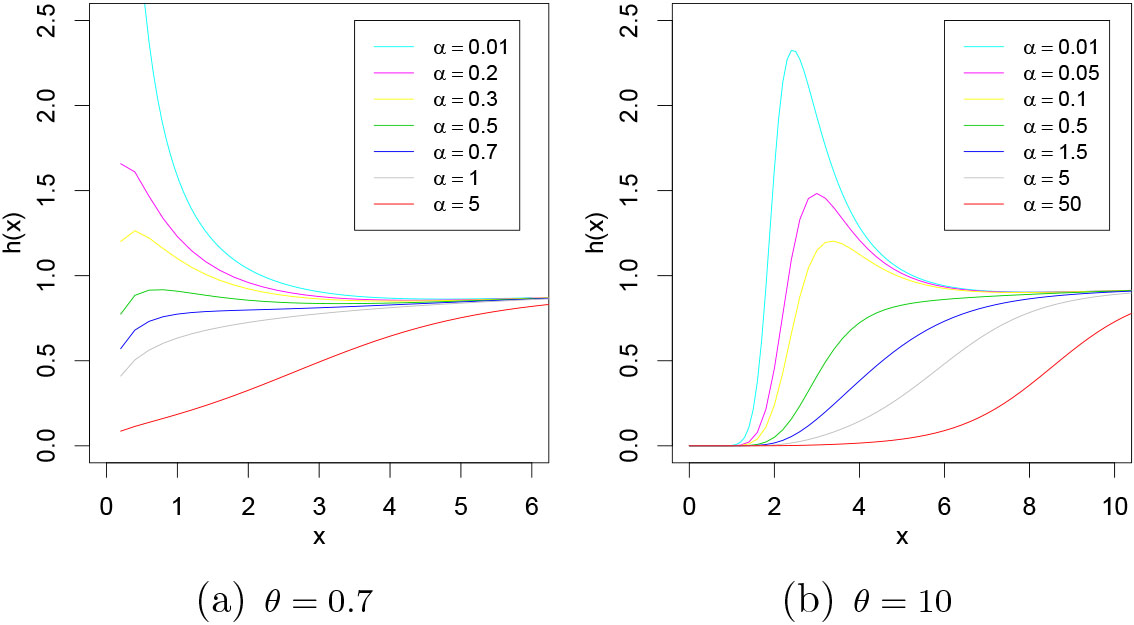
The MOEEG cumulative and survival functions are given, respectively, by:
where
.
Let
Proof..
Based on the expansion in Taylor series for
is obtained and the resulting density is given by
Now, using the series expansion with
the pdf could be rewritten as
Therefore, using the binomial expansion and also the following transformation:
the pdf could be described as follows
and the proof is complete. ∎
This form of writing the density function facilitates obtaining its integral for calculations of the
Moments of MOEEG
The general expression of expectation, the
The
and now, using the theorem 1 the
The moment generating function (mgf) of a random variable is an alternative specification of a probability distribution.
Let
since
Skewness is a measure of symmetry, or more accurately, the lack of symmetry. A distribution is symmetric if the tails, both the right and the left of the center point are equal. The value of the asymmetry can be positive, negative, or even undefined. The asymmetry formula below is known as the skewness coefficient Fisher-Pearson.
The kurtosis is a measure of the “tailedness” of the distribution that characterizes the peak or “flattening” of the curve of the pdf. Data sets with high kurtosis tend to have heavy tails, or outliers. Low kurtosis tends to have slight tails, or lack of outliers. The standard kurtosis measure is based on a reduced scale version of the fourth moment of the data or population (Pearson, 1905). It is defined as:
Table 1 shows that the variance of MOEGG distribution is an increasing function when the skewness and kurtosis are decreasing functions of the parameters.
Skewness and Kurtosis Table
Suppose a component survives up to time
Again, using the Theorem 1, the
Solving the integral in Eq. (22), the
where
On other hand, the mean residual life (mrl) function is a particular case of the
Using the Eq. (23) and
Note that, taking
In terms of reliability, it is known that the mean residual life function and the ratio of two consecutive moments of residual life determine the distribution exclusively (Lata Gupta & Gupta, 1983). On the other hand, the time elapsed since the failure of an item on condition that this failure has occurred in
Using similar arguments as used for Eq. (23), the
where
Suppose now that a component with lifetime
The mean past lifetime (mpl) is a particular case of
The simplest way to compare two random variables is comparing their expected values. However, this comparison is not very informative since it is based only on two numbers. Furthermore, in most situations information about the behavior of the random variable have become much more detailed, such as its distribution functions, Laplace transforms, generating moments functions, hazard functions and other functionals. The comparison of these characteristics of random variables results in the establishment of different relationships stochastic order among these same random variables, much more informative than the mere comparison of their expected values (Szekli, 2012).
The simplest and most popular method of comparing the magnitudes of two random variables is through their means and medians. It may happen that in some cases, the mean of
Distributions ordering, particularly among distributions that model lifetime play an important role in the statistical literature. Six different stochastic orders were considered, the usual, likelihood ratio ordering, mean residual life order, reverse hazard rate order, hazard rate ordering, and expectancy for two MOEEG independent random variables. In this way, if
stochastic order hazard rate ordering reverse hazard rate order mean residual life order likelihood ratio ordering
Following (Kochar, 2012), we have the following implications chain between the stochastic orders:
.
Let
Proof..
Given the ratio of the likelihoods
The entropy of a random variable measures the variation of the uncertainty. A large value of entropy indicates the greater uncertainty in the data. Some popular entropy measures are Rényi entropy (Rényi et al., 1961) and Shannon entropy (Shannon, 1951). In this section, the expressions for these measures are determined for MOEEG distribution.
Rényi Entropy is a measure of variation of uncertainty that has been used in many applications and characterizations of probability distributions. Rényi entropy is defined as:
Using the same series expansions given in Theorem 1 was obtained the following expression:
The Shannon entropy concept refers to the uncertainty of a probability distribution and the measure that has been proposed is intended to quantify this uncertainty. The Shannon entropy draws attention to the fact that the entropy
According to (Fattah et al., 2017), the Shannon entropy is:
Since the proposed limit has indeterminate form
where
The amount of scatter in a population is evidently measured to some extent by the totality of deviations from the mean (in the case of a symmetrical distribution) and the median (in the case of an asymmetrical distribution). If
The mean deviation can be simplified as (more details on this simplification can be found in (Nadarajah & Kotz, 2006):
where
Considering the pdf defined in Eq. (13), we have
The result is analogous for
Bonferroni and Lorenz curves were proposed by (Bonferroni,1941). These curves have applications not only in economics to study income and poverty, but also in other fields like reliability, demography, insurance and medicine.
Bonferroni curve is defined as:
Now, solving this integral for pdf of the MOEEG distribution, we have
where
The Lorenz curve is a graphic representation of the empirical cumulative distribution function of the probability distribution of wealth. In such use, many economists consider it a social inequality measure to represent the unequal distribution of wealth. Lorenz curve is calculated as:
Applying in the MOEEG distribution, we have
The order statistics play an important role in Statistical Inference, and are for the population quantiles as the sample moments are for the population moments. It is known that
for
Moments of order statistics play an important role in quality control testing reliability to predict the failure of future items based on the times of few early failures. The
Some researches that involve a stress-strength model have an interest in the estimation of reliability denoted by
In the stress-strength modelling,
For
This section presents the Maximum Likelihood and Bayesian estimation methods to obtain estimates of the parameters
Maximum Likelihood method
Suppose we have a complete random sample
The Maximum Likelihood Estimators (MLE) of the parameters
Deriving Eq. (48) for the parameters
The MLE
where
with elements:
and
The previous results are used to compute the
where
In a Bayesian analysis, the inference is based on the posterior distribution of parameters
The prior distribution represents the knowledge or uncertainty state about the parameter
A common specification of prior considered in the literature is given by the product of independent prior distributions. Therefore, for the MOEEG distribution we consider the product of Gamma prior distributions given by
where the hyperparameters
Thus, the joint posterior distribution for the parameters
As we are unable to find an analytic expression for marginal posterior distributions and hence to extract characteristics of parameters such as Bayes estimators and credible intervals, we need use the MCMC algorithm to obtain a sample of values of
The following steps are considered:
Propose an auxiliary distribution that generates possible values of Start counter Choose an initial value for Generate a value for Test the condition If the condition is satisfied: If the condition is not satisfied: Repeat it until you reach the convergence.
Simulation results
In this section a simulation study is carried out in order to compare the performance of the proposed inference approaches: Maximum likelihood estimation and Bayesian estimation. To accomplish this goal, we have generated
To compare the different estimation methods for each parameter, we computed the bias, root mean-squared error, average absolute difference between the true and estimate distributions functions and the maximum absolute difference between the true and estimate distributions functions as:
respectively.
Other criterion for comparison of the estimation methods consists on checking the frequentist coverage probabilities of the intervals for each parameter of the distribution. Table 2 shows the values of the parameters obtained by different estimators where it could be seen that the Bayesian estimator tends to be less biased than the maximum likelihood estimator.
From Table 2, we observe that the Bayesian approach presents, in general, the bias a little smaller than the maximum likelihood method for small sample size
An application was carried out to test the fit of the new MOEEG distribution with others already existing in the literature. For this purpose the dataset from (Box & Cox, 1964), which provide the lifetime of 48 animals exposed to certain types of poisons and then to certain types of treatments, was used. We can observe from the TTT-Plot in Fig. (5) that the hazard function is increasing.
TTT plot.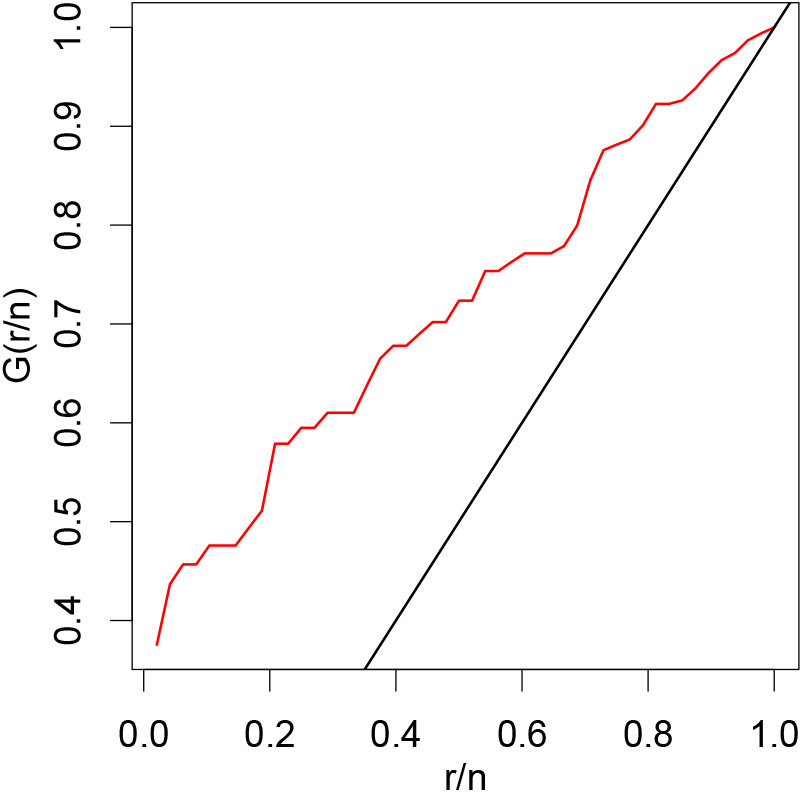
Distributions considered for comparative purposes and their respective estimated parameters by the likelihood approach consist of the MOEEG with
Several common criteria proposed in the literature can also be used for model selection. These include Akaike’s Information Criterion (AIC; Akaike (1974)), the Bayesian Information Criterion (BIC; Schwarz (1978)), Bozdogan’s consistent AIC (CAIC; Liang and Zou (2008)). These criteria essentially take into account the complexity of the distribution (number of parameters), sample size, among other conditions. The best model will be the one that represents a lower value to AIC, BIC e CAIC.
Selection criteria for the proposed model
Adjusted distributions.
From Table 3 we conclude that the MOEEG distribution had a good fit for the proposed dataset, after all, its results were better than the other distributions compared. Therefore, we show the flexibility of the new distribution proposed in this paper making it a good alternative to fit many data types.
In this paper, a new probabilistic distribution MOEEG was introduced based on the composition and Marshall-Olkin methods. Some properties and results were derived for MOEEG distribution such as
The main advantage of the proposed distribution is the possibility of the hazard function taking different shapes as monotonic, non-monotonic or unimodal, allowing great flexibility to fit different datasets. Besides, another advantage of this distribution is the presence of only two parameters providing a straightforwardly estimation procedure, mainly in computational aspects.
In conclusion, the results presented in this paper reinforce the fact that the search of appropriate lifetime distribution could be extremely difficult, especially, depending on the shape of the empirical hazard function of the data. The proposed methodology could be very useful due the flexibility of the generated model, especially in the medical data analysis. The results could be also extended to other cross-over trials in clinical issues, reliability analysis in engineering, risk analysis in economics, among many others areas.