
Abstract
This study focuses on the use of digits-based test in anomaly detection in presidential elections in Ghana. Even though Ghana has conducted several successful elections to elect presidents, the outcomes of the elections have been challenged in courts on allegations of vote rigging and fraud. It has been established in the literature that for an election to be anomaly free, the following should be satisfied: the distribution of voters turn-out, the winners’ share and total valid votes cast in the election should be uni-modal. Therefore, we assess the applicability of both first and second digits-based tests to aid in the detection of possible anomaly in the 2016 and 2020 presidential election results data in Ghana. The Benford frequency distribution and Spearman rank correlation coefficient tests were used for the analysis of data obtained from the Electoral Commission of Ghana. The results show that the observed first digits distributions of valid vote counts for both New Patriotic Party (NPP) and National Democratic Congress (NDC), and the total valid votes cast (TVVC), in 2016 and 2020 are consistent with the distributional pattern of first digits postulated by Benford’s Law. However, the findings of the distribution of second digits of the valid vote counts for NPP and total valid vote cast in both 2016 and 2020 elections do not satisfy the probability distributional pattern of second digits according to the Benford’s Law. In view of these, we recommend using the first two digits-based tests to check for consistency of possible election anomaly between the first and second digits since it conveys more information.
Keywords
Introduction
In many naturally occurring groupings of numbers (such as annual earnings and election vote counts), the observed frequencies of leading digits are not uniform, despite what one may first assume. Instead, smaller numbers are more probable than more significant numbers to appear as the first digits. Formann (2010) shows that over 30 per cent of the entries in datasets begin with a 1, 18 per cent with a 2, and so on until the less frequent starting digit, 9, which occurs only about 5 per cent of the time. According to the digital law of Benford, these are the anticipated frequencies of these digits. Therefore, given empirical frequencies involving the distribution of digits in numbers, Benford’s law can be used for digit-based analysis to screen numerical datasets for anomalies such as false or fraudulent data. The digit-based study uses goodness-of-fit tests such as the Pearson Chi-square test among others, with a null hypothesis signalling compliance with the expected Benford’s law (da Fonseca, 2016). Also, in comparing the distribution of the hypothetical digits constructed by Benford and the observed distribution of the digits, both Deckert et al. (2011) and Mebane Jr (2013) suggest using Benford’s expected values and the mean of the distribution of the digits. However, the mean value is a weaker approach to establishing a possible election anomaly claim. Bërdufi (2014) therefore suggested the use of a non-parametric method for the analysis of digits distribution as a more robust technique in establishing the correlation between Benford’s distribution of digits and observed digits distribution.
For countries practising a democratic system of governance, free and fair elections are one of the tools used to sustain their democracies. A valid statistical technique employed by most researchers around the globe for detecting possible fraud or anomaly in elections is termed “election forensics”. Examples of these election forensics are the digit-based tests adopted from the popular Benford Law (Breunig and Goerres, 2011). Levin et al. (2009) have established that the distribution of the voter turnout only need not be uni-modal (possible absence of fraud or anomaly) to give strong evidence of an anomaly-free election. However, the distribution of the winners’ share and total valid votes cast in the election should also be uni-modal to guarantee the conclusion of a possible anomaly-free election.
Electoral irregularities and breaches are not new to Ghana’s electoral politics: they have electoral politics. They have characterized almost every election in the Fourth Republic of Ghana. For example, the election results in 2012 and 2020 were challenged in the Supreme Court (SC) of Ghana by the NPP and NDC respectively. The paths so far taken by the political parties, that is, resorting to court in settling such electoral disputes, are in tune with democratic practices. Rulings of the SC have contributed immensely towards calming the nerves of people and reducing the political tensions in the country during these periods. However, the phenomena continue to threaten the country’s quest for an enduring democracy. This is particularly so because, on such occasions, the political tempo rises, causing tension, insecurity, and demonstrations that sometimes turn violent. One would have thought that given the over three decades of the existence of the current democracy and the continuous desire of Ghanaians to maintain the status quo, the recent irregularities would have been a thing of the past, but this appears not to be the case as the anomalies continue to linger on (Aggrey-Darkoh &Asah-Asante, 2017; Jeffries, 1998; Nugent, 1995; Clarke, 1992).
In addition, experiences from Africa and Latin America indicate that such problems, if not handled properly, can lead to democratic reversals, where the inability of democracies to deliver the needed dividends has led to the return of the authoritarian rule (Ayee, 1998; Boafo-Arthur, 2008; Aggrey-Darkoh & Asah-Asante, 2017). Even though Ghana has had a stable democracy since the early 2000s, the presidential elections have been characterized by allegations of vote rigging by losing political parties and candidates. These parties/candidates have contested the results in the country’s high and supreme courts. Therefore, the importance of scientifically assessing anomalies in these elections over the years cannot be overemphasized. In this regard, we employ digits-based tests, i.e., the first and second, to Ghana’s presidential election results in 2016 and 2020. Specifically, the priority of this study is to determine whether the observed frequency distribution of the first and second digits of the valid votes cast for Ghana’s two most prominent political parties (NPP and NDC) and the total number of valid votes cast in the 2016 and 2020 presidential elections deviate from both frequencies of first and second digits distributional pattern postulated by Benford’s Law.
Digits-based tests as an election forensics technique have been employed in the detection of fraud or anomalies in elections in several countries: Nigeria (Tunmibi & Olatokun, 2021), Egypt (Ketchley, 2021), Afghanistan (Weidmann & Callen, 2013), Russia (Bader & Van Ham, 2015; Kalinin & Mebane, 2017), United States of America (Mebane et al., 2008), Albania (Bërdufi, 2014) and Iran (Mebane Jr, 2010; Roukema, 2014). In the case of Ketchley (2021), Benford’s second and last digits were used to analyze the 2018 presidential elections held in Egypt. The observed mean value of the second digits of the 13,087 polling stations deviated significantly from Benford’s expected mean value of 4.186, raising suspicion of a possible election anomaly. Similarly, the distribution of the last digits to the observed voters’ turnout demonstrated an absolute deviation from Benford’s anticipated uniform distribution, indicative of a data integrity problem.
Also, to complement Benford’s law, a local bootstrap method was adopted by Roukema (2014) to analyze possible election anomalies of the Iranian 2009 presidential elections using first digits frequencies of the vote count. The proposed local bootstrap method was first calibrated on the restricted set of first rounds of five presidential elections (2002–2006) before being applied to the 2009 election. Excess vote counts beginning with digit 7 led to other anomalies (one of these anomalies was significant at 1% and two at 0.1%) were observed. It was further disclosed that unless the five elections (2002–2006) favouring candidate A are taken into account, the Iranian pre-election opinion polls significantly contradict the official results. Thus, candidates R and K suffer an abrupt (70%
Aside election anomaly detection, Benford’s law has been applied in many fields, including the determination of annual growth rates (Nye & Moul, 2007), forecasts of financial statement (Varian, 1972), balanced account data anomaly detection (Nigrini & Mittermaier, 1997; Nigrini, 1999, 2012, 1993; Asllani & Naco, 2014), income tax (Nigrini, 1996; Berger & Hill, 2015), stock market indices (Zhao & Wu, 2010), stock market prices (Pietronero et al., 2001), frequency of prime numbers (Luque & Lacasa, 2009), survey data (Judge & Schechter, 2009; Kaiser, 2019), image forensics (Crisan et al., 2021) and fraudulent scientific data (Diekmann, 2007). This study seeks to show how the digital distribution of valid votes cast for NPP and NDC and total valid votes cast (TVVC) can help detect possible anomalies in elections.
Therefore, in this research, we test the following hypotheses:
The remainder of the paper is organized as follows. Section 2 discusses the data and methods used for the study. Section 3 presents the results and key findings, while Section 4 presents the results of hypotheses testing. In Section 5, concluding remarks, recommendations and areas of future studies are provided.
The study made use of secondary data comprising of 2016 and 2020 presidential election certified results based on the 275 constituencies in Ghana. The data was obtained from the Electoral Commission (EC) of Ghana, and it is available at https://ec.gov.gh/. A purposive non-probability sampling procedure was employed in selecting the 2016 and 2020 presidential elections conducted in Ghana. The two major political parties in Ghana (NPP and NDC) were included in the study because of their vote share since the first election in 1992 – with at least five digits of total valid votes cast. A function was created to extract a vector of the first and second digits of valid vote counts (both NPP and NDC), and Benford’s observed and Benford (expected) proportions, using the certified election results in the 2016 and 2020 presidential elections respectively. Likewise, a vector of the first and second digits of TVVC was also extracted with their corresponding observed proportions. Lesperance et al. (2016) assert that many researchers, in an attempt to demonstrate conformance with Benford’s Law, use simple statistical techniques such as visual plots and individual confidence intervals for digits probabilities, among others. However, these methods may be inaccurate and inefficient while lacking statistical power to detect departures from Benford’s Law. Furthermore, da Fonseca (2016) states that the classical significance tests with fixed dimensions have more power in large samples, and hence, are able to detect divergence from Benford’s law. However, this may result in the rejection of Benford’s law in samples where the deviations from it are without practical importance, and consequently non-erroneous or anomaly free samples are likely to be classified as erroneous or fraudulent. As a results, in this paper, we resort to the Benford’s frequency distribution and Spearman’s rank correlation coefficient (SRCC) tests are the main statistical tools used for the analysis of data obtained from the Electoral Commission of Ghana to override the limitation of using the traditional classical test of hypothesis discussed above.
Hypothesis testing
The Benford first-digit mean is given by,
where
Similarly, the Benford second-digit mean is given by,
where
The non-parametric SRCC correlation test is adopted for the study to address deviation from normality assumption. Also, the digits (observed first and second digits for the votes and expected first and second digits of Benford’s distribution) under consideration are ordered categories.
Digit analysis detects fraudulent or erroneous data based on empirical regularities regarding significant digits. In digit analysis, a baseline frequency distribution representing normal behaviour is modelled, and then some particular datasets are tested to see if they deviate significantly from it (Bolton & Hand, 2002). Specifically, the application of Benford’s Law to detect false or erroneous data is just a more complex form of digit analysis. Varian (1972) was the first researcher to propose the application of Benford’s Law to digit analysis. Newcomb (1881) and Benford (1938) each after the realization of the numerical phenomena existence of any given digit derived the empirical probabilities of occurrence of the first and second digits. Benford (1938) later extended this phenomenon by providing the empirical probabilities of the occurrence of any digit.
The marginal probability mass function (PMF) of the first digit
Likewise, the marginal probability mass function (PMF) of the second-digit
Thus, it can be observed that the marginal probability mass function (PMF) of the
In general, for the first
We note that, Eqs (1) and (2) are used for the computation of the Benford’s first and second digits’ mean values respectively and these formulas were used in the calculation of all the other mean values.
For example, in Table 1, the first digit mean value of NPP was calculated as follows:
and the first digit mean value of TVVC was calculated as:
Likewise, in Table 3, the second digit mean value of NPP was calculated as:
and similarly all the other are obtained as shown in Tables 1–4.
The empirical findings from the study are presented in this section.
Distribution of first digits in 2016 and 2020 elections
First, we apply Benford’s first digit distributional pattern in (3) to the valid vote cast for NPP and NDC in the 2016 presidential election in Ghana, and the results are shown in Table 1. The distribution of the observed frequency of each digit is shown in the table, together with the corresponding Benford proportions. It can be observed that the mean value of the NPP’s 2016 distribution of valid votes of 2.902 is closer to the expected value of 3.441 under Benford’s law compared to the NDC’s expected value of 2.675. Also, according to Table 1, several observed proportions of the total valid votes cast in the 2016 presidential election differ from Benford’s proportion. The first-digit distribution has digit six closer to Benford’s posited proportion for the TVVC in 2016. The Benford mean value of the first digits, 3.441, in 2016, is closer to the observed mean of 3.402.
Distribution of frequency of first digits for NPP, NDC and TVVC in 2016
Distribution of frequency of first digits for NPP, NDC and TVVC in 2016
In addition, Table 2 presents the probability distribution of the first digits of valid votes cast for NPP and NDC in Ghana’s 2020 presidential elections. The frequency distribution of each digit’s observed counts is also shown in the table, along with the corresponding Benford’s predicted proportions. Similar to the 2016 election results, the observed mean value, 2.979, of the distribution of the first digits of valid votes cast for NPP is closer to Benford’s projected mean value of 3.441 than the NDC.
Distribution of frequency of first digits for NPP, NDC and TVVC in 2020
Furthermore, several observed first digits proportions of the TVVC differ from Benford’s proportions. However, the first digits distribution of digits 2, 7 and 9 are closer to Benford’s postulated proportion for the total valid votes cast. Therefore, for the first digit distribution, NDC has mean values that are farther away from Benford’s expected values compared with NPP in both 2016 and 2020 elections. High discrepancies in mean values (Benford and observed digits) may indicate possible anomaly in the valid votes count of NDC in both 2016 and 2020 elections.
In this subsection, we apply Benford’s expected second-digit distribution to the valid vote cast for NPP and NDC in 2016 and 2020 presidential elections. The probability distribution of the second digits of valid votes cast for NPP and NDC in the 2016 presidential election is shown in Table 3. The observed frequency distribution of each digit is also shown in the table jointly with the corresponding Benford’s projected proportions. In comparison to the NDC observed mean (3.872) in 2016, NPP’s observed mean (4.171) is closer to Benford’s expected value (4.186). The probability distribution of second digits 1, 4, and 6 of the TVVC in 2016 have proportions that are closer to Benford’s hypothesised values.
Distribution of frequency of second digits for NPP, NDC and TVVC in 2016
Distribution of frequency of second digits for NPP, NDC and TVVC in 2016
Also, the probability distribution of the second digits of valid votes cast for NPP and NDC in the 2020 presidential elections are shown in Table 4. The NDC’s second-digit distribution mean, 4.191, is quite closer to Benford’s second-digit mean, 4.186, than the NPP, i.e., 4.579.
Distribution of frequency of second digits for NPP, NDC and TVVC in 2020
Therefore, in general, for the distribution of second digits, NDC has a mean that is farther away from Benford’s expected value compared to the NPP in the 2016 election. High discrepancy in mean (Benford and observed digits) is indicative of a possible anomaly in the valid votes count of NDC in the 2016 election. On the contrary, for the distribution of second digits, NPP has a mean that is farther away from Benford’s expected value compared with the NDC in the 2020. Thus, we can conclude that there is a possible anomaly in the valid votes count of NPP in 2020 elections. However, several observed proportions of the second digits’ distribution of the total valid votes cast in the 2020 presidential election conforms to Benford’s proportions. Specifically, the observed proportions of second digits 0, 8, and 9 of the total valid votes cast are closer to Benford’s hypothesized distributional oportions. Moreover, in the case of the mean values, the TVVC value of the second digits for the 2020 elections is closer to Benford’s expected value for TVVC 2016 elections.
First and Second digits distribution between Benford, NPP’s votes and NDC’s votes in 2016 and 2020.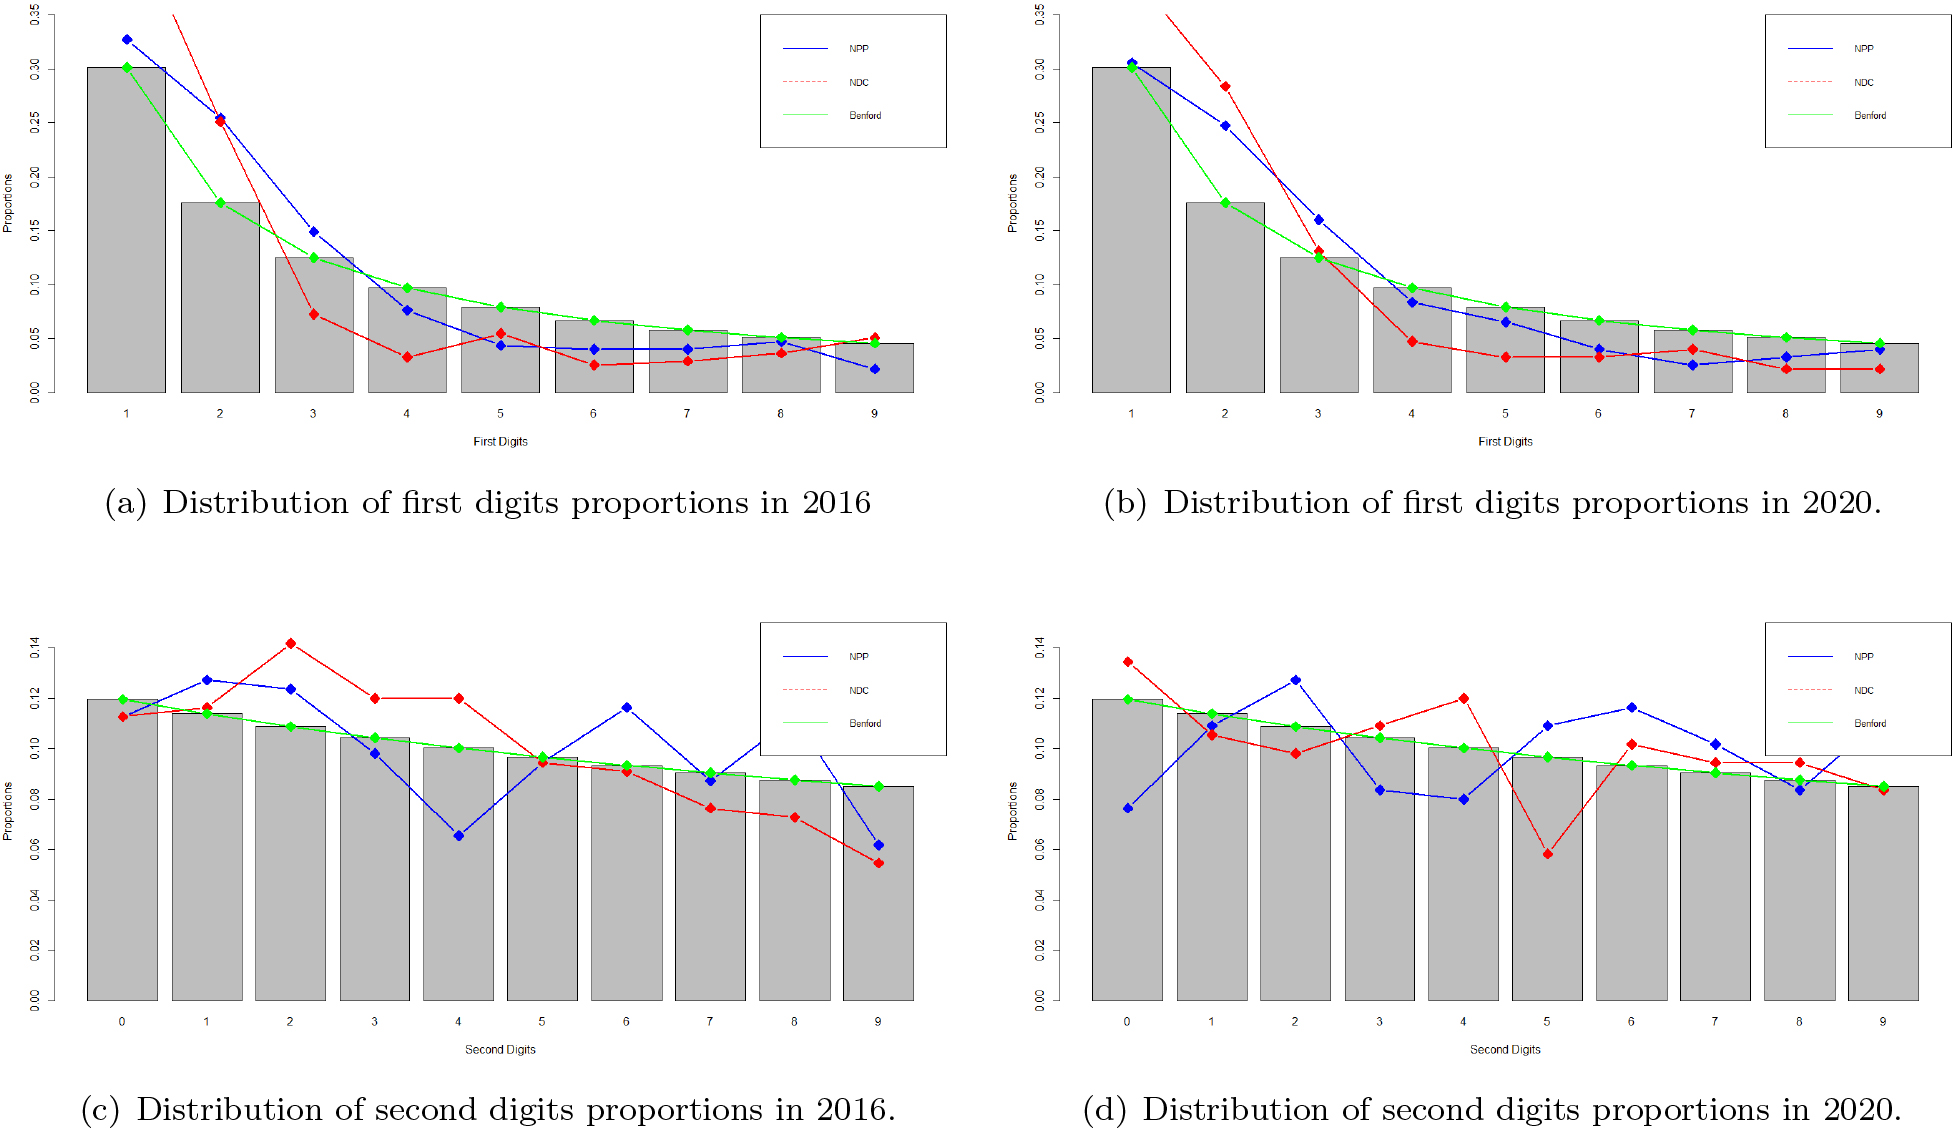
Based on the distribution of second digits of both NPP and NDC, Fig. 1a indicates that most observed proportions do not conform to Benford’s specified proportions. In the 2016 presidential elections, the distribution of the digits 3 and 7 are closer to Benford’s second-digit distribution for NPP, while the distribution of the digits 1, 5, and 6 are closer to Benford’s second-digit distribution for NDC.
Also, Fig. 1b shows that most of the observed proportions for the first digits of both NPP and NDC in the 2020 presidential elections are much closer to Benford’s posited proportions for the first digit distribution. For NPP, the distribution of digits 2 and 3 are farther away from Benford’s first digit probability distribution than the other digits. On the other hand, for NDC, more digits 1, 2, 4, and 5 are farther away from the Benford’s first-digit distribution of the valid votes in the 2020 election.
In addition, based on the distribution of second digits of both NPP and NDC, Fig. 1c indicates that most observed proportions do not conform to Benford’s specified proportions. In the 2016 presidential election, the distribution of the digits 3 and 7 do not differ much from the Benford’s second-digit distribution for NPP. Similarly, the distribution of the digits 1, 5, and 6 are closer to Benford’s second-digit distribution for NDC.
Moreover, from Fig. 1d, most of the observed proportions for the second digits distribution of both NPP and NDC deviate from Benford’s expected proportions for the distribution of second digits. The nearest to Benford’s second digits distribution for the valid votes cast for both NPP and NDC in the 2020 presidential elections is the distribution of digits 1, 7, and 8.
We conduct a formal hypothesis test for the null hypotheses stated in Section 1. The results of the hypotheses tests are presented in this section.
Spearman rank correlation coefficient test for the digits distribution of 2016 and 2020 votes
Spearman rank correlation coefficient test for the digits distribution of 2016 and 2020 votes
The SRCC test for the NPP and NDC first digits distribution in the 2016 and 2020 presidential elections is shown in Table 5. In both the 2016 and 2020 presidential elections, there is a statistically significant relationship between Benford’s proposed distribution of first digits and the distribution of first digits of valid votes cast for the NPP (
Also, as demonstrated in Table 5, there is no statistically significant relationship between the second digits of valid votes cast for NPP in the 2016 and 2020 presidential elections and the distribution of second digits specified by Benford, with
In this study, we resort to the applicability of digits-based test in anomaly detection in presidential elections in Ghana. In the previous section, we observed that the first digits distribution of valid votes cast for both parties, NPP and NDC, in Ghana’s presidential elections in 2016 and 2020 conforms to the Benford’s expected distribution for first digits. Also, the distribution of the first digits of total valid votes cast conforms to Benford’s law. Thus, these findings of the first digits suggest a possible anomaly-free presidential election in 2016 and 2020. In addition, the findings of the first digit distribution for the 2020 presidential election conform to the results from Nortey et al. (2022), where the authors employ a Bayesian methodology in validating the credibility of the 2020 presidential election in Ghana. In contrast, the distribution of the second digits of valid votes cast for the NPP in the 2016 and 2020 presidential elections deviate from the Benford’s hypothesized distribution, whilst the NDC’s second-digit distribution conforms to the Benford expected distribution. Also, the distribution of the second digit of the total valid votes cast in 2016 and 2020 deviates from the possible Benford distribution for second digits. These findings conform to previous research into election anomalies such as Breunig and Goerres (2011), Ketchley (2021) and Tunmibi and Olatokun (2021). In the case of the mean, discrepancies between Benford’s mean and the mean of observed digits distribution give rise to high suspicion of possible anomalies. For the distribution of the first digits, high discrepancies in mean values (Benford and observed digits) amount to high suspicion of a possible anomaly in the valid votes count of NDC (2016, 2020) and TVVC (2020). Also, for the analysis of the second-digit distribution, high discrepancies in the mean of both Benford and observed digits give rise to high suspicion of possible fraud claims of valid vote counts of NDC (2016), NPP (2020) and TVVC (2016, 2020). Therefore, to further assess the plausibility of these conclusions, we resorted to the Spearman rank correlation coefficient test. The hypotheses test results indicate that the distribution of the first digits of valid votes cast for NPP and NDC and the Total Valid Votes in the 2016 and 2020 presidential elections comply with the expected distribution under Benford’s law. Thus, there is no statistically significant difference between observed and expected means in valid votes cast for NPP and NDC, and the total valid votes implying possible anomaly-free elections. The findings of the first digit distribution seem to conflict with the results of the second digit distribution for the valid vote cast for NPP and the total valid votes cast in 2016 and 2020. Therefore, we recommend that to check for consistency in election anomaly detection between the first and second-digit-based tests, the first two digits must be used since it captures more information. For future research, digit analysis using Benford’s Law under the framework of Bayesian would be explored.
Footnotes
Acknowledgments
The authors thank the Electoral Commission of Ghana for providing access to the election dataset used for the research.
Conflict of interest
The authors declare that there are no conflicts of interest.
Data availability
The data used to support the findings of this study are available from the corresponding author upon request.