
Abstract
With the concept of green hotel, the hotel industry has started to consider a sustainable design and operation to obtain more competitiveness. It is needed to implement a convenient way to recognize a real-time situation about the indoor environmental quality (e.g., temperature, relative humidity, CO2, TVOCs, PM2.5, etc.) and the relevant energy efficiency in a hotel guestroom. This study aimed to develop a scalable integrated platform for providing real-time monitoring, alert notification, and analytics so as to satisfy the level of the occupants’ comfort and satisfaction. Facility managers could gain insight from the real-time hierarchical and historical information and take actions at a point of time. The novel approach could create a comfortable and healthy environment for the occupants in a hotel guestroom while realizing the energy efficiency in real time. The proposed platform was validated with three guestrooms in a hotel, and the scalability of the system was fully confirmed. In the future studies, it is expected to deploy the proposed platform to a larger physical entity of the hotel, providing flexibility and expandability in accordance with the strategic facility planning of the hotel. Furthermore, it is planned to develop various kinds of occupant-centered services in a hotel guestroom level.
Keywords
Introduction
Since Hong Kong has opened its economy to the global economic situation, the tourism industry is considered one of the major pillars of Hong Kong’s economy, and the hotel industry continues to grow at a rapid rate. Recently, the indoor environmental quality (IEQ) in a hotel becomes a key factor to obtain more competitiveness as international hotel groups, which can have an effect on occupant’s comfort and satisfaction in a hotel guestroom. In general, the parameters of the IEQ include indoor temperature, relative humidity, carbon dioxide (CO2), total volatile organic compounds (TVOCs) and particulate matter (PM). The CO2 is a colorless and tasteless gas, which can be generated by breathing indoors. The TVOCs can be released from building materials, furnishings, and technologies such as laser printers and photocopiers. The PM involves different sizes of airborne particles; for example, PM2.5 is the particulate matter of 2.5 micrometers or less in diameter, while PM10 is the particulate matter of 10 micrometers or less in diameter. Since the size of the pollutant particles is very small, they can be easily penetrated into the body through the respiratory process. The PM2.5 and PM10 can be emitted through activities like vacuuming and sweeping indoors.
Although the IEQ can affect the occupants’ health, wellness, comfort, and satisfaction (Al Horr, et al., 2016), many of previous studies have focused on the improvement of operational energy efficiency rather than the IEQ. The major challenge in the hotel industry is to improve the thermal comfort (i.e., IEQ) without increasing the energy consumption and the relevant other costs (Stipanuk, 2001). This is because the thermal comfort can be improved or maintained by operating the air conditioning system, which accounts for about 25% of the overall energy consumption in a hotel guestroom (Jayasinghe, 2010). As such, the improvement of thermal comfort in a hotel guestroom can have a substantial effect on the overall energy use in hotel industry. Based on this background, it is essential to find a convenient way for facility managers to recognize a real-time situation about the IEQ and the relevant energy efficiency in a hotel guestroom so that the level of the occupants’ comfort and satisfaction can be improved. Therefore, this study aimed to develop a real-time management system for the IEQ and energy efficiency in a hotel guestroom, enabling the monitoring and diagnostics approach for intelligent facility management.
The recent studies have focused on the way to monitor the indoor and outdoor air quality in real time, which could be achieved by the rapid development of the networks and embedded systems. In particular, with the development of sensing technology over the past decade, especially the internet of things (IoT), a practical method of collecting high-resolution spatio-temporal bigdata has evolved considerably so as to analyze the impacts of measures taken to improve the energy efficiency on the IEQ in a hotel guestroom. The efforts have focused on integrating embedded sensors and control technologies with business applications and information systems (e.g., capturing and analyzing real-time data, and responding to real-time conditions), which is a new idea for the smart hotel management. Table 1 presents a brief summary of the recent studies on the real-time IEQ monitoring system. Brienza, et al. (2015) proposed an embedded sensor solution with centralized server and low-cost cooperative tool for monitoring air pollution in various areas of a city. PostgreSQL, Apache, and Google map API were used for the database, web server, and sensor location visualization. Lambebo and Haghani (2014) developed a real-time wireless sensor network (WSN) for environmental monitoring of greenhouse gases, in which database and website were established for the data storing and web hosting. Tsang et al. (2016) designed a low-latency and high-throughput ZigBee network for the IEQ monitoring system; however, it was just by simulation, but it has not been applied to real cases. Postolache, et al. (2005) used Wi-Fi network for detecting the air pollution events and sensors’ abnormal operation, in which the data collected from several sensors would be transmitted for the data logging and processing, web hosting, and control unit. However, the suggested approach has not been deployed in the real cases. Kim, et al. (2014) developed a wired sensing device for enabling information processing and addressing the challenges on how to design and implement the integrated sensing system. The sensors can transmit the collected data via radio frequency (RF) to the cloud, and no web server was provided for end users, which makes the possible solutions hard to be implemented into the real world. Firdhous, et al. (2017) developed the IoT-based proactive monitoring system for the O3 concentrations near photocopy machines, in which the proposed solution was designed for a small zone. A bluetooth was used for the communication among the IoT devices, and a Wi-Fi was adopted for the communication among the gateway nodes.
A brief summary of recent studies on the real-time IEQ monitoring system
A brief summary of recent studies on the real-time IEQ monitoring system
As reviewed above, some studies adopted the IoT-based approach for monitoring the indoor or outdoor environment (including data collection, pre-processing, and transmission); however, few studies attempted to develop a real-time management system for simultaneously monitoring and diagnosing the IEQ and the relevant energy efficiency indoors. To overcome these challenges, this study proposed a scalable integrated platform for providing real-time-based monitoring, alert notification, and analytics so as to enhance the building performance focusing on the nexus of the IEQ and the relevant energy efficiency. Considering a huge amount of dataset, and a complex type of dataset from different sensors, the proposed model could provide a novel solution for integrating the dataset from different sources (e.g., sensors, open APIs, other external data, etc.) into a single platform and for achieving a reliable data queryperformance.
An IoT technology is generally used to create the scalable platform for integrating the real-time dataset from the sensors for the IEQ and the relevant energy efficiency into a single server. As shown in Fig. 1, the system architecture of the proposed platform was designed for realizing a high-performing and easy-to-access system to support immediate responses to end users (e.g., facility manager), which includes sensor network, data warehouse, and reporting service as well as sensor components (i.e., IEQ sensor ‘Awair’ and smart energy meter ‘Enertalk’). The hardware components and scalable platform (i.e., software components) were described in detail in the following subsections.
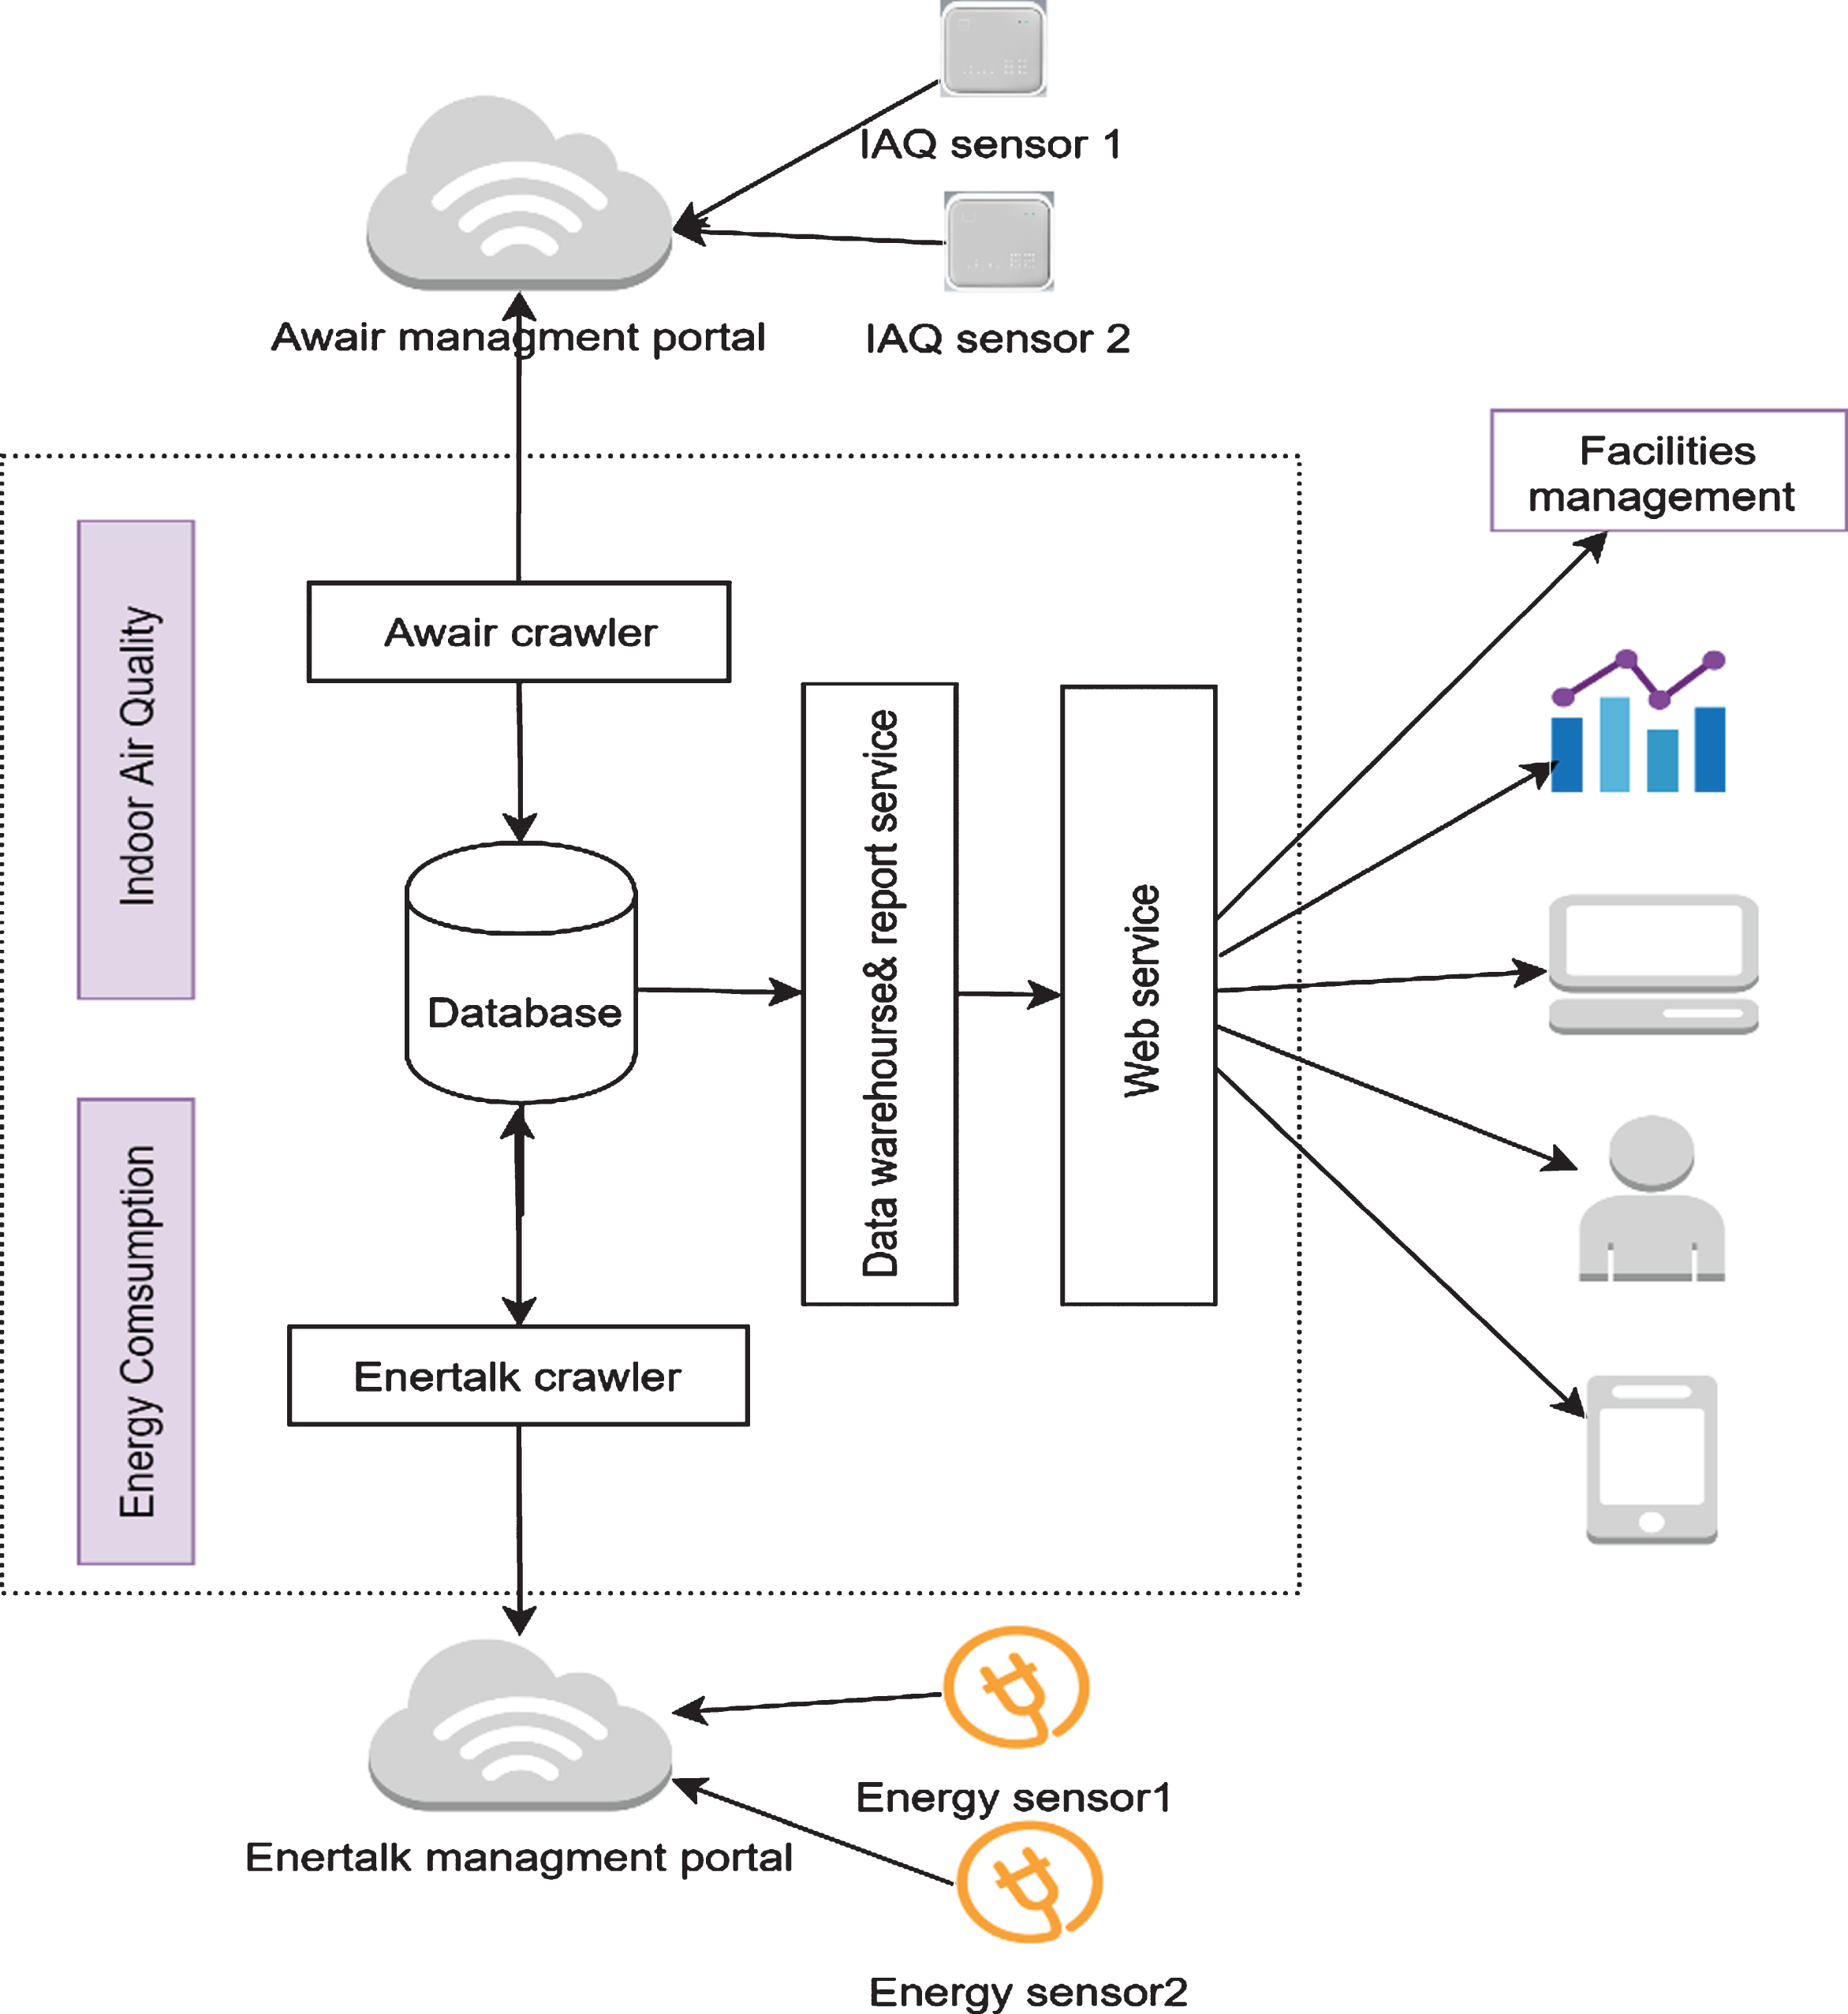
System architecture of the proposed platform.
The IEQ sensors were mounted on the ceiling in a hotel guestroom, and the smart energy meters were installed in a miniature circuit breaker (MCB) board, aiming for grasping the real-time condition of the indoor environmental quality, detecting inefficient electric appliances, analyzing the energy usage behavior, and reducing peak load via demand response.
IEQ sensor
As shown in Fig. 2, the ‘Awair’, one of the qualified IEQ sensors, was used to measure five indices of the IEQ: i) indoor temperature; ii) relative humidity; iii) CO2; iv) TVOCs; and v) PM2.5. Table 2 shows the specification of the IEQ sensor (i.e., Awair), including normal range and accuracy. Since the interface of the Awair is configured to be easy to recognize the status of the IEQ, facility managers or occupants in a hotel guestroom can clearly judge whether or not the IEQ in the room would satisfy the comfortable level. The indices displayed by the light-emitting diode (LED) on the device show a scale from 1 to 5 for all the indices, indicating that the fewer dots on the device, the better IEQ in the room. Furthermore, an ‘Awair Score’ displayed on the device stands for the overall score for the IEQ in the room, which is calculated by compiling the measured values from the five different indices (i.e., indoor temperature, relative humidity, CO2, VOCs, and PM2.5). The overall score is expressed in a color-coded and numbered scale (i.e., 0 for poor through 100 for being healthy), aiming to let the occupants in the room to better understand the status of the IEQ at a glance.

The IEQ sensor (Awair) (W: 98 mm H: 98 mm D: 34 mm)
Specification of the IEQ sensor (Awair)
Red: the IEQ in the room is in poor condition for occupants; and
thus, it is suggested to open window or turn on air conditioning
system immediately. Yellow: the IEQ in the room is not in good condition but fair for
occupants. Green: the IEQ in the room is in good condition for
occupants.
The ‘Enertalk’, one of the qualified smart meters, was used to measure the electricity consumption by electric appliance in a hotel guestroom. Table 3 shows the specification of the smart energy meter (i.e., Enertalk), including measurement, certificate and key feature. Although “EnerTalk” can collect the electricity consumption data by minute, 15-minute cumulative data collected by the smart meter would be sent to the manufactures’ cloud storage server via Wi-Fi by considering the storage capacity.
Specification of the smart energy meter
(Enertalk)
Specification of the smart energy meter (Enertalk)
Notes: aIC stands for integrated circuit; bPPM stands for polyphase power-monitoring; cCT stands for current transformer; dKC stands for Korea certification; eFCC stands for federal communications commission; fTELEC stands for technical regulations conformity certification.
The proposed scalable platform consists of four subsystems: (i) data capture; (ii) real-time monitoring system; (iii) notification system; and (iv) analytics system. The first subsystem, data capture, is to retrieve the real-time IEQ data and energy efficiency data from the installed sensors. The second subsystem, real-time data storage and monitoring, is to host the transactional sensor data and system master data, and to show the trend of the collected data in real time. The third subsystem, notification, is to send the email notification to the facility manager or management team when the IEQ is not satisfied with the pre-defined value. The fourth subsystem, analytics system, is a data warehouse and reporting service to build the analytical and multi-dimensional information, and to provide a reporting service for facility management.
Data capture
As the IEQ sensor and smart energy meter send the data to their own cloud servers in default working mode, it is difficult to design a process for fetching the data from the different types of sensors directly. Considering the update when the different types of sensors are changed, a crawler was developed in ‘.Net’ framework to capture the data from the manufacturers’ cloud servers. There are two crawlers in the proposed system, which is responsible for feeding the data collected by ‘Awair’ and ‘Enertalk’ to the database developed in this study. As an example, for ‘Awair’, the following Pseudo code shows the flows of how-to login the portal, retrieve the token, intercept variables from the retrieved HTML, and insert them into the database.
Procedure AwairCrawlerThread(Url)
While Url is not NULL DO
Logon_Awair_Portal(Url)
IF Login Successful THEN
Token< -retrieveToken(Url)
IF Token is not NULL THEN
HTML< -retriveveHTML(Url)
WHILE True DO
Intercept Values from HTML
Insert Sensor Values into Database
End WHILE
END IF
END IF
End WHILE
End Procedure
Real-time monitoring system
MySQL 8.0 community version was adopted as a database for collecting and storing the real-time data on the IEQ and the relevant energy efficiency in a form of time series to support the real-time and historical analysis, which is the most popular open source in the developer community. Also, Windows 2012 R2 and IIS 8.0 were selected as the OS and web server for hosting the real-time reporting websites, which was developed in php with the assistance of the reportsmaestro. Figures 3-4 show the database structure for the installed sensors (i.e., ‘Awair’ and ‘Enertalk’), respectively, including the name and ID of the device, the real-time value collected by the sensors and the relevant timestamp.

The database structure for the IEQ sensor (Awair).
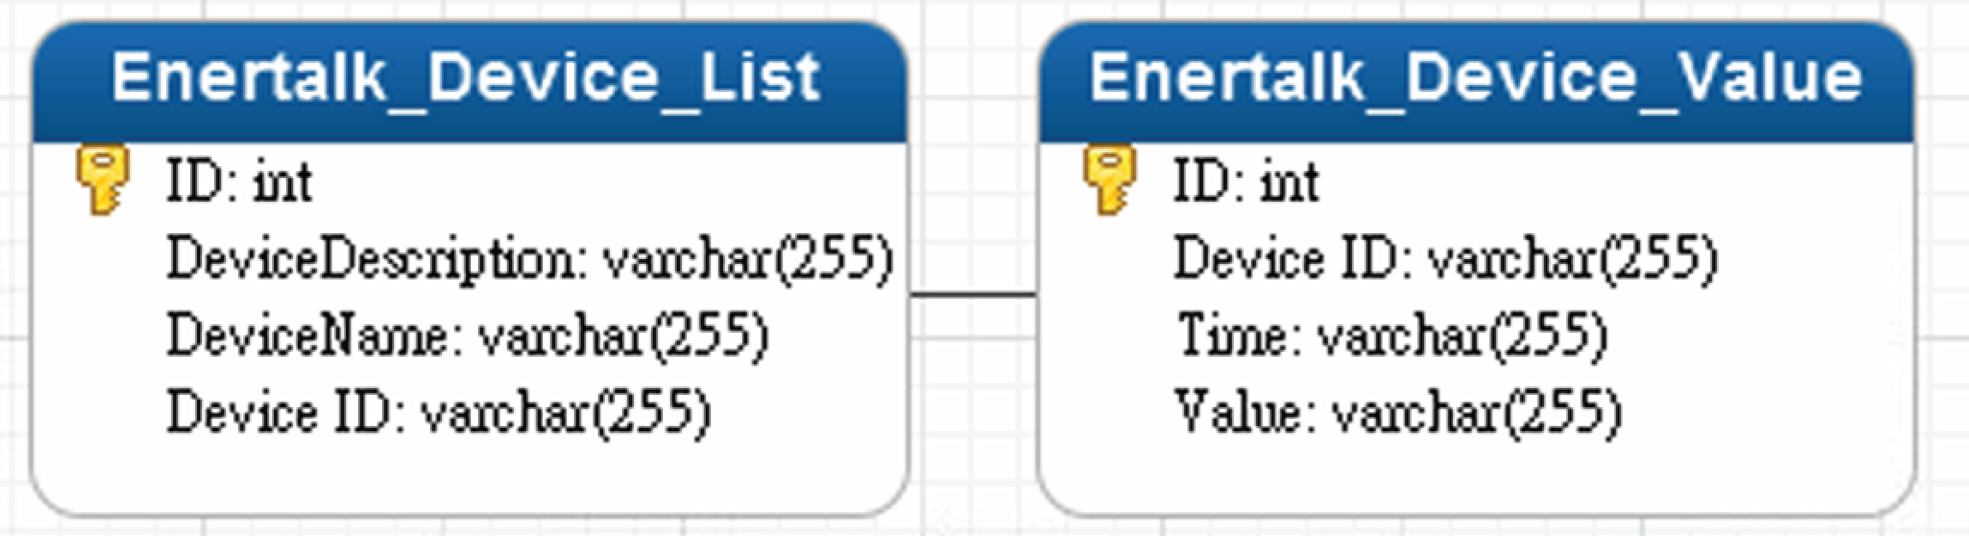
The database structure for the smart energy meter (Enertalk).
A powerful notice module was designed in the proposed scalable platform, which would send the email to the facility managers when the indoor air quality or energy efficiency would be in poor condition. The threshold level for the notification could be pre-defined in the system by refereeing the previous experience, or it could be also set to meet the specific purpose in a daily operation. Figure 5 shows the system flow of the alert email notification. When a value would exceed the defined threshold, the facility managers will be notified by email immediately. The SQL Server Mail Notice and Simple Mail Transfer Protocol (SMTP) were adopted to establish the alert email notification process.
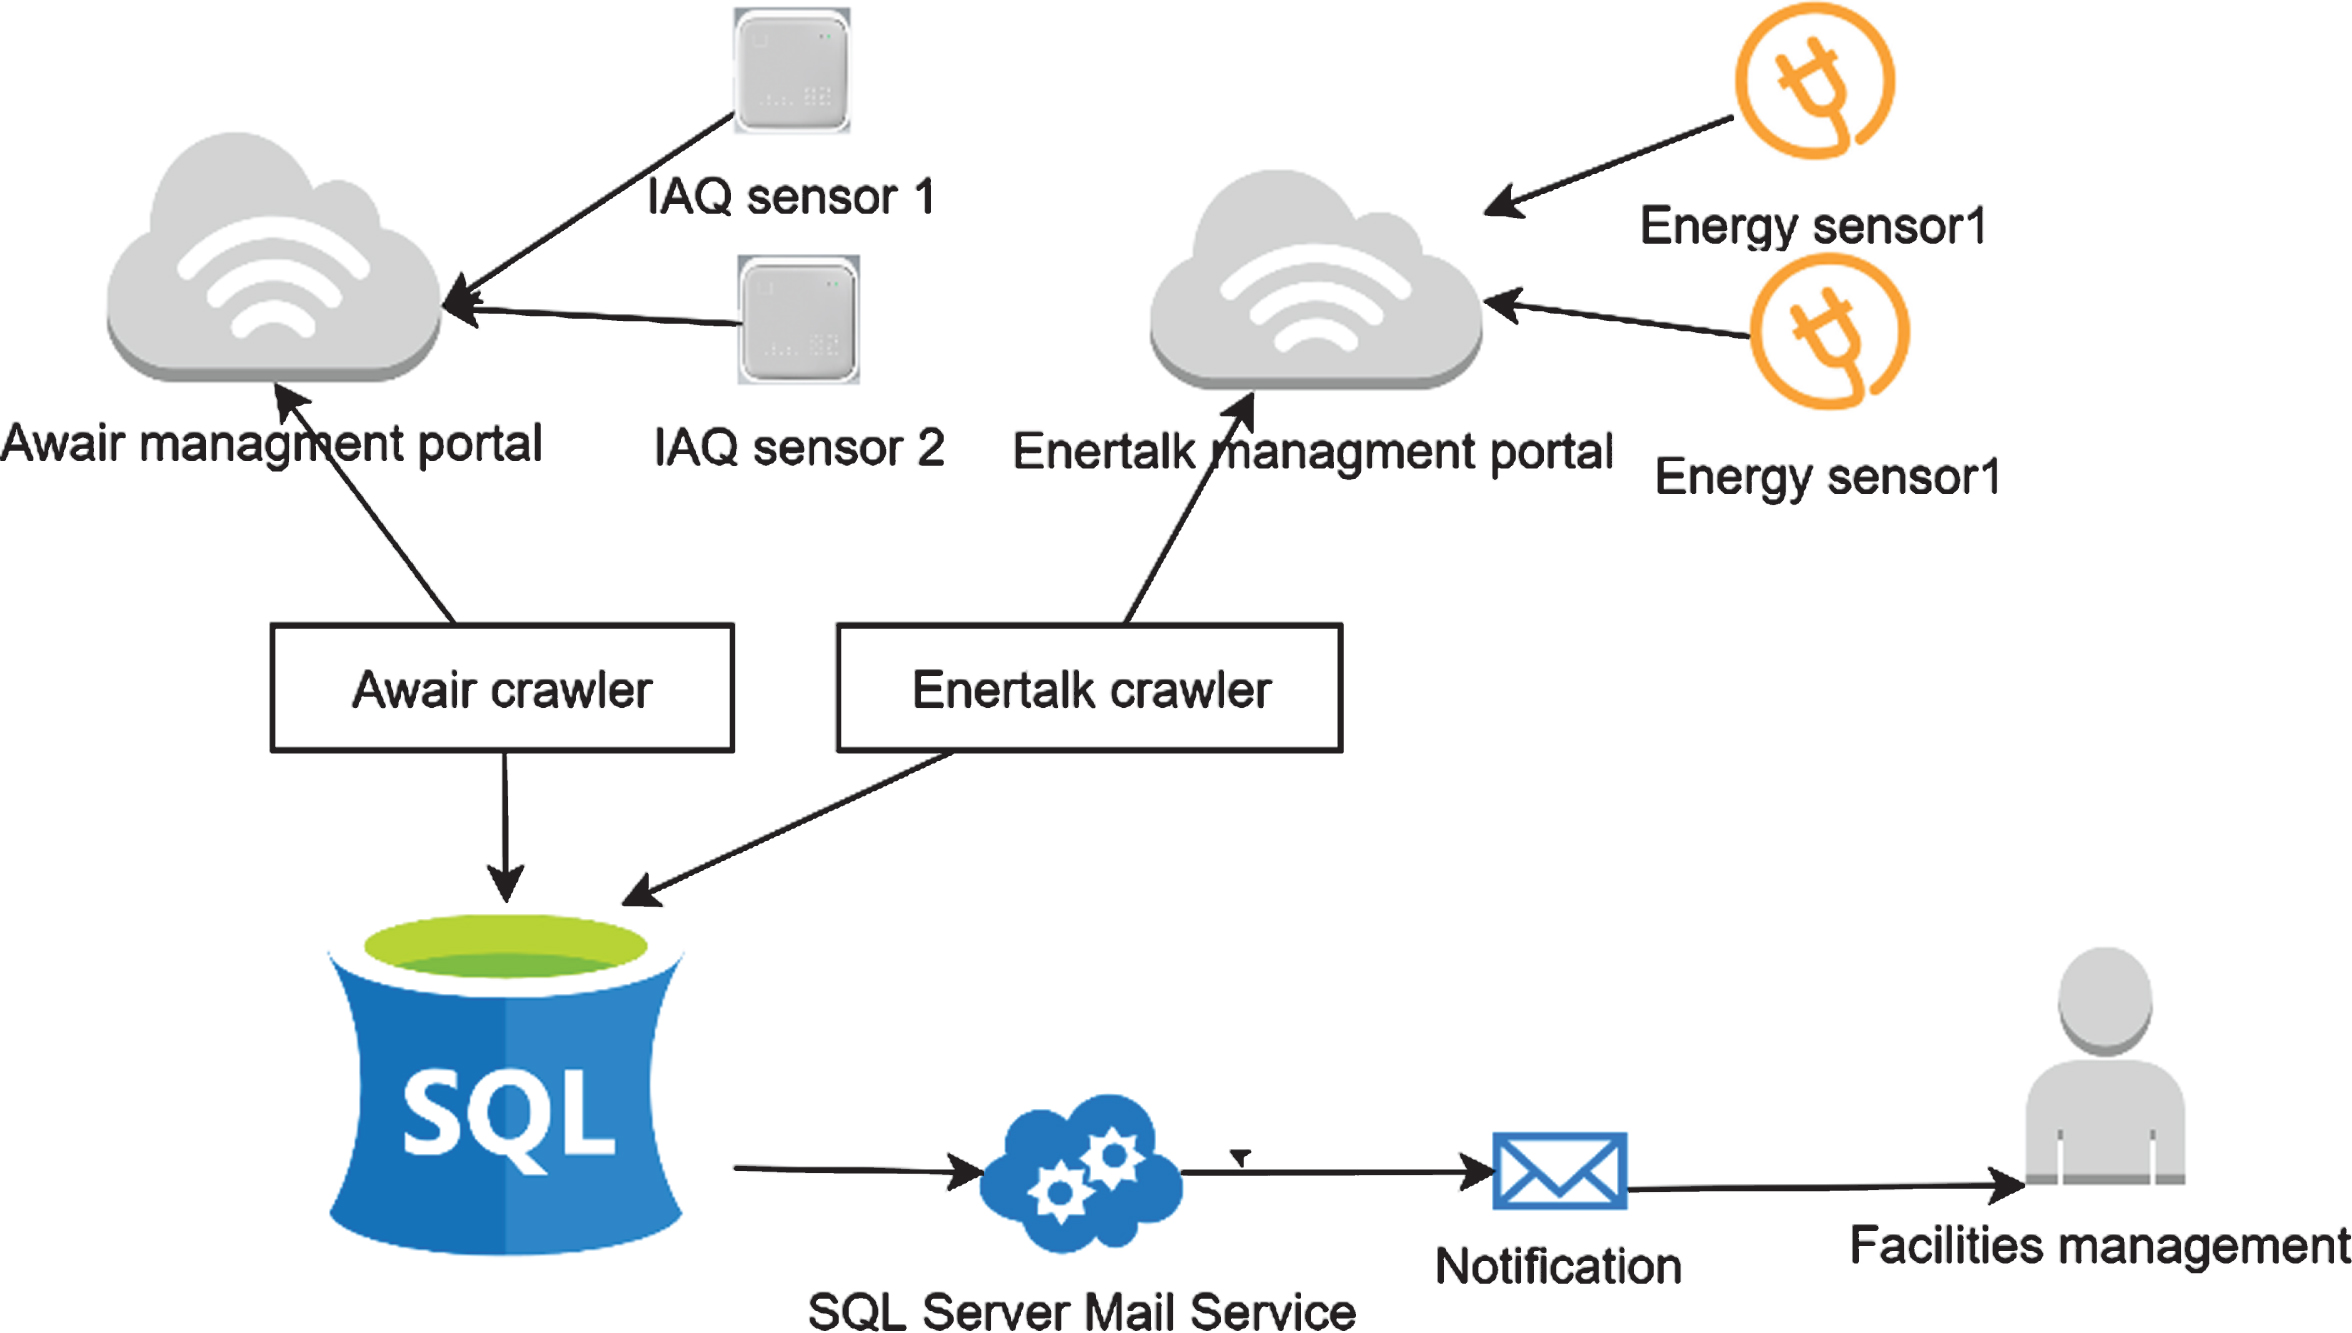
The system flow of the alert email notification.
For a strategic facility planning and decision-making for hotel facility, it is essential for facility managers to investigate the historical information on the IEQ and the relevant energy efficiency in a guestroom level. If a facility manager wants to view the analytics reports prepared by tons of historical sensing data, it is required to retrieve the valuable information from the big dataset for a long time, causing delayed decision-making for the facility management. To integrate a couple of sensing data in a nearly real time, a data warehouse should be considered to provide the analytical and multi-dimensional information in an efficient way.
To achieve this, the online analytical processing (OLAP) in SQL server was used to setup a data warehouse for processing the raw data from the installed sensors to the final analytical report. As shown in Fig. 6, the raw data from the installed sensors are aggregated from the operational database by ETL (extract, transform and load) to the data warehouse; and then, they are divided into the separate data marts for reporting service. The ETL tool extracts the raw data from different sources in MySQL (e.g., sensing data, hotel room information), which would be transformed into the staging place (e.g., format, structure) and be loaded into the final stage in a data warehouse.

Data processing flow in a data warehouse.
As shown in Fig. 7, the data structure is composed of two tables (i.e., dimension and fact), which could solve the complex queries time by considering the multi-dimensional views for various kinds of sensing data.
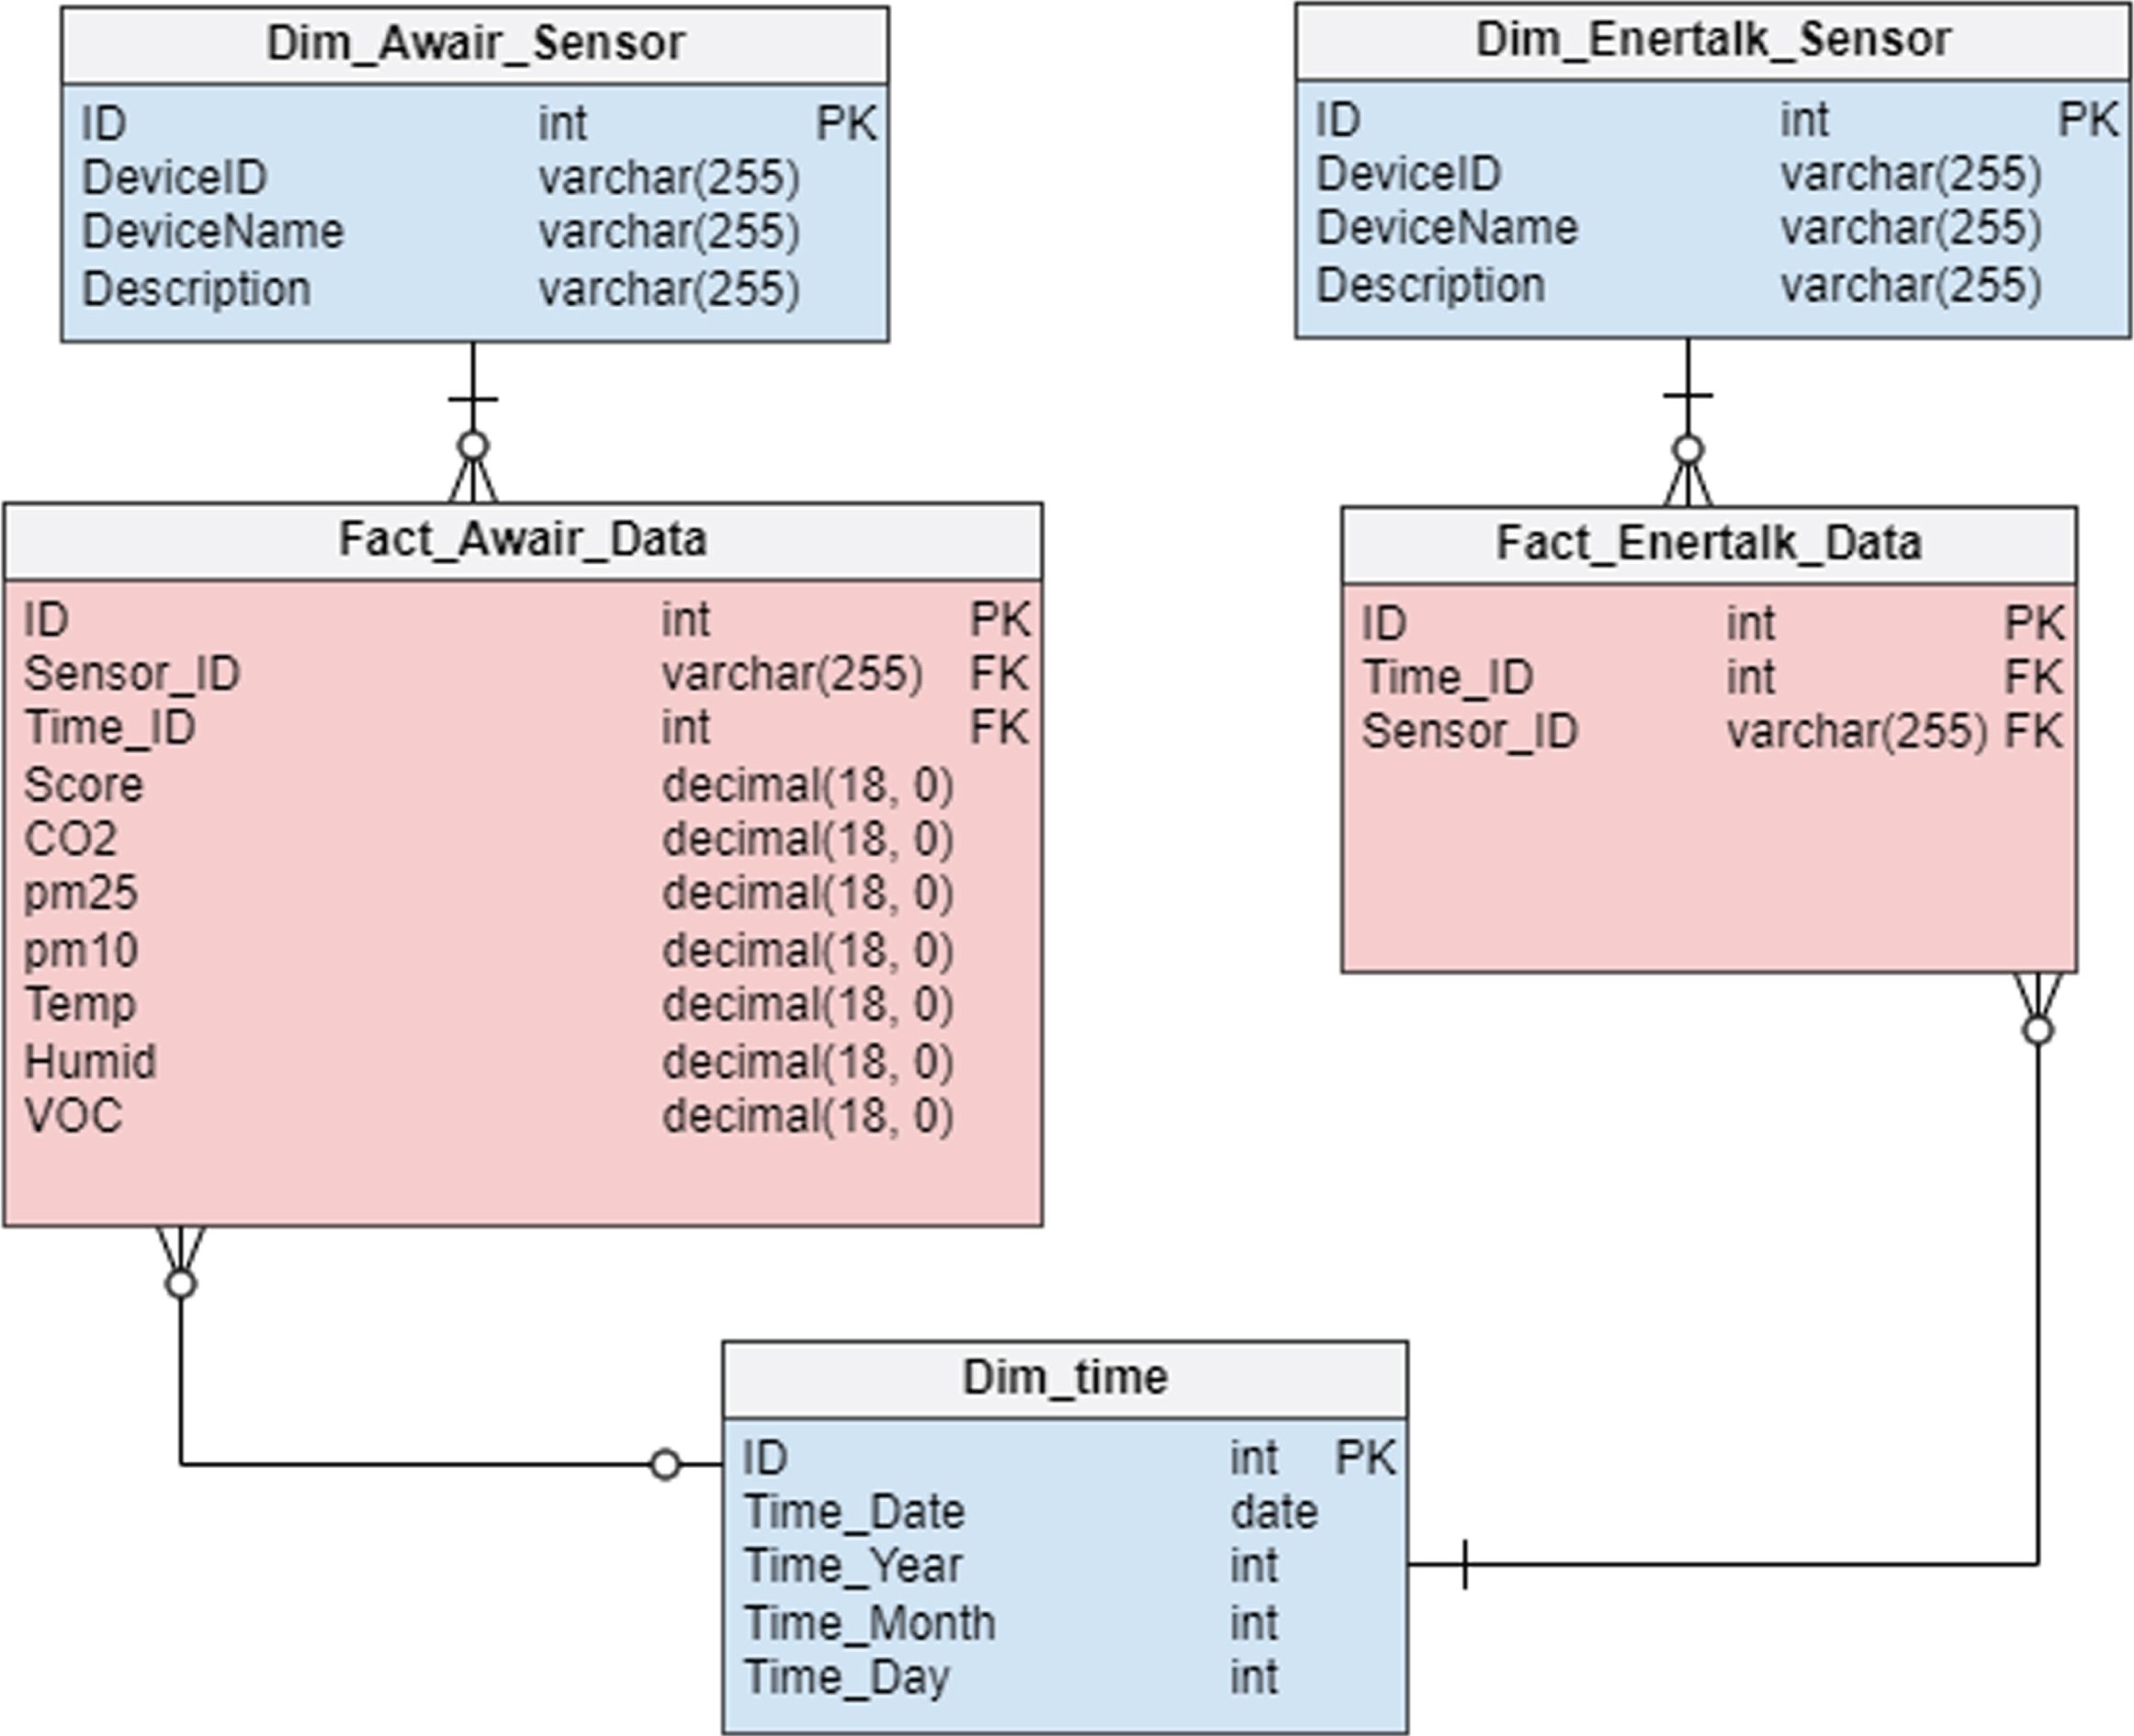
The entity relationship diagram of the final stage in the data warehouse.
As a case study, a hotel located in Hong Kong was selected, and the IEQ sensors and smart energy meters were installed in three guestrooms of the hotel for 2 months (Sep. and Oct. 2018). Based on the pilot test, this study validated the stability and capability of the proposed platform in three ways: (i) a real-time monitoring system for the IEQ and energy efficiency; (ii) a notification system for poor condition of the IEQ or energy efficiency; and (iii) an analytics system for improving the occupants’ health, wellness, comfort, and satisfaction in a hotel guestroom while maintaining the relevant energy efficiency.
Real-time monitoring system
The proposed platform presents the real-time data in a time-series manner for the IEQ and the relevant energy efficiency in a hotel guestroom, which allows the facility managers to better perceive the trends of the monitored parameters. Figures 8-9 show the time-series graphs for the IEQ in a guestroom, indicating the level of the thermal comfort (i.e., temperature and relative humidity) and the indoor air quality (CO2, TVOCs, and PM2.5), respectively. Also, Fig. 10 shows the time-series graph for the energy efficiency in a guestroom, indicating the energy consumption of the air conditioning system. If the facility managers would like to investigate the operational efficiency of the air conditioning system, it would be highly recommended to comprehensively analyze both the IEQ data (i.e., indoor temperature and relative humidity for heating and cooling operation, and CO2 concentration for ventilation operation) and the energy efficiency data (i.e., energy consumption for air conditioning system). On one way, if the occupants would not be in a guestroom, the air conditioning system should be taken out of service. On the other way, if the occupants would be in a guestroom,a specific measure should be taken to ensure that the air conditioning system would not be overpowered.
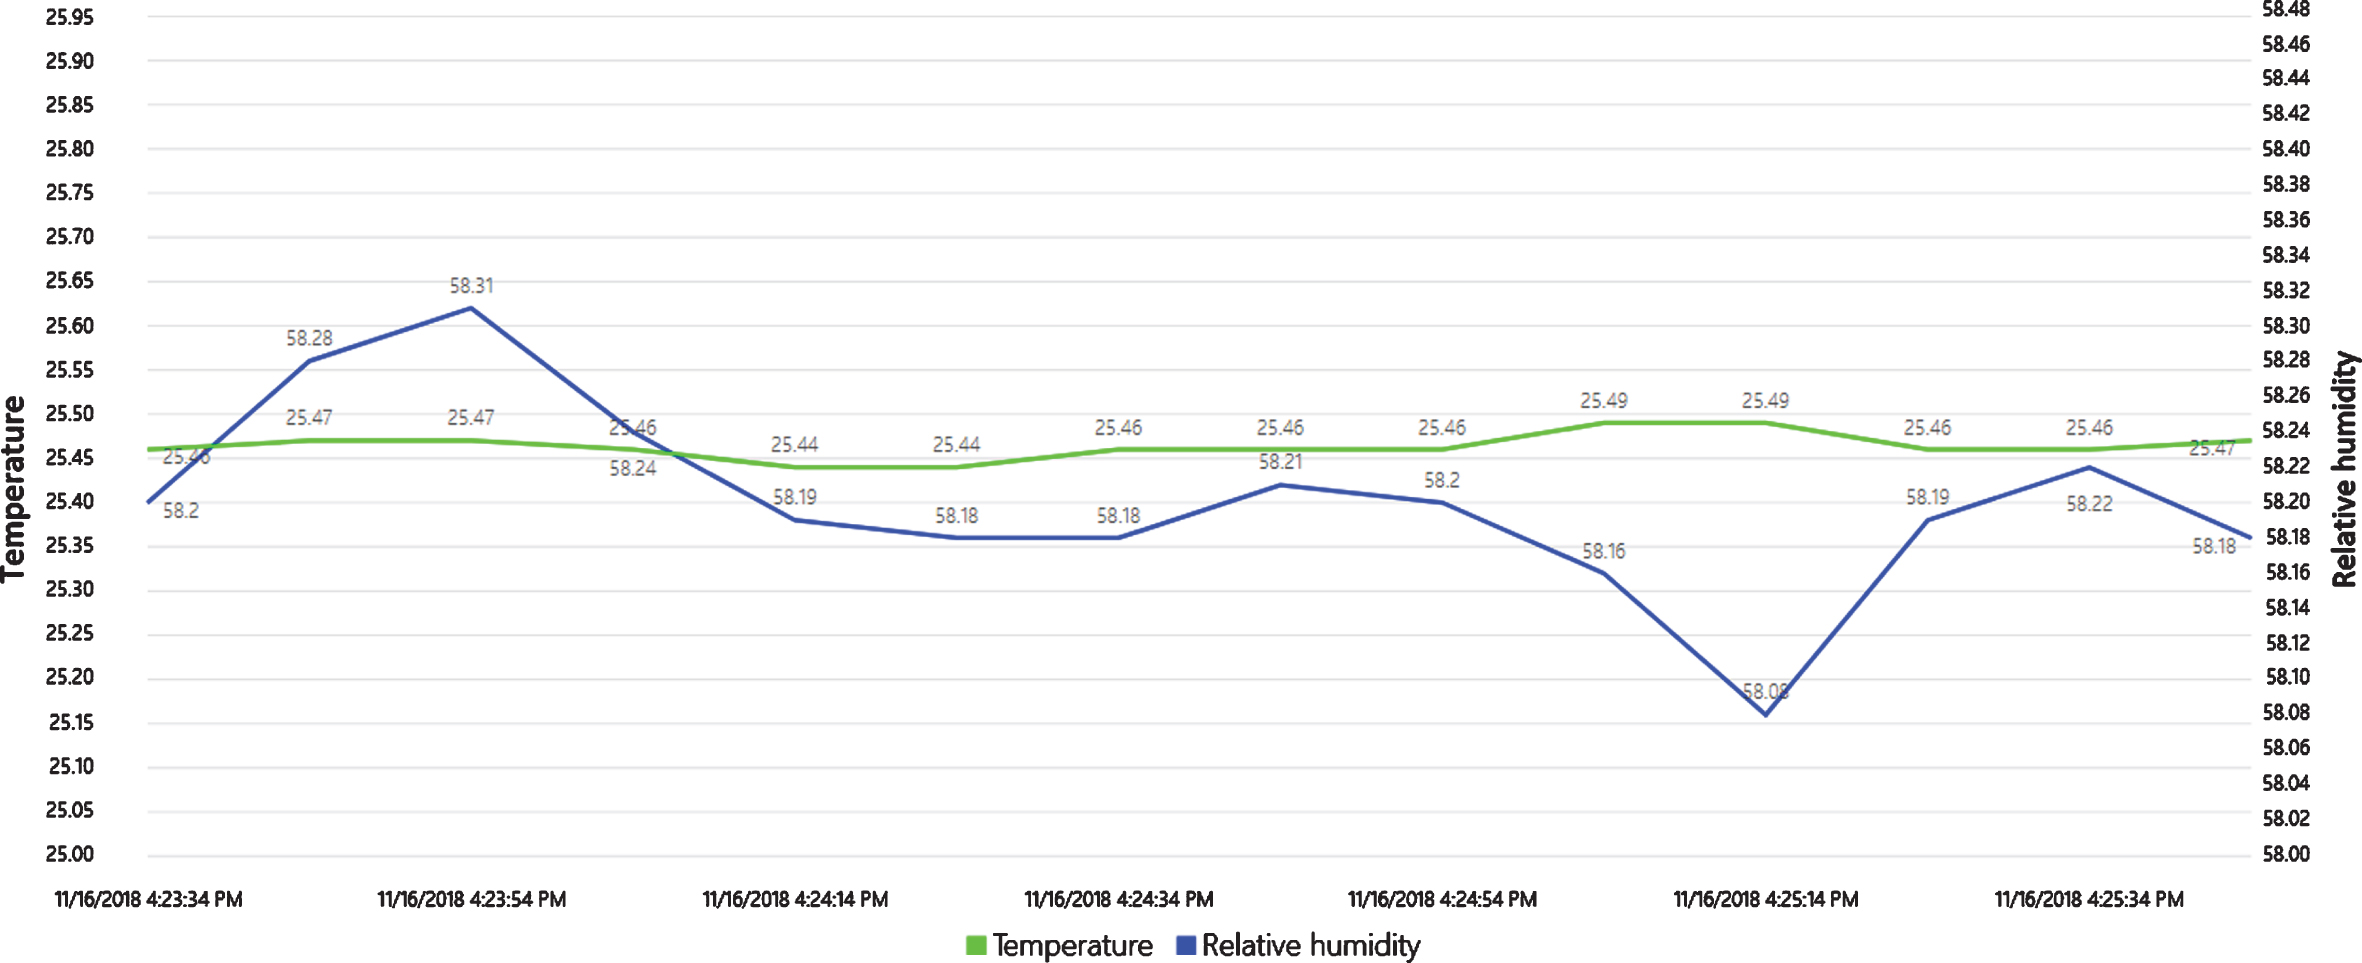
The real-time monitoring interface for the thermal comfort (temperature and relative humidity).
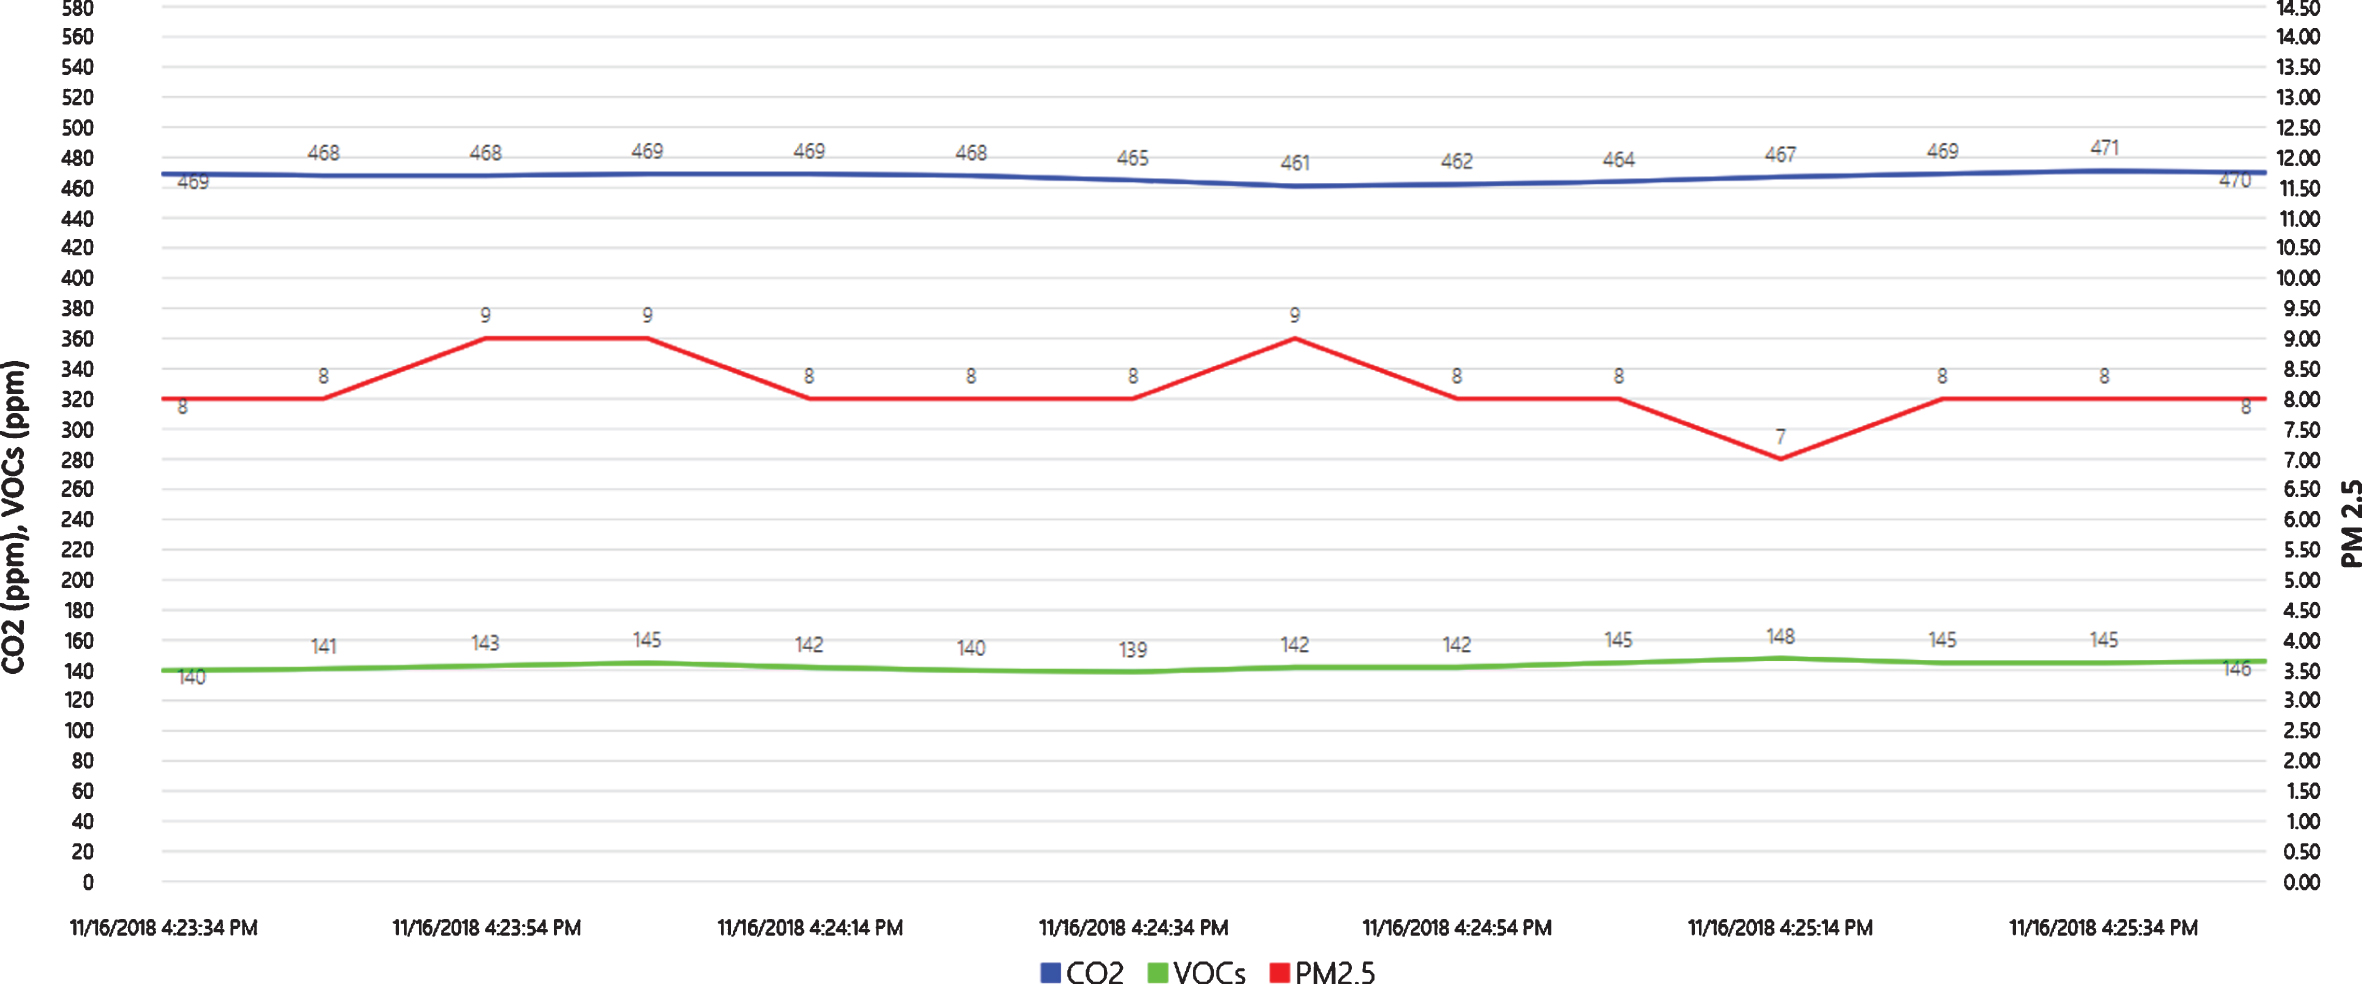
The real-time monitoring interface for the indoor air quality (CO2, TVOCs, and PM2.5).

The real-time monitoring interface for the energy efficiency (air conditioning system).
Figure 11 shows a case of the notification system, indicating that the email would be triggered to the facility managers if the data would exceed the pre-defined threshold level for over a set time (e.g., 3 minutes). Considering the privacy issue for the occupants, the facility managers would not act right after the notification to cope with a specific situation in a guestroom, but the proposed platform may send the alert email to the occupants for providing a guidance on appropriate reaction (e.g., a proper ventilation to ensure a certain level of the IEQ). In other words, if the overall score of the IEQ would be under the threshold for 3 minutes, the alert email would be sent to the facility managers or directly to the occupants in a hotel guestroom.
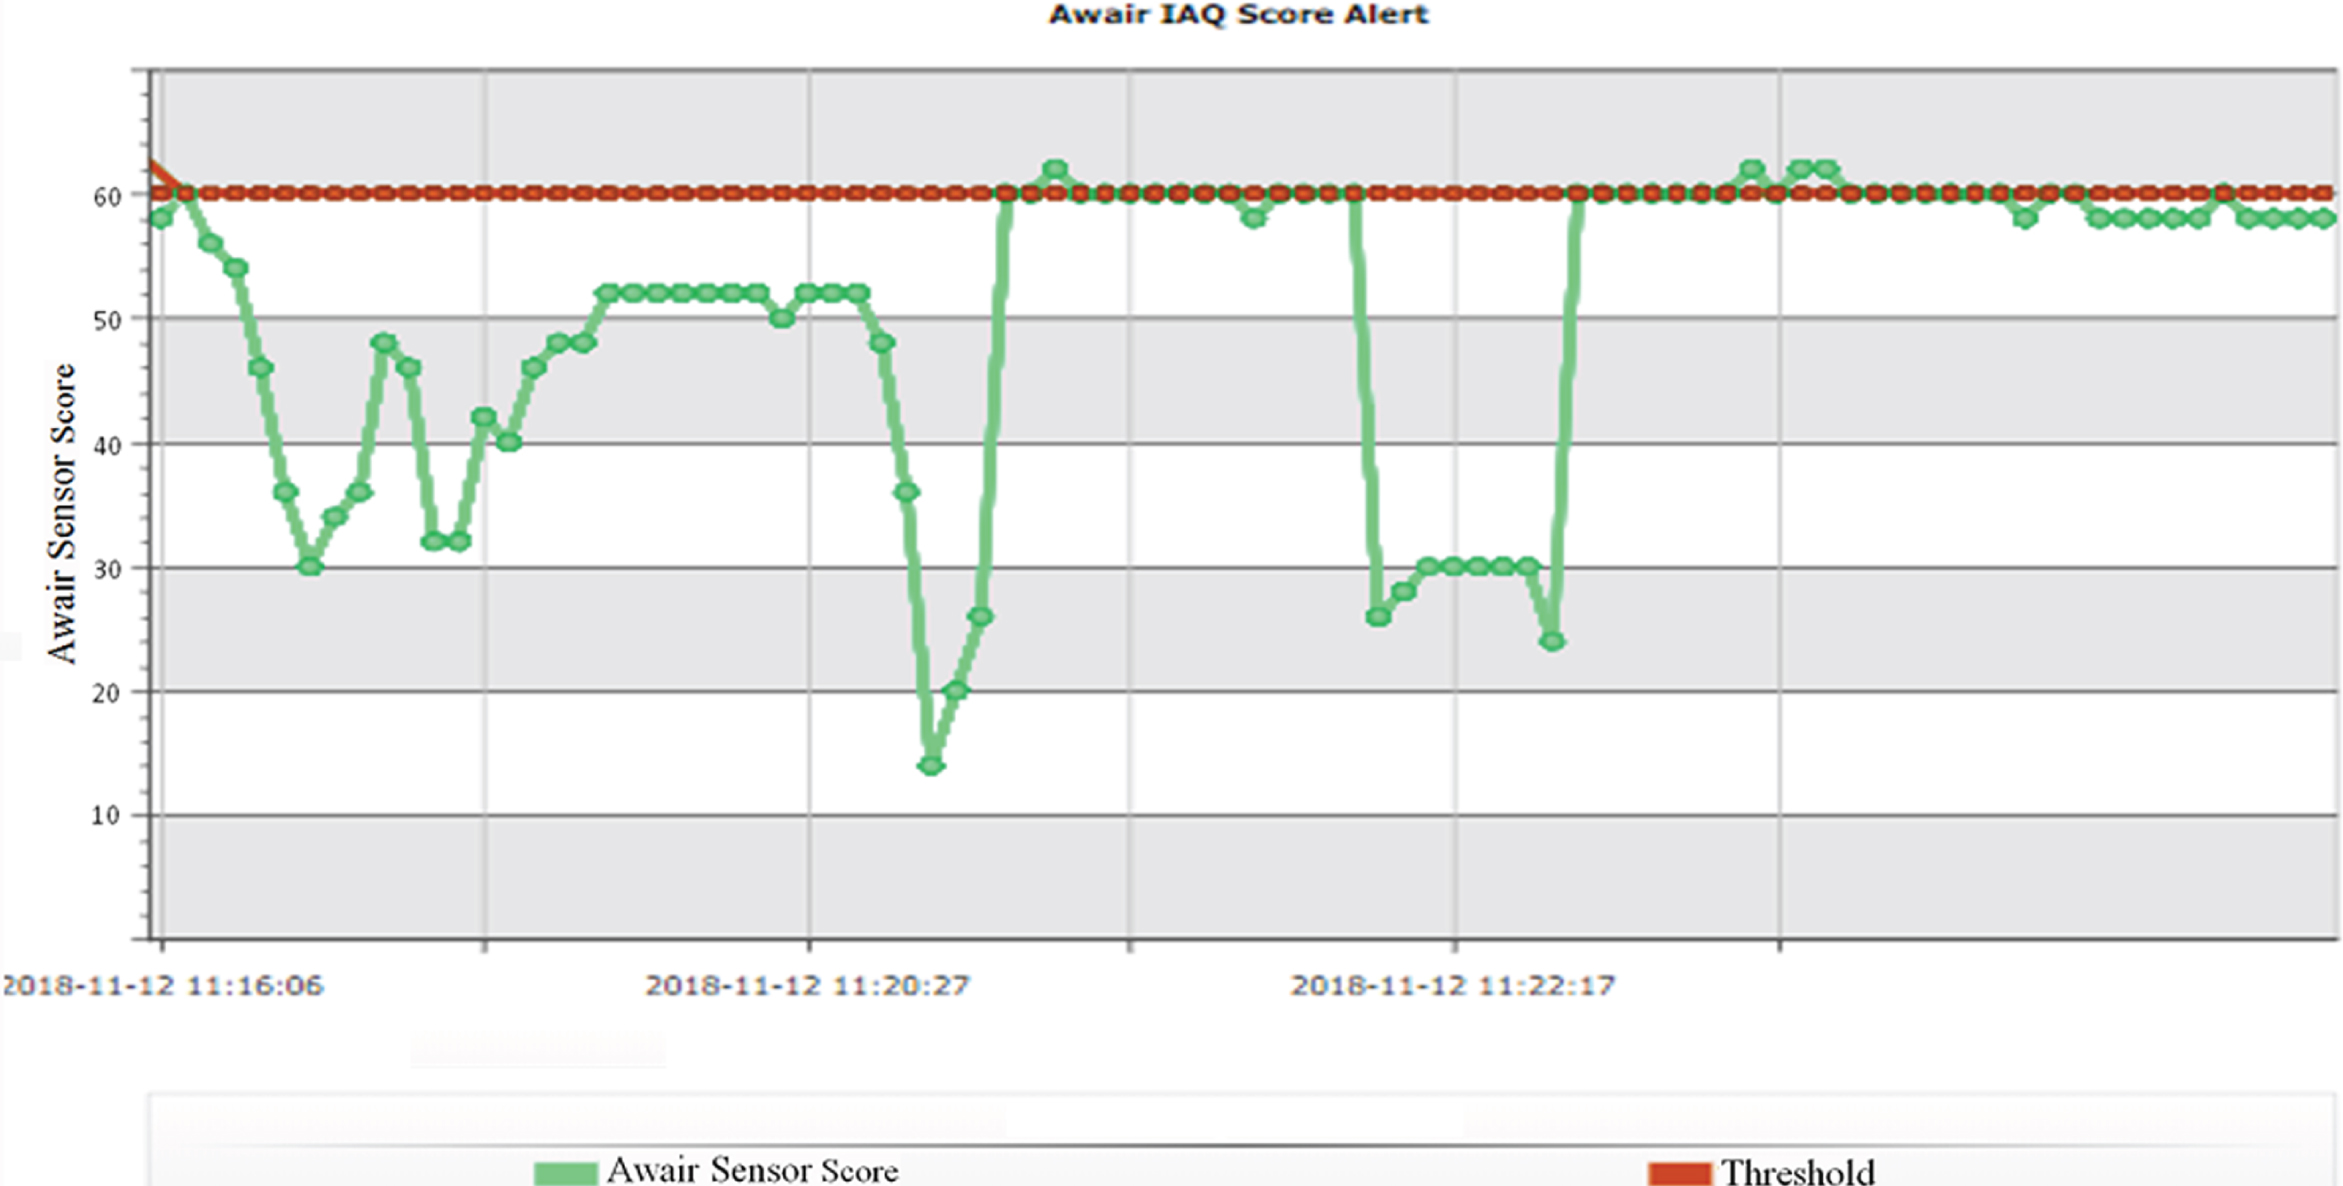
A case of the alert email notification.
The proposed platform allows the facility mangers to carry out a precise analysis of the IEQ and the relevant energy efficiency in a hotel guestroom by providing the historical data in detail. Thus, the proposed platform could be considered as a powerful tool to support a better decision making to improve the level of the IEQ for the occupants while achieving the energy efficiency. In other words, a detailed information, such as the average value of the IEQ during a certain period in a certain room, could be provided by selecting specific period and guestroom. As shown in Fig. 12, the facility managers could select the guestroom A and B, and check the time period of 1:00am, 7:00am, 10:00am and 17:00pm so as to show the average value of the IEQ (e.g., temperature, PM2.5 and TVOCs). Also, the detained analysis for the energy efficiency during a certain period in a certain room could be conducted in the proposed platform. Figure 13 shows the average value of the energy efficiency in three guestrooms of specific room for the time period of 4:00am, 5:00am, 6:00am and 12:00pm.
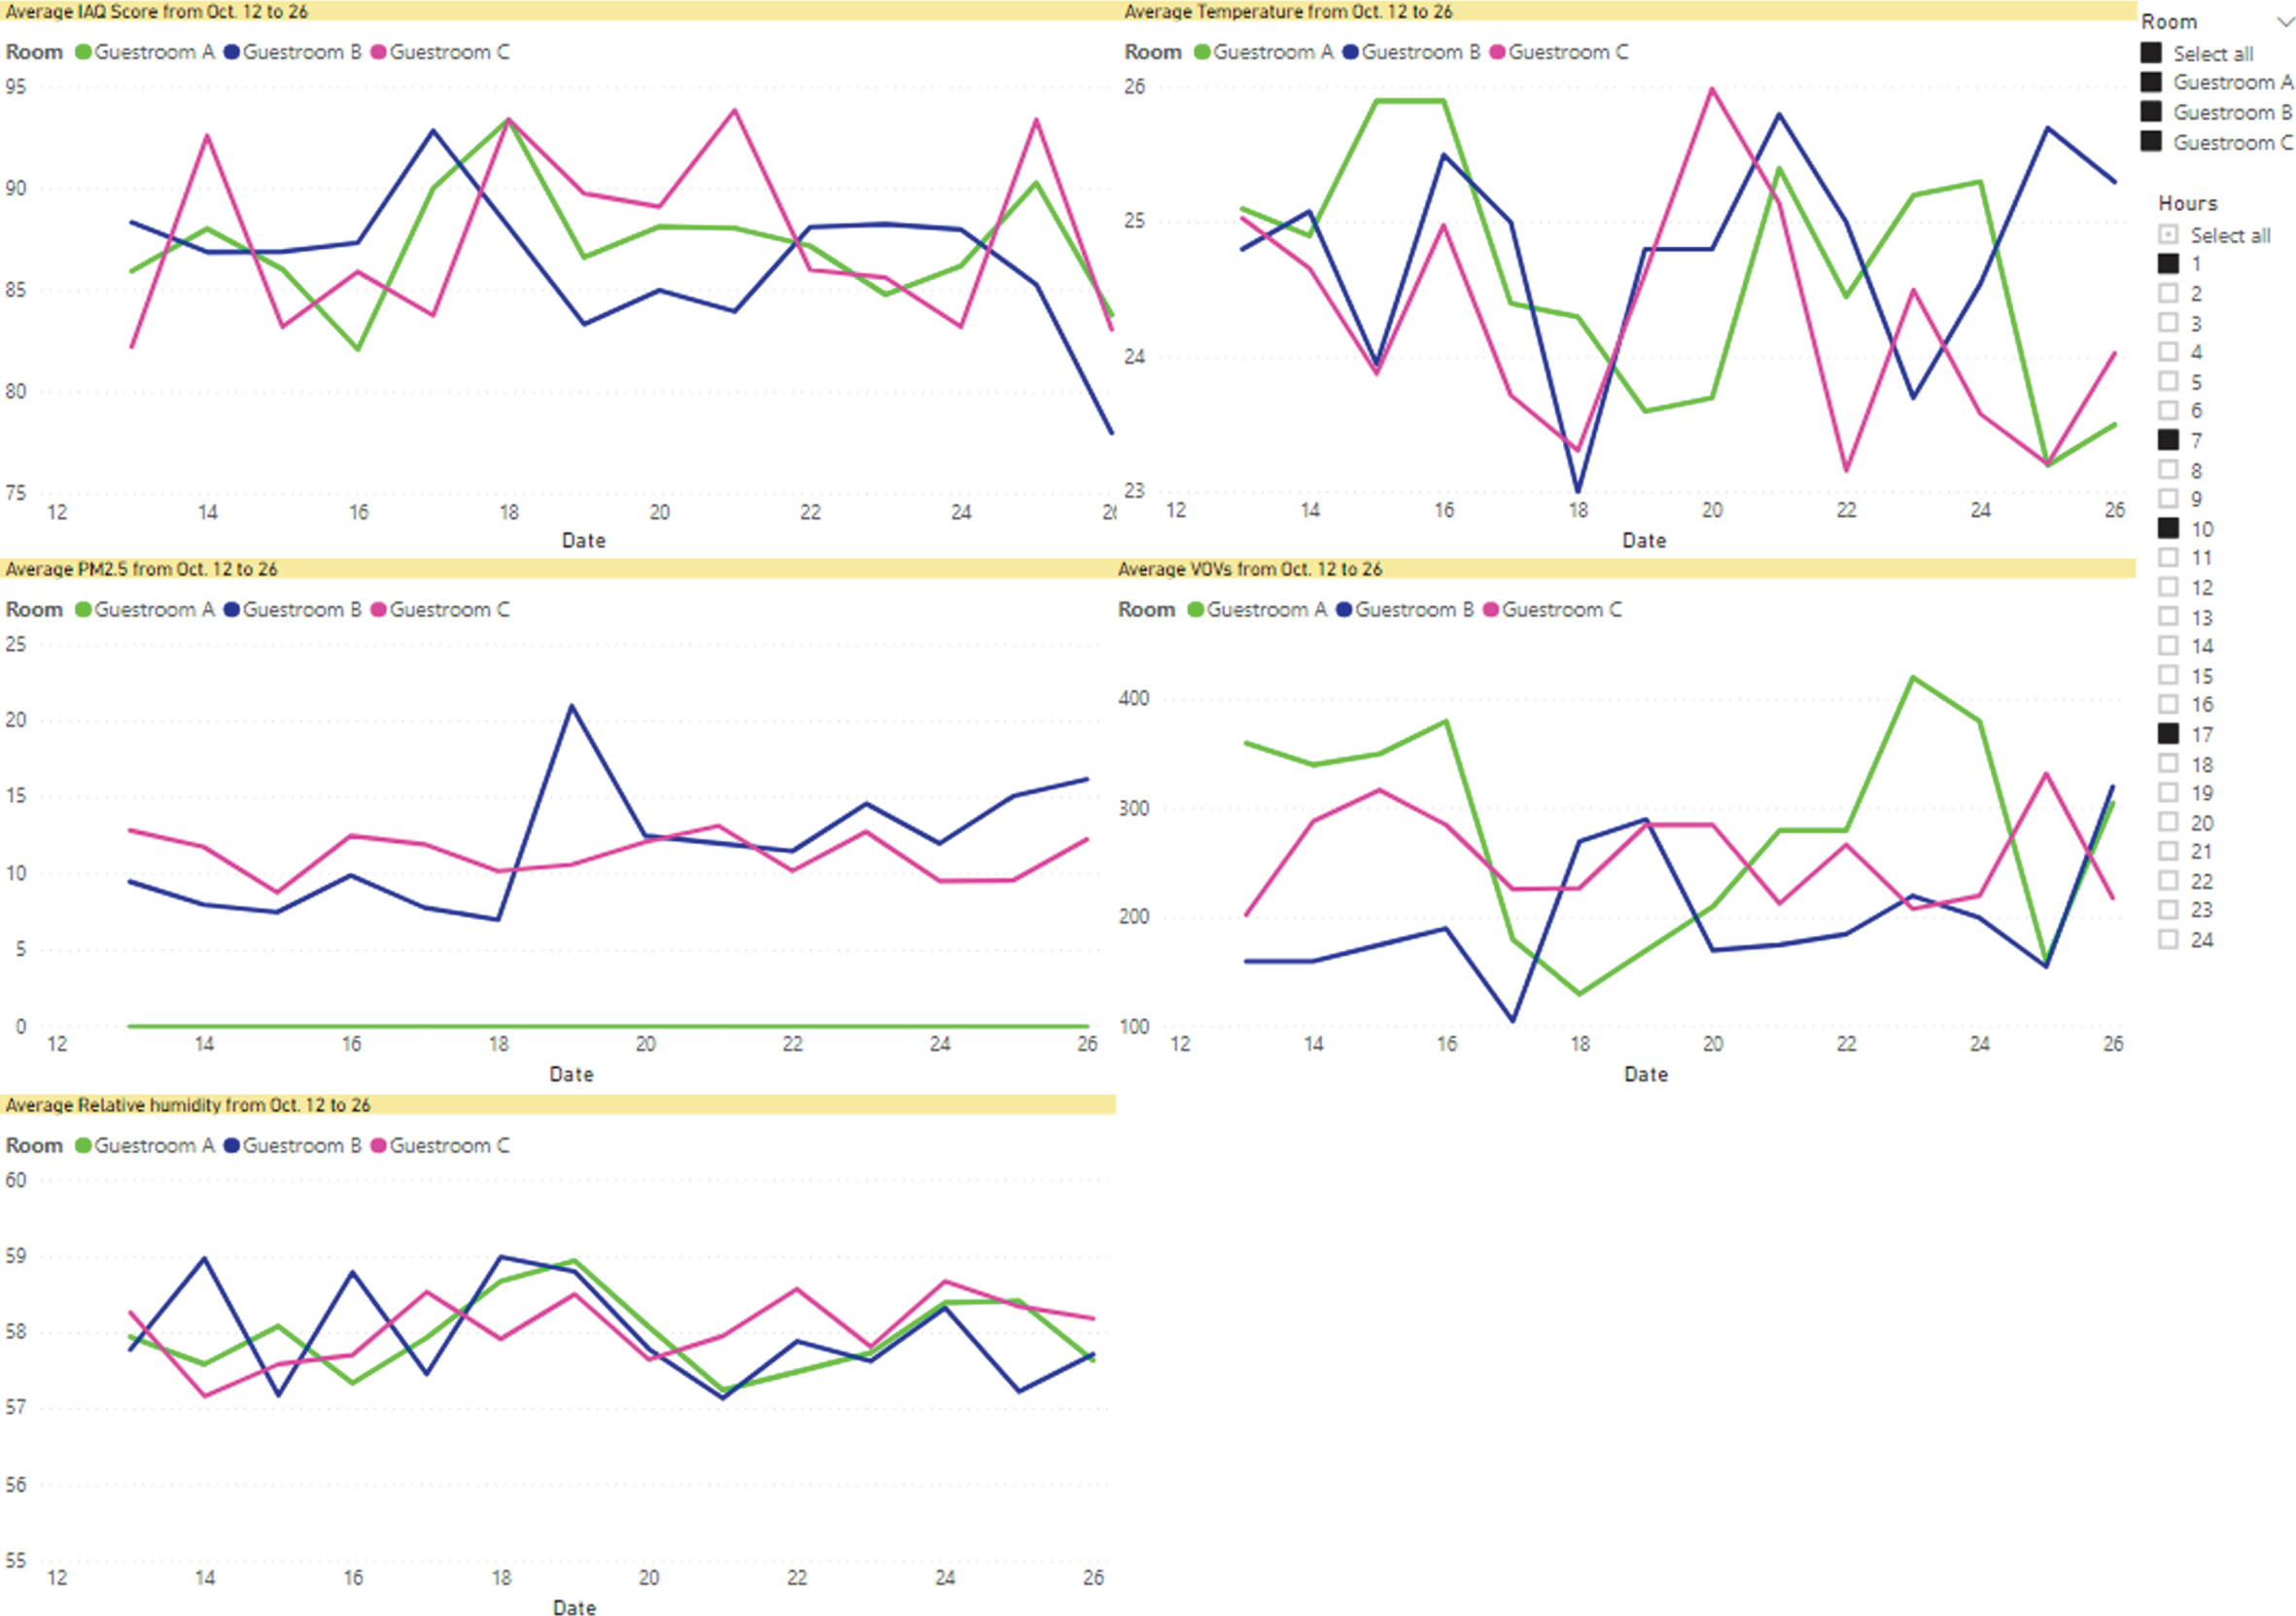
Visualized information of the IEQ in a hotel guestroom.
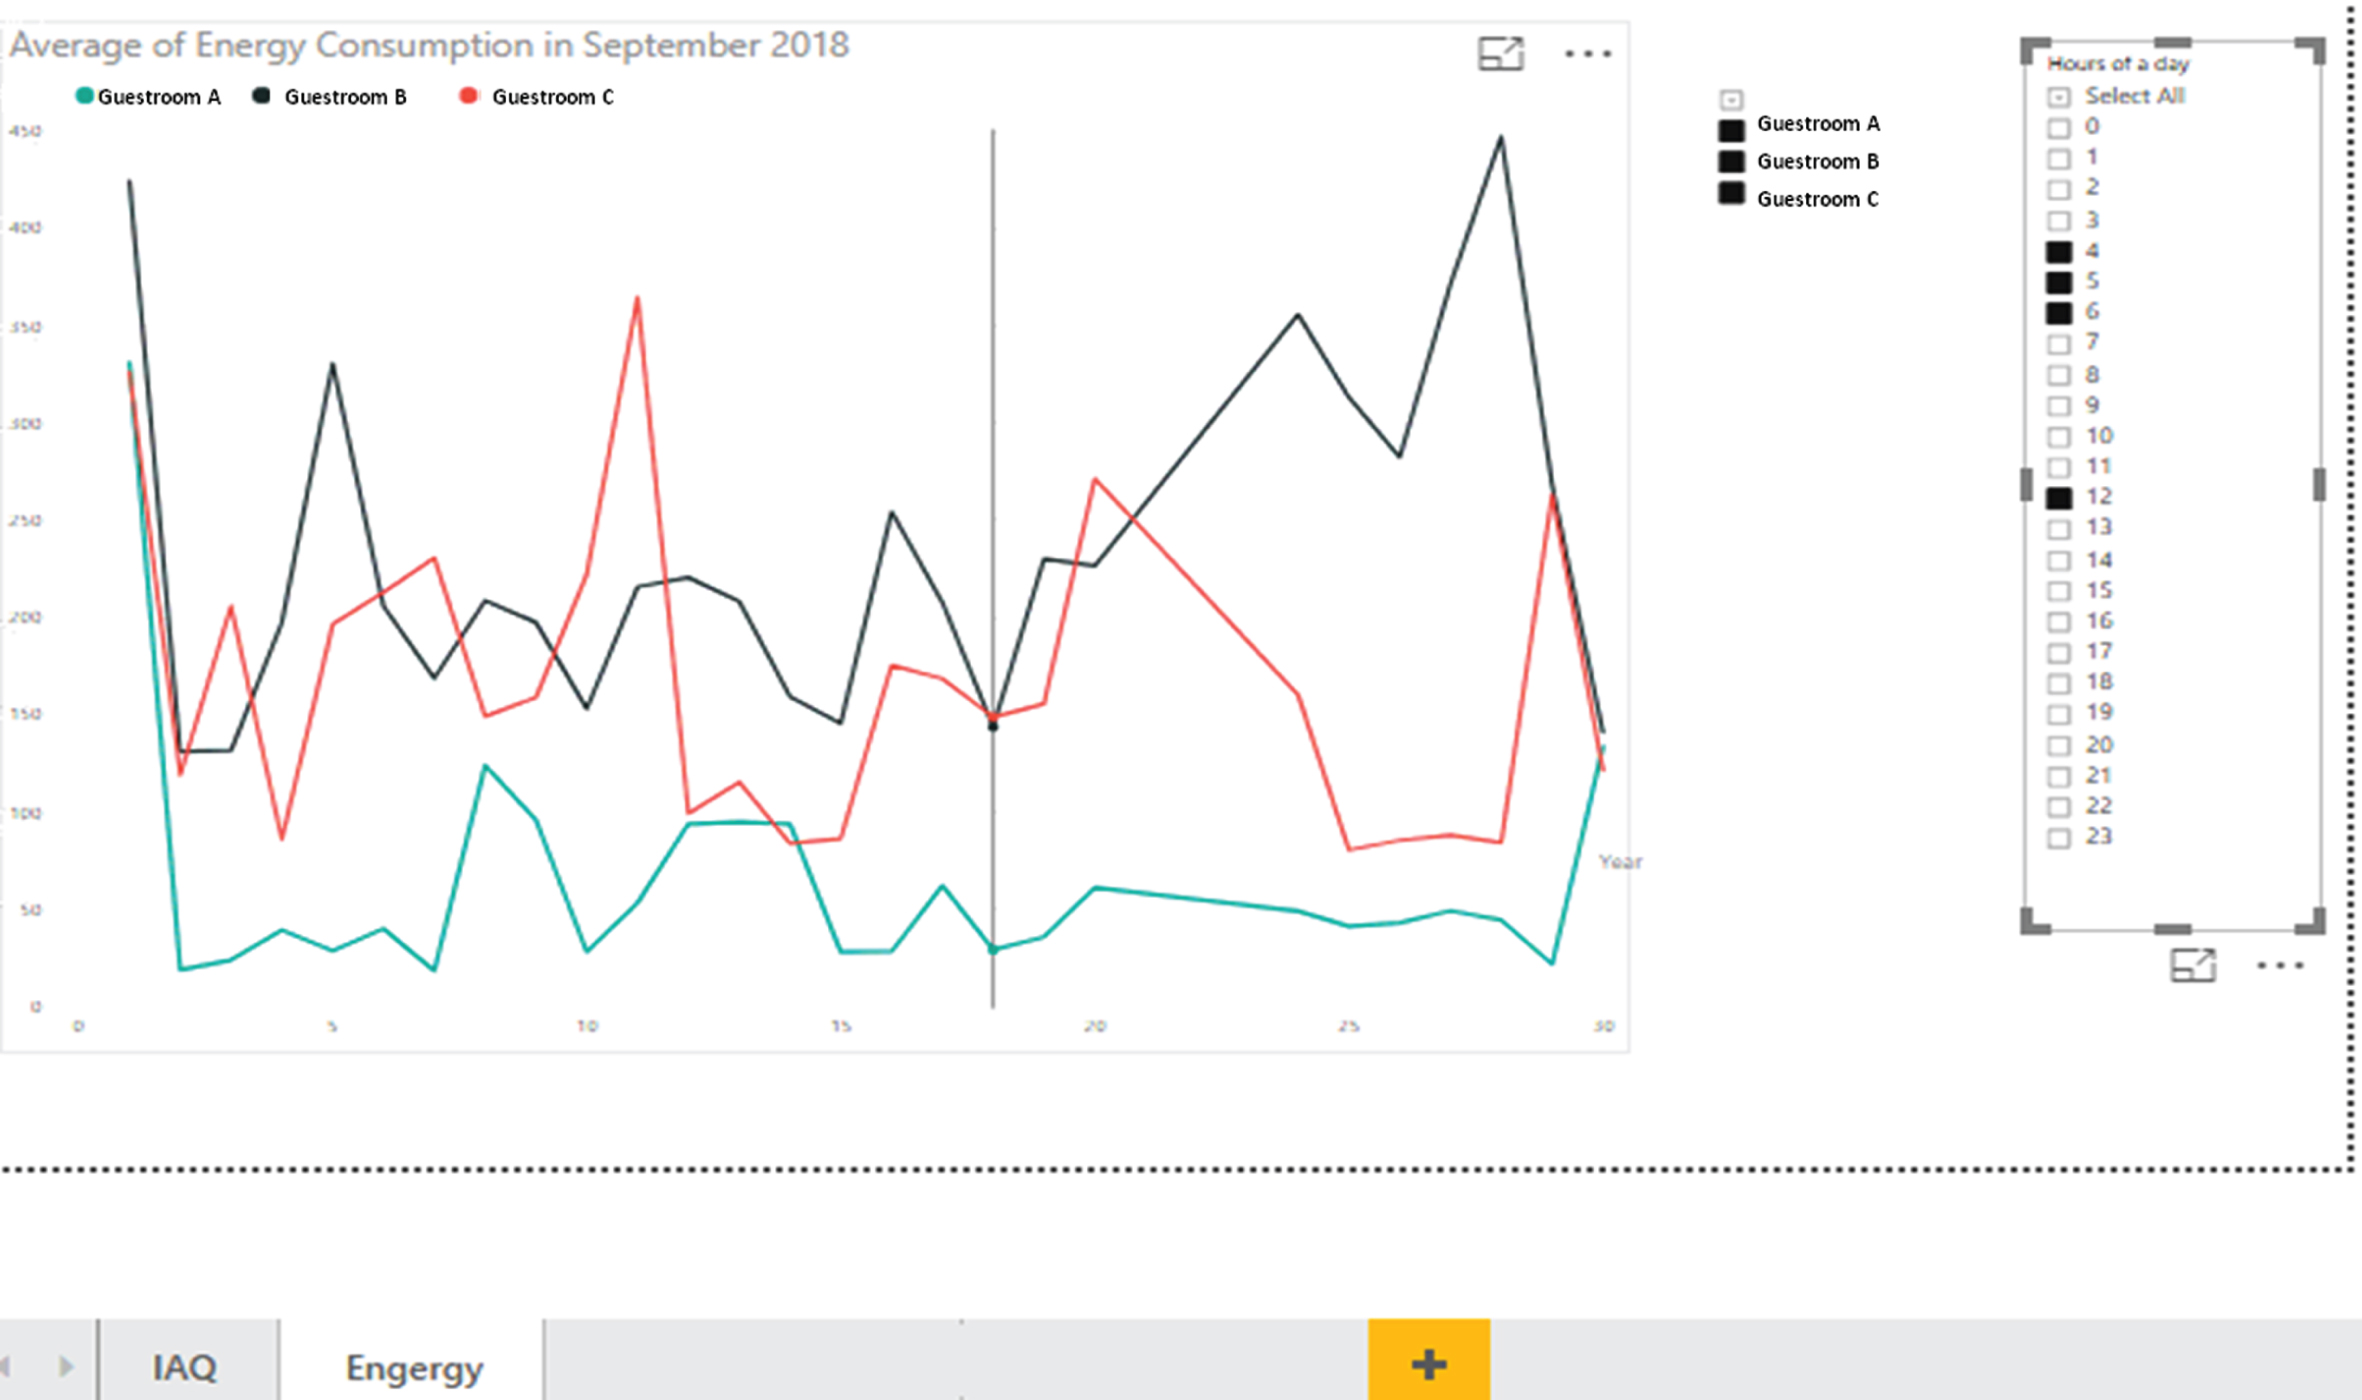
Visualized information of the energy efficiency in a hotel guestroom.
Meanwhile, the numerical information is also available for the facility managers in addition to the visualized information of the IEQ and the relevant energy efficiency in a hotel guestroom. As shown in Fig. 14, the numerical information could be retrieved depending on the needs for the specific analytics, which allows the facility mangers to drill down into the minute-level details of the bigdata.

Numerical information of the IEQ in a hotel guestroom.
In recent decades, the concept of green hotel has been promoted; and accordingly, the
hotel industry in Hong Kong has started to consider a sustainable design and
operation to obtain more competitiveness as international hotel groups. In
particular, it is essential to find a convenient way for the facility managers to
recognize a real-time situation about the IEQ and the relevant energy efficiency in
a hotel guestroom. Based on this background, this study aimed to develop a scalable
integrated platform for providing real-time monitoring, alert notification, and
analytics so as to satisfy the level of the occupants’ comfort and satisfaction by
enhancing the building performance focusing on the nexus of the IEQ and the relevant
energy efficiency. The main contributions of this study can be summarized as
follows: The proposed platform could offer an integrated solution with a
user-friendly visualization for data consulting, notifications, and
analytical reports so that the facility managers could gain insight from
the real-time bigdata, which could support a strategic facility planning
for the interventions of hotel management. In particular, the proposed
platform could provide the real-time hierarchical and historical
information, and it could also be integrated with the notification and
analytics system that allows the facility managers to take actions at a
point of time. The
proposed platform (i.e., real-time monitoring, notification, and
analytics systems) could be continuously improved with various
advantages such as easy installation and configuration, a low cost of
implementation, modularity, scalability, and high accessibility. In
particular, the IoT-based system architecture enables the scalability of
the proposed platform, providing flexibility and expandability in
accordance with the strategic facility planning from a macro
perspective.
In conclusion, this study proposed a novel approach to creating a comfortable and healthy environment for the occupants in a hotel guestroom while realizing the energy efficiency in real time. The proposed platform was validated with three guestrooms in a hotel, and the scalability of the system was fully confirmed. In the future studies, it is expected to deploy the proposed platform to a larger physical entity of the hotel (e.g., floor level or full facility level) with a well-designed scalable architecture. Furthermore, it is planned to develop various kinds of occupant-centered services in a hotel guestroom level by conducting focus group interviews or questionnaire surveys.
Conflict of interest
The authors declare no conflict of interest.
Footnotes
Acknowledgments
This work was supported by the National Research Foundation of Korea (NRF) grant funded by the Korean government (MSIP; Ministry of Science, ICT & Future Planning) (NRF-2020R1C1C1004147) and School of Hotel & Tourism Management (SHTM) at the Hong Kong Polytechnic University (4-ZZHU).