



Abstract
BACKGROUND:
Brain neural activity is measured using electroencephalography (EEG) recording from the scalp. The EEG motor/imagery tasks help disabled people to communicate with the external environment.
OBJECTIVE:
In this paper, robust multiscale sample entropy (MSE) and wavelet entropy measures are employed using topographic maps’ analysis and tabulated form to quantify the dynamics of EEG motor movements tasks with actual and imagery opening and closing of fist or feet movements.
METHODS:
To distinguish these conditions, we used the topographic maps which visually show the significance level of the brain regions and probes for dominant activities. The paired t-test and Posthoc Tukey test are used to find the significance levels.
RESULTS:
The topographic maps results obtained using MSE reveal that maximum electrodes show the significance in frontpolar, frontal, and few frontal and parietal brain regions at temporal scales 3, 4, 6 and 7. Moreover, it was also observed that the distribution of significance is from frontoparietal brain regions. Using wavelet entropy, the significant results are obtained at frontpolar, frontal, and few electrodes in right hemisphere. The highest significance is obtained at frontpolar electrodes followed by frontal and few central and parietal electrodes.
Introduction
Computer hardware and software have become an indispensable tool for humans to interact with their environment without involvement of peripheral nerves and muscles by controlling signals produced by brain activities. Electroencephalography (EEG)-based brain computer interface (BCI) systems enhance the possibility of more communication channels for the people suffering from severe motor and neuromuscular disabilities. The electrical voltage fluctuations produced as the result of current flow due to the brain neural activity along the scalp are measured using EEG [1]. The electrical activity of the brain in typical EEG tests is monitored and recorded using electrodes that are fixed on the scalp [2]. Brain computer interface (BCI) is a combination of hardware and software systems that enables the use of the brain’s neural activity to communicate with others or to control machines, artificial limbs or robots with direct physical movements [3, 4]. To deal with motor and neuromuscular disabilities, there are two main applications or devices that are used to control a computer through brain activities without controlling muscles known as brain computer interface (BCI) and electroencephalogram (EEG). BCIs are based on motor imagery movements of different types of limbs, such as the right and left hand, right and left foot and tongue. BCI is a highly interdisciplinary focused area that integrates neurology, medicine, psychology, engineering, computer interaction (HCI), rehabilitation and signal processing. In this study, we have computed the complexity of EEG motor movement and motor imagery tasks with both fist or feet movement during opening and closing of eyes. The distribution of entropy and significance level using topographic maps for 19 selected electrodes was computed to check which brain region gives dominant results during these conditions. The significance level of distributions was found in frontal, central, parietal, central and few occipital regions which is an indication that these brain regions are more important to further study the dynamics of these activities.
The brain dynamics are nonlinear, non-stationary and complex in nature. Previously, researchers developed numerous traditional methods to quantify the dynamics of these systems. However, traditional methods are unable to quantify the dynamics of these systems accurately. Furthermore, previous studies reveal that physiological systems exhibit dynamical fluctuations across multiple spatiotemporal scales [5, 6, 7, 8]. The traditional entropy methods such as approximate entropy [9] and sample entropy [10] based on single scale fail to quantify the dynamics of physiological systems and to quantify the degree of regularity in the system. To address these issues multiscale entropy (MSE) was proposed by Costa et al. [7], which estimates the accurate information at multiple temporal scales. Kang et al. [11] used MSE to quantify the dynamical changes in complexity of each sub-band under normothermia and hypothermia conditions. Park et al. [12] applied MSE to quantify the dynamics of Alzheimer’s disease [13, 14] while investigating the seizures state, pre-seizures and seizures interval states in epileptic patients using MSE and symbolic dynamics. They investigated that seizures free states are more complex than the pre-seizures and during seizures dynamics. The dynamics were also investigated in term of topographic maps which shows that which brain regions are more dominant during these conditions. Hussain et al. [15] recently employed time-frequency representation methods such as wavelet phase coherence and cross frequency coupling based on dynamical Bayesian inference approach to compute the spatial relationship and coupling between brain waves during resting state. In another study, Hussain et al. [16] extracted hybrid features based on refined fuzzy entropy approaches to detect the arrhythmia by employing robust machine learning techniques. Recently, Hussain et al. [17] extracted morphological features from the prostate cancer imaging database and employed Bayesian network analysis approach to determine the association among the features by computing strength, node force and interaction among the nodes that will help to diagnose and earlier detection of cancer. Hybrid features extracted from lung cancer imaging data were employed by Hussain et al. [18] to quantify the dynamics of lung cancer using fuzzy entropy-based methods.
Material and methods
Dataset
In the present study, the datasets for EEG motor movement tasks comprising of EEG motor movement/imagery tasks with fist and feet movement were taken from the publicly available database Physionet, which is available at
The EEG data comprised of 109 subjects performing different motor/imagery tasks and was acquired using BCI2000 system. The data acquisition procedure is described in detail in other studies [20, 21, 22]. Subjects were asked to execute and imagine different tasks while 64 channels of EEG signals were recorded from the electrodes that were fitted along the scalp. In the present study, we extracted the data of only two tasks from 14 experimental runs i.e. EEG motor movement with actual fist and feet movement of 30 subjects, and EEG motor movement with imagery fist and feet movement of 30 subjects, with a total of 60 subjects from both tasks; i.e. task 5 and task 6 with such as Fp1, Fp2, F3, F7, Fz, F4, F8, P7, P3, Pz, P4, P8, T7, T8, C3, CZ, C4, O1, O2. The detailed 14 experimental runs performed by each single subject are detailed in the Physionet data description section.
Schematic diagram to illustrate the flow of the system.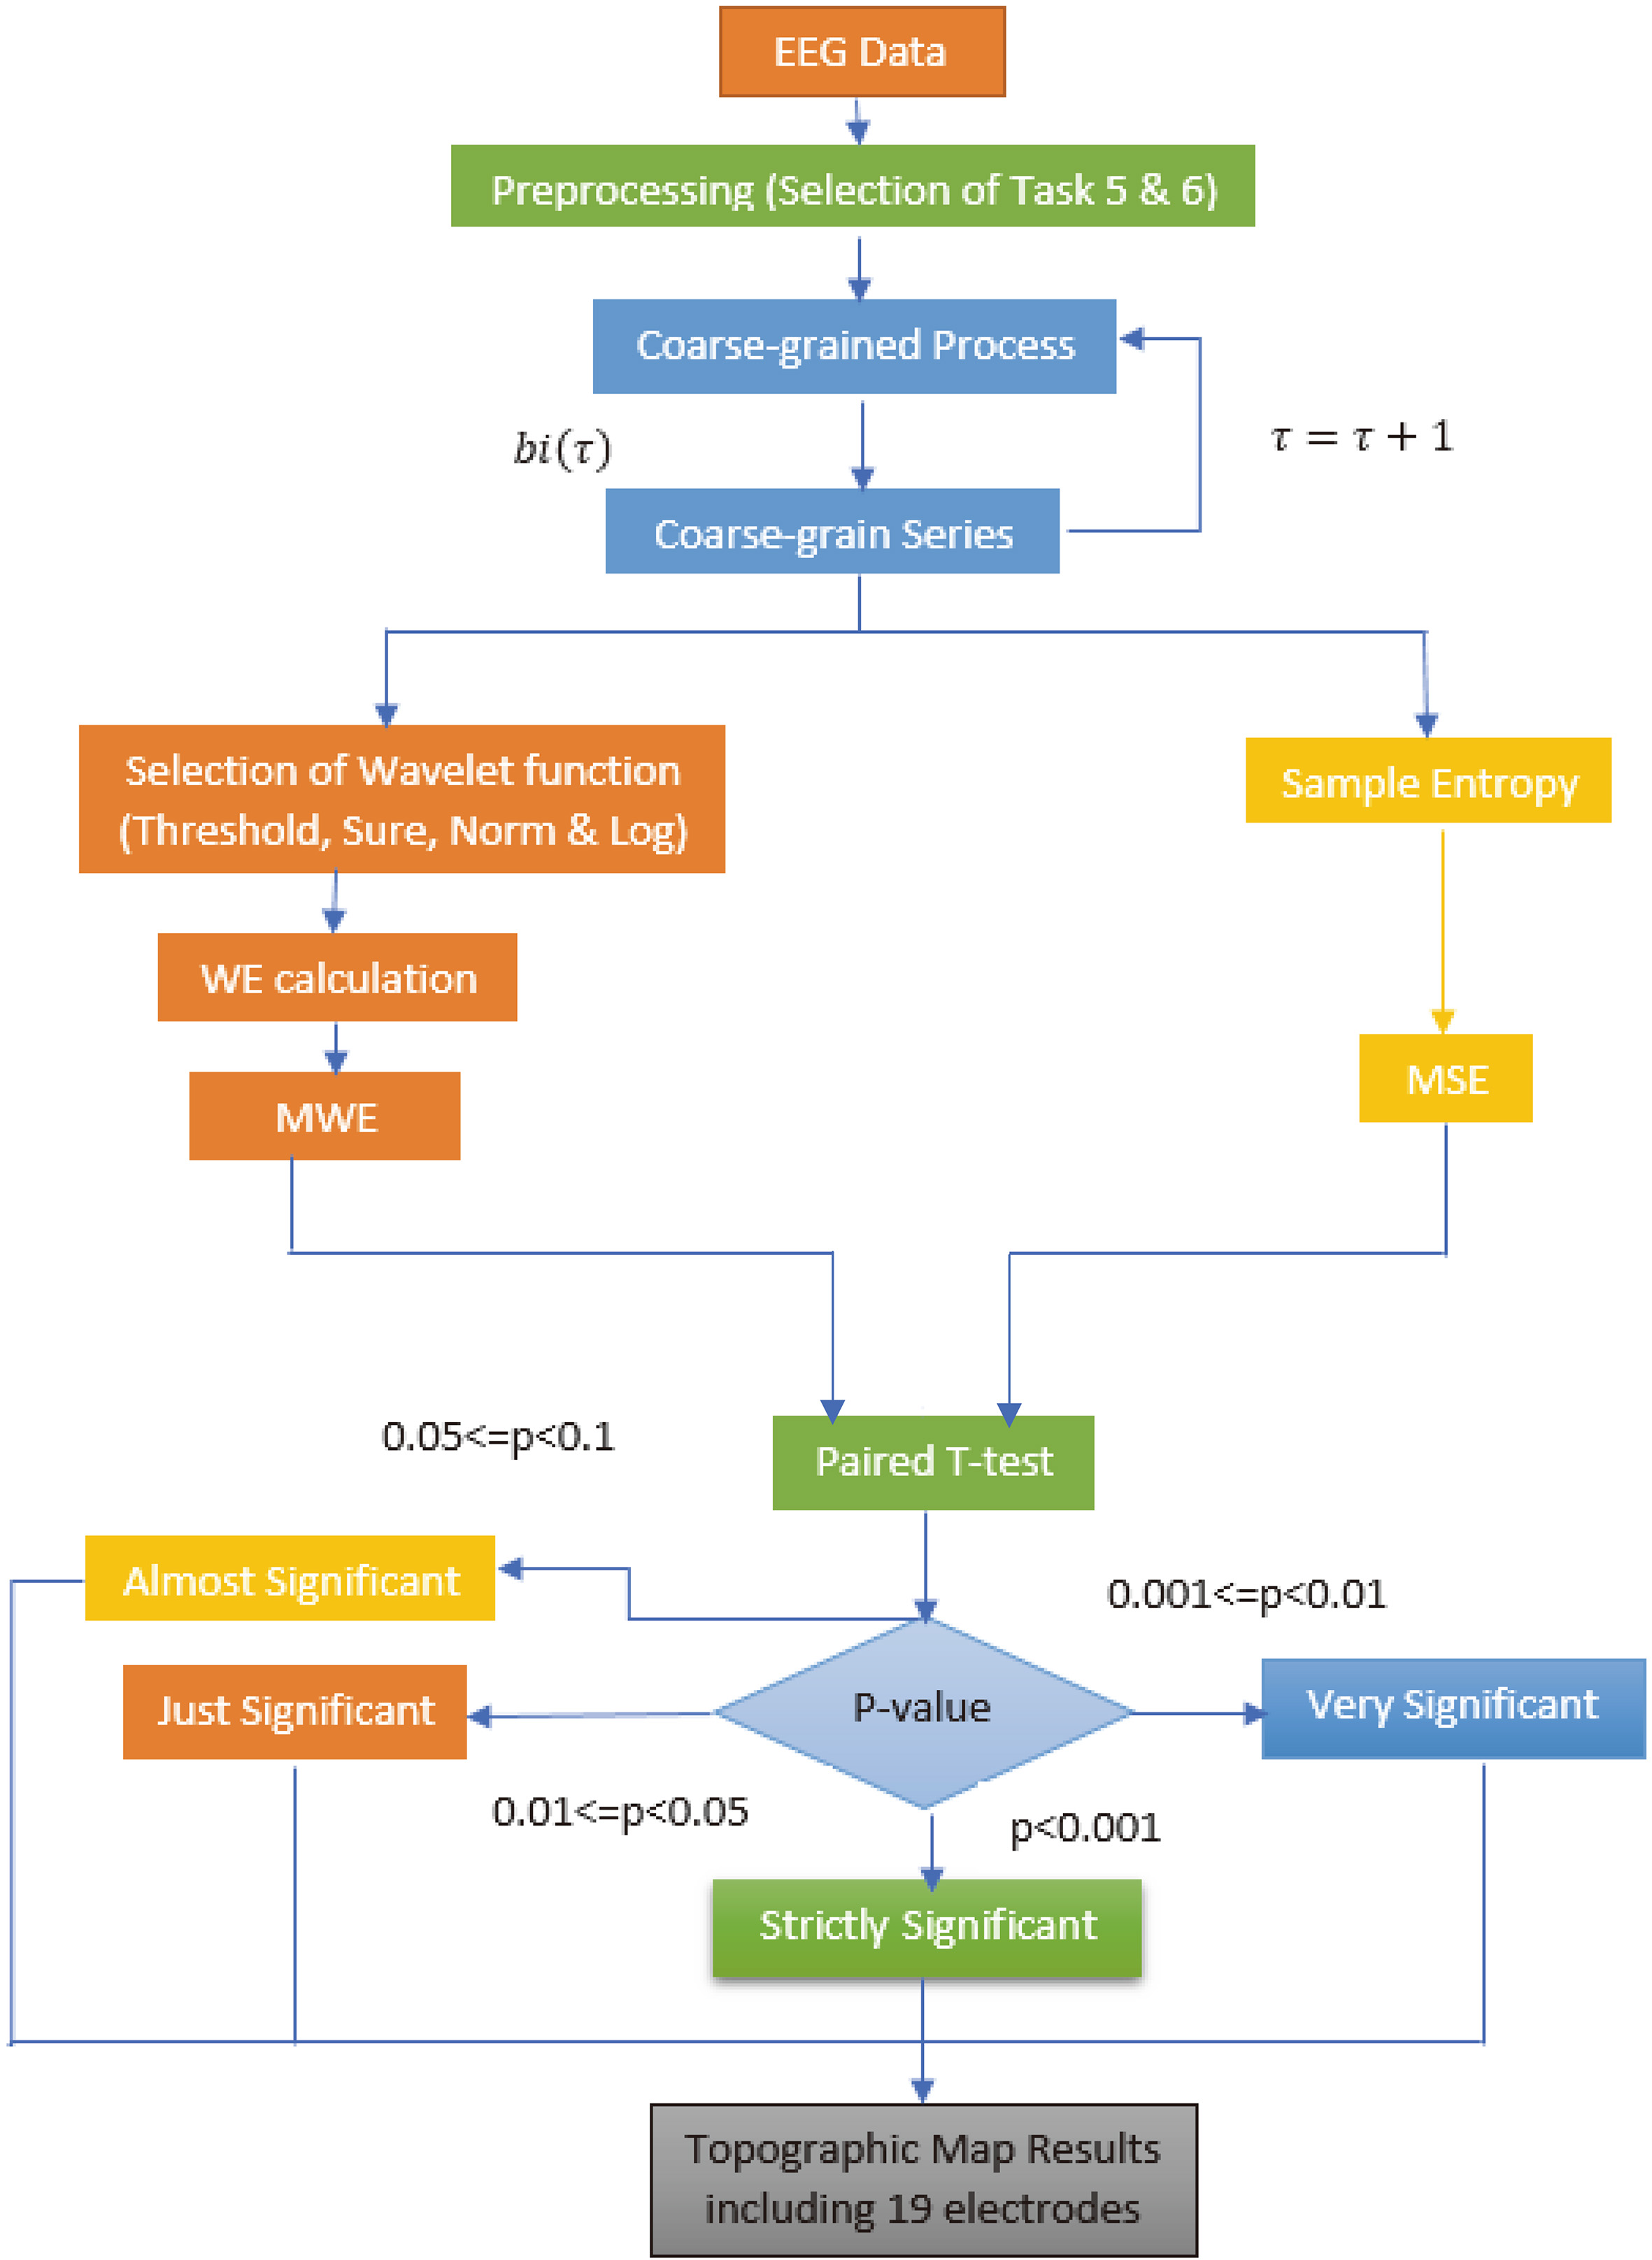
Figure 1 illustrates the schematic flow of the study. In the first step, the EEG motor tasks are selected which are then computed for coarse-grained series for quantifying the dynamics at multiple temporal scales. Both multiscale sample and wavelet entropies are computed to distinguish these conditions. Finally, the significance level and entropy distribution were presented in the form of topographic maps comprising of 19 electrodes from frontal, parietal, temporal, central and occipital regions.
Complexity analysis
The dynamical behavior of various physiological systems can be studied by examining the complexity of the systems [23, 24, 25] including their behavior and physiological aging [26, 27] using nonlinear dynamical measures [28, 29, 30, 31]. The complexity is inherited with many other concepts such as entropy, information theory and randomness [31, 32, 33, 34, 35]. Lipsitz [36] found that the complexity of physiological systems reduce with aging disease. The reduction in the complexity is due to the structural or functional changes in the organization of the system. Moreover, the behavior of physiological systems is influenced by other internal and external stimuli. Numerous complexity analyses have been proposed by researchers, such as approximate entropy [31], Lyapunov exponent [37], spectral analysis [38], detrended fluctuation analysis [39] for quantifying the dynamics of physiological systems. Recently, Hussain et al. [18] examined the complex dynamics of lung cancer imaging data by extracting different features. They also quantified the complex dynamics for detecting epileptic seizure and arrhythmia by employing entropy-based complexity measures [13, 16, 40]. In this study, we used sample entropy at multiple temporal scales as discussed with their mathematical formulation in [40].
Wavelet
Wavelet is another type of transform alternative to short-time Fourier transform (STFT) [41], which provides good time resolution for high frequencies and frequency resolutions for short-time windows. In this study, we used mother wavelet as detailed in [15] with central frequency of
Wavelet entropy methods
Wavelet entropy is also used to analyse the dynamics of the time series data which are nonlinear in nature. The commonly used wavelet methods [42] include Shannon, log energy, threshold, sure and norm. The mathematical formulation and use of these methods is detailed in [40].
Statistical analysis
To investigate the systematic differences between EEG actual motor movements (task 5) and motor imagery tasks (task 6) of both fist and feet during opening and closing of eyes, the movements were computed using paired t-test and Posthoc Tukey test. Paired t-test is used because the differences were computed of actual and imagery movements of the same individuals. The significance level was computed for these topographic maps as detailed in [15, 43].
Results
In this study, non-linear complexity methods such as multiscale sample entropy (MSE) and wavelet entropy using topographic maps and tabulated form are proposed to analyse the complexity of EEG signals with actual and imagery fist or feet movements. EEG topographic maps give an idea of the brain activation to visually exhibit the dominance of any brain regions. Task 5 (R5) denotes the actual open and close of both fists or feet and task 6 (R6) denotes imagery opening and closing of both first or feet movement. Figure 2 shows the topographic maps using sample entropy at scale 3, the first topographic map shows the mean entropy values of task 5. The different colours denote the mean of different entropy values as reflected by the colour bar. The frontal brain regions reflect the entropy values in the range 1.3 to 1.5. The other region reflects values as shown in Fig. 2. It is also evident that entropy values increased from frontal to central, occipital, temporal and parietal brain regions. The higher the entropy values, the more complex the brain regions; when the entropy values are decreased, it points to a less complex brain region.
Topographic map analysis to distinguish the fist and feet movements using sample entropy and wavelet entropy at scale 3.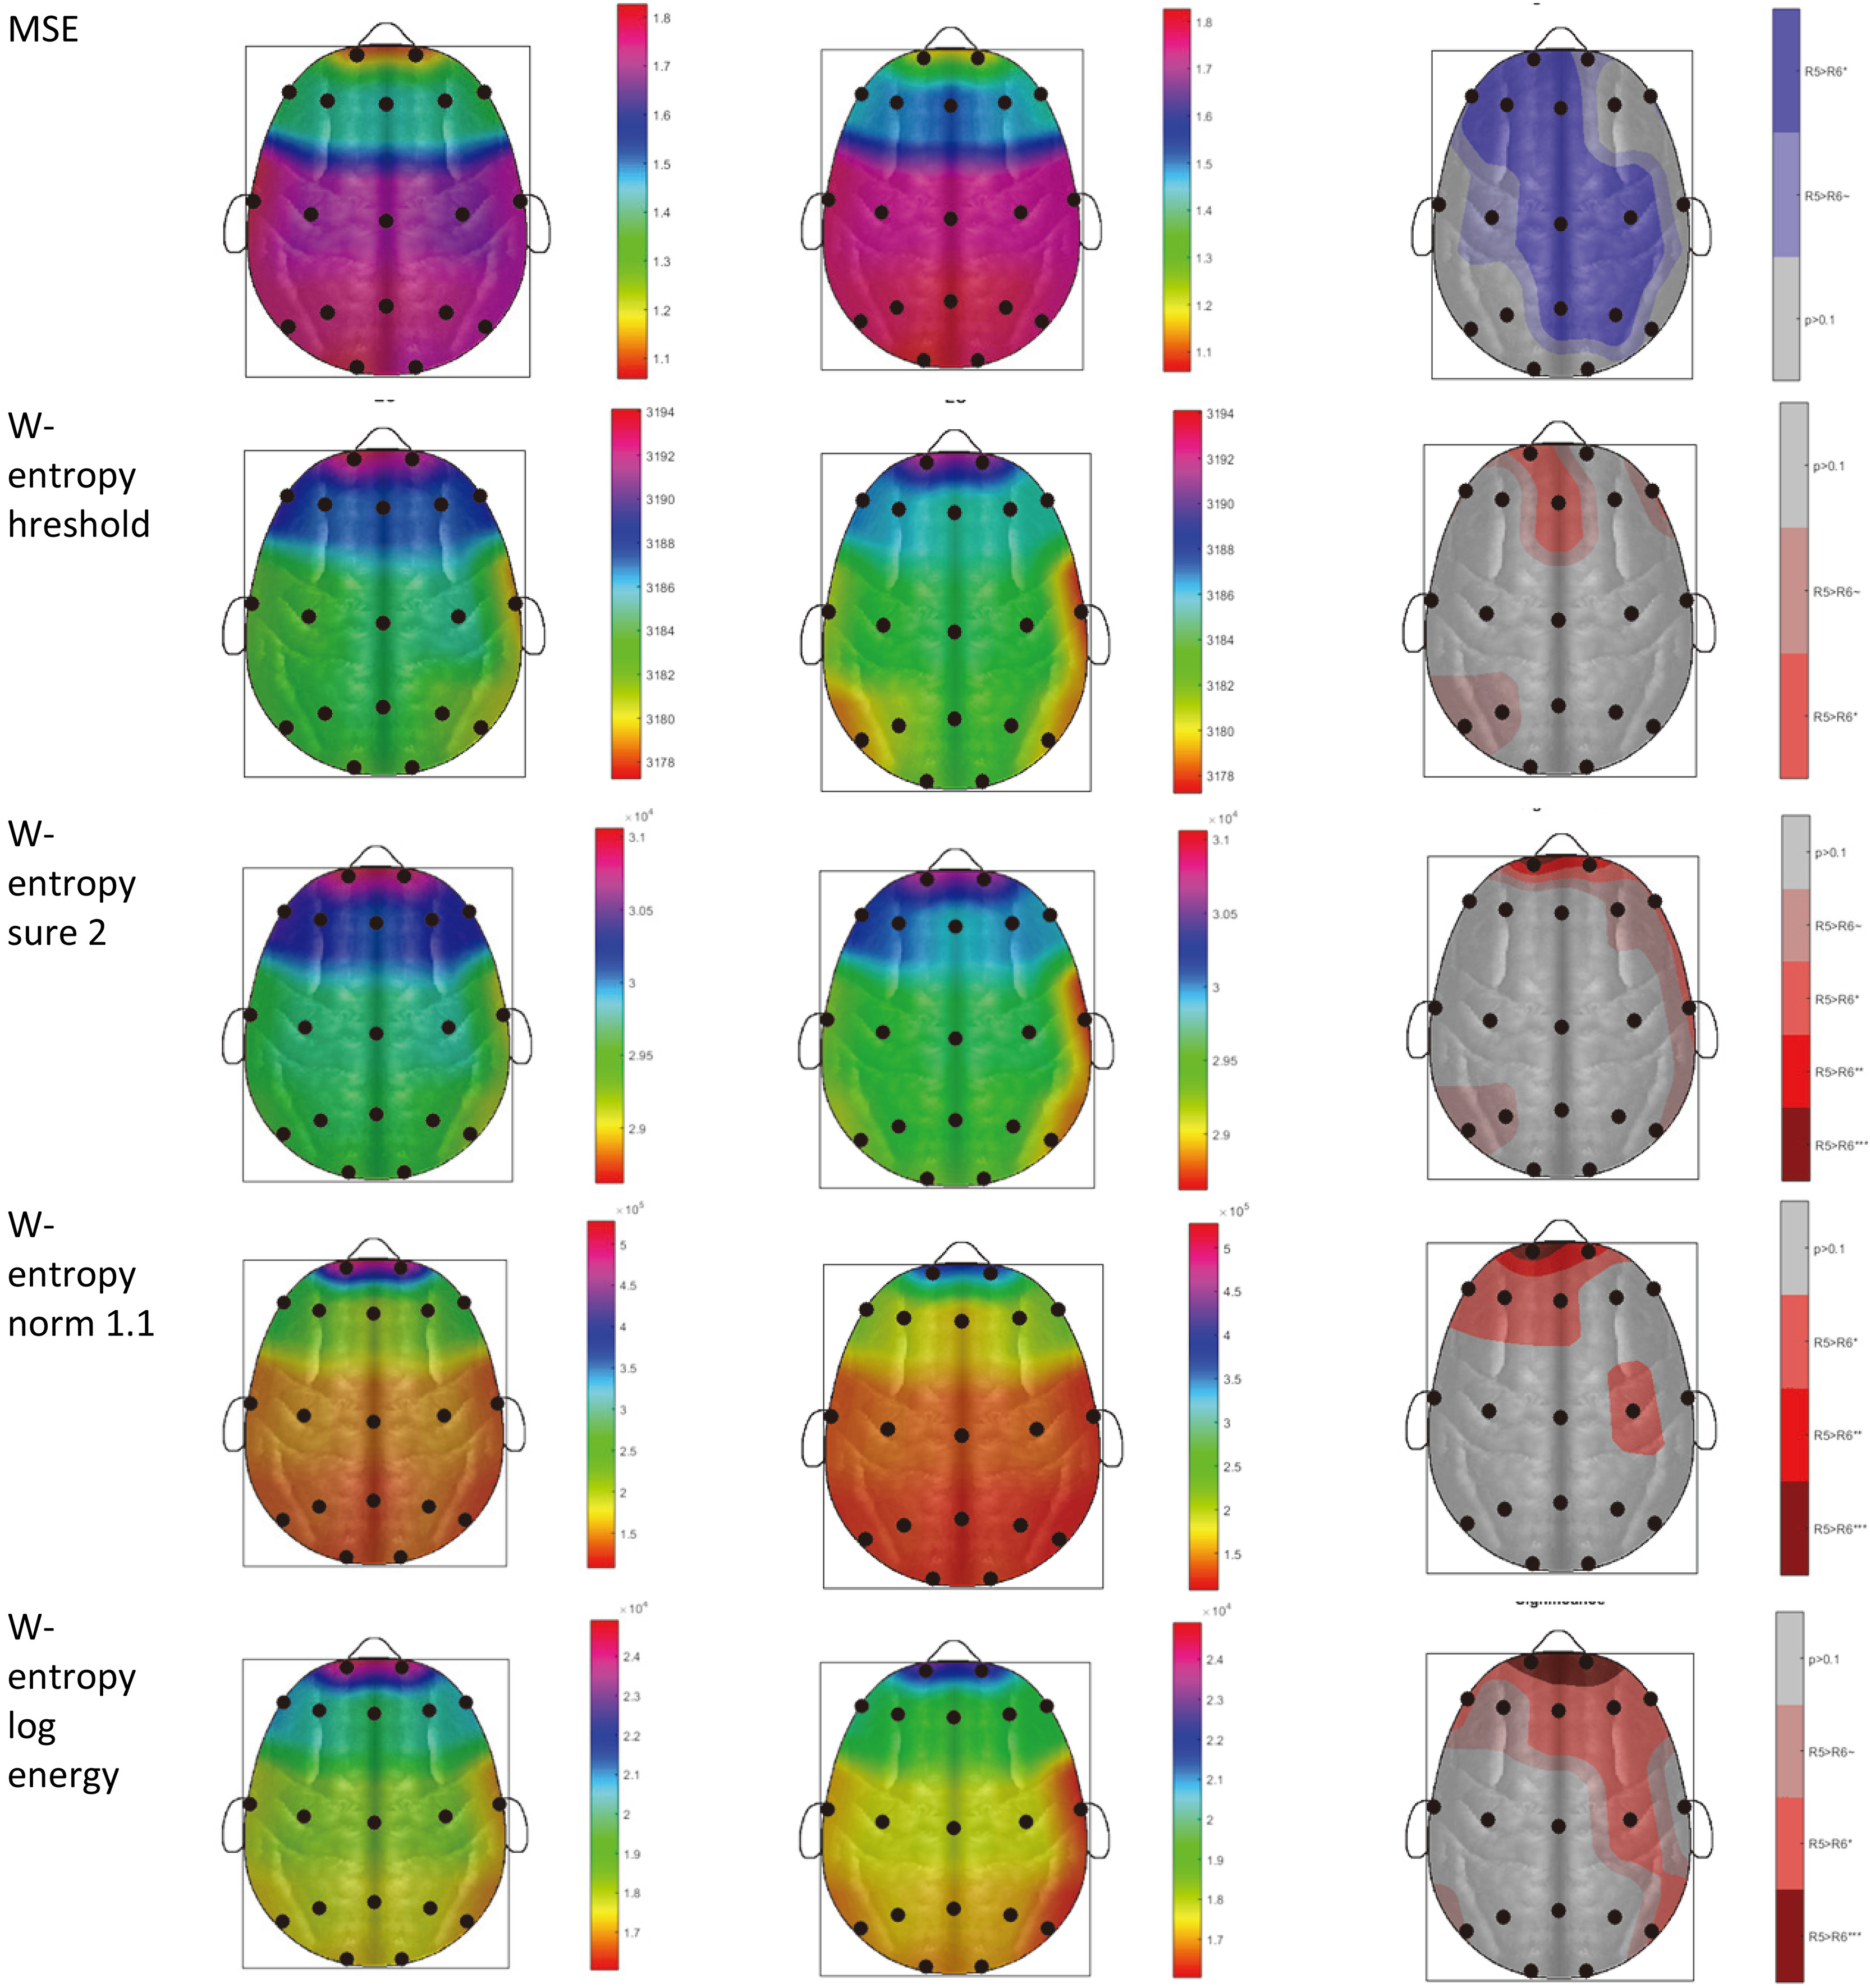
Moreover, in Fig. 2, using topographic maps, the W-entropy threshold at scale 3, the topographic map shows the mean entropy values of tasks 5 and 6. The different colours denote the mean of different entropy values as reflected by the colour bar. The frontal brain regions reflect the entropy values in the range 3192 to 3184. Similarly, the entropy values for other brain regions are reflected accordingly. In the topographic maps, using W-entropy sure 2 at scale 3, the first topographic map shows the mean entropy values of task 5. The different colours denote the mean of different entropy values as reflected by the colour bar. The frontal brain regions reflect the entropy values in the range 3
In topographic maps, using W-entropy norm 1.1 at scale 3, the first topographic map shows the mean entropy values of task 5. The different colours denote the mean of different entropy values as reflected by the colour bar. The frontal brain regions reflect the entropy values in the range 2
The last column in Fig. 2 shows the significance level in the form of topographic maps at scale 3 for MSE and wavelet entropies. Using MSE, this map shows that at electrode Fp1, F3, Fz, Cz, C2, Pz, and P2 exhibits just significant result (
Using wavelet entropy i.e. threshold at scale 3, the electrodes Fp1 and F2 exhibit just significant result (
Significance to distinguish task 5 and task 6 using MSE at multiple temporal scales
In this study, we took the EEG motor movement dataset with fist and feet movement/imagery task from Physionet. We used 19 standard electrodes from different brain regions such as central (C3, C4, Cz), frontal (F3, F4, F7, F8), front polar (Fp1, Fp2), occipital (O1, O2), temporal (T7, T8) and parietal (P3, P4, P7, P8) according to the international 10–20 system and sampled at 160 Hz of 1 to 2 minutes recording. Each subject performed 14 runs as detailed in dataset description. There were different tasks performed using these 14 runs, however, in this study we have chosen task 5 i.e. EEG motor movement with actual fist and feet movement and task 6 i.e. EEG motor movement with imagery fist and feet movement. We employed multiscale sample entropy (MSE) and multiscale wavelet entropies to distinguish these conditions at selected electrodes. The performance was evaluated using paired t-test and Posthoc Tukey test and represented in form of topographic maps and tabulated form as well.
The parietal electrode P3 gives strictly significant results with
a). Descriptive statistics for electrode Fp1 based on Posthoc Tukey using MSE at temporal scale 7
We applied the Posthoc Tukey test as reflected in Table 2a and b and Table 3a and b on few selected electrodes (Fp1 at scale 7 and P3 at scale 5) from which we obtained very significant results using the t-test. There were 30 subjects for task 5 and 30 subjects for task 6. For electrode Fp1, the statistical values are obtained for task 5 mean (1.0066), standard deviation (0.2930), standard error (0.0535), 95% confidence interval for mean with lower bound (0.8970) and upper bound (1.1161), minimum (0.6268) and maximum (1.8570). Moreover, for task 6 we obtained the statistical values such as mean (1.3661), standard deviation (0.3966), standard error (0.0724), 95% CI for mean with lower bound (1.2180), upper bound (1.5142), minimum (0.6950) and maximum (2.1416). Likewise, the ANOVA statistics for selected electrode Fp1 using MSE at scale 7, we obtained sum of square between the groups (1.9381), mean square (1.9381) and significance
a). Descriptive statistics for electrode P3 based on Posthoc Tukey using MSE at temporal scale 5
The descriptive statistics for selected electrode P3 using MSE at temporal scale 5, for task 5 we obtained mean (1.8562), standard deviation (0.3259), standard error (0.0595), 95% confidence interval for mean with lower bound (1.7345), upper bound (1.9779), minimum (1.2759), maximum (2.4225); and for task 6, we obtained mean (1.7165), standard deviation (0.3635), standard error (0.0664), 95% CI for mean with lower bound (1.5808), upper bound (1.8522), minimum (0.8154) and maximum (2.3756). The ANOVA statistics for selected electrode P3 using MSE at scale 5, we obtained sum of squares between groups (0.2927), mean square between groups (0.2927) and significance
Tests of normality
Table 4 reflects the normality test using Kolmogorov-Smirnov and Shapiro-Wilk for the 19 selected electrodes. The electrodes F3, F4, F8, Fp1 and Fp2 give significant results (
Topographic maps significance results using wavelet threshold, sure, norm and log energy at multiple temporal scales.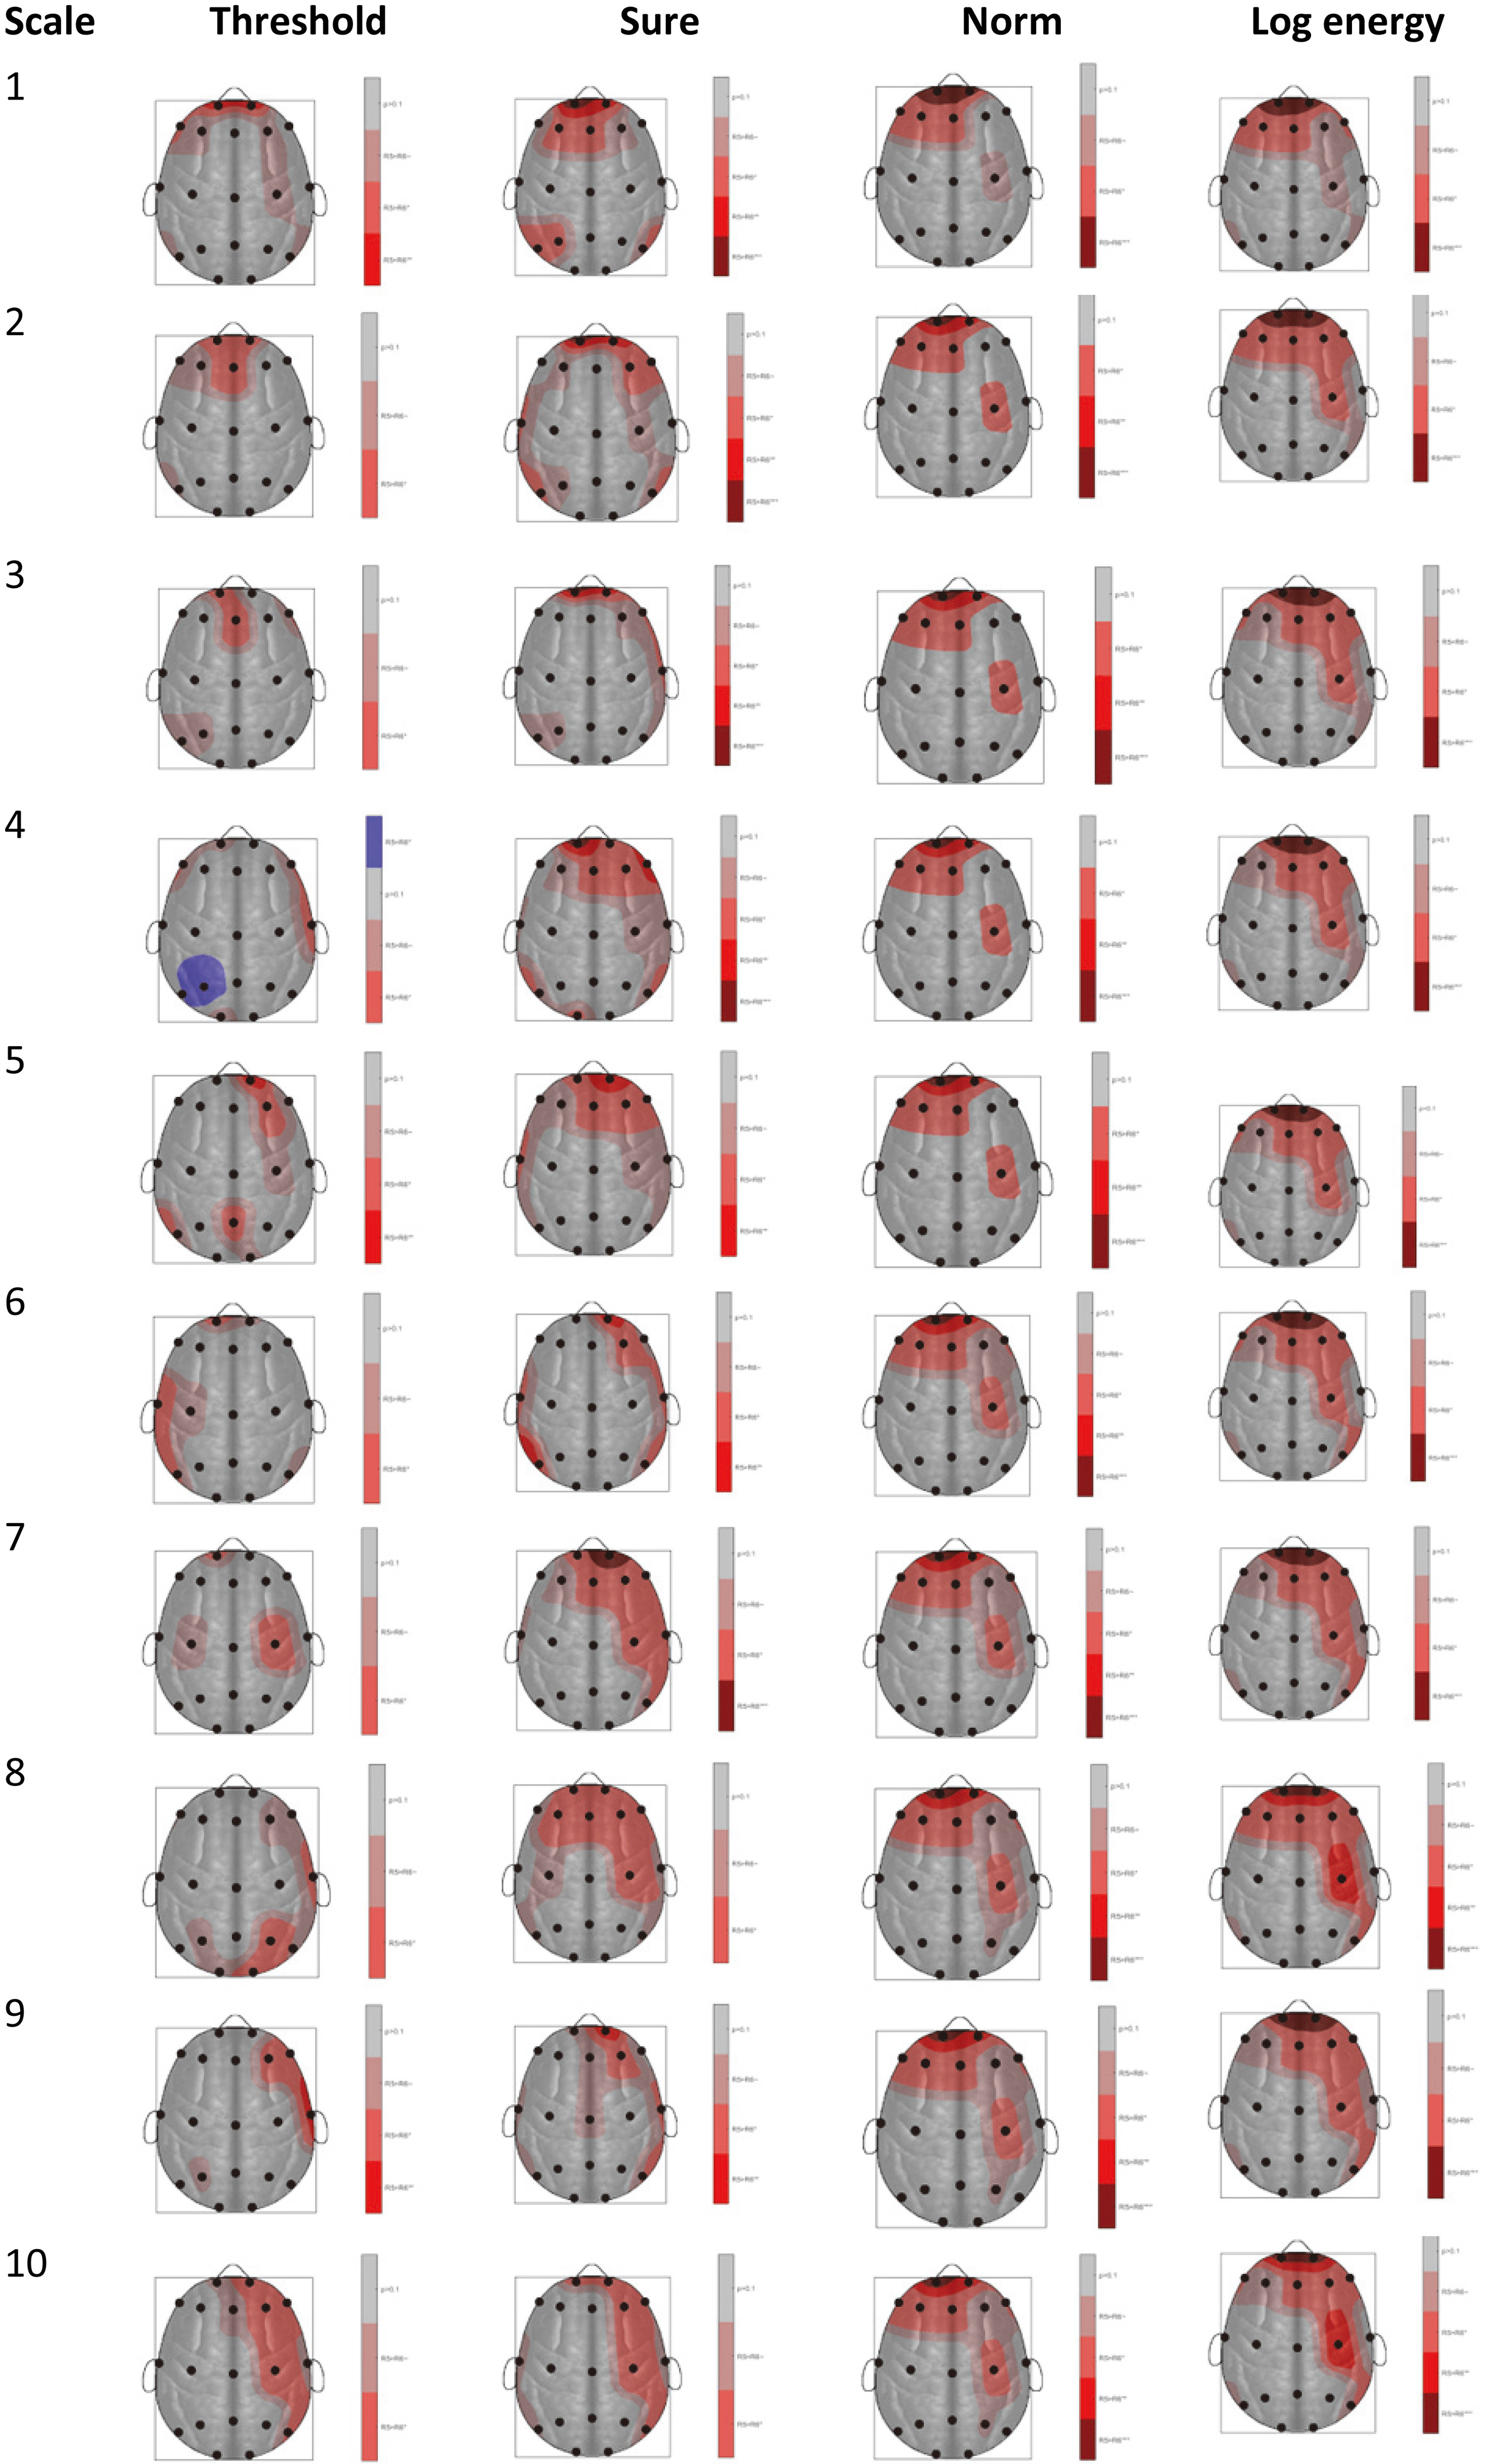
In this study, we quantified the dynamics of EEG signals with actual and imagery fist and feet movement using both topographic maps and tabulated form using robust multiscale sample entropy and wavelet entropies computed from wavelet packet. The representation of significance level in the form of topographic maps provides an overall visual picture to see the significance level region-wise, which can be very useful for further studies of the dynamics of these EEG signals. Thus, the significance level of other wavelet entropy measures is represented in the form of topographic maps as reflected in Fig. 3.
Figure 3 shows the significance results using wavelet entropies at multiple temporal scales in the form of topographic maps to visually depict the dominance of brain regions with different significance levels from scale 1 to 10. At temporal scale 1, using wavelet entropy i.e. threshold, the electrodes Fp1, Fp2 showed very significant results, F1 showed just significant result and C4, F4 showed almost significant results whereas all other electrodes showed no significant result. Using wavelet entropy i.e. sure, the electrode Fp1 showed strictly significance, electrode Fp2 showed very significant result, electrodes F3, Fz, P7, P3 showed just significant results and electrodes F1, F4, P8 showed almost significant results. In case of W-entropy norm the electrodes Fp1 exhibit strictly statistically significant result. Fp2 shows very significant result. At electrodes F7, F3, Fz, C4 show just significant results and other electrode show no result. In case of W-entropy long energy at electrodes Fp1, Fp2 show strictly significant results. Electrodes F1, Fz, F4, F8, C4 exhibit just significant result and F3 shows almost significant results as reflected in the topographic map in Fig. 3.
The threshold entropy from scale 1 to 10 gives significant results in only few electrodes, whereas other wavelet entropies i.e. sure, norm and log energy give significant results at most of the frontal, front polar and central electrodes from scale 1 to 10. Using these entropy measures, the front polar electrodes give strictly significant results, whereas the frontal electrodes of both right and left hemisphere give just significant results. Few other central electrodes also exhibit significant result to distinguish these conditions.
Boxplots to distinguish the EEG signals with actual and imagery opening and closing of fist or feet movements from selected electrodes where higher significance results were obtained at scales (a) 2, (b) 3, (c) 6, (d) 7, (e) 9 and (f) 10 using MSE and whisker length indicate the standard error to indicate the degree of spread and skewness in the data.
In Fig. 4, the single circle inside each box is the mean MSE value at a specified scale. The edges of the box represent 25th and 75th percentile. 50% of the subjects in a group lie within the box and the remaining 50% of subjects lie between the box and whiskers with some exceptions called outliers. The outliers are the MSE values represented by (
The physiological systems are highly complex in nature. The behavior and complexity of physiological signals and systems decreases with aging and disease. This loss of complexity happens due to loss of functional impairments components and/or altering of coupling functions. Recently, researchers employed various nonlinear dynamical measures [13, 15, 18, 40, 44, 45, 46, 47, 48] to capture the dynamics of these systems. Various researchers [49, 50, 51] computed the coupling function to investigate the dynamical neural interactions in the form of coupling strength and similarity during EEG resting state to distinguish the eye closed (EC) from eye open (EO) condition. Rathore et al. [52, 53, 54] investigated the dynamics of colon cancer by computing hybrid and geometric features. Likewise, Hussain et al. extracted hybrid features based on texture, morphology, SIFT, EFDs and entropy-based features to detect and predict prostate cancer [47] and brain tumors. In this study, we have investigated the dynamics of EEG motor movement/imagery tasks with fist and feet movements using complexity based MSE and wavelet entropic measures at multiple temporal scales using the topographic maps for selected 19 electrodes such as the central regions (C3, C4, Cz), frontal regions (F3, F4, F7, F8, Fp1, Fp2, Fz), occipital regions (O1, O2), parietal regions (P3, P4, Pz, P7, P8) and temporal regions (T7, T8). The topographic maps visually show which electrode and brain regions are more dominant in form of significant results to differentiate and quantify the dynamics of motor imagery and actual movement tasks during fist and feet movements.
One researcher [22] extracted wavelet based features from EEG signals with fist and feet movements. The features used were root mean square (RMS), mean absolute value (MAV), integrated EEG (IEEG), simple square integral (SSI), variance of EEG (VAR), and average amplitude change (AAC). The highest performance using different Coiflet functions with different features and a variable number of hidden layers for NN classifiers was obtained at Coif4 with average accuracy (89.11%) using MAV, and other performance metrics obtained accordingly. Moreover, the highest performance using different Symlets functions with different features and a variable number of hidden layers for NN classifiers was obtained at Sym2 with average accuracy (84.51%) using MAV and other measures accordingly.
Based on the nonlinear dynamics of EEG signals with fist and feet movement using imagery and actual movements, we employed multiscale sample entropy (MSE) and wavelet entropy measures. The entropic measures computed were based on topographic maps to investigate spatial visualization of information useful to further develop the BCI for affected patients. These maps help to understand which brain region shows the dominant results to distinguish the actual open and close of fist or feet with imagery opening and closing of both fist or feet movements. From these topographic maps, the dominant brain regions and their significance level using color map and significance level indication can be clearly observed.
Using MSE, the maximum electrodes exhibit significance at scales 3, 4, 6, 7 and 8. The distribution of significance was obtained from frontoparietal brain regions. The highest significance results were obtained at frontpolar electrodes and few in central and parietal probes. Using MSE, the sample entropy values of task 5 were greater than those of task 6 subjects, which indicate that complexity of task 5 subjects is higher than the complexity of task 6 subjects. The task 5 subjects indicated the actual open and close of both fists or feet while task 6 subject represent the imaginary opening and closing of both fist or feet. The maximum electrodes give significance results using wavelet threshold entropy at scales 8 and 10, while few electrodes give the significance results at other temporal scales. The significance at these electrodes include right hemisphere brain area i.e. frontal, central and few parietal electrodes, while other scales give the significance in few frontal probes. Similarly, the maximum significance results using sure wavelet entropy were obtained at scales 1, 4, 5, 6, 7, 8 and 10. The significance results were mostly found in central, frontal and right brain region. The wavelet norm entropy gives significance results at frontal electrodes and few central electrodes at most of the temporal scales. The front polar electrodes give the highest significance results followed by frontal electrodes. The log energy also shows significance at frontpolar, frontal and few electrodes in right brain hemisphere i.e. central and parietal brain regions.
Footnotes
Acknowledgments
We are thankful to Professor Aneta Stefanovska and her team at Lancaster University, UK for providing state of the art codes for topographic maps representation.
Conflict of interest
None to report.