
Abstract
BACKGROUND:
Unapparent saccades in video head impulse test (vHIT) are usually present in Meniere’s disease (MD) patients but tend to be ignored by the clinician. The result of vHIT is constantly questioned in MD patients due to a lack of uniform metrics. A more effective indicator is needed for indicating MD’s pathological progress.
OBJECTIVES:
To get a comprehensive understanding of the nature and usability of saccades in different MD stages.
METHODS:
118 patients diagnosed with unilateral MD were recruited in this study. Patient history, audiological examination, caloric test, vHIT were performed. We proposed ‘raw saccades’ to represent all showed wave peaks behind the head peak and named saccades by their appearance sequence: 1st saccade, 2nd saccade and 3rd saccade. An exploratory saccade analysis was executed to investigate the effectiveness of saccade attributes in identifying MD stages.
RESULTS:
MD patients have greater detectable 1st saccade than PR score as well as 2nd saccade. The time and velocity of the 1st saccade show high interaural variability (p = 0.028, p = 0.000 respectively). No statistical difference concerning the vHIT gain, PR score and 2nd saccade among stages could be recognized on both affected and contralateral sides. Multiple comparisons show the affected 1st saccade velocity and affected 1st saccade absolute velocity have stage-difference. At late stages (3&4), the affected 1st saccade is manifested as a speed increase, and this measure shows a relatively high correlation with MD stages compared to other vestibular indicators.
CONCLUSION:
The 1st saccade velocity on the affected side could indicate the MD disease process and severity.
Introduction
Meniere’s disease (MD) is an inner ear disorder characterized by repetitive vertigo, aural fullness, tinnitus, and fluctuating sensorineural hearing loss [1, 2]. Stage classification of MD patients is based on the audiogram associated with MD’s natural course [1]. Commonly, the diagnosis for MD depends on history taking, fluctuant hearing loss, and vestibular examination. The caloric test (also known as the bithermal test) is the primary choice to measure MD patients’ vestibular function. Low-frequency information about the lateral semicircular canal could be observed through the caloric results. Kharkheli compared the otolith function test and caloric test with the audiometrically defined MD stages [3]. In their study, caloric asymmetry increased with the MD stages, and this progression would advance from saccule to semicircular canals. Wang reported unilateral weakness of the caloric test and hearing loss degree to have a linear correlation [4].
The video head impulse test (vHIT) is a high-frequency test in vestibular evaluation. VOR is responsible for keeping the images stable on the central fovea during head movement by moving eyes in the opposite direction. In vHIT, VOR gain reduction and evident saccades represent vestibular hypofunction [5–7]. VOR gain is the ratio between eye movement and head movement. In normal conditions, the eye movement is equal and opposite to the head movement [8]. If the VOR does not function properly, the gain will decrease. A catch-up saccade will trigger to keep visual acuity. There are several discussions about the usability of the caloric test and vHIT in MD patients. McGarvie summarized that MD patients might have incongruity on the caloric test and vHIT [9]. According to Yacovino’s follow-up research, VOR gain and saccades on the vHIT test vary during MD attacks [10]. MD patients have some deficits in vertical semicircular canals even when caloric results are normal [11].
Saccades were always described as overt and covert according to their latency [12]. Blodow has reported that either isolated or combined overt and covert saccades could occur in 22 MD patients, with a total incidence of 55%[13]. Several studies tend to ignore saccades’ role in identifying the vestibular pathology [14, 15]. Recently, the PR (Perez and Rey) score could give time variation of saccade a quantitative evaluation [16]. In the PR score, the saccades clustering is set from 0 to 100, representing most gathered to most scattered. In our latest study, the PR score shows an increasing trend with the degree of hearing loss [17]. For saccades, the only indicator PR score is a time variable. Besides, the PR algorithm limits the saccade detection rate (detailed information is described in 2.3). As to velocity, it is commonly used as a criterion to discern the conspicuous saccade. For instance, 65°/s is the screening criteria for PR score. Unapparent saccades are usually accompanied by MD patients in the clinic but have not been discussed before. Therefore, an exploratory data analysis regarding saccades time and velocity is needed to find more effective indicators indicating the MD’s pathological progress.
A better understanding of audio-vestibular function change will assist in MD diagnosis and management. However, vHIT results related to MD are confusing due to a lack of uniform metrics. This study aimed to get a comprehensive understanding of saccades’ nature and usability in different MD stages. This study used hearing loss degree as our unique variable and compared vHIT gain, PR score, and raw saccade measures. An exploratory analysis involves conducting initial investigations on saccade time and velocity to discover more sensitive numerical attributes.
Materials and methods
Subjects
This study retrospectively analyzed 225 unilateral MD patients who visited the vertigo clinic at the Chinese PLA General Hospital from July 2019 to Nov 2020. Unilateral definite MD is defined based on the AAO-NHS criteria [1]: (1) two or more episodes of vertigo, lasting longer than 20 min for each attack; (2) hearing loss showed on audiometry; (3) tinnitus and/or aural fullness; (4) other diseases were excluded. The side of auditory symptoms is identified as the affected side.
Audiological evaluation for MD patients was performed by Madsen Audiometer (Cornera, GN Otometrics Inc., Denmark). Regarding to the four-tone average of the pure-tone thresholds at 0.5, 1, 2, and 3 kHz, the stage of MD was divided into stage 1(≤25 dB, N = 18), stage 2(26–40 dB, N = 23), stage 3(41-70 dB, N = 64) and stage 4(> 70dB, N = 13) [1].
All patients were asked to cease medication before the two days of vestibular examination. The ethical committee of the Chinese PLA General Hospital approved this study. Patients’ age, gender, lateral SCC vHIT, and bithermal test were recorded and analyzed. We excluded 24 patients with incomplete information, 38 patients with bad vHIT quality (slippage, eye blink, wrong calibration, and so on), 42 patients with hearing loss on the unaffected side (> 30dB), and 3 patients who have undergone an invasive procedure in any of the ears. Finally, 118 patients were enrolled. Detailed information was shown in Table 1.
Population Characteristics of Meniere’s Disease
Population Characteristics of Meniere’s Disease
†Data are presented as mean±SD, or the percentage of the total population (%).
A video-oculography system (VO425, Interacoustics, Denmark) was used to record spontaneous nystagmus and caloric test results. Patients with spontaneous nystagmus > 5°/s were not included in this study due to the possible influence on asymmetry calculation. None of those patients investigated in our research is on the MD attack period.
Bithermal caloric irrigation (warm air 50°, cold air 24°) was performed in all MD patients. Unilateral Weakness (UW) was calculated by Jongkee’s formula: UW = |(Right Warm + Right Cold) - (Left Warm + Left Cold)|/ (Right Warm + Left Warm + Right Cold + Left Cold). A UW > 25%was considered abnormal.
vHIT, PR score and raw saccades measures
vHIT test was performed with a video-oculography device (ICS Impulse, GN Otometrics Inc., Denmark) consisting of lightweight infrared goggles and exported in XML (eXtensible Markup Language) format for further analysis. Patients were instructed to fixate a target about 1m ahead. Approximately 10 horizontal head impulses within 15 to 20 degrees with unpredictable impulses were conducted on each patient to each side. The same experimenter delivered all recordings. All lateral vHIT gains were recorded automatically by the manufacture’s algorithms.
PR score was calculated by an open-source software HitCal v5.3 (https://github.com/bendermh/HITCal). The PR score algorithms in HitCal are: 1) Only the saccade velocity above 65°/s can be identified. 2) saccades in each impulse were marked as 1st, 2nd, 3rd saccades by their arriving time (all time measures were present as samples, not milliseconds. 1st saccade time range: 45–95; 2nd saccade time range: 96–135; 3rd saccade time range: 135–175). 3) Coefficient of variation (Cov) = (standard deviation / mean) = (
For an exploratory saccade analysis, no boundary should set to micro-saccade. Even micro-saccades might represent minor damage, especially on MD patients who have normal vHIT gain but unrecognized saccades. We use the concept of ‘raw saccades’ to represent all showed wave peaks behind the head peak. HitCal, as a helpful tool, allows automatic and manual waveform recognition, peak value determination and array variable storage. We renamed the saccades by their appearance sequence to differentiate the PR algorithm: 1st saccade, 2nd saccade and 3rd saccade. The illustration of this method is shown in Fig. 1. When describing the statistical characteristics, the saccade occurrence rate should be more than half for each subgroup.

Illustration of the raw saccades. A. the situation of impulse with two saccades, the saccades were marked as 1st and 2nd saccade by sequence. B. the situation of impulse with one saccade, the saccades were marked as 1st saccade no matter how late it appears.
Asymmetry was calculated by (Affected - Unaffected)/(Affected + Unaffected). Considering vHIT gain and PR score are non-dimensional parameters, Cov of saccade times, Cov of saccade velocity, and absolute saccade velocity (ratio of saccade velocity of head peak velocity) were also included in this study. When the measures meet the normal distribution, a parametric test (Unpaired Student’s t-test or one-way variance (ANOVA)) was used. Otherwise, a nonparametric test (Mann-Whitney test or Kruskal-Wallis test) was used. Bonferroni post-hoc correction was employed for multiple comparisons to detect the inter-stage discrepancies (adjusted p-value < 0.05 was identified as a statistical difference). All data analyses were performed by IBM SPSS 20.0 (SPSS Inc., Chicago, IL, USA). P < 0.05 is significantly different in this study. The Cochran-Armitage trend test was used to assess changes in incidence-based abnormal UW rate, PR score, 1st and 2nd saccade over MD stages. Trend analysis was performed by R 4.1.0 (R Foundation, Vienna, Austria).
Swarm plot and scatter plot (Python 3.7 program) were employed to illustrate the individual parameter. A swarm plot is a categorical scatterplot with non-overlapping points. In addition, a Pearson correlation heatmap between vestibular indicators was generated by Python to visualize the internal relationship.
Results
General characters of raw saccade
Figure 2 demonstrates the data completeness of PR score, 1st, 2nd saccade on both sides. A slightly affected side to unaffected side preponderance has been observed in PR score, 1st and 2nd saccade. Order these parameters from most prominent to lowest: affected 1st saccade(95), unaffected 1st saccade(88), affected PR score(65), unaffected PR score(51), affected 2nd saccade(40), unaffected 2nd saccade(27). The affected saccade incidence is somewhat higher than the contralateral one. More MD patients have detectable 1st saccade than PR score as well as 2nd saccade.
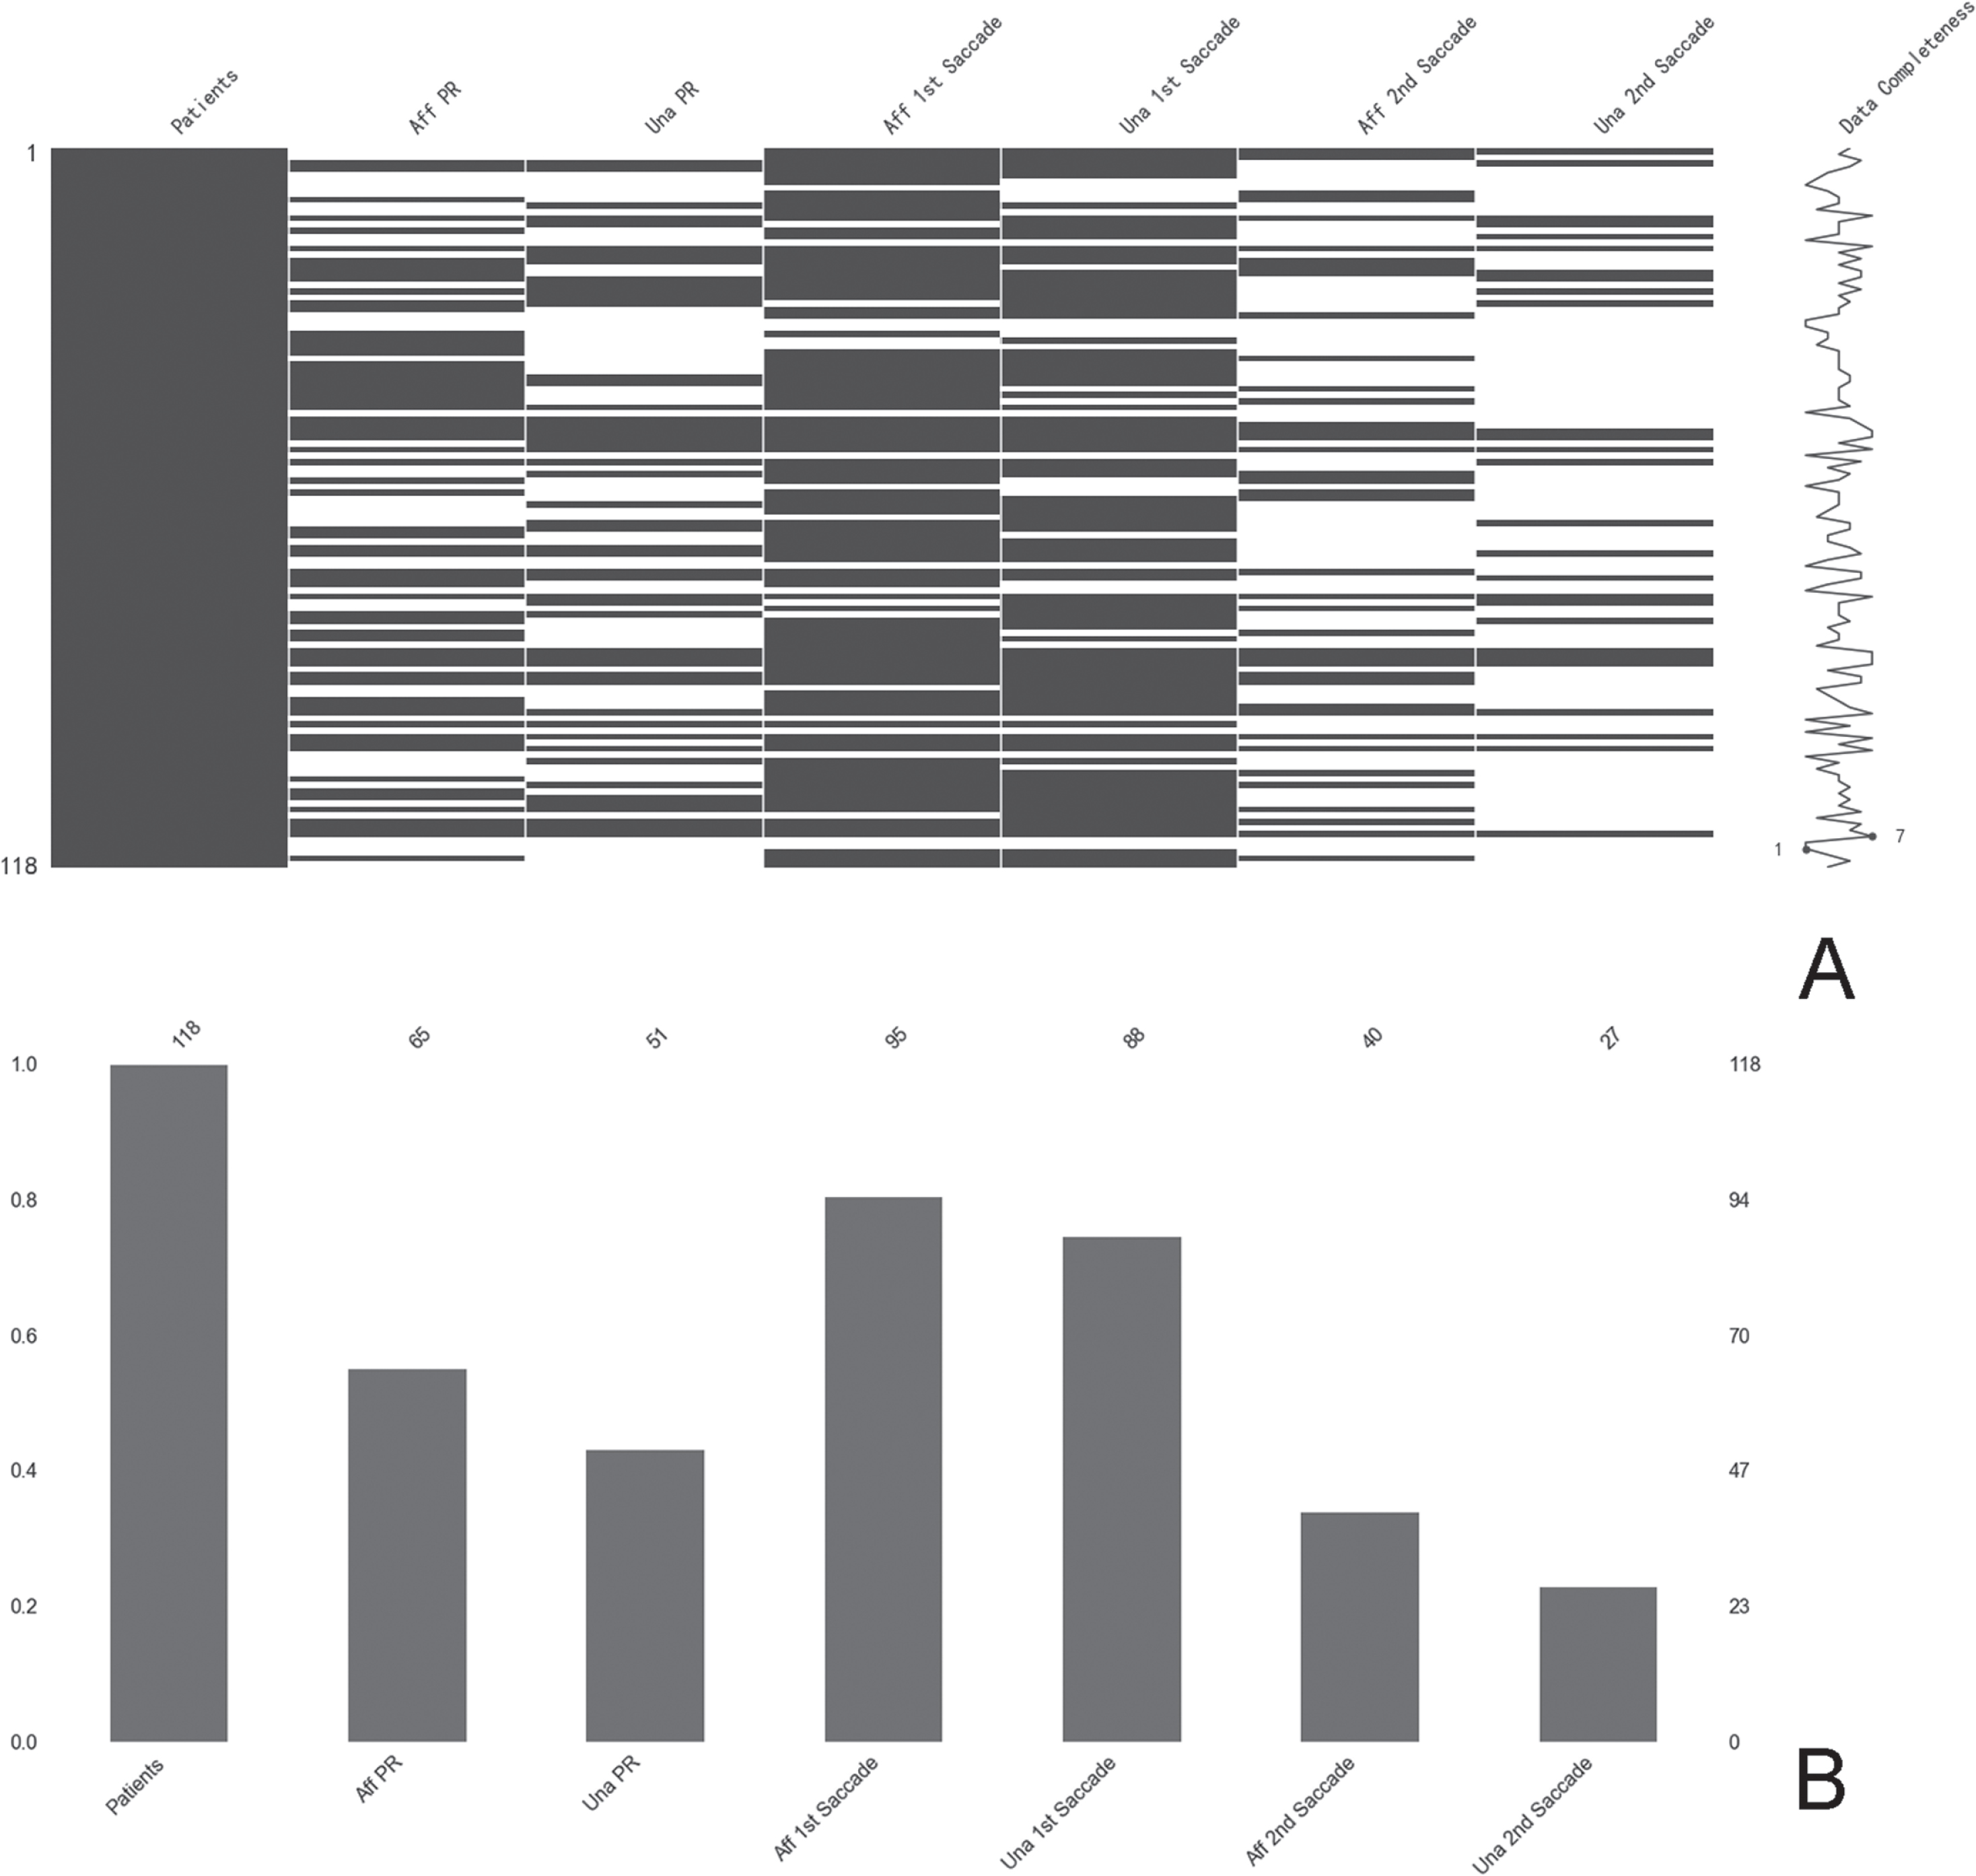
The data completeness of PR score and raw saccades. 1st saccade on both sides has more detectable than the PR score and 2nd saccade. A: Data completeness of Aff PR, Una PR, Aff 1st Saccade, Una 1st Saccade, Aff 2nd Saccade, and Una 2nd Saccade on all 118 patients. B: The count of Patients, Aff PR, Una PR, Aff 1st Saccade, Una 1st Saccade, Aff 2nd Saccade, and Una 2nd Saccade. Abbreviations of Aff and Una represent the situation on the affected side and unaffected side individually.
1st and 2nd saccades were detected in stage 1–4 MD patients. Figure 3 shows that the distribution range of affected and unaffected sides resemble 1st saccade time and velocity. The scope and measures of all saccade velocities have an increasing trend with MD stages, and in general, 1st saccade velocity is more significant than 2nd saccade. No time change with stages could be observed on both 1st and 2nd saccades. The 1st saccade’s arrival time has a broader range, from 48–200 (shown in Fig. 3A) and overlapping with the 2nd saccade time (100–180).
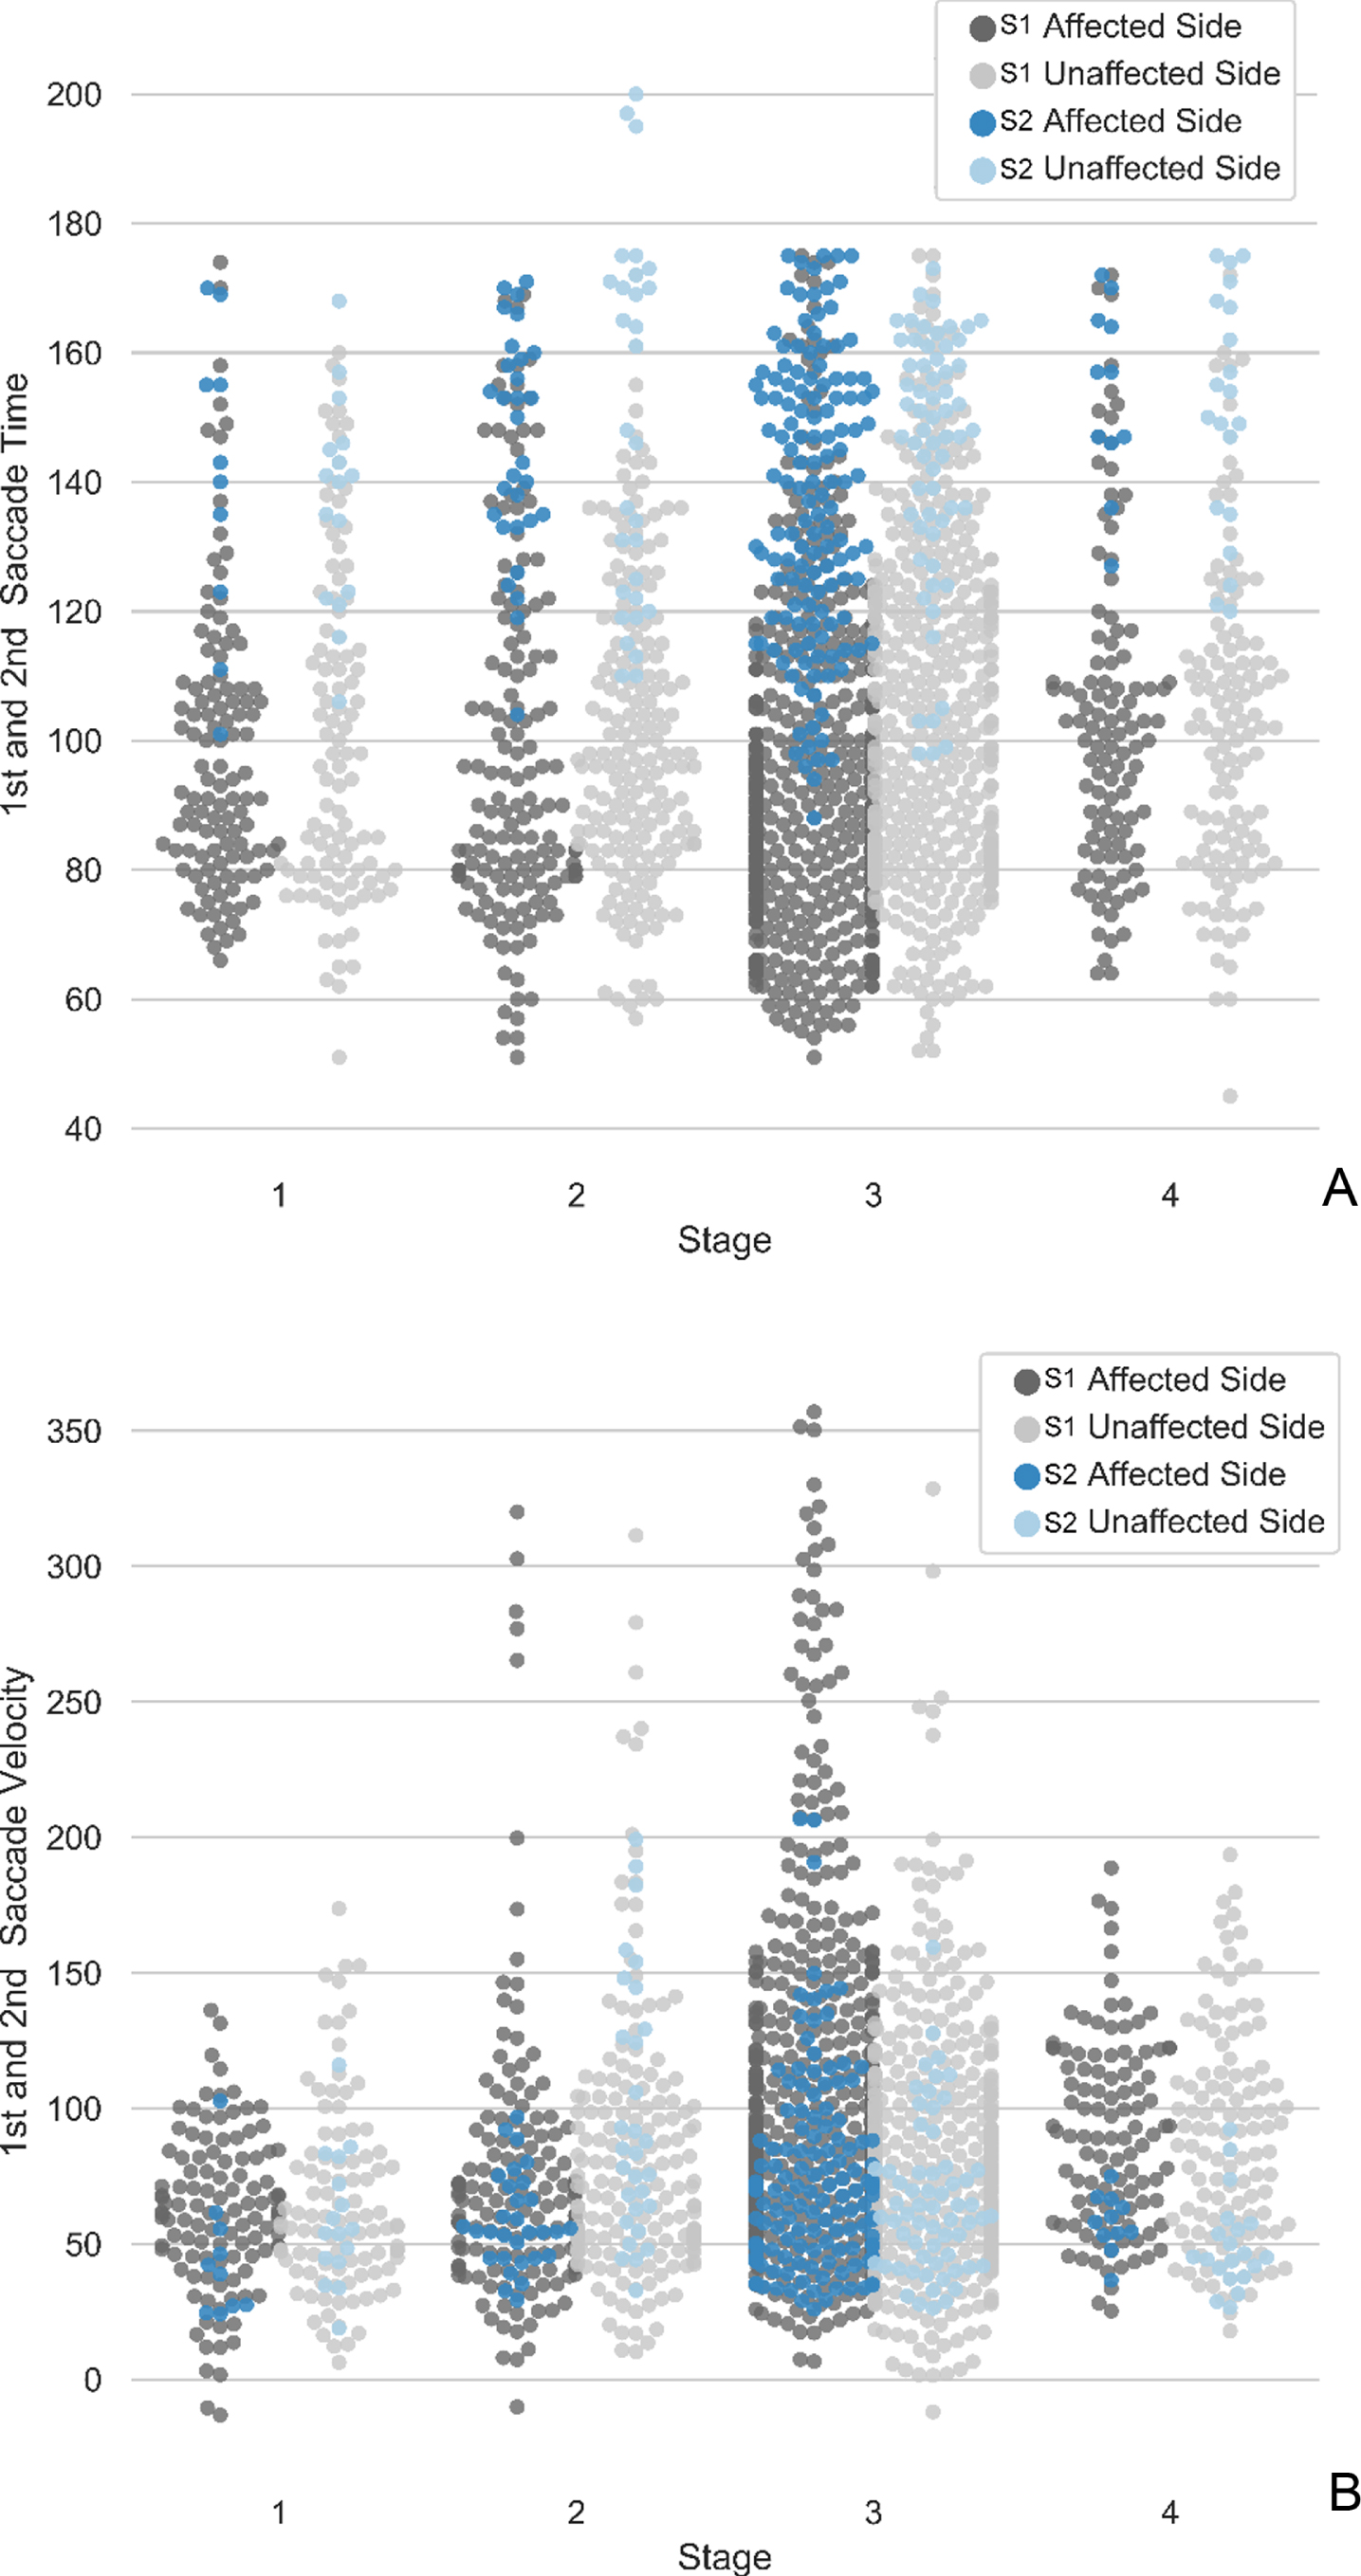
The swarm plots display the time and velocity distribution of 1st and 2nd saccades on different MD stages (All patients’ vHIT impulses). A. Time distribution of 1st and 2nd saccades. B. Velocity distribution of 1st and 2nd saccades. Abbreviation of S1 and S2 represent 1st and 2nd saccade.
Table 2 provides the vHIT parameters for intergroup comparisons. There is no statistical difference concerning vHIT gain and PR score on both sides. The time and velocity of the 1st saccade show high interaural variability (p = 0.028, p = 0.000 respectively). The 1st saccade on the affected side has an earlier time but a higher amplitude than the contralateral ear. Cov comparison shows no statistical difference between ears except on the absolute velocity (p = 0.000), suggesting 1st saccade absolute velocity tends to be scattered on the unaffected side.
The comparison of vHIT, PR score, and saccade parameters between the affected and unaffected side
The comparison of vHIT, PR score, and saccade parameters between the affected and unaffected side
†The abbreviation of Cov represents the coefficient of variation. The abbreviation of Abs means absolute velocity, a non-dimensional parameter. ‡All values were presented as the mean value±standard deviation or median value. Time values were samples, not milliseconds. §*p < 0.05, **p < 0.01, ***p < 0.000.
Comparison of the vHIT parameters inter-stages is given in Table 3 and Table 4, in which Table 3 compares the measures on the affected side while Table 4 compares the contralateral side. No statistical difference concerning the vHIT gain, PR score and 2nd saccade among stages could be observed on both affected and contralateral sides (Table 3 & Table 4). Multiple comparisons show that 1st saccade velocity and 1st saccade absolute velocity have group-difference. There was statistical evidence (p < 0.05, adjusted using the Bonferroni correction, shown in Table 3) of a difference on 1st saccade velocity (Stage 1&3), as well as 1st saccade absolute velocity (Stage 1&3, Stage 1&4, Stage 2&3). The median 1st saccade velocity for the MD stage 1 was 64.68°/s compared to 82.23°/s in the MD stage 3. The median 1st saccade absolute velocity for the MD stage 1 was 0.35 compared to 0.50 in the MD stage 3 compared to 0.56 in MD stage 4. The median 1st saccade absolute velocity for the MD stage 2 was 0.39 compared to 0.56 in the MD stage 3. There is no evidence of a difference between the other pairs. The following comparison between the early (Stage 1 and 2) and late (Stage 3and 4) stages shows similar results; that is, median 1st saccade velocity and 1st saccade velocity are lower in the early stage compared to the late-stage(p = 0.000). Cochran–Armitage trend analysis shows no overall incidence tendency (p > 0.05), similar to abnormal UW rate.
The comparison of vHIT gain, PR score, and saccade parameters in different stages (affected side)
The comparison of vHIT gain, PR score, and saccade parameters in different stages (affected side)
†The abbreviation of Cov represents the coefficient of variation. The abbreviation of Abs represents absolute velocity, a non-dimensional parameter. ‡All values were presented as the mean value±standard deviation, median value, or the percentage of the total population (%). Time values were samples, not milliseconds. §*p < 0.05, **p < 0.01, ***p < 0.000.
The comparison of vHIT gain, PR score, and saccade parameters in different stages (unaffected side)
†The abbreviation of Cov represents the coefficient of variation. The abbreviation of Abs represents absolute velocity, a non-dimensional parameter. ‡All values were presented as the mean value±standard deviation, median value, or the percentage of the total population (%). Time values were samples, not milliseconds. §*p < 0.05, **p < 0.01, ***p < 0.000.
The variation appeared selectively on the affected side, and no statistical difference was observed on the unaffected side (Table 4). On no statistical difference side, the overall PR score incidence on the contralateral side increases from 28%in Stage 1 to 69%in Stage 4 (Cochran–Armitage test for trend p = 0.042).
Heatmap on Fig. 4 listed all indicators that have an absolute correlation higher than 0.20. The top three parameters that correlate with the MD stages are age (0.3), absolute 1st saccade velocity on the affected side (0.29), and 1st saccade velocity on the affected side (0.24). The parameter in the same examination has a stronger correlation compared to others. For instance, all four bithermal results positively correlated with each other (> 0.45). On the other hand, no evident correlation between all asymmetry vestibular indicators could be observed except asymmetry vHIT gain and asymmetry PR score (–0.30). Since the 2nd saccade is not relative to the stage variation (Table 3 and Table 4), only the 1st saccade measures were involved for the correlation analysis.
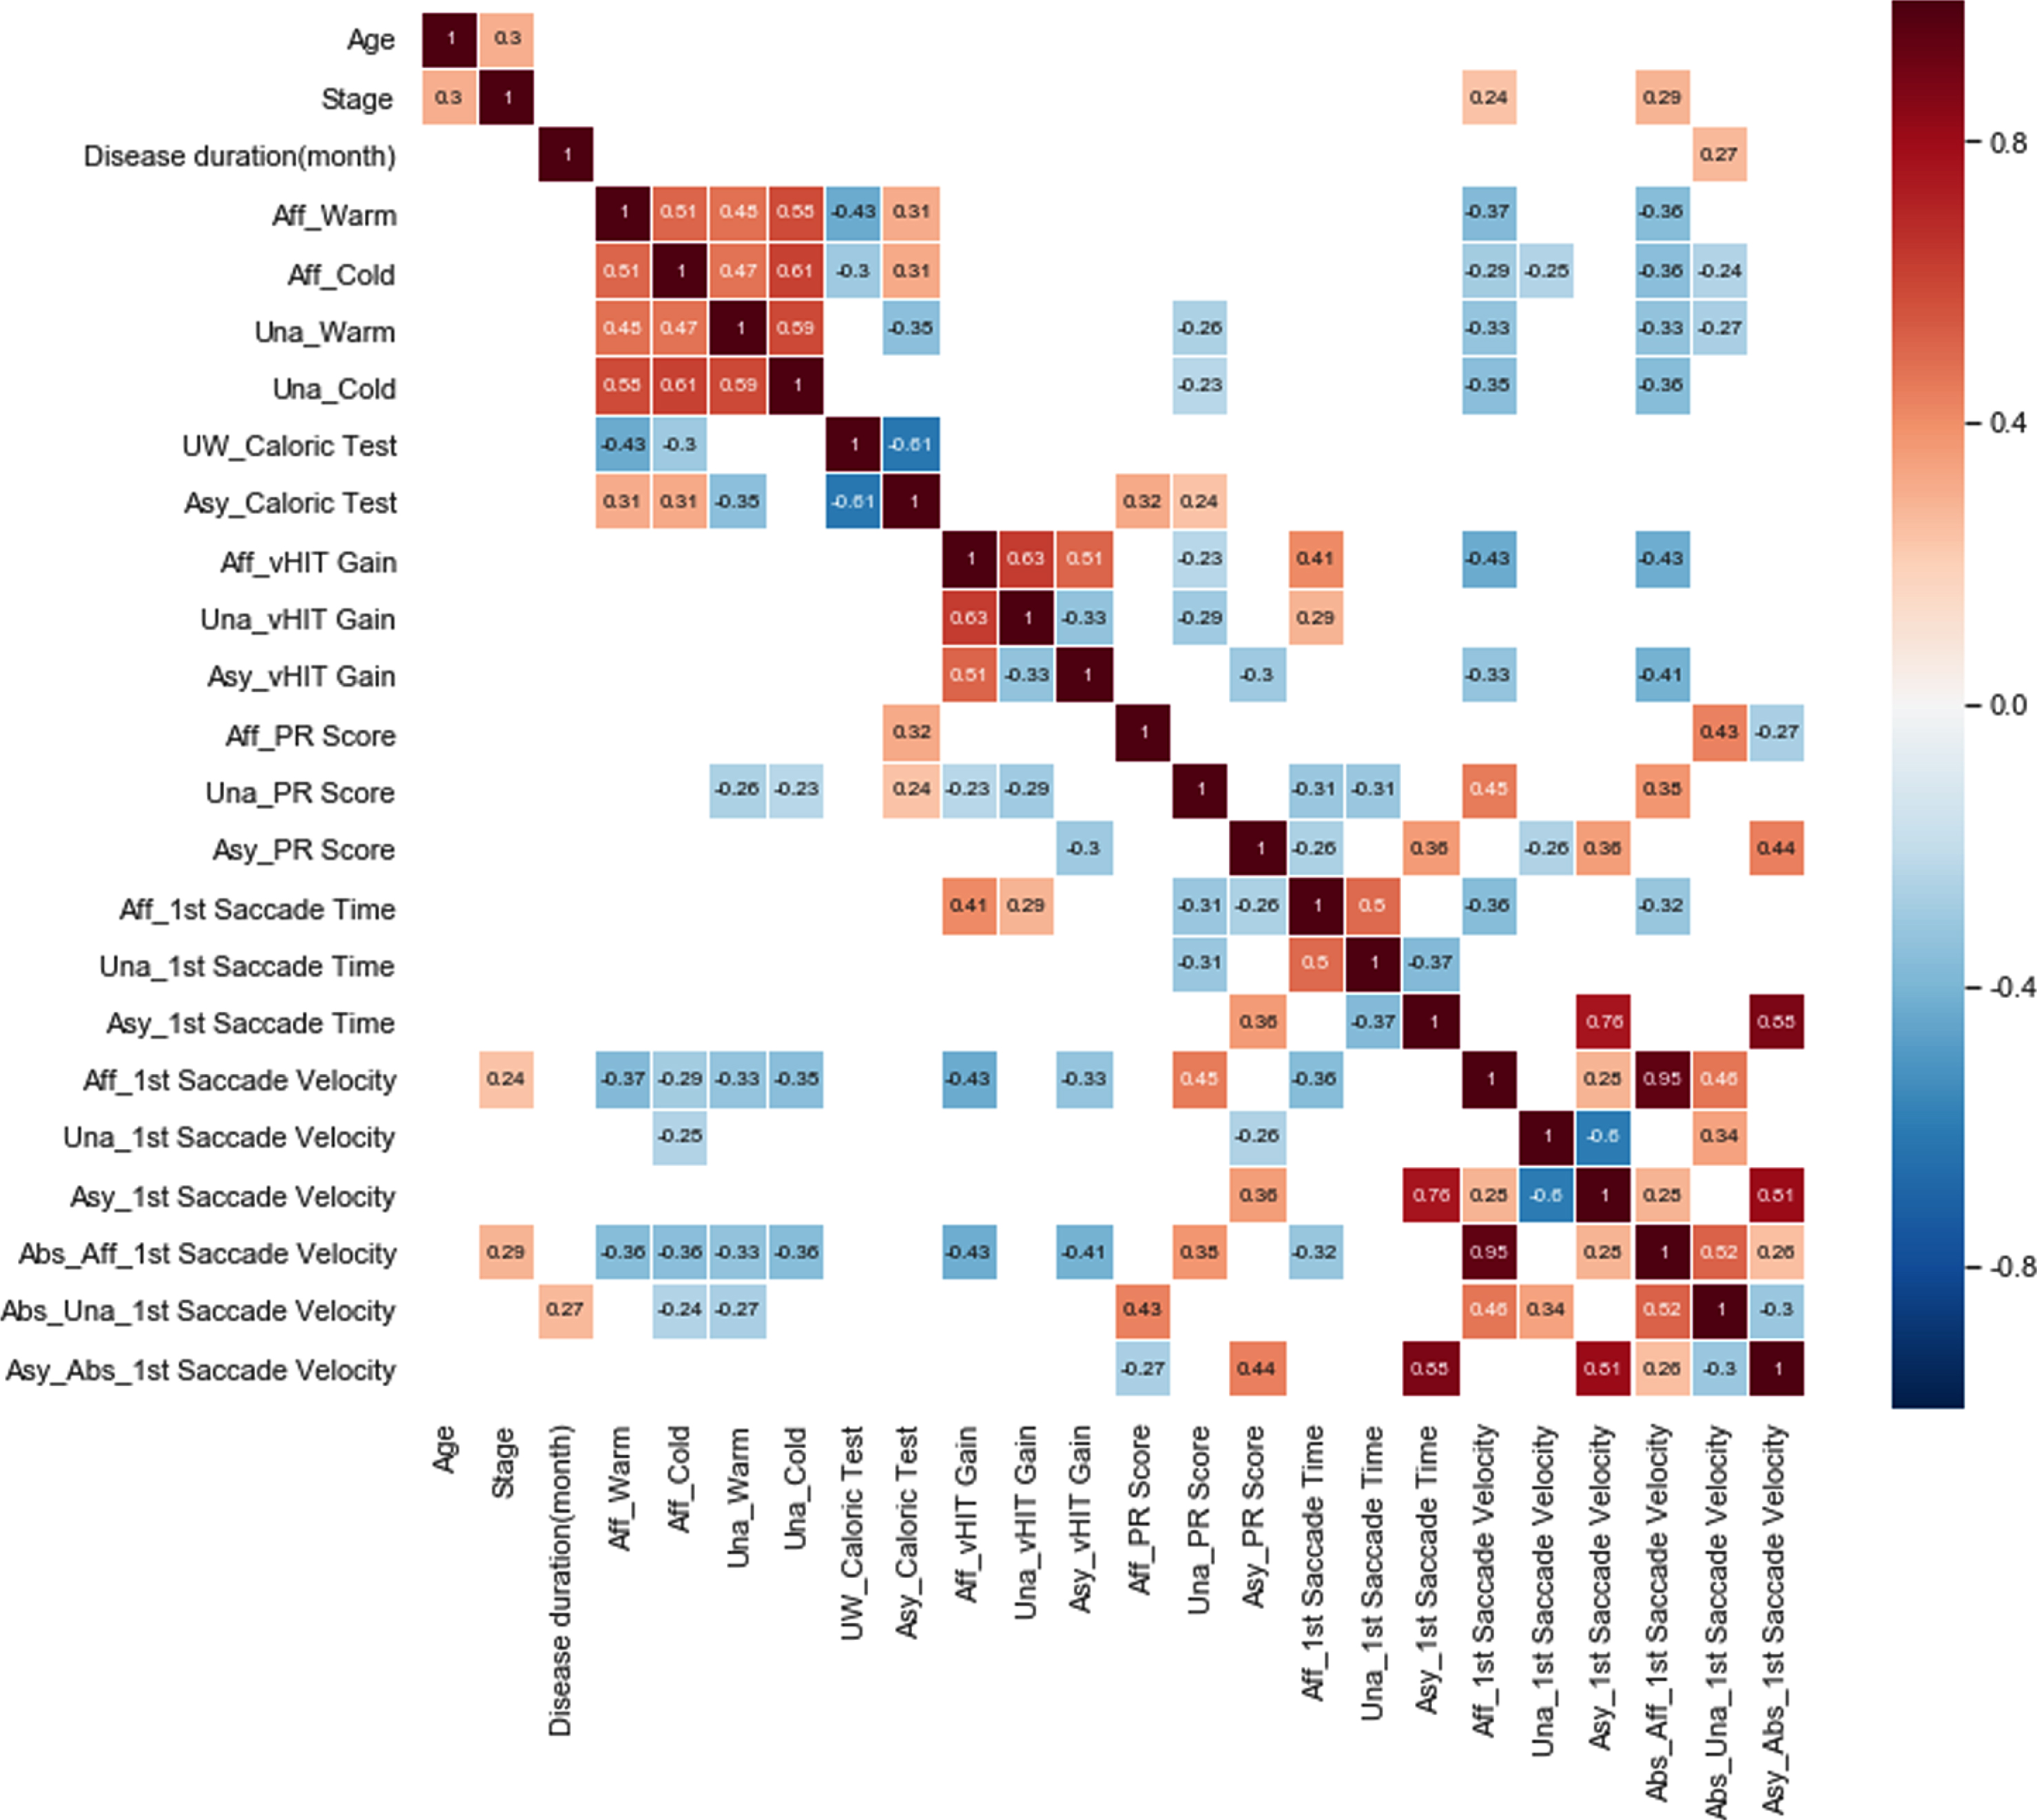
Correlation heatmap of all vestibular parameters and general attributes of MD patients. Correlation coefficients between every two components were present inside the block, and only the correlation greater or equal to 0.3 was shown. For instance, in row 1 and column 2, stage has a 0.30 correlation with age. (The prefix of Aff and Una represent affected side and unaffected individually. The prefix of Asy represents asymmetry on both sides. The prefix of Abs represents the absolute 1st saccade velocity.)
This study focused on numerical attributes of raw saccades directed at explaining inconspicuous saccades in unilateral MD patients. An exploratory analysis was also provided on the distribution, mean value and correlation of saccades from partition to overall. This study proved the effectiveness of the raw saccades measures on identifying MD stages, indicating that the velocity of 1st saccade on the affected side could hint at the disease process and severity.
Hearing level is the diagnostic basis and a significant consideration in choosing a treatment for MD patients. The relationship between hearing loss degree and vestibular results - UW, vHIT gain, PR score, and raw saccade measures - was thoroughly discussed in this study. The symptomatic ear has a higher 1st saccade than the contralateral side. Only the velocity attributes of the 1st saccade change significantly with MD stages (p < 0.05). MD stage has a high correlation with 1st saccade velocity on the symptomatic ear, implying that this vestibular indicator could be a valuable tool for Meniere’s disease assessment.
PR score, as a new quantization parameter, is a good indicator for saccade distribution. In our former study, the PR score could hint at the pathological feature and rehabilitation status for vestibular disorders [17]. Although the PR score visually coincides with the degree of dispersion, it is not applied in every case. In this study, the PR score is ineffective at evaluating MD patients, even though some small saccade could be observed. The reason for this insensitivity may be attributed to the division method applied to all saccades. Saccades on the PR algorithm are separated by time range, not by their sequencing. The likely outcome is the decrease in detection rate and the reduction in the algorithm effectiveness. Besides, saccades with velocities below 65°/s were neglected by the algorithm. Inconspicuous saccades were always regarded as noise, error, or age-related [18–20]. No agreement was reached on the boundary of a positive saccade velocity. What are the biological reasons that underlie such small saccades of MD patients?
Lee et al. have reported the VOR gains are normalized or increased in MD stage 1 or 2 but reduced or increased in MD stage 3 [21]. No augmented gain response exists in this study. Van Esch [5] shows no vHIT difference (combined with abnormal vHIT gain and saccades) between MD stages, similar to our findings. The divergence between the two results might be the difference in the vHIT criteria. Our study reveals that VOR gain and gain asymmetry could not show the difference among stages. In MD patients, VOR gain reduction can hardly be noted in later stages due to the high-frequency sensitivity of labyrinth preserved by type I hair cells [22]. The linear transfer process could explain it through head rotation, force stimuli on the ampulla, and eye movement. This transfer process will not change with diameter expansion [23, 24]. In the actual situation, the reduction of VOR gain is not strictly linear to vestibular function. For instance, VOR gain equals 0.2 does not mean 20%residual function. Alike, VOR gain higher than 0.8 does not mean there is no vestibular loss. As the previous study described [22], the gain asymmetry shows no correlation with UW in our research but conflicts with linear correlation reported by Wang et al. [4]
It is not hard to discover the vHIT tests combine two reflexive tests - VOR and saccade. In vHIT, the VOR is an instant response to the passive head movement, and the saccade is the volitional behavior to switch gaze direction. The two reflexes are responsible for holding the image on the human fovea. Saccade and VOR reduction in vHIT are consistent but isolated from each other. Before the PR score, there are no simple and effective metrizable saccade measures. Therefore, former studies always neglect saccades’ independent role in identifying MD [13, 14].
The nature of saccades is the refinement of perception [25]. When VOR did not function normally, the image will slip off the fovea, and blurred vision will induce. That is why patients consistently report blurring vision in daily life, especially during head movements. MD patients get used to integrating VOR with saccades to maintain the image stable on the fovea. The saccade’s amplitude determines the saccade latency, and the former is linear to the position of eye movement at the end of head rotation [26]. The saccadic reflection would be evident and discoverable even if gains stay higher than 0.8. Thus, saccades display visual acuity and also reflect the patients’ sensations in the real world. Besides retinal slip, position error (an intuitive mechanism) also plays a role in triggering catch-up saccades [27], which might explain the increasing trend of saccade incidence on the unaffected side.
Based on our exploratory data analysis, more complicated situations should be considered. Our further study will focus on long-time follow-up research to confirm raw saccade parameter change on not only MD stages but the attack and quiescent period. Small saccades could happen to healthy people, but our study found the statistical distinction of saccade velocity between the affected and contralateral ear. Our exploratory analysis demonstrated that the saccade on the unaffected side has a more randomized, late-arrival, and small-amplitude character. Still, validation on the healthy patient should be performed on further study.
Conclusion
This research validated the effectiveness of 1st saccade velocity on identifying the affected side and MD stages. Velocity on the 1st saccade not only has a higher occurrence at later stages but has a relatively high correlation with MD stages compared to other vestibular indicators. In addition, this study provided an analytical method to understand the nature and usability of saccades in different MD stages.
Footnotes
Acknowledgments
This work was supported by grants from the Key International (Regional) Joint Research Program of National Natural Science Foundation of China (NSFC#81820108009), National Key research and development project of China (2020YFC20052003), Ministry of Science and Technology “Active health and aging technology response” key project: Early detection and Intervention of auditory system dysfunction in the elderly(2020YFC2005200); The National Clinical Research Center for Geriatric Diseases(NCRCG-PLAGH-2019007).