
Abstract
OBJECTIVE:
Main objectives for this study were to develop a quantification method to obtain a Perez-Rey (PR) score adapted to the VVOR test and to evaluate the correlation of the PR score obtained with quantified VVOR with the PR score of the vHIT test.
METHODS:
A new PR score calculation method for quantified VVOR test was developed using the MATLAB computational software based on saccadic response time latency variability between each head oscillation cycle of the VVOR test. Retrospective correlation between PR scores in VVOR and vHIT tests, performed in the same vHIT testing session for patients with vestibular neuritis and vestibular neurectomy, was performed to correlate new PR (VVOR) score with the classic PR (vHIT) score.
RESULTS:
Thirty patients were included: 11 post-neurectomy and 19 subacute vestibular neuritis. Pearson’s correlation coefficient (R2) for the overall sample was 0.92 (p < 0.001) and 95% confidence interval was 0.85 –0.96. In the linear mixed-effects statistical model developed, only PRVHIT and PRVVOR scores showed statistical association in Wald X2 test (p = 0.008).
CONCLUSION:
The new developed PR score for synchronization measurement of saccadic responses in VVOR testing is a valid method that outputs synchronization values and highly correlates with PR score in vHIT test.
Introduction
The compensatory saccadic response (CSR) that occurs after a head thrust or impulse is a sign that at bedside easily identifies and locates the impaired vestibular function and deficient vestibulo-ocular reflex (VOR) [7]. It is radically different from the ocular movement commanded by VOR in the head impulse test (HIT). The normal VOR “slow phase” is a short time latency (8ms) ocular movement that mimics the head movement magnitude because its neural pathway is a continuous discharging neural network of three neurons integrated in pontine vestibular nuclei [8]. The abnormal CSR has longer time responses (80–100 ms) and magnitude than the head movement because its pathway, mainly located in the paramedian pontine reticular formation, is part of a more complex neural network triggered by an adaptative, volitive or preprogramed central mechanism which acts a response to retinal slip [4, 13].
The recording of the head and eye movement during the HIT, both with the scleral search coil or adapted video, made possible to better characterize the eye response in the normal and vestibular deficient subject; the former system is used more clinically and now the test is also called the video head-impulse test (vHIT) [24]. In terms of timing of the response to the head movement CSR are classified as overt and covert [13]. Attending to vHIT plots of the response in patients with unilateral vestibulopathy, Batuecas et al. [3] described two new patterns: it was called a synchronic CSR pattern when most of the saccadic responses appear at the nearly same latency in the different head impulses performed; and asynchronic CSR pattern when the saccadic responses appeared at a different time lapse in the successive head impulses. Interestingly, the former patients had a significant lower dizziness handicap inventory (DHI) score than the latter ones.
After this clinical observation, the same research group developed a quantification method for these saccadic aggrupation visual patterns defining then the Perez-Rey (PR) score [21] as shown in Fig. 1. This dimensionless number (0–100) has shown to be interesting for the objective evaluation of compensation [1, 23], to follow the dynamic process [3, 17] and to guide vestibular rehabilitation [16].
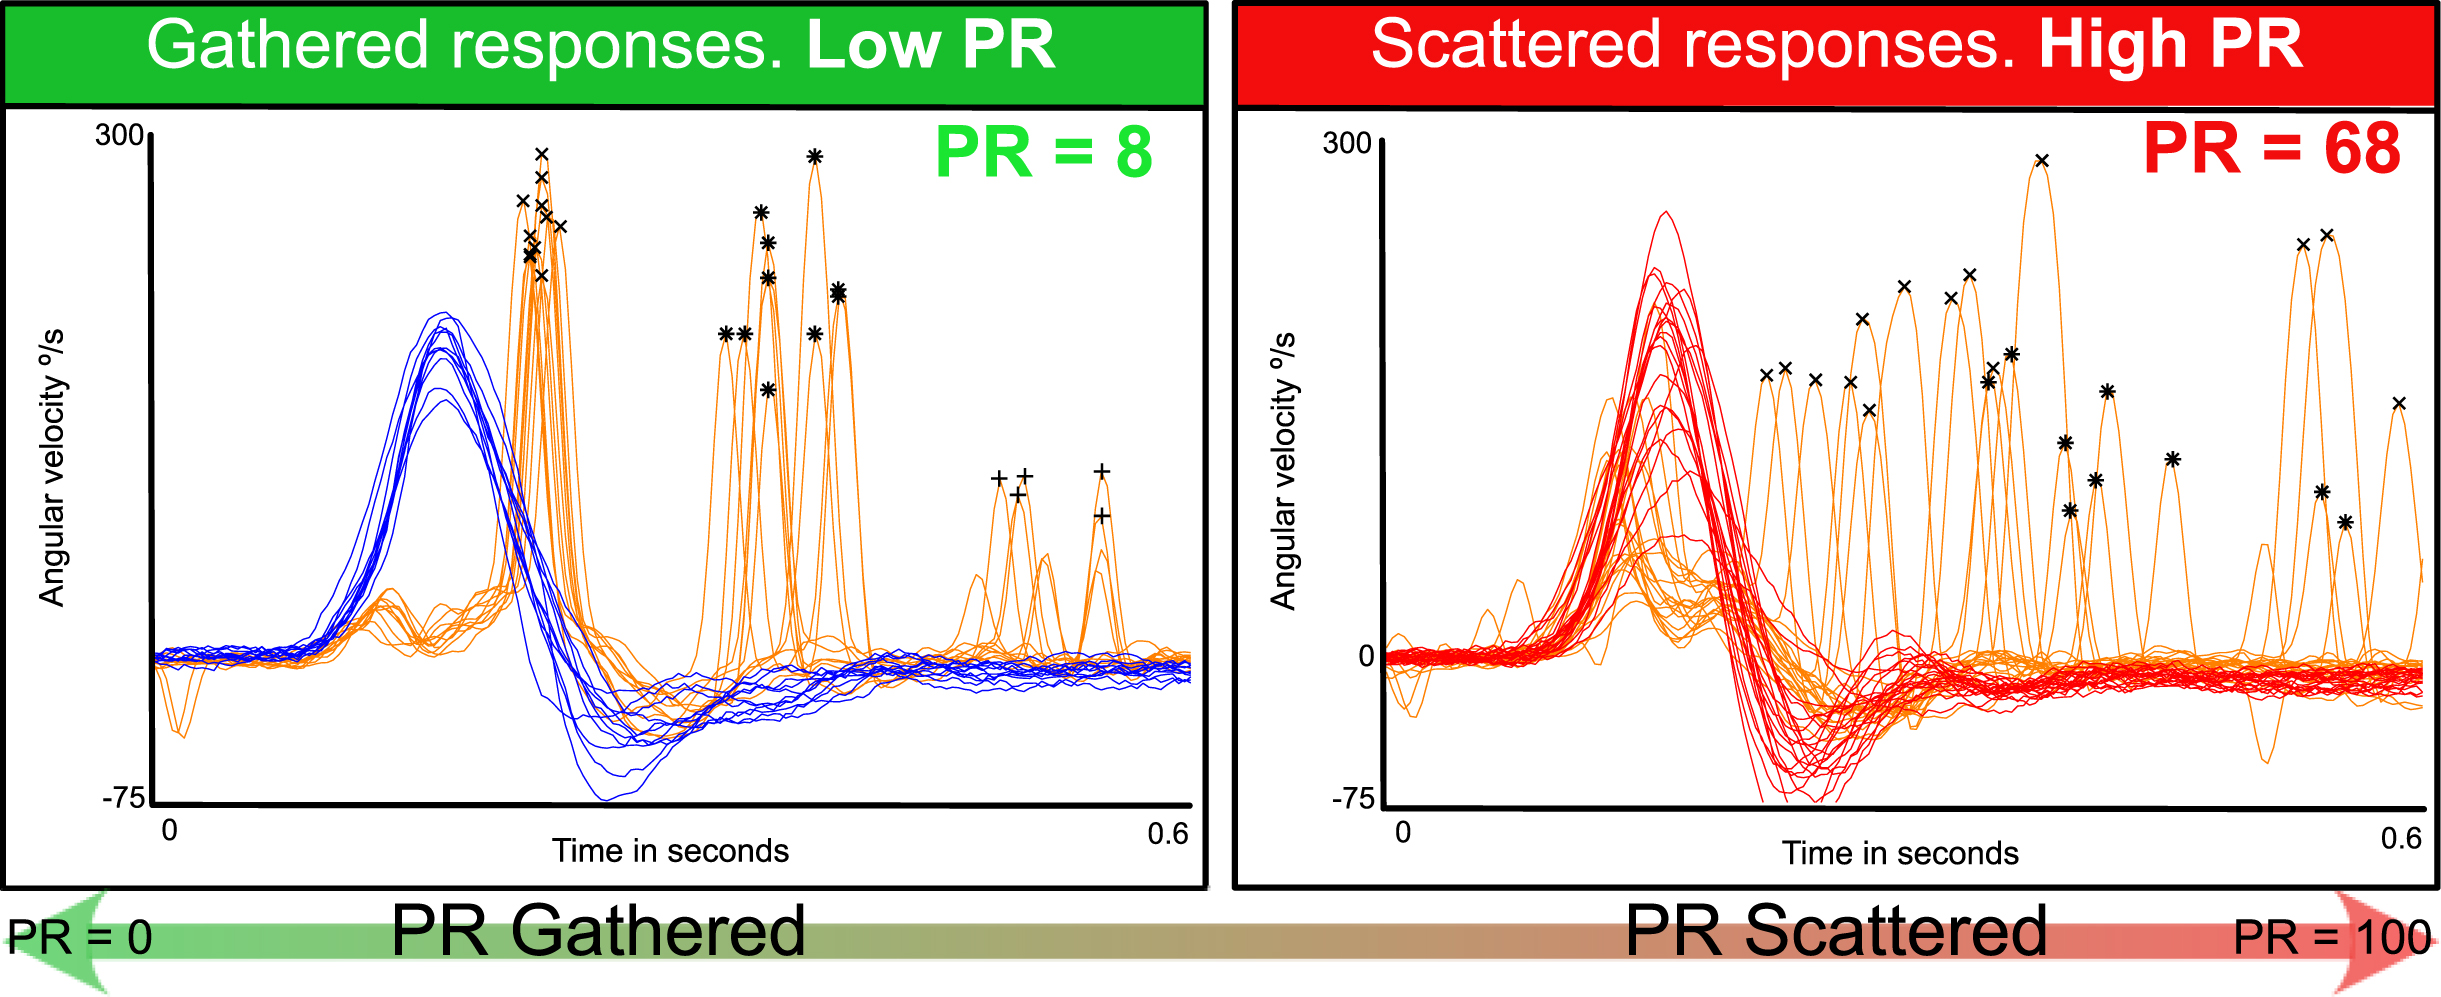
PR score for classic vHIT test. On the left side with a low PR score of 8, a left side vestibular neurectomy patient vHIT saccadic responses analysis is plotted. First saccadic responses (x marked saccades) appear at the same time at the end of all the performed head impulses. On the right side, a different right side vestibular neurectomy patient with high PR score of 68. First saccadic responses (x marked saccades) appear at any time during and after the head impulse. As is plotted at the bottom of the figure, PR score goes from 0, maximum gathered saccades to 100 minimum gathered scores (maximum scattered). Orange lines are eye movement plots, red and blue are head right and left respectively plots, cross is marking first appearance saccades, asterisk is marking second appearance saccades and straight cross is marking third appearance saccades.
Since its introduction, the vHIT device has also helped to quantify other vestibular and visual bedside tests [24], in particular visually-enhanced VOR test (VVOR) [20, 22]. This is a clinical test that quantifies VOR gain values at different frequencies of stimulation [20]. Interestingly at higher frequencies (> 1Hz), due to the visual pursuit and optokinetic reflex influence, VOR gain quantification decreases in this test and, a high correlation with vHIT gain values has been shown [22].
Aimed by this correlation between VOR gain values obtained with quantified VVOR and HIT tests the main objectives of this study were 1) to develop a quantification method to obtain a PR score adapted to the VVOR test and 2) to evaluate the correlation of the PR score obtained with quantified VVOR with the PR score of the vHIT test.
Development of PR Score adapted for quantified VVOR test
PR score for VVOR (PRVVOR) test algorithm was implemented in previously published open-source code for VVOR quantification method [20]. The new PR score algorithm was written using MATLAB (MATLAB Release 2021a, The MathWorks, Inc., Natick, Massachusetts, United States) computational language.
VVOR recorded data was imported to MATLAB environment using published VVOR quantification method [20]. The imported VVOR data was pre-processed before PR score computation. Head impulses of vHIT are automatically recognized and split from the raw record by manufacturer’s software, but for the vHIT device used in this research, ICS Impulse® ver. 4.0 (Otometrics A/S, Taastrup, Denmark), VVOR data was stored in raw format and there is not separation between head oscillations. The first step in the PR algorithm for VVOR records was to split the RAW VVOR data into individual head oscillations one plot for each side oscillation, for this purpose we used a logical MATLAB function to detect sign changes in head velocity data, each sign change was set as a new oscillation.
This PRVVOR calculation relies in proper methodology. We have followed the indications by Soriano-Reixach et al. [23]. The minimum requirements of VVOR testing to reproduce our work are the following: Head oscillation frequency above 1 Hz. At least a 4–5 seconds of sustained uniform head oscillation after the first 2 initial and before the last 2 seconds of testing. A value of 8 full (left and right-side movements) head oscillations should be performed. When less than four full head oscillations, the PR score will not be computed.
After this pre-process, each head oscillation was processed separately; however, if head velocity was too low (< 15°/s) or too short (under four samples of length) the oscillation was rejected to avoid noise fluctuation computation. The next step was to detect CSR on eye data (Fig. 2). For this, MATLAB findpeaks function was used: saccade velocity > 140°/s, prominence over the eye oscillation data > 100°/s, maximal peak width of 20 samples. Then, the detected saccades were ordered according to peak velocity and the highest peak was selected as saccadic response. Time latency was computed for each segment using the time of appearance of peak velocity for detected CSR and the oscillation start point, determined by previous sign change in head velocity (Fig. 2).
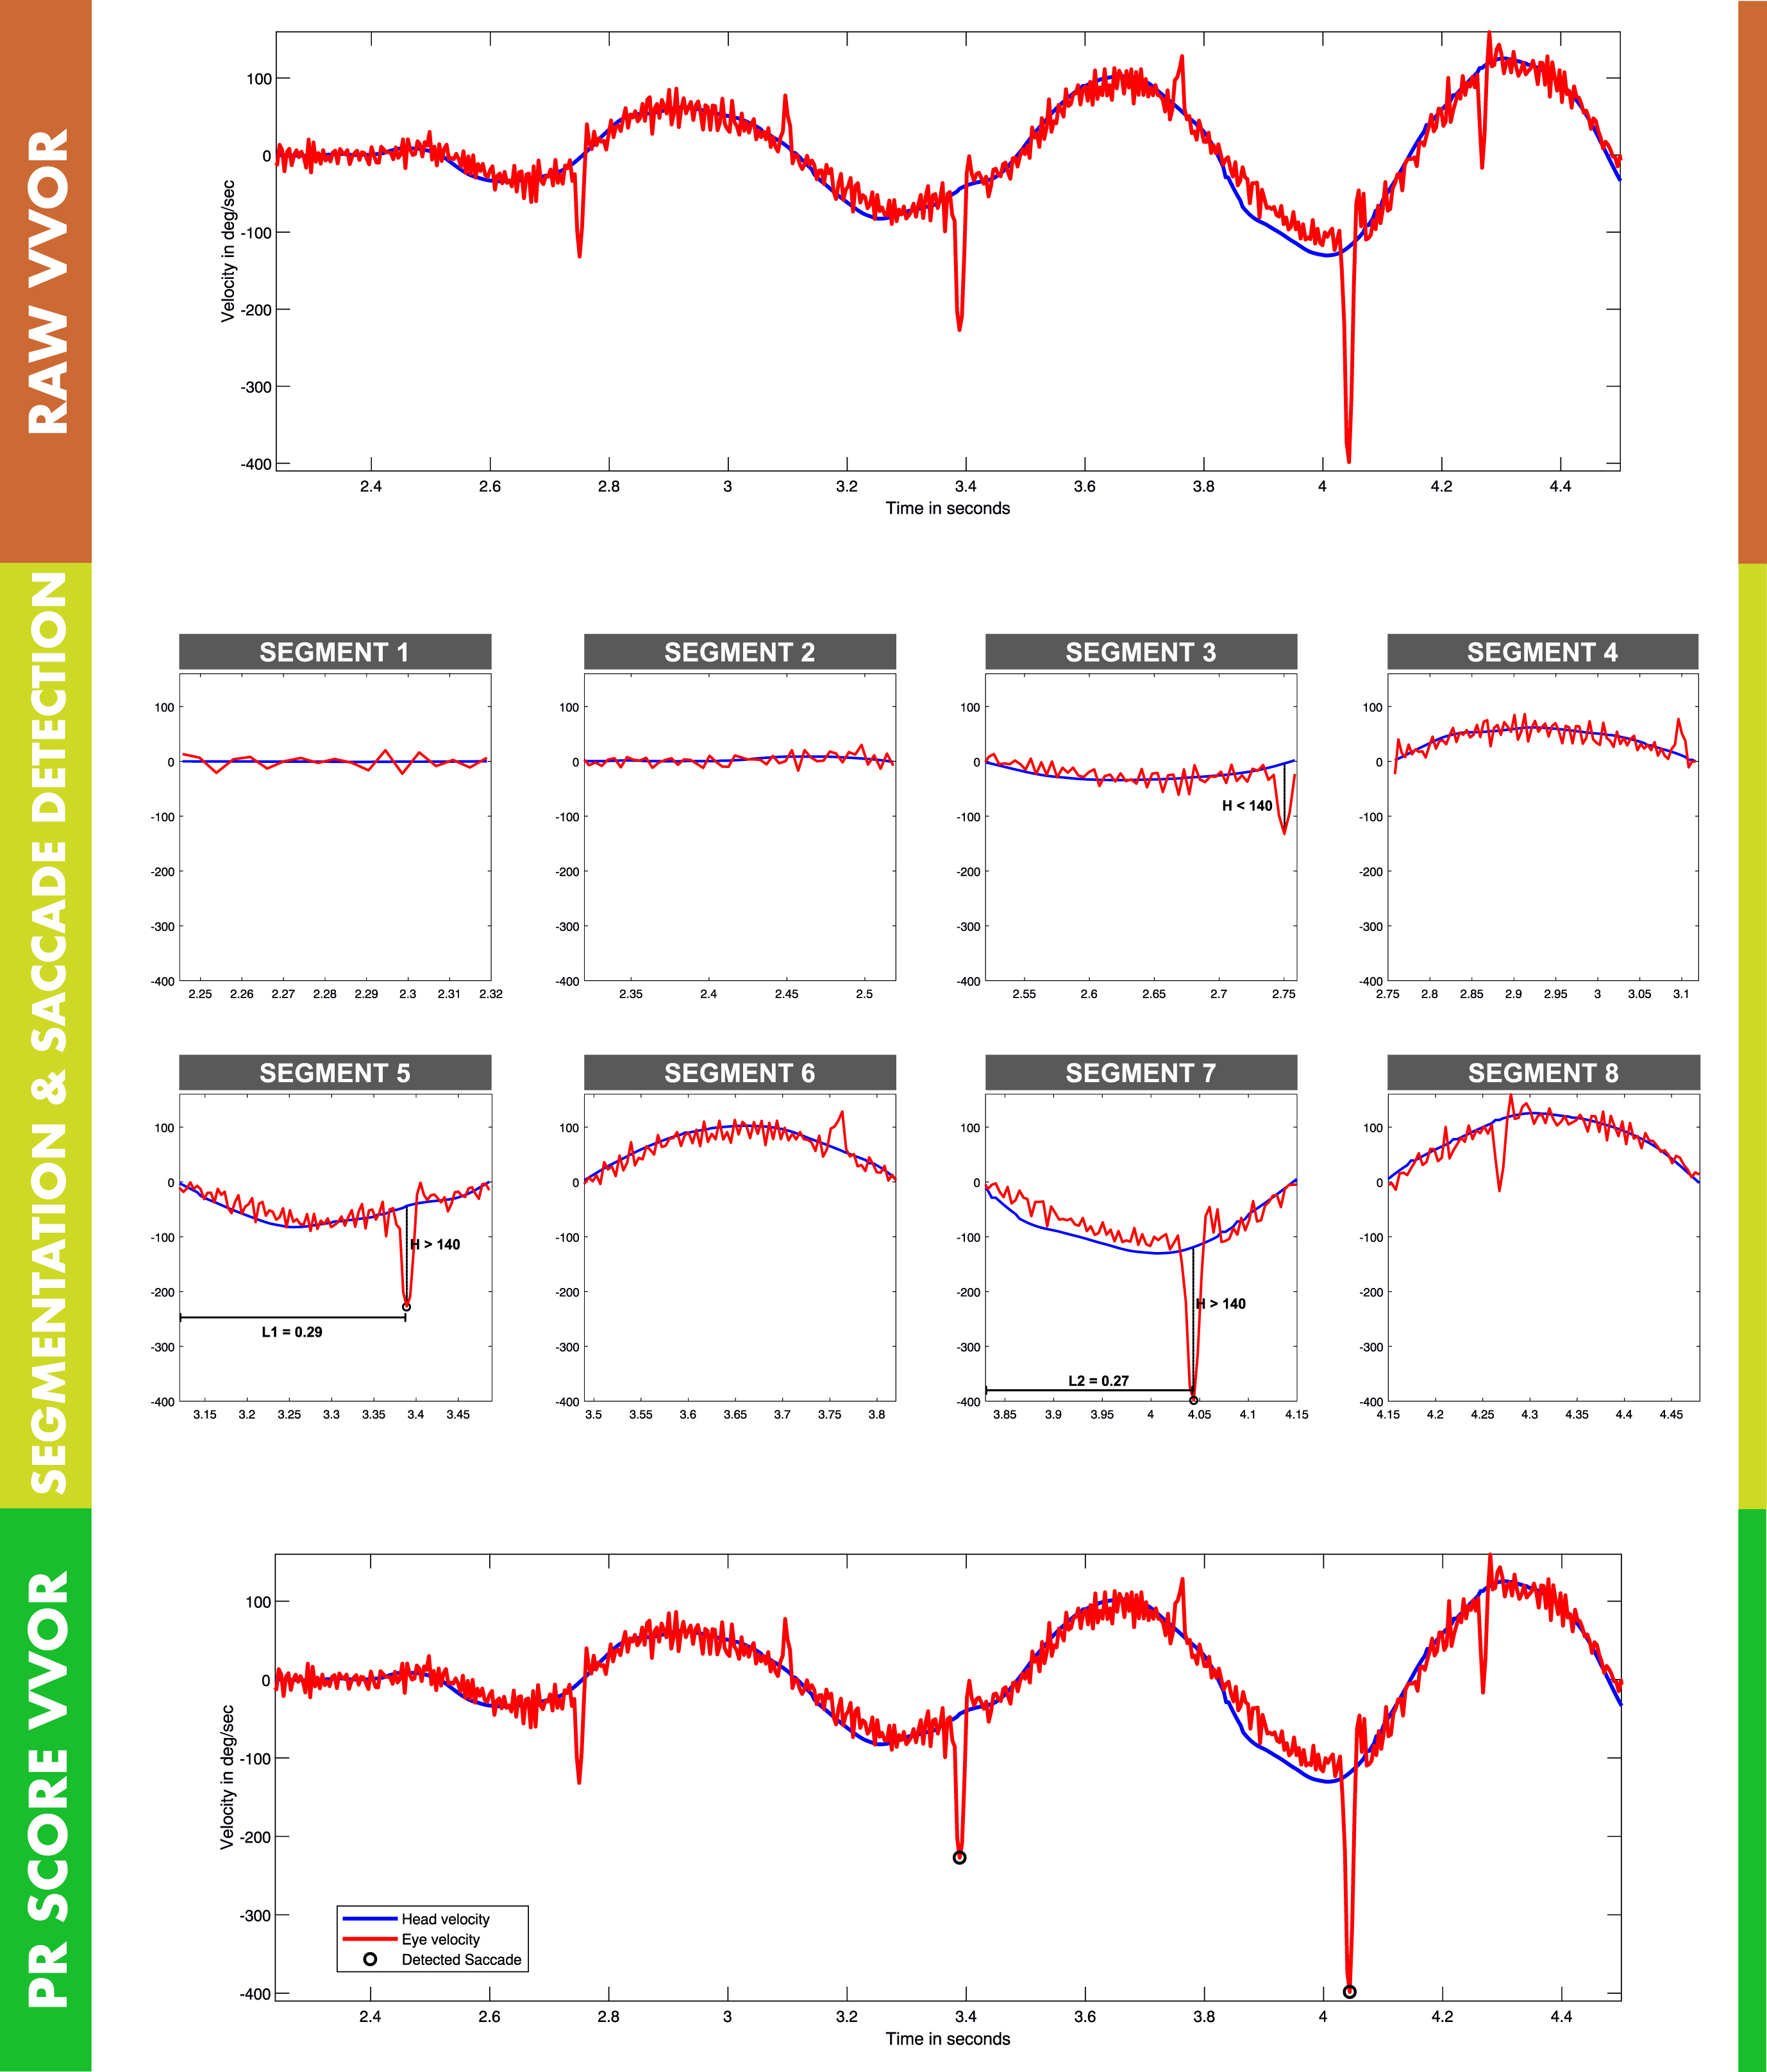
PR score for VVOR algorithm sequence. At the top of the figure (dark red color zone) raw VVOR record as is exported by vHIT device is shown. In the middle (lime color zone) VVOR processing for PR score algorithm VVOR is presented. At first raw VVOR test is split according to sign changes in data logical condition to detect head oscillations, 8 segments were detected for this VVOR test. Each segment contains one side head oscillation, then positive (left side, segments: 2, 4, 6 and 8), and negative (right side, segments 1, 3, 5 and 7) velocity head oscillations will be computed for each left and right PR scores. For right PR score saccades are detected in segments 3, 5 and 7, but only saccades 5 and 7 are computed in this case because segment 3 saccade is under 140°/s velocity (H distance in plot). For segments 5 and 7, latency is calculated by interval time between oscillation start time and peak velocity saccade time. Latency (L distance in plot) 0.29 s was computed for segment 5 and 0.27 for segment 7. At the bottom (green color zone) final, post processed, VVOR with detected saccades is plotted. PR score is computed by pondered variation coefficient of measured latencies (L1 and L2 values). In this example PR score is not calculated because there are only two detected saccades that are under the minim required value of 4 saccades included in the PR algorithm for quantified VVOR test.
Numeric value for PR Score was computed using same coefficient of variation of saccade latency used in vHIT calculation [21]. The PRVVOR score was computed with latency data split in positive (left direction) or negative (right direction) according to head velocity sign of each oscillation to get left and right direction PR scores. PR score was finally corrected to set to 100 all values over 100. As metadata for each PR score calculation, head oscillation frequency, standard variation of head oscillation frequency and number of saccades per oscillation was added in VVOR quantification general method to complement the information about the head data variability of the computed PR score. If less than 4 saccadic responses were detected for each side, the PR score for this side was not computed.
To validate the accuracy of the new developed PRVVOR score, a statistical correlation analysis was performed with the PRVHIT score. For this, we used retrospective data from our neurotology unit at a tertiary hospital center. Data for patients that visited this unit during 2018 to 2019 was included if the period of time since diagnosis of vestibular neuritis or time form vestibular neurectomy (for vestibular schwannoma completely resected) was below 3 months. All patients were examined by the same senior examiner (JRM) and both vHIT and VVOR were performed in the same testing session using the same vHIT device, keeping same device setup during both (vHIT and VVOR) testing. Data was excluded due to presence of artifacts [14], when VVOR testing was not in conformance with testing and recording method described by Soriano-Reixach et al. [23], and if mean horizontal peak head impulse (vHIT) was < 180°/s or if mean head oscillation frequency (VVOR) was < 1 Hz. A second researcher (MSR) reviewed the collected data and computed the PRVHIT [21] and PRVVOR. Variable data collected in this study is available in supplementary file 1.
Since no novel or exceptional interventions were performed in this retrospective database study, only the approval of the local ethical committee from the ENT department of the institution was required in accordance with statal applicable laws. This study was designed and performed following the ethical guidelines of the 1975 Declaration of Helsinki.
R square Pearson’s coefficient was used to compare both PR scores in order to validate the accuracy of the new PRVVOR. Descriptive statistics and linear mixed-effects model (LME) for repeated measures were used to evaluate all the clinical and testing variables association with vHIT and quantified VVOR gain and PR score dependent variables.
R 4.0.5 (R Core Team 2020. R: A language and environment for statistical computing. R Foundation for Statistical Computing, Vienna, Austria. URL https://www.R-project.org/) statistical computing language was used to perform statistical analysis. Statistical significance level for this study was 0.05.
Results
The PRVVOR was successfully calculated from all VVOR data. PR score algorithm was implemented and shared in open source terms in GitHub public repository https://github.com/bendermh/VVOR spe-cifically developed PR algorithm for VVOR testing is coded in “prScoreVVR.m” (https://github.com/bendermh/VVOR/blob/master/prScoreVVR.m) MATLAB file.
The validation study of the PRVVOR was performed with the data of 30 patients: 11 post-neurectomy (due to vestibular schwannoma completely resected) and 19 with subacute vestibular neuritis. Normal eye motility, in particular smooth pursuit, was recorded in all the patients. Demographic data is summarized in Table 1 and age density plots in Fig. 3.
Main descriptive data and vHIT and VVOR quantified variables measured mean values by post-neurectomy, vestibular neuritis and overall (patients) groups. “Time gap” variable is the time gap since hypofunction starts until vHIT and VVOR test was performed. PR score for both vHIT and VVOR unaffected side is not listed because it was 0 for both tests in all patients
Main descriptive data and vHIT and VVOR quantified variables measured mean values by post-neurectomy, vestibular neuritis and overall (patients) groups. “Time gap” variable is the time gap since hypofunction starts until vHIT and VVOR test was performed. PR score for both vHIT and VVOR unaffected side is not listed because it was 0 for both tests in all patients
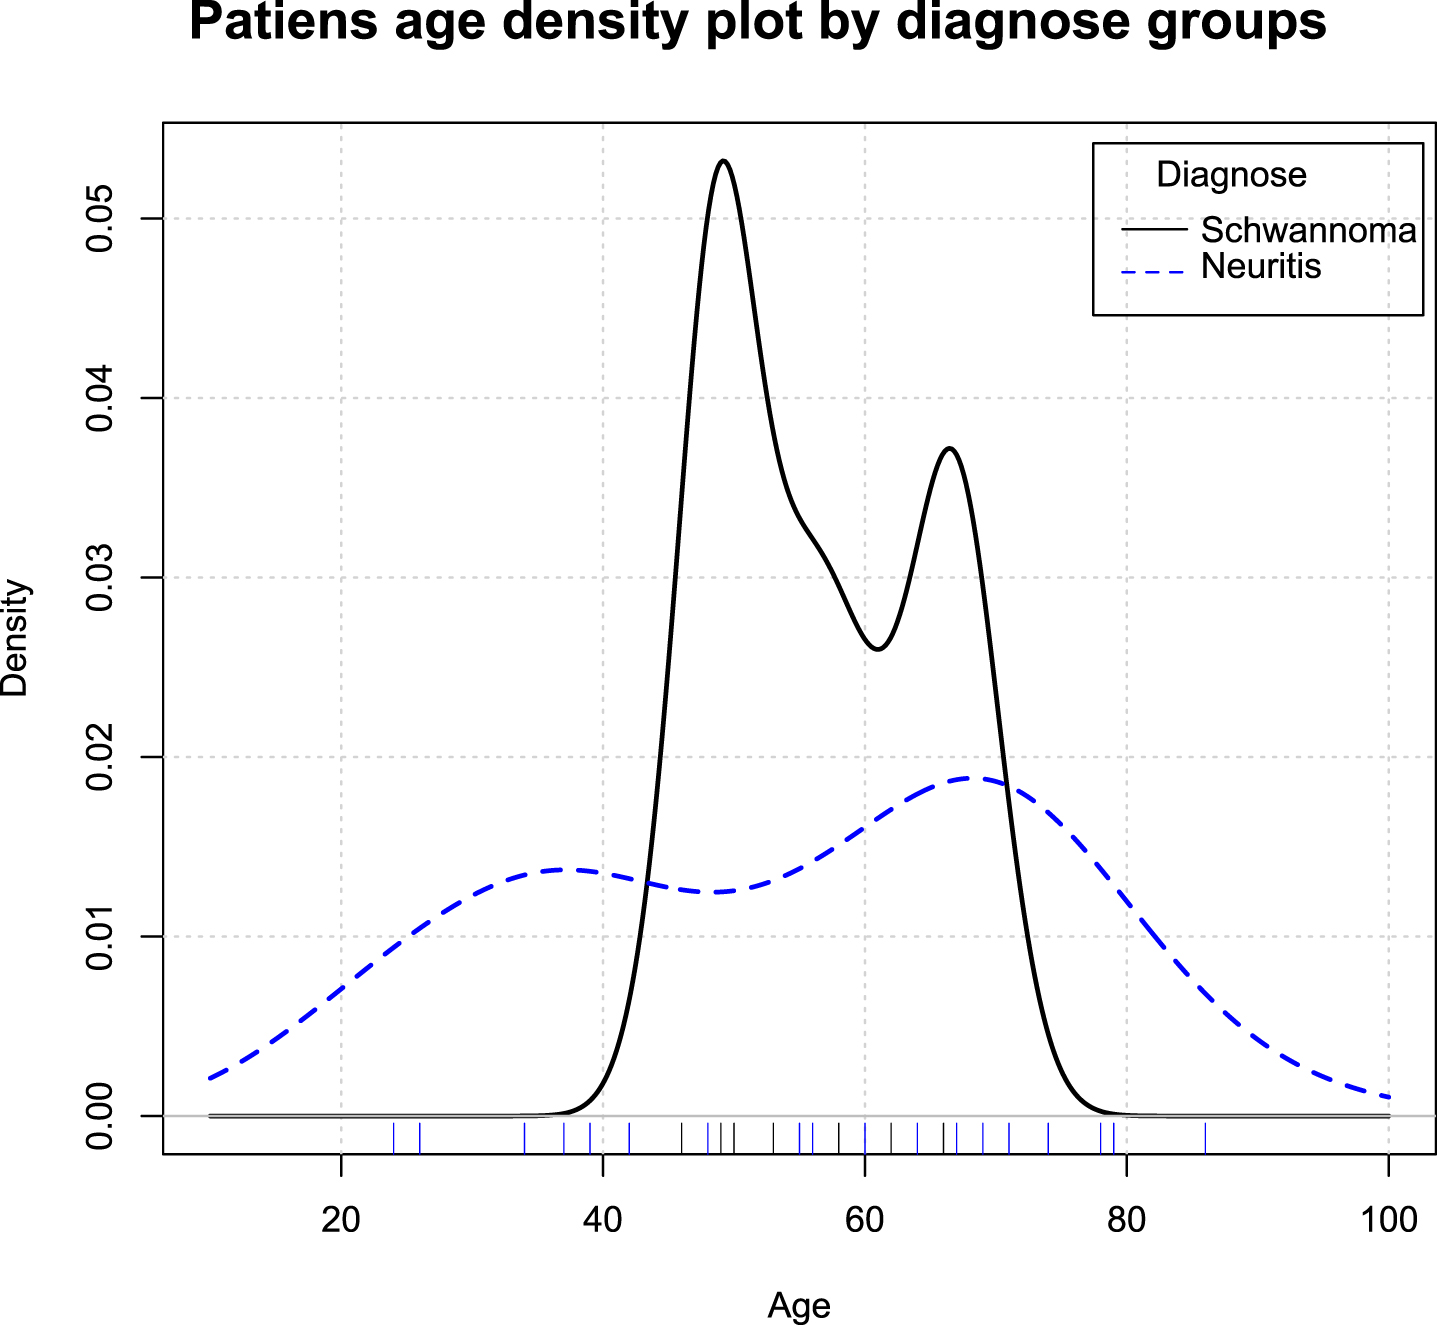
Density plot showing the age distribution, included pa-tients’ records grouped by clinical diagnose.
Pearson’s correlation coefficient (R2) was for the overall sample 0.92 (p < 0.001) and the 95% confidence interval (CI95) was 0.85 –0.96. In vestibular neurectomy patients, R2 was 0.94 (p < 0.001) and CI95 : 0.79 –0.98, in vestibular neuritis patients, R2 was 0.90 (p < 0.001) and CI95:0.76–0.96. Linear regression plots are shown in Fig. 4.
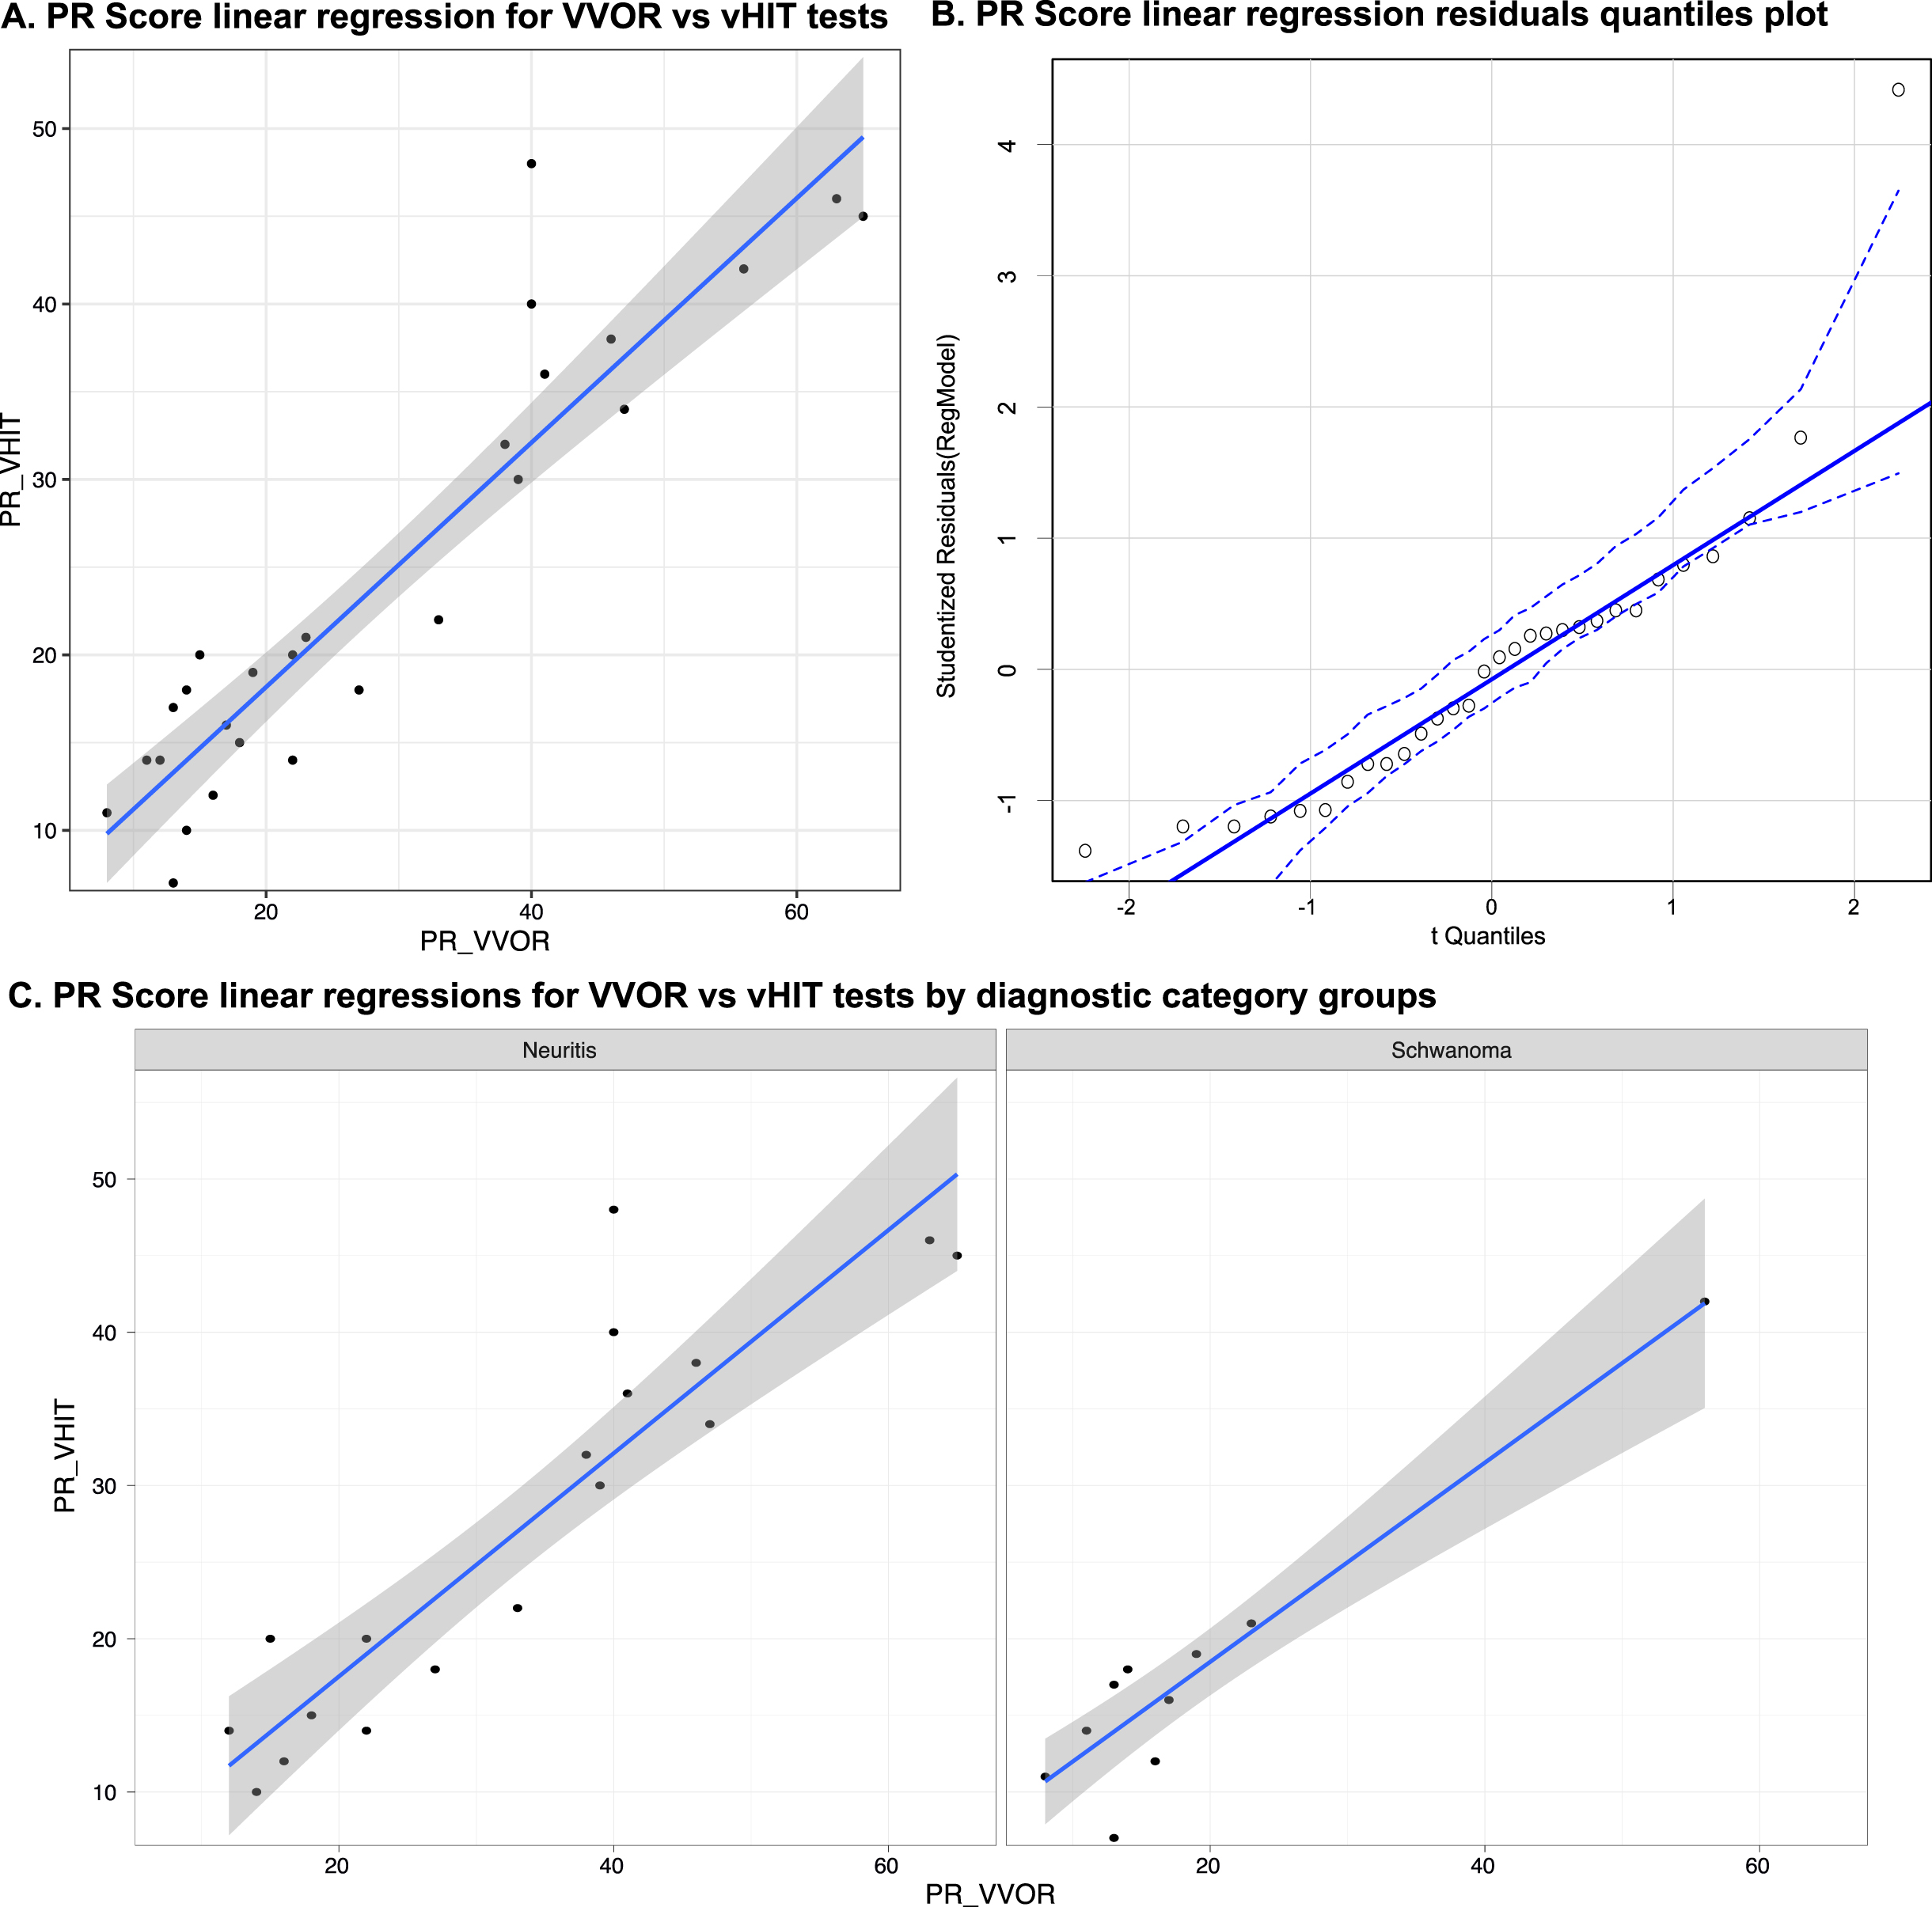
Linear regression for VVOR and vHIT PR score values. In plot A, regression line (blue line) and data dots are plotted, grey area is the 95% confidence interval for regression line. In this figure PR scores from VVOR and VHIT data are plotted for all the patients included in this study (R2 = 0.92). In plot B, residual –quantiles plot of linear regression plotted in A is shown. Plots in C are the regression lines between VVOR and vHIT PR scores split in diagnostic groups, vestibular neuritis in left side (R2 = 0.90) and vestibular schwannoma with surgical neurectomy in right side (R2 = 0.94). Regression lines are blue lines and grey areas are the 95% confidence interval for each regression line. All the obtained R2 values where statistically significant (p < 0.001).
In the gain LME model, only the gain of the VOR in the vHIT and VVOR showed statistical influence (p < 0.001); a trend to significant influence was also for lesion side (p = 0.061) in Wald X2 test. Nor age, sex, clinical group, time since hypofunction neither presence of spontaneous nystagmus did show statistical association with VOR gain values.
In the PR LME model, only PRVHIT and PRVVOR showed statistical association with PR score in Wald X2 test (p = 0.008); a trend to significant influence was also found for the clinical group (p = 0.077). Nor age, sex, lesion side, time since hypofunction neither presence of spontaneous nystagmus did show statistical association with PR score values in Wald X2 test.
The result in the VVOR test comes from the combination of two findings. In the first instance, the sinusoidal pattern of eye velocity is easily observed while testing. The quality of the response is defined at a glance according to how it mimics or not with the head velocity. It can be analyzed offline and the gain result (the relation between eye and head velocity) has been shown to be different between cases of unilateral and bilateral vestibulopathy whether peripheral or central [19, 20]. A second observable sign is the CSR, which occur whenever there is a significant amount of vestibular deficit and corresponds to a reduction in gain of the VOR. These saccades will head to the unaffected side (as spontaneous nystagmus) mostly when head is moved toward the affected side. They will appear with different shapes according to the methodology of the current system with which it is recorded [20] and they have to be excluded in order to analyze the relation of eye to head velocity as previously mentioned. In the cases that, additionally, a smooth pursuit disorder is part of the disease, both, the pattern of eye velocity and CSR, will be extremely abnormal like in the case of CANVAS [18]. Our paper is the first to analyze the characteristics of those CSR during VVOR testing in patients with unilateral peripheral vestibulopathy: we have found that their coefficient of variation (PR score) strongly correlates with the vHIT one. This PRVVOR calculation relies in proper methodology. We have followed the indications by Soriano-Reixach et al. [22] described above.
Whatever any of these recommendations are not fulfilled, the results will probably not be comparable. Therefore, own laboratory results are needed to perform; for them it is imperative to consider the head oscillation frequency, its standard deviation and the number of computed head oscillations. There is a relative lower absolute mean value in PR score of the PRVHIT presented in this work when it is compared with previously published results [6]. For the present research, we have used the original published open-source system [21] to compute PR score, while in the latter case the authors used a commercially available equipment to compute the PR score, that has not been clinically validated. Despite we believe these differences between PR systems are due to the saccadic responses recognition algorithm and also, because of the differences between patients’ sample, we recommend to obtain their own normality data according to the method in use, especially when using non-validated calculation methods.
Despite the strong positive correlation [9] found in this study between both PR scores (R2 = 0.92), an important statistical difference was detected in the gain result in vHIT and VVOR test. This is an expected finding given the differences between both tests. The unpredictability and high frequency (5 Hz) of head impulse test ensures that irregular vestibular afferences of VOR [10] are commanding eye responses in vHIT [8]. However, in the VVOR testing, stimuli are at lower frequency (1-2 Hz). During that sinusoidal stimulation not only will stimulate regular vestibular afferences of VOR response [10], but also (due to predictability) smooth pursuit and optokinetic reflex will contribute to the final response, in particular at < 1 Hz head stimulation frequency [13].
Under these physiological evidences, we can expect, that gain and PR scores, will be different between vHIT and VVOR tests but well correlated in each of them: gain of VOR in vHIT and PRVHIT, and gain of VOR in VVOR and PRVVOR as shown before [20, 22] and in this study. This suggests that we are measuring the same gain and PR score parameters slightly different but strongly related because of the different physiological conditions between tests and PR score. We can conclude that measurement of saccade synchronicity in both tests is possible (Fig. 5).
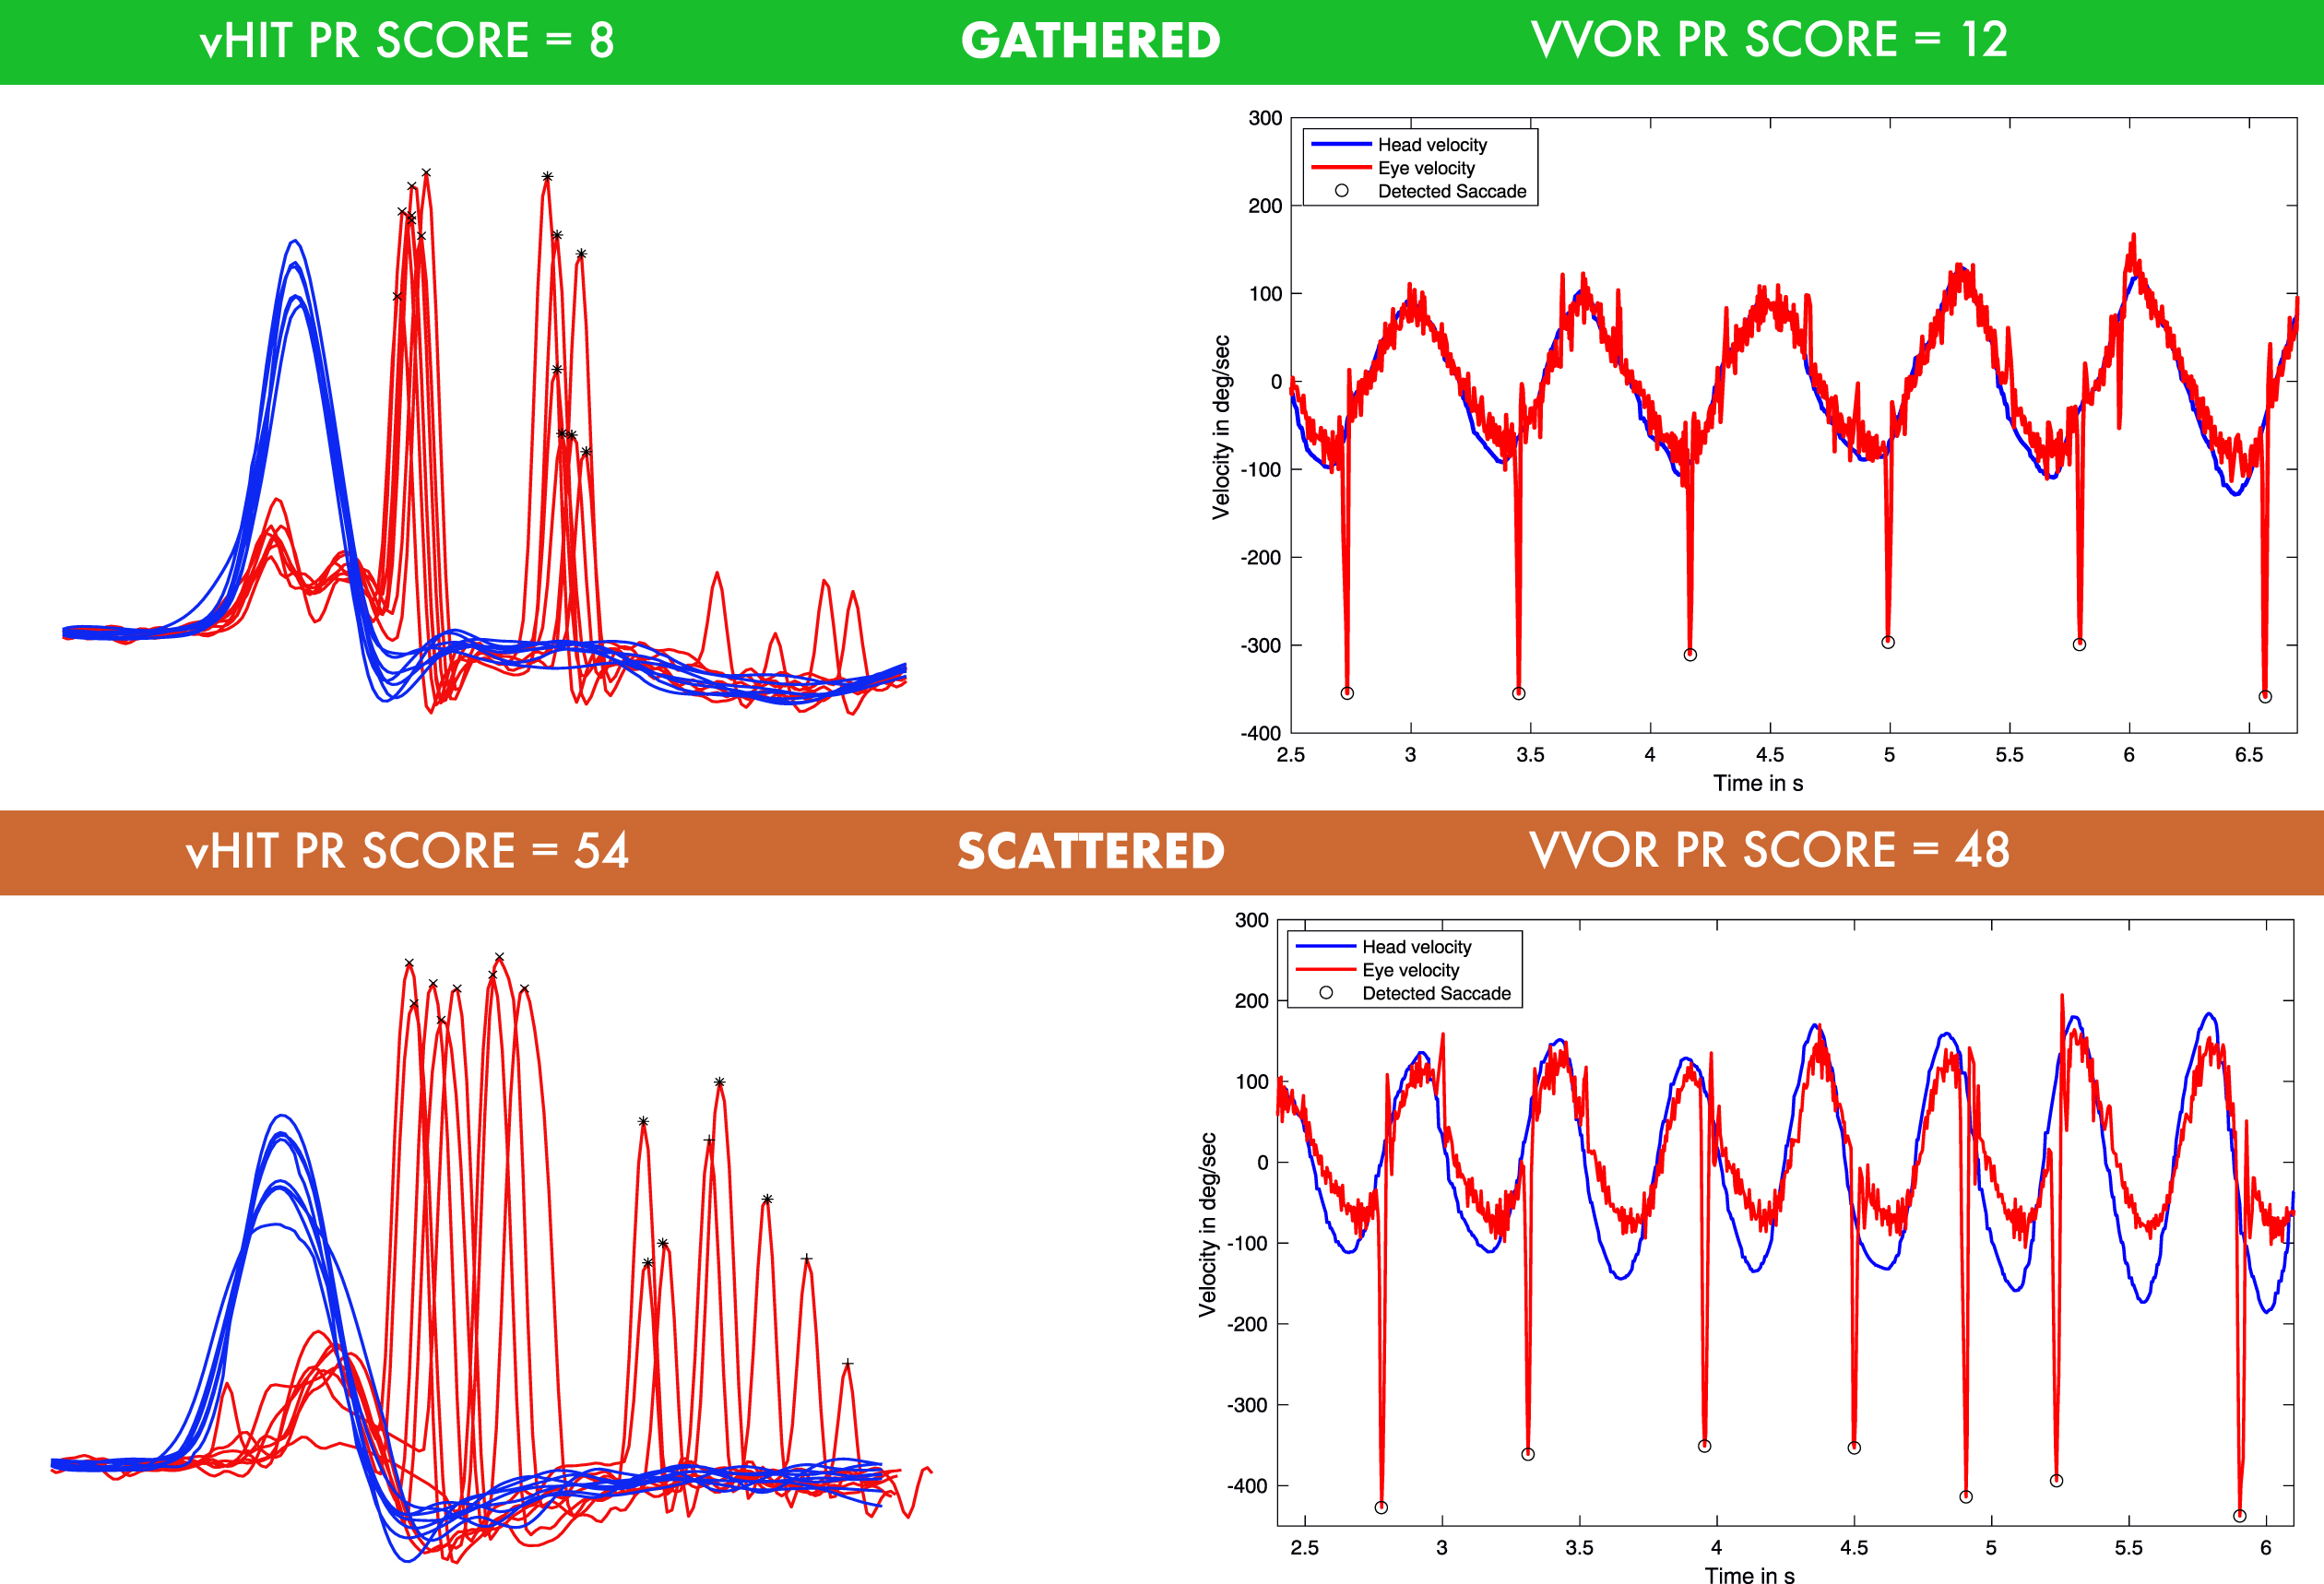
Example of gathered and scattered PR scores from two patients included in this study are plotted in both (simultaneously collected) vHIT and VVOR tests. On the top of the figure, vHIT in left and VVOR at right are plotted both with low (gathered) PR scores of 8 and 12, respectively, from one patient with vestibular neurectomy. As can be observed, vHIT saccades appears always at the same time intervals and VVOR saccades appears also always at the same head movement time for each oscillation, a little after the head velocity peak. On the contrary, at the bottom of the figure a patient with subacute vestibular neuritis is plotted. Saccadic responses with higher PR values in reference to the previous patient appears in both vHIT and VVOR testing (54 and 58 values in PR score respectively). Observe that at this patient in VVOR testing, saccades appear at different moments of head oscillation; even during contralateral head oscillation (see saccadic responses around second 5).
But because of these statistical differences found in LME model between PRVHIT and PRVVOR and the limited diagnostic categories included in this study, further studies should expand the PRVVOR clinical characteristics and correlation with other vestibular markers of vestibular compensation, similar to the findings actually described for the variations and clinical meaning of PR score in vHIT testing [6, 21].
PR score for both vHIT and VVOR clinical tests did not show any differences between other clinical and measuring variables according LME statistical models. Among these variables, it is especially significant that the presence of SP nystagmus was not a statistical influence for both PR score and VOR gain values. This suggests that PR score is an independent parameter not influenced for the presence of spontaneous nystagmus, but it should be considered that our (retrospective) validation study was not specifically designed to study SP nystagmus influence in PR score. This is somewhat controversial in reference to a very recent publication that showed how the intensity of SP nystagmus at diagnosis will influence not only hospital stay in patients with VN, but also short-term prognosis of compensation [11]. We do not think there is true a controversy, as we are not considering the intensity of the response, only the bedside evaluation. Moreover, SP nystagmus is a static sign of a VOR deficit while CSR, in our method of testing, represent a more complex response during dynamic testing of a deficient VOR [12]. And finally, we know, as such, that [15] the patients who presented CSR are partly due to: 1) VOR is reduced so while moving the head towards the affected side, then the eye drifts with the head and a CSR is needed to keep the eye on target, 2) head motion revealed spontaneous nystagmus, and 3) gaze-evoked nystagmus when the head is at its maximal deviated position and a mild 1st degree spontaneous nystagmus could occur. Upon that, during low frequency testing the action of the optokinetic-reflex (OKR) contributes to the eye stabilization; however, at high frequencies, the vestibulo-ocular reflex overrules the OKR in particular when the scene is stationary. We consider that the best way to analyze the contribution of each should be by analyzing in a longitudinal follow-up study the different manifestation of SP nystagmus and PR scoring.
We conclude that according to the correlation results obtained in this study (R2 = 0.92), the new developed PR score for synchronization measurement of saccadic responses in VVOR testing is a valid method which outputs synchronization values that strongly correlates with PR score in vHIT test (see Figs. 4 5).
Footnotes
Declaration of interests
The authors report no conflicts of interest. The authors alone are responsible for the content and writing of the paper.
Funding statement
The authors report no funding.
Authorship
MMSR, JRM and NPF have equally contributed to this study design, data analysis and redaction of this manuscript. JRM and XA has collected the data for this study. NPF was the head of this research group.
Level of Evidence
II: Individual cross-sectional studies with consistently applied reference standard and blinding (Diagnosis)