
Abstract
The idea of extracting knowledge from log data for both data mining and process mining emphasises data flow and relations among data items in the data. Unfortunately, challenges have been encountered when working with the data flow and relations. One of the challenges is that the representation of the data flow between a pair of elements or tasks is insufficiently simplified and formulated, as it considers only a one-to-one data flow relation. In this paper, we discuss how to effectively represent dependency relations in log data. To this end, we introduce a new representation of the data flow and dependency formulation using an extracted flow graph. The solution solves the issue of the insufficiency of presenting other relation types, such as many-to-one and one-to-many relations. As an experiment, a new evaluation framework is applied to the Teleclaim process in order to show how this method can provide us with more precise results when compared with other definitions.
Introduction
Data mining and process mining are related disciplines which can complement one another [21]. Process mining is used to extract knowledge from the event logs stored in the information systems in order to discover, monitor, and improve real processes [3] using an event log as a starting point [24,26]. Process mining can be classified as an extension and a descendant of data mining [20]. The ideas that have been developed in the field of data mining are widely applicable for assessing the outcomes of process mining. In addition, there are certain process-mining techniques that are drawn from classical data-mining techniques, such as the discovery and enhancement approaches that centre on data and resources. Furthermore, the analysis of different types of decisions regarding business processes is directed by data mining [15]
Data mining and process mining share the same concept of emphasising the relations, data flow, and dependencies among elements in the extracted information, where dependency is a measure to find the extent of the association or co-relation between a pair of tasks. Dependency is that “the occurrence of one event type depends on the occurrence of another event type” [11]. In process mining, many algorithms, such as heuristic-based algorithms [35–37] and α-series algorithms [4,36,39] have been elaborated. Many algorithms in data mining include dependencies among nodes (tasks) in the flow graph, namely rough sets and decision algorithms [12,13]. In process mining, Weijters et al. generated a dependency graph based on the concept of “the all-activities-connected heuristic” [37], whereas in data mining, Pawlak introduced a dependency based on an acyclic flow graph and probability theory, using an event-independent concept [12]. Another related representation of dependencies is introduced in [34], which showed a model of dependency impact analysis for web services evaluation.
The relation types of the data flow in process mining and data mining are significant for several reasons. The data flow relations show and control the structure and relations between tasks. Based on the data flow relations, the process model or flow graph can show the dependency between a pair of tasks. However, because of the bias in most of the proposed methods, the data flow representation tends to be insufficiently simplified and formulated. For example, heuristic-based algorithms in process mining mainly consider the frequencies of the two contrary directions of data flow. Nevertheless, they consider only a one-to-one (1-1) data flow, which is derived from a direct succession relation, the starting point for the other relation types in process mining [21]. Heuristic-based algorithms do not represent other types of data flow, such as many-to-one (M-1) and one-to-many (1-M) flows. In addition, they do not include associations by involving confidences when composing the data flow and dependency. Including the confidences in the data flow and dependency increases the precision, because the frequency can be misleading when changing between low and high frequencies. On the other hand, Pawlak introduced a representation of data flow and dependency in data mining based on confidences [12]. Pawlak uses a flow graph to describe the relations of association rules and dependencies among tasks. Even though Pawlak includes other types of data flow relations and confidences, the two contrary directions of data flow are not included. Moreover, the formulation of the dependency is not composed properly.
Therefore, this paper proposes a new data flow representation to show the possible M-1 and 1-M relations. The new representation simplifies the data flow relations in the flow graph and extends that to propose a new dependency equation, which provides the right data flow in the process and increases the dependency precision. The proposed representation exploits the strengths in both the Weijters et al. [37] and Pawlak [12] representations and avoids their weaknesses. The major modifications and formulations in this new model are summarised as the use of the other relation types of the data flow and bidirectional associations. Even though this representation has the same foundation as in [2], it is considered to be an extension, because the major details in [2] are partially changed.
In order to evaluate and compare the proposed dependency with the other models, the proposed representation that was previously introduced in [2] was amplified and used as an adequate quantifying measure to manage and control the evaluation for the extracted knowledge or model. Using the dependency equation and stages inspires and motivates us to develop an effective technique that establishes a new evaluation property. The primary assumption of the evaluation property is that the forward flow (out-flow) in a stage is very close to the backward flow (in-flow) of the same stage in the perfect situation. When the forward dependencies of the stage are subtracted from the backward dependencies, the result should be zero or close to zero.
The evaluation framework is applied to the Teleclaim process. The data of the Teleclaim process are popularly used in process mining groups.1
More information can be found at
The remainder of the paper is organised as follows. The related work is explained in Section 2, while the background is given in Section 3. The knowledge extraction and representation are introduced in Section 4, whereas the evaluation principle is defined in Section 5. Section 6 presents the evaluation framework and the experiments, and the conclusion follows in Section 7.
The dependency graph in process mining was originally created by Agrawal et al. [1] using the event log as an input. They defined two kinds of graphs: a dependency graph and, a conformal graph. However, their work did not distinguish the different kinds of flow (e.g., the data flow or the control flow) when constructing the graph, whereas Hwang and Yang [7] considered only the control flow in the instances of process models. A dependency graph generated from the concept of “the all-activities-connected heuristic” was introduced in [37]. The main concern in this dependency graph is discovering the process model and keeping in mind the need to reduce noise in event logs. In another study, Lou et al. [11] mined every temporal dependency between a pair of tasks to cover any interleaving patterns in the filtered event log. An initial basic graph is generated from the temporal mined dependency using support and confidence and excluding loop relations. The dependency in [11] was classified into five types (forward dependency, backward dependency, strict forward dependency, strict backward dependency and no dependency).
From a data mining perspective, Pawlak [12] built a flow graph using the data flow based on deterministic dependency. This flow graph is for representing the relations of associations among items. Subsequently, Pawlak’s flow graphs have been extended and applied in different fields, such as [13,19] and [10]. However, Pawlak’s representation did not explicitly mention M-1 and 1-M flows. The M-1 and 1-M flows are described in data mining to show associations mining. The starting point of the associations is rules that include 1-1 flow [6]. However, the M-1 and 1-M flows are introduced as associations mapping in [8] and [9]. Although the representation of the dependency in [12] has a totally different foundation from the representation in [37], the proposed dependency exploits and uses the advantages of the process mining and data mining perspectives in one representation. The proposed representation simplifies the data flow in the flow graph and is an extension and mixture of the advantages of the other dependencies and avoids their defects. In another study, Wang et al. [34] in web services introduced a model of impact analysis based on service dependency instead of the task dependency. Wang et al. [34] classified the service dependencies into four kinds (process dependency, semantic dependency, message dependency and non-functional dependency).
In 2004, van der Aalst et al. [30] defined the relations between a pair of tasks and introduced α-algorithm, which applied these relations in event logs to discover process models. The assumptions and limitations in α-algorithm (i.e., event logs are assumed to be free of noise, and discovered models should be presented in Petri nets) raised many issues that opened a new trend of algorithms in discovering process models, such as α-series algorithms and heuristic-based algorithms [32].
Using Petri nets and other modeling languages as process model representations over the last decade has built up biases and created limitations. Therefore, a new language of process representation, Causal net (C-net), is highlighted [22,23]. C-net is a new representation, and few discovering techniques utilise it [18]. Even though C-net shares with other discovering model techniques the same ability to identify and model splits/joins from tasks, C-net is a different semantic representation that is concluded in sequences of valid binding [16,17,35].
Background
The background discusses dependency in Sec-tion 3.1. Preparing the event log by filtering is explained in Section 3.2 whereas Section 3.3 outlines the log-based ordering relations. In Section 3.4, the dependency of the 1-1 flow is described.
Dependency
The dependency contributes to the structure of a graph. It also provides a clear view of the data, control and resource flow. Hence, dependency can show and control the structure of the graph and the relations between tasks. Moreover, since most of the existing quality measures of the process model discovery involve qualitative measures and not quantitative measures, dependency can be used as a quantifying measure for the discovered process model. Although there are studies that have included quantitative measures, such as [25] and [14], they are few, and most of them are limited to the Petri net modelling language.
The dependency between a pair of tasks can be considered from various viewpoints. Based on the objectives, the viewpoint tends to increase the correctness and precision of the result by using different elements with different formulations. For example, heuristic-based algorithms [35–37] use a dependency graph that is established based on the dependency between a pair of tasks and the 1-1 flow. The activities in this case are tasks, which can be equivalent to the transitions in the Petri net modelling language.
The 1-1 flow can be extended to different types of data flow. The extended flow types can be M-1 or 1-M flows. For instance, consider the dependency between a father and his child in terms of the flow of financial support. We assume that the flow of the child’s finance is A$100. When the father provides the child with A$100, the dependency is now 1-1 and fully dependent on the father because the flow of the child’s finance comes only from the father. When the child has a part-time job and gets A$50, the dependency is now M-1 and partially dependent on the father because the flow of the child’s finance depends on the father and the part-time job to flow A$100. If the child has to pay various expenses for other items, such as a school and a gym, the type of financial flow in this case is 1-M. As a result, the data flow should be extended to M-1 and 1-M flows.
Filtered event log
In this paper, the filtered event log (FEL) is the main source of data. FEL can be extracted and filtered from different kinds of data sources (e.g., flat files and web or user logs). Extracting and filtering the event log are a refined process [21]. In our case, extracting and filtering consist of eliminating irrelevant and useless data and then generating one set of transactional records that includes only tasks. This set of the transactional records matches an event log or a data source and every record matches a trace in the event log. FEL is constructed to answer the questions that were asked before beginning the extracting and filtering. According to the Process Mining Manifesto [24], the first two guiding principles are “Event Data Should Be Treated as First-Class Citizens” and “Log Extraction Should Be Driven by Questions”. The questions asked are changed based on the outcomes of process mining. Therefore, either the process-mining workflow can be started again or FEL can repeatedly be changed when the questions asked are modified [21]. Definition 1 explains FEL, and Table 1 shows an example of FEL (FEL1).
Let FEL be a set of transactional records and let a transactional record be
Example of filtered event log (FEL1)
The log-based ordering relations are borrowed from [4,30,38], who tried to analyse the causal dependencies between a pair of tasks. These relations are widely used in process model discovery. The starting point of the relation between a pair of tasks is the direct succession relation (DSR) in Definition 2. Three types of loops are also considered in the proposed representation. They are described in Definition 3. The length-one loop relation (LOR) and length-two loop relation (LTR) were introduced in [4]. The long-loop relation (LLR) occurs when a task is repeated in the same transactional record with more than one different task between the repeated tasks. Due to the direction of the loop relations, all the loops in the proposed method are extracted and separated. Figure 1 is an example of DSR and the three types of loops.

Examples of direct succession relation and three types of loops.
Let a transactional record ( Length-one loop relation. Length-two loop relation. Long loop relation.
DSR and loop relations are fundamental relations, because the other relations between a pair of tasks can be derived from them and the starting point of most of the other relation types, namely, the causality relation (CR) and parallelism relation (PR) [4], explained in Definition 4 (refer to [21] for more relation types and details).
Let FEL be a filtered event log over Causality. Parallelism.
The formulation of the flow and dependency is seen as a 1-1 flow in some research. When
the 1-1 flow is considered in the dependency, the second task is fully dependent on the
first task, ignoring the other related tasks. For example, Weijters et al. [37] in the Heuristics-Miner algorithm proposed
Eq. (1) (referred to as “Weijters” in this
paper), which measures the dependency between a pair of tasks. The dependency in
Weijters is formulated based on the frequency of the flow in two
contrary directions of a pair of tasks, where
Weijters et al. [37] extended
Weijters into Eq. (2) for LOR and
Eq. (3) for LTR. However, whenever
Weijters is mentioned in this paper, it also includes Eqs (2) and (3) unless they are
specifically differentiated.
Knowledge extraction and representation
Abstraction step
The abstraction step extracts DSR, LOR and LTR from FEL. DSR is stored in a
direct-succession-relation matrix (
Creating
For the purpose of creating and filling
The objective of the induction step is to derive the causality and parallelism relations
from
for FEL1


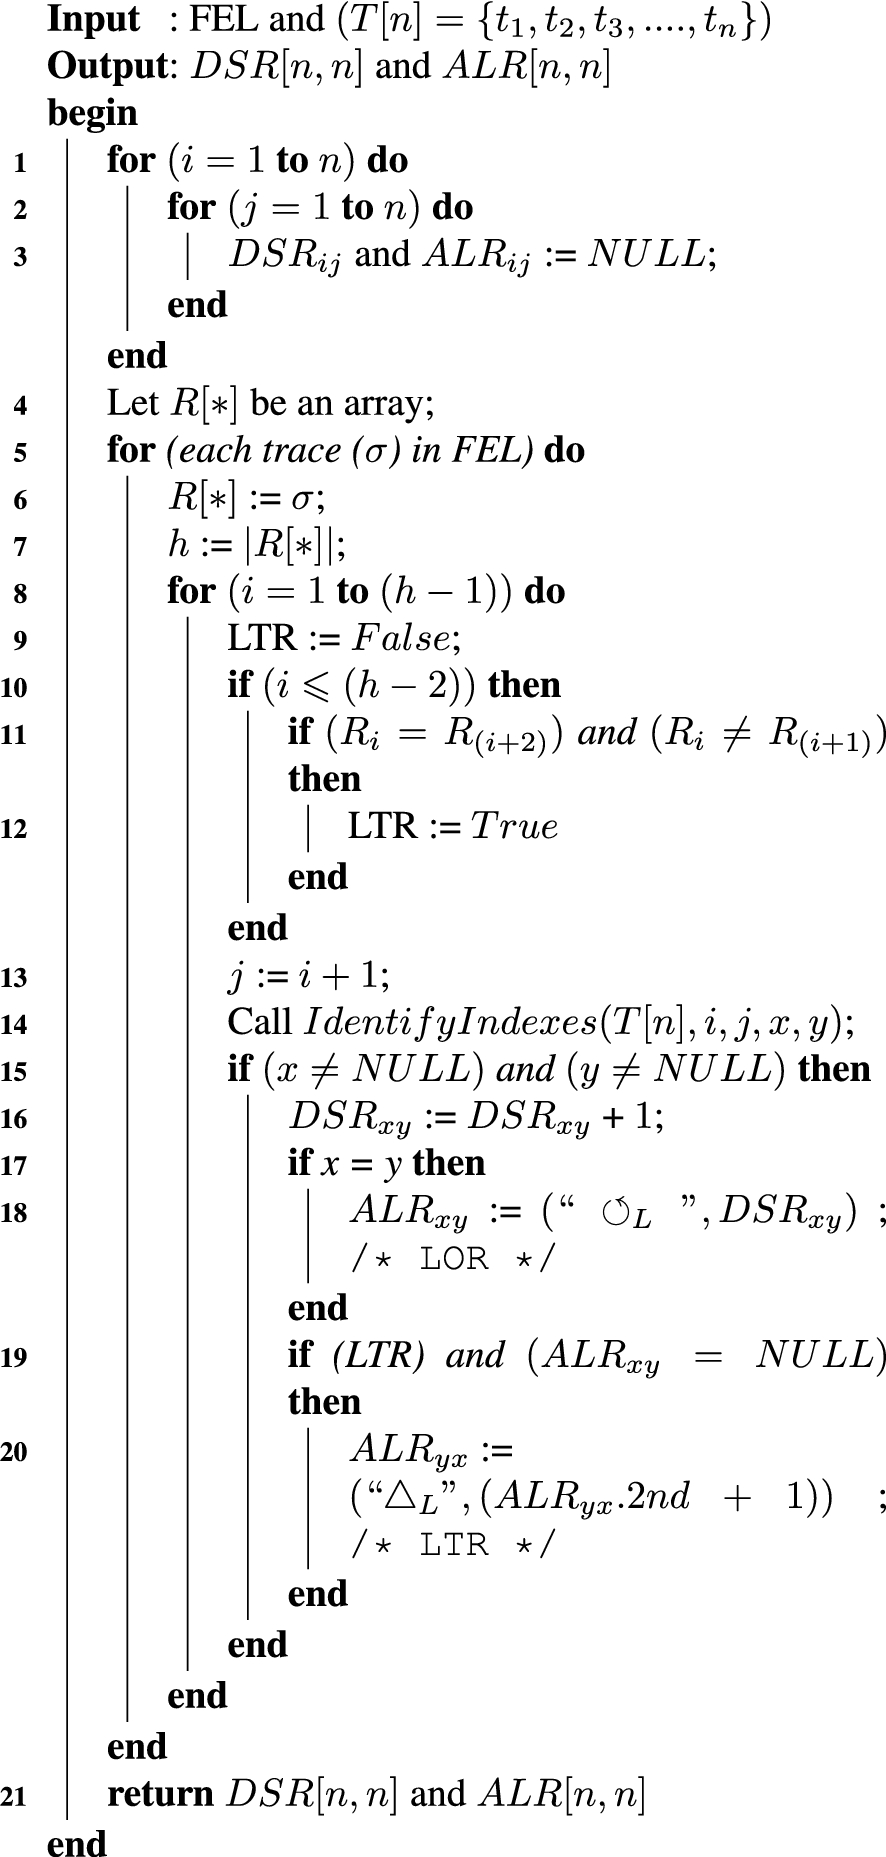
Identifying the indexes

Fusion relates to the parallel tasks in the proposed study. In one parallel portion, all parallel tasks are fused into one flow or arc between the start and the end of parallelism, because including parallel tasks in a sequential situation conflicts with parallelism. The flow and dependency between the start and the end of the parallel portion are usually equal. Simply, the fusion compresses a sub-graph to represent a larger graph or sub-graph. The sub-graph is pre-conditional which means it should be isolated and have one source and one sink. The source is AND-split, whereas the sink is AND-join. The parallel portion must contain two parallel tasks or more. In order to generate the sub-graph, all parallel tasks are eliminated from the graph and replaced by one flow between the AND-split task and AND-join task. The parallelism in a process includes two tasks or more. It can be identified in the proposed method by using Definition 4.
Discovery of LLR
In this section, a new technique is created to overcome the challenges to identify LLR
(Definition 3). Before explaining the technique,

Finding LLR
Algorithms 3 and 4 are
created to find LLR in FEL. The built-up knowledge in
The representation of the flow in FEL is simplified in a graph. The graph is presented by
matrices. Therefore, the matrices,

Recursive part of finding LLR

Let
The 1-1 flow can be extended to different types of flow. The extended flow types can be
M-1 or 1-M flows. In order to represent 1-M and M-1 flows, we need to introduce the
in-task and out-task of a graph, whereby the graph is
Source, internal and sink tasks
There are three types of tasks: source, internal and sink tasks. The source and sink
tasks are described in Eqs (9) and (10), respectively. The “one” in the equations means that
Flow detail
The detail of the flow among tasks is a substantial aspect which contributes to the
structure and analysis of a process. A major detail and characteristic of flow is the
in-flow and out-flow of a task,
The in-flow of CG is described in Eq. (15) and the
out-flow of CG is described in Eq. (16), which are
generated based on the in-flow and out-flow equations of AG and RG.
The flow between a pair of tasks is another trait of CG. It is described in Eq. (17).
Confidence in Eq. (18) is assigned to the flow between a
pair of tasks.
Dependency construction
A new equation (Eq. (19)), called
“
Equation (19) is extended in Eq. (20) for LOR and in Eq. (21) for LTR due to two
reasons. The first reason is that the natural direction of the flow is forward, because
the main direction of a process progresses to the front to reach the end and achieve the
process objectives. The second reason is that this extension aligns with Eq. (1) as proposed by Weijters et al. [37] in their consideration of the two kinds of short loops (LOR and
LTR) as exceptions. However, Eqs (1) and (19) are the main dependency equations and the other extended
equations (Eqs (2), (3), (20), and (21)) are treated as
special cases or exceptions when identifying the dependency.
Stages in process model
The main target of this section is to define the model with unique, sequential and stable
stages,
Let
By considering loops as exceptions in
When
Loop and parallelism in
The concept of the stages and dependency promotes the use of a novel evaluation principle.
Hence, this concept is exploited and extended to evaluate and validate the proposed method
by using the evaluation principle. The principle is summarised in the proposition that the
total out-flow and total in-flow of a task in
Equations (25) and (26) are
introduced for
Equation (27) is called the dependency difference of a stage,
Let assume the following conditions in a primary and perfect situation of FEL: All traces are
completed. No noise is
included. Let
FEL in the real world usually breaks the assumed conditions and includes source and sink
tasks; or FEL in the real world may include a degree of noise or incomplete traces that
slightly affect and deviate from accurate results. Therefore, the significant property of
the stages is that
Based on this derivation, we can measure and compare the performance of the dependency representations and we believe that the difference in Eq. (27) should be close to zero.
Equation (28) is the average used at the end of the
evaluation. In Eq. (28), all the absolute values of
Evaluation in knowledge discovery is a challenging component, especially in process mining.
According to Process Mining Manifesto [24], some
of the challenges in evaluation include finding baselines, avoiding bias, combining with
other kinds of analysis, and balancing the measures. Additionally, evaluation in knowledge
discovery has encountered several open issues that are out of the scope of the proposed
method. However, these issues may be linked to this research in future work. The main focus
of this section is to show how effectively the major aims of the proposed method are
evaluated and how the proposed method compares with and outperforms other methods, while the
major aims that need to be evaluated and validated in this section is
In the evaluation, one of important parts in our intensive experiments was the validation. In order to examine the robustness and reliability, the proposed method was validated by trying to interfere with the flow. We intentionally injected some loops or exceptions that deviated or corrupted the outcomes of the dependency. Subsequently, the outcomes were observed and discussed in order to identify the variations in the outcomes and the degree of robustness and reliability in the proposed method compared to other baselines.
Teleclaim process
The Teleclaim process is inverted from the process mining group2
More information can be
found at
Teleclaim represents the process of an Australian insurance company and shows how the
insurance company handles its claims. The log contains
Another opinion in the formulation of dependency uses the M-1 flow while disregarding the
other flow directions. An example of this is the Pawlak representation in [12]. Pawlak introduced Eq. (29) based on an acyclic flow graph. Pawlak includes and uses the flow graph to
describe the relations of association rules and dependencies among tasks. The key elements
in this equation, when having a pair of tasks, (
Since
Measures
In order to evaluate and discuss most process mining techniques or the quality of the discovered model, four classical quality dimensions are defined: fitness (replay event log), simplicity (avoid complicity), precision (avoid underfitting), and generalisation (avoid overfitting). The four quality dimensions must be carefully balanced to get the best process model. However, balancing them is a challenging issue [24], because of the difficulty in measuring the graph-structured model. Most of the evaluation measures in process mining deal with the quality of the graph-structured model [29]. Moreover, discovering the best process model needs other complex aspects in process mining. However, various measures can be used in the process model discovery based on the representational aims of an analyst [21]. Therefore, the dependency is used as measure to evaluate the main aims of the proposed representation.
for
FEL2


This section lists the sequence of the procedures followed to evaluate the proposed aims.
The following consecutive procedures were implemented in this evaluation: The proposed method was executed using
the Teleclaim process. The
α-algorithm and Manual models were discovered
for the Teleclaim process in order to create models with their
stages. The results of the dependency
equations for the baselines and The dependency setup was
conducted by executing the proposed equations for the evaluation (Eqs (25), (26), (27) and (28)). After that,
the results of these equations were discussed and compared in order to demonstrate
the significance of the proposed representation.
α-algorithm model
generated by the ProM framework with using the event log of Teleclaim and XES
file format. The proposed method was validated in
terms of the data flow directions.

Proposed method results
The preprocessing extracted all the tasks to be created,
α-Algorithm and Manual models
The outcome of the α-algorithm and Manual models was represented by the Petri net modelling language. For the purpose of comparing and evaluating the proposed method, the stages were manually added and aligned in the α-algorithm and Manual models. The α-algorithm model in Fig. 2 was created by the ProM framework [31]. The α-algorithm model consists of eight stages. More stages were discovered, because it was difficult to identify the non-free-choice situation in the Teleclaim process using α-algorithm. This issue impeded α-algorithm from implementing the model with the right depiction. For instance, α-algorithm did not discover the parallel tasks in the model. Therefore, the parallel tasks were included in the stages.

Manual model for the Teleclaim process.
The Manual model for the Teleclaim process in Fig. 3 was derived from the α-algorithm model.
There is a critical issue generated in the α-algorithm model, namely,
how to discover and model a non-free-choice construct. The Teleclaim process has a
non-free-choice situation. The non-free-choice situation is mixture of parallelism and
choice [38]. This situation created a deadlock
in the model generated by α-algorithm. The situation arose after
transition
The Manual model generated seven stages. Due to the implementation of
the dummy task to solve the non-free-choice issue, the dummy task was included in the
stages of the Manual model and was treated as a special case. The
in-flow or out-flow of the dummy task were (
With the help of stages, dependency can be an adequate and useful measure, since the
stages and dependency include the significant and comprehensive representation that can
quantitatively evaluate the extracted knowledge. This section implements the evaluation
principle and shows how the dependency that was used to evaluate and compare
Results of dependency
The difference in Eq. (27) was conducted for the dependency equations in every model. In FEL2, the results of that equation are shown in Figs 4 and 5 for the α-algorithm and Manual, respectively. The results of Eq. (28) for FEL2, which is the absolute average, are shown in Table 8 in order to test and compare the results of the three dependency equations in FEL2 for the two models in FEL2.

Results of Eq. (27) using α-algorithm.

Results of Eq. (27) using Manual.
The discussion points in this section mainly focus on the dependency aligned by stages.
The discussion is based on the evaluation principle that the difference in Eq. (27) should be near to zero or zero. Therefore, the information
in Figs 4 and 5 is discussed.
Obviously, the information in the figures is aligned based on the dependency equations
and the stages. The vertical axis represents the dependency differences, and the
horizontal axis represents the stages. The results of Eq. (27) fluctuate between positive and negative values. The two curves in the
aforementioned figures describe the outputs of the Weijters,
η and
In summary, Table 8 and Fig. 6 reveal the lowest result among the baselines of models and dependency
equations. In Table 8, the results from
Results of Eq. (28) using all models and dependency
equations
Results of Eq. (28) using all models and dependency equations

Results of Eq. (28) for three dependencies and two models.
The proposed representations were validated by disrupting the dataset. FEL2 was disrupted by injecting FEL2 with another contrary flow (loops), which can be called exceptions due to their contrary flow direction. Subsequently, the outcomes were compared in order to test and observe the performance of the proposed representation with the other related baselines. The validation highlighted the significance of the proposed representation.
Setup and discussion when disrupting FEL2
FEL2 did not contain any kind of loops. In order to validate the proposed
representation, the performance of the proposed representation was tested and observed
by disrupting FEL2 when gradually appending 5% of diverse kinds of exceptions
in a round. New traces that include exceptions were appended in the round until 30% of
exceptions was appended. The appended traces were based on the percentages of the total
number of the traces in FEL2. The comparison is built based on the property
that the perfect result of Eq. (28) is zero. In addition,
for the purpose of generalising the selected exceptions, the tasks to be included in
these exceptions were carefully selected. Since middle tasks highly dominate the large
part of the dependencies, they were nominated to be included in the appended exceptions.
The selected tasks were for LOR (

Results of Eq. (28) using Weijters and gradually appending mix exceptions.

Results of Eq. (28) using η and gradually appending mix exceptions.

Results of Eq. (28) using
Figures 7, 8, and 9 describe the results of the Weijters,
η and
Data mining and process mining share many common aspects, especially in terms of representing and showing the extracted knowledge in the data flow relations and dependencies between a pair of tasks. This combination motivated us to cover the gap in the representation of data flow relations and dependencies. We identified a lack of a proper representation that reflects the actual flow relations and dependencies. Our comprehensive representation is achieved by generating the proposed method, which is sequentially executed until the targeted aims. The proposed method is supported by other concepts, namely, log-based ordering relations [30] and other dependency equations [12,37].
The main contribution in this paper is a new representation of the neglected flow relations and proper dependency equation, exploiting and benefiting from both the data mining and process mining perspectives. One example in process mining is the heuristic-based algorithms. The heuristic-based algorithms consider only the 1-1 flow relation between a pair of tasks, although they include other important parts, namely, the contrary flow direction. Additionally, they rely on the frequency, not the confidence, when computing the dependency. The ignorance of the other flow relations and confidences could cause a misleading or incomplete picture. In data mining, we have η dependency as an example that provides a good explanation for the flow between two tasks by including the one-directional confidence. However, η includes only one-directional flow, disregarding the opposite direction. It was also formulated improperly. Therefore, the proposed representation provides the comprehensive flow relations, and increases the trust and precision of the dependency outcomes. Since extracting and filtering FEL from various data sources (e.g., web logs and user logs) can be applied, the proposed data flow and dependency can be reflected in the service dependency of web context.
In regard to the evaluation and validation, the proposed contributions facilitated and encouraged the introduction of novel evaluation arrangements that manage and control the evaluation and experiment, since the evaluation in process mining is a controversial issue. The experimental evaluation used dependency measures, whereas the baselines of the dependency equation were Weijters and η equations. The measure and baselines were applied to the data of the Teleclaim process, which is commonly used in process mining. The dependency with the help of stable, unique and sequential stages provided us with an equality assessment between the in-flows and out-flows in the task. Hence, the new representation was evaluated based on the distance of the average of the dependency differences between the in-flows and out-flows from zero. The experiments on the data provided us with promising results, and demonstrated that the proposed method obtained more precise results and outperformed other representations.