
Abstract
In many social networks, people interact based on their relationship network. Community detection algorithms are then useful to reveal the sub-structures of a network. Identifying these users’ communities can help us assist their life-cycle. However, in certain kinds of online communities such as question-and-answer (Q&A) sites or forums, people interact based on common topics of interest, rather than an explicit relationship network. Therefore, many traditional community detection techniques do not apply directly. Discovering those topics of interest is critical to identify users’ communities. Besides, users’ activities on certain topics of interest are evolving with time and it is therefore very important to extract their temporal dynamics.
In this paper, we first propose Topic Trees Distributions (TTD), an efficient approach for extracting topics from Q&A sites in order to detect overlapping communities. We then extend TTD to propose Temporal Topic Expertise Activity (TTEA), a graphical probabilistic model to extract both topics-based expertise and temporal information. We evaluated and compared our models with state-of-the-art approaches on a dataset extracted from the popular Q&A site StackOverflow.
Keywords
Introduction
Question-and-answer sites (Q&A sites) initially aimed at enabling users to ask questions to a community of experts. Since these user-generated contents can be later viewed and searched again, people with the same or similar questions can find answers by browsing or searching the questions that were already answered. On one hand, Q&A sites have become huge repositories of question-answer content which support highly valuable and highly reusable knowledge [3]. On the other hand, Q&A sites also contain a large number of users who keep contributing questions and answers. And most of them are more likely to ask questions on topics they are interested in and answer questions in topics they are experts of.
Therefore, we believe that there are two main resources in Q&A sites: the users’ network and the Q&A content. From a user’s perspective, detecting communities of interests is useful to reveal the sub-structures of the user network and identify relevant peers. From the perspective of content, extracting topics is required to uncover the key subjects from massive content.
So we are interested in the following three research questions: (1) How can we identify the common topics binding users together? (2) How can we detect topics-based overlapping communities? (3) How can we extract topics-based expertise and temporal dynamics?
Detecting this information can contribute to the question routing problem [17,36], which is very important in Q&A sites optimization problems, for example, to recommend a question to a user who is active in the corresponding topic and has the expertise needed to answer it. It can also contribute to the community management, for instance by allowing to track the interest evolution or community evolution in Q&A sites.
Different ways to estimate probabilities with results of Gibbs sampling.
Q&A sites support social networking, however, unlike networks such as Facebook, there are no explicit relationship-based links between their users. In fact, Q&A sites capture the connection of users by question-answer links or co-answer links. The users are neither mainly concerned with nor aware of the links existing between them. The social network is said to be implicit. As a result, compared with other classical social networks, Q&A networks contain more star-shape structures (many users linked to a central user) than triangle-shape structures (users linked to each other). As a result, many community detection algorithms developed to discover sub-structures in social networks do not apply to Q&A implicit networks. To detect communities of interest in Q&A sites, we consider topic based rather than graph structure based algorithms. Moreover, people may have multiple interests, i.e., they may belong to several communities of interests. It is therefore important to be able to detect overlapping communities.
We first tried to adapt a document clustering algorithm to the user clustering problem, similarly to [18]: we applied the classic LDA (Latent Dirichlet Allocation) [4] algorithm to assign each user into several topic clusters, by replacing in this algorithm the documents by the users, and the document words by the tags acquired by users. The results were encouraging. However, we found three limitations. The first one is that the complexity of this probabilistic model was prohibitive. When analyzing the LDA model, we found that it largely exploits tags’ co-occurrence. This inspired us to design a much simpler and faster algorithm to detect topics. Then, based on the detected topics, we were able to identify the users’ interesting topics.
The second limitation of original LDA based models is that they are not enough to extract temporal and expertise information. In previous works, [32] only considered modeling the expertise, and [12] only considered modeling the topic trends at a group level. Compared with them, we jointly model both expertise and dynamics and we model topic trends also at the level of the users. This provides more insight on the changes of interest of each user.
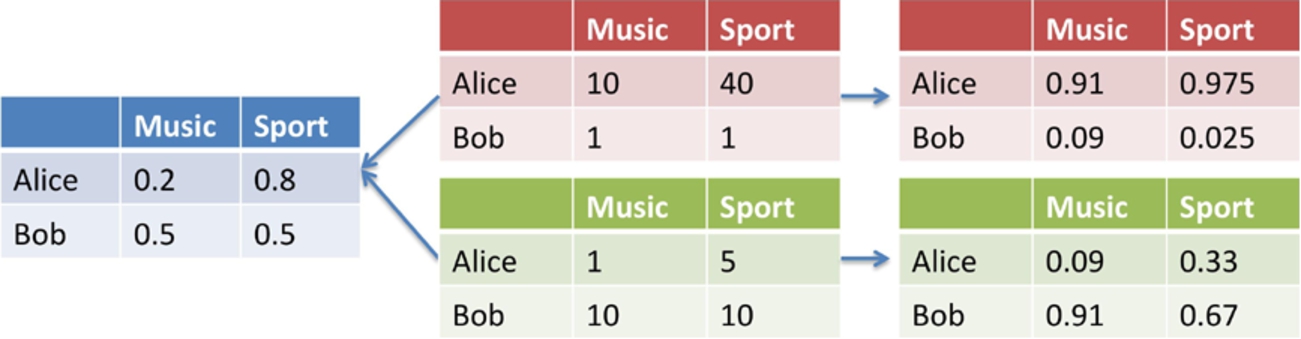
The third limitation of LDA based models is as follows. If we use a three-layer LDA model (user-topic-word), this generates two kinds of distributions (user-topic distribution and topic-word distribution) which describe to what extent a user is interested in different topics and to what extent a keyword or a tag is related to a topic. However, as shown in Fig. 1 the same user-topic distribution could be generated by different training data (assume that the hidden variable topic is already generated by Gibbs sampling [9]), which means that the user-topic distribution is incomparable among users. For the upper one, Alice is more active in topic music, but for the lower one, Bob is more active. In order to avoid such problem, we proposed a post processing step for the original LDA model to extract such difference. Experiments show that this post-processing can improve both our model and other LDA variants models’ performances when it comes to the task of routing questions in a Q&A sites.
So the main contributions of this paper are: (1) A simple and fast topic detection method to extract topics based on question tags. (2) A simple and fast overlapping community detection method based on a topic model. (3) A joint model to capture topics, expertises, activities and trends. Traditionally, these information have been modeled separately. (4) A post processing step to compare the user-topic distributions generated by LDA based models.
The rest of the paper is organized as follows. Section 2 is a synthesis of state-of-the-art approaches of community detection. In Section 3 we present how we apply the original LDA model to detect overlapping communities. We describe our proposed TTD model in Section 4 and TTD experiments and evaluation in Section 5. We describe our proposed TTEA model in Section 4, and TTEA experiments and evaluation in Section 7. Finally, we conclude and point out potential future works in Section 8.
Related work on community detection
We distinguish between three kinds of approaches for community detection, depending on their characteristics: Graph-based methods are based on network structure; Clustering methods are based on the similarity of user profiles; LDA-based methods use probabilistic graphical model.
Graph-based methods
A first and direct solution is to extract an implicit network structure (such as a question-answer network, a co-answer network, etc.) from interaction traces to come down to a traditional community detection problem on social networks. Since intuitively, users are grouped by interests, and most of their interactions are based on shared interests, it is reasonable to induce a network structure from these interactions and then run community detection algorithms on the network. Many classical algorithms have been developed such as [2,29]. There are many constraints when adopting these methods. First, they do not take into account node attributes nor link attributes. Take co-answer network as an example, where nodes represent users and links represent users answering the same questions. In case two users are connected, these methods can only detect that they have answered the same questions many times. They cannot indicate whether they have answered questions on the same topic or on different topics. Second, some of the works adopting this approach cannot detect overlapping communities, while other works such as [29] address this problem.
Clustering methods
Community detection can also be envisioned as a clustering problem. By computing similarities between user profiles, one can detect groups according to clustering results. The choice of the similarity metrics is quite important and largely influences clustering results. To find similar interests, the distance between user’s interests must be defined and this definition has a strong influence on the clustering results. For instance, we can consider a bag of tags with their weights to represent an interest, then compute the weighted tag distance to define the interest distance between two users. Clustering methods, such as [8,30], group users according to their features. They do not take the network structure into consideration. Moreover, some clustering algorithms normally output hard-partition communities, where a user is assigned to a single interest group. However, in the scenario we are interested in, a user often has more than one interest and should be assigned to more than one group simultaneously. This is a constraint for those hard-partition algorithms. [7] use spectral clustering to detect topics from the graph of tag co-occurrence. Compared to it, our approach is more efficient since we only run spectral clustering on a co-occurrence graph of selected tags (only 10% of all the tags). Besides, [7] does not give any details on how to compute the topic tag distribution and user topic distribution, while we do.
LDA-based models
A third approach consists in using a probabilistic graphical model for both the user profiles and the network structure to solve community detection problem. For example, [34] transform links to binary node attributes, then use a LDA-based model to detect communities. [25] use a LDA-based method on social tagging systems where users label resources with tags, but they do not consider the problem of overlapping community detection. [26] use an extended LDA-based model to analyze academic social networks in order to find expert authors, papers and conferences. A problem of these LDA-based models is that they normally assume soft-membership [31] which means that a user cannot have high probabilities to belong to several communities simultaneously. That is to say that the more communities a user belongs to, the less it belongs to each community (simply because probabilities have to sum to one). Moreover, [20] and [15] also use statistical model to detect overlapping communities. The difference is that LDA-based models normally integrate topic detection which can be used to interpret detected communities while the two above cited methods only detect overlapping communities without any topic information on each detected communities.
Short summary
Table 1 summarizes the main features of the three approaches. Graph-based approaches normally use link information while ignoring node attributes. Some of them cannot detect overlapping communities or provide membership ratios which are weights denoting to what extent a user belongs to a community. Most of these methods cannot identify the topic in each detected community. Clustering approaches use node attributes to group similar users. Some of their results are hard-partition communities, with no overlapping and no membership information. LDA-based models overcome the shortcomings of graph-based and clustering approaches, using both node attributes and link information. Besides, LDA-based models normally combine community detection with topic detection, which could be used to interpret detected communities. Our proposed method is similar to LDA-based methods, in that it also enables to detect overlapping communities and identify the topics at the same time. It differs from LDA-based methods in that it enables to consider a user having high probabilities to belong to several communities simultaneously while these methods normally assume soft-membership [31]. In addition, our proposed method is much simpler and faster than LDA-based methods while preserving the quality of the detection.
Comparison of our method to state-of-the-art approaches
Comparison of our method to state-of-the-art approaches
Topic based temporal modeling
There is an increasing research interest for the temporal modeling of topics and several methods have been proposed. [27] jointly model topics and time label by assuming that words and time stamps are both generated by latent topics. [33] proposed a PLSA-based [11] model to separate temporary topics from stable topics. [12] jointly model latent user groups and temporal topics to detect group-level temporal topics.
Related work on expert detection
Research works related on expert identification in Q&A sites are mainly based on link analysis and topic modeling techniques. The general purpose of expert detection is normally to support the question routing task which essentially consists in finding the most relevant experts to answer a newly submitted question. [35] propose a modified PageRank algorithm to rank users in a specific domain. Besides, they propose the Z-score measure to evaluate expertise. Compared with simple statistical measures, for instance the number of best answers provided by a user, the Z-score measure uses both the number of questions and the number of answers posted by a user. Similarly, [14] use the HITS algorithm to discover authorities users. [5] propose a model based on Indegree, which is the number of best answers provided by users, to discovery experts. [17] propose a probability model to estimate users’ expertise for the question routing task.
Rather than detecting global experts, another kind of works uses topic models to detect experts at the topic level. [10] proposed a generative model by leveraging the category information of questions on certain Q&A sites. [32] jointly model topics and expertise by integrating a Gaussian Mixture Model to capture vote information. [7] propose a spectral clustering based topic model. [19] propose a generative model to model the triple role of users (as askers, answerers, and voters). Our contribution extends this kind of works.
There are also works applying machine learning techniques to perform expert detection. [13] combine topic models outputs and statistical features and apply a pair-wised learning to obtain a ranked model and recommend expert users for a question. [23] apply machine learning algorithms to identify experts from their early behavior. [3] perform an in-depth study of StackOverflow1
Compared with these latest works, our model captures both topics and expertise, and temporal modeling. It can detect topic dynamics both at the global level and at the individual user level. Besides, we propose a post-process method to solve a common problem in LDA based models.
Principle of our approach
In Natural Language Processing (NLP), Latent Dirichlet Allocation (LDA) [4] is a classical document clustering method. It is used to detect latent topics from documents by constructing a document-topic-word three layer probabilistic graphical model. In this three layer model, document and word can be observed from dataset, while topic is a hidden layer, which could be estimated by the observed data.
In StackOverflow, a user submits a question, then assigns
Similarly to [18], we applied the classic LDA method to construct a users-topics-tags model to detect latent topics of interest from the tags acquired by users and then cluster users into different topics. The output of the model consists in two probability distributions: (1) A User-Topic distribution to describe to what extent a user is interested in different topics. (2) A Topic-Tag distribution to describe to what extent a topic is related to different tags.
The formalization of this model is given by equation (1):
The plate notation of this model is presented in Fig. 2.
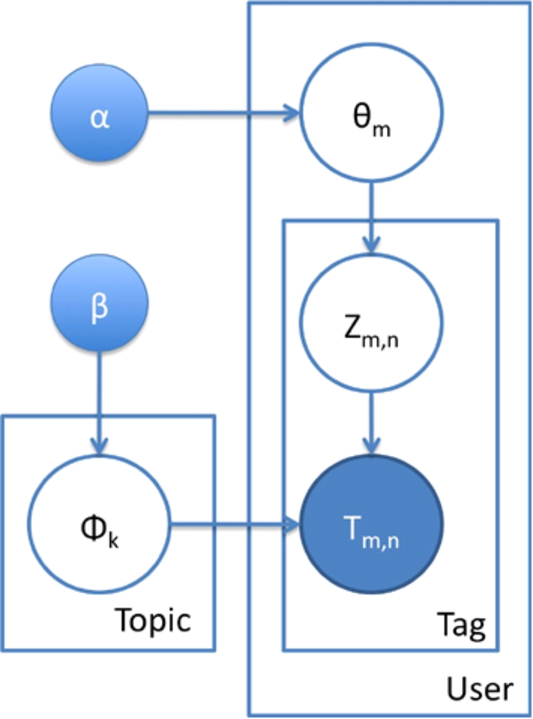
User–Topic–Tag (LDA) model.
The dependencies among the many variables can be captured by the direction of line. The boxes represent replicated variables, which are users, interests and tags. The outer boxes represent users, while the inner boxes represent the repeated choice of topics and tags for a user. The parameters of this model are explained in Table 2. M and V are given while K, α and β can be chosen. T is observed in users’ tag lists. Other variables are latent variables which have to be estimated.
Model parameters
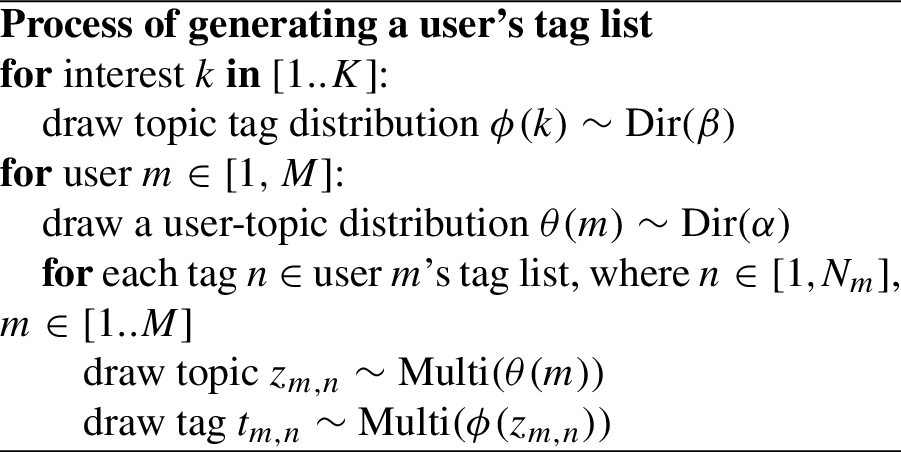
The intuition behind this model is that users choose their topics and topics generate tags. The generative process can be summarized as follows:
We use the collapsed Gibbs sampling method [9] to sample the hidden variable z, then θ and ϕ can both be estimated. The inference process is as follows. We iteratively sample the topic indicator
Then with a Gibbs sampling, we can estimate θ and ϕ by equations (3) and (4):
We run the above described model on a dataset from the popular Q&A site StackOverflow, each user being represented by her tag list as explained before. We just illustrate some of the results to show the effectiveness of this model.
Top 10 related tags for detected topics of interest
Top 10 related tags for detected topics of interest
The first result is the probability for each tag to belong to each topic. This is shown in Table 3. The second result is the probability for a user to belong to different topics of interest. This is shown in Table 4.
Detected topics of interest
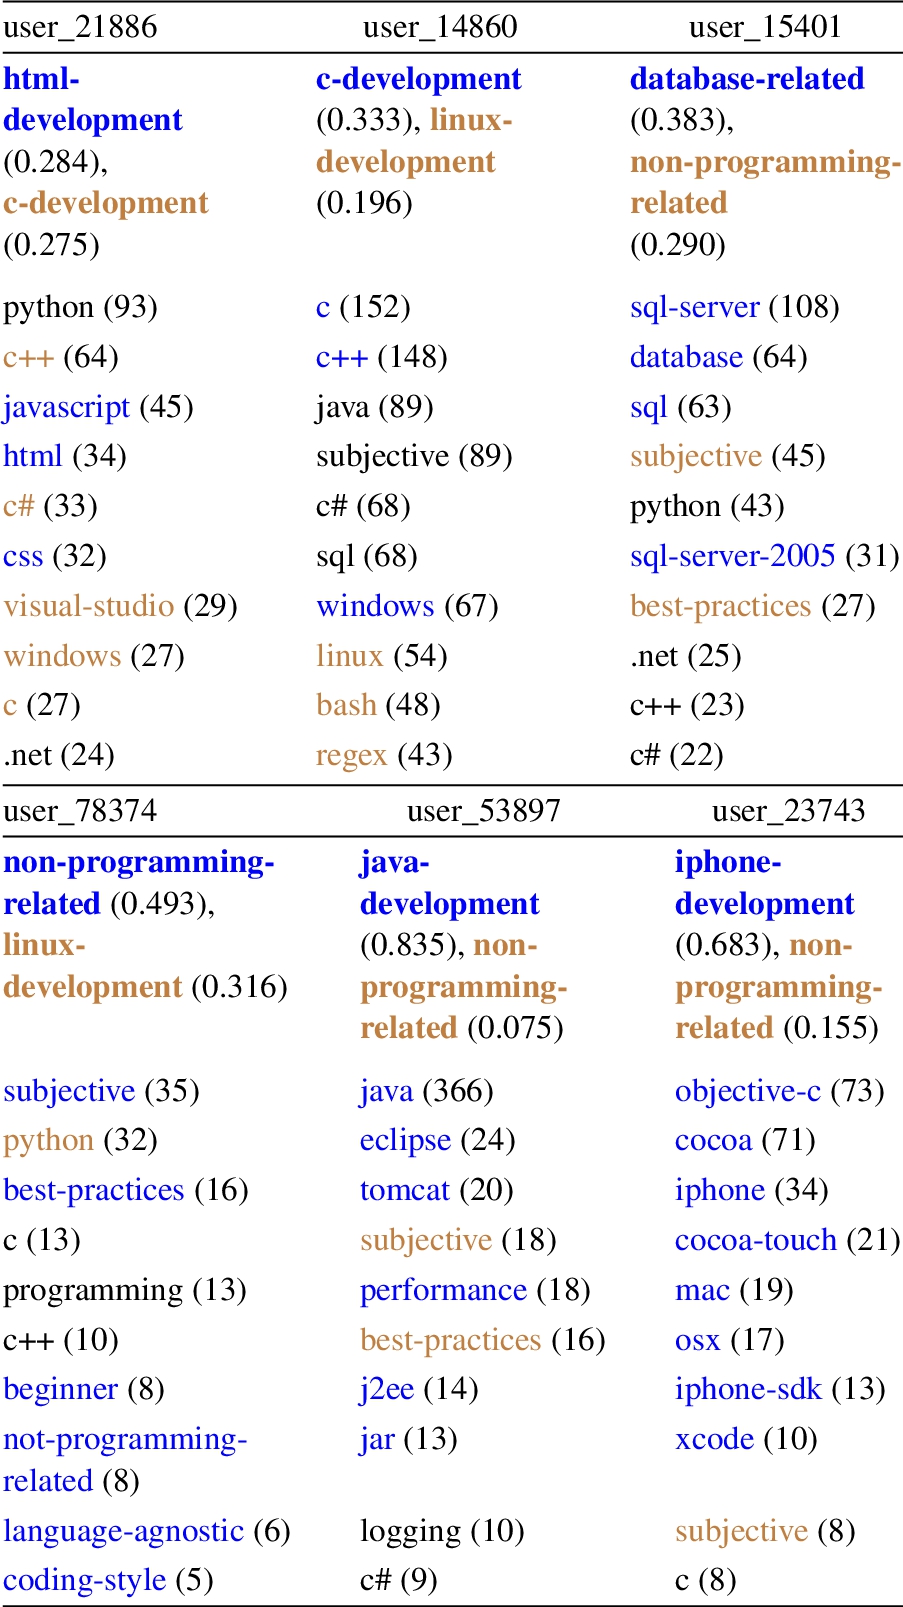
Table 3 shows eight detected topics of interest, one column for one topic, and ten rows for the top 10 tags for each topic, sorted by descending weights (a tag’s weight is the probability of the tag to belong to the topic). This table shows that each topic has a clear and focused interest. For example, topic 1 has c-development related tags, topic 2 has java-development related tags, topic 3 has c#-development related tags, topic 4 has html-development related tags, topic 5 has iphone-development related tags, topic 6 has database related tags, topic 7 has linux-development related tags, topic 8 has non-programming related tags. Moreover, weights reflect the relevance of tags to each topic. For example, topic 5 is concerned with iphone-development, its top 3 tags are ‘iphone’, ‘objective-c’ and ‘cocoa’ which are very relevant to it.
Table 4 shows six randomly chosen users and their top 10 tags. The first row contains user ids, the second row contains their detected topics of interest with their probability. The following ten rows show the top 10 tags for each user. We replaced topic ids with topic names which we have assigned to them according to their associated tags.
The above experiments show that, by applying topic models on Q&A website, we are able to detect overlapping communities, and the detected topics are useful to explain each corresponding community. In our work, we directly use each topic to represent a community.
However, we found that there are three limitations when applying LDA models to our task. The first one is a lack of efficiency: the complexity of the probabilistic model was prohibitive. The second limitation is that the original LDA model does not enable to extract temporal and expertise information. The third limitation is that the detected probability distributions cannot be compared with each other. Therefore, we extended our work in two directions. First, we developed a simpler method to detect topics and overlapping communities to solve the first problem: the TTD method is presented in Section 4. Second, we propose a more complex model to extract more information from user generated content to answer the two other limitations: the TTEA method is presented in Section 6.
Topic trees distributions (TTD)
Problem definition
In StackOverflow, a user submits a question, then assigns

Example of computing a first-tag distribution.
When sorting the tags of a question by their global frequency, we found that normally the first tag of a question is much more general and indicates the domain of the question. For example, a question tagged with {c#, iostream, fstream} is related to c#; a question tagged with {html, css, height} is related to html. However, there are also some questions which have less tags and, in this case, the tags are less popular, like a question tagged with {ant} or a question tagged with {qt, boost}. For these questions, the main domain is implicit. Our experiment dataset shows that nearly 12% of the questions only have one tag, and nearly
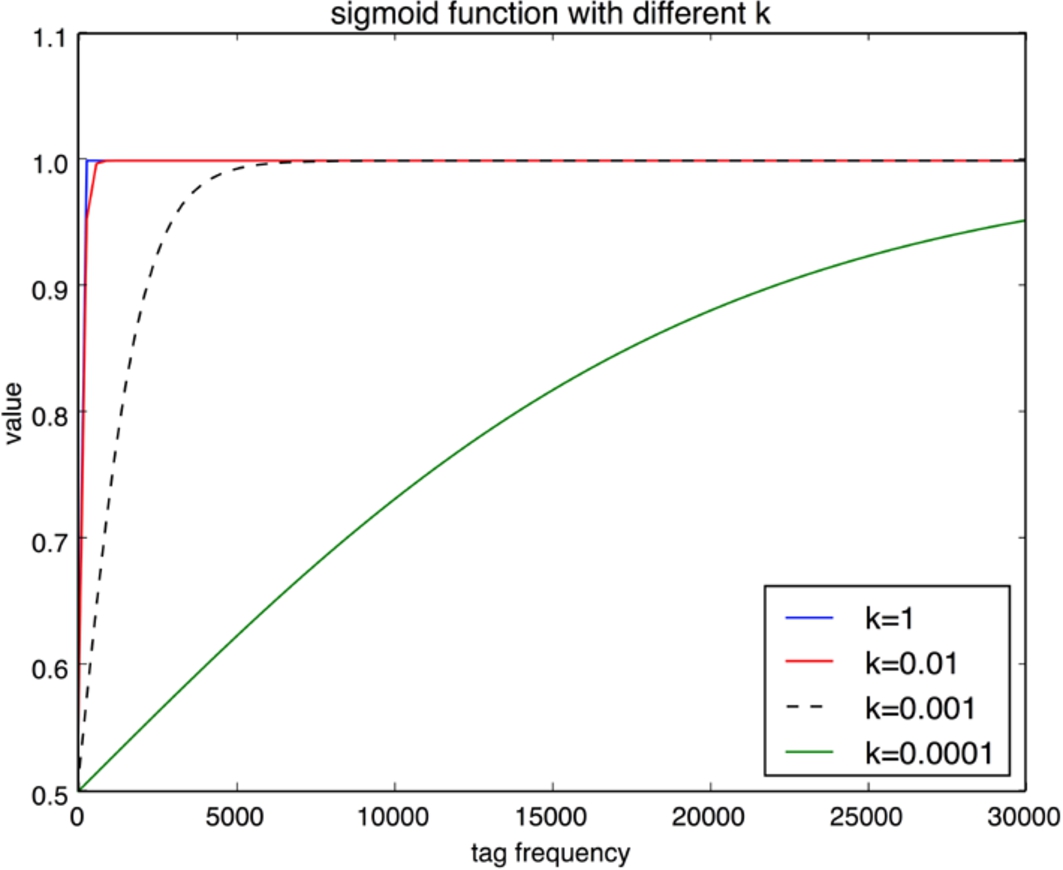
Shape of function
For example, if the first-tag frequency map for css is {html:10, jquery:2}, then, when normalizing first-tag html,
The second step of our approach consists in choosing a first-tag to enrich each question. Given a question’s tag list, we fetch the top 5 first-tags (with the highest probabilities). Then we accumulate the corresponding probabilities with a discount taking into account the position of the tag in the tag list associated to the question, as shown in equation (7):
Then we consider the first-tag with the highest probability as the enriching first-tag. If this first-tag already exists in the original tag list, we simply skip the insertion, or else we insert it at the first position of the question’s tag list. We processed 242,552 tag lists from the StackOverFlow Q&A site, and our method enriched 33,622 of them (13.5%). Table 5 presents the results of the enrichment of 8 tag lists (enriched tags are in bold).
Original and enriched tag lists

Example of a tag tree.
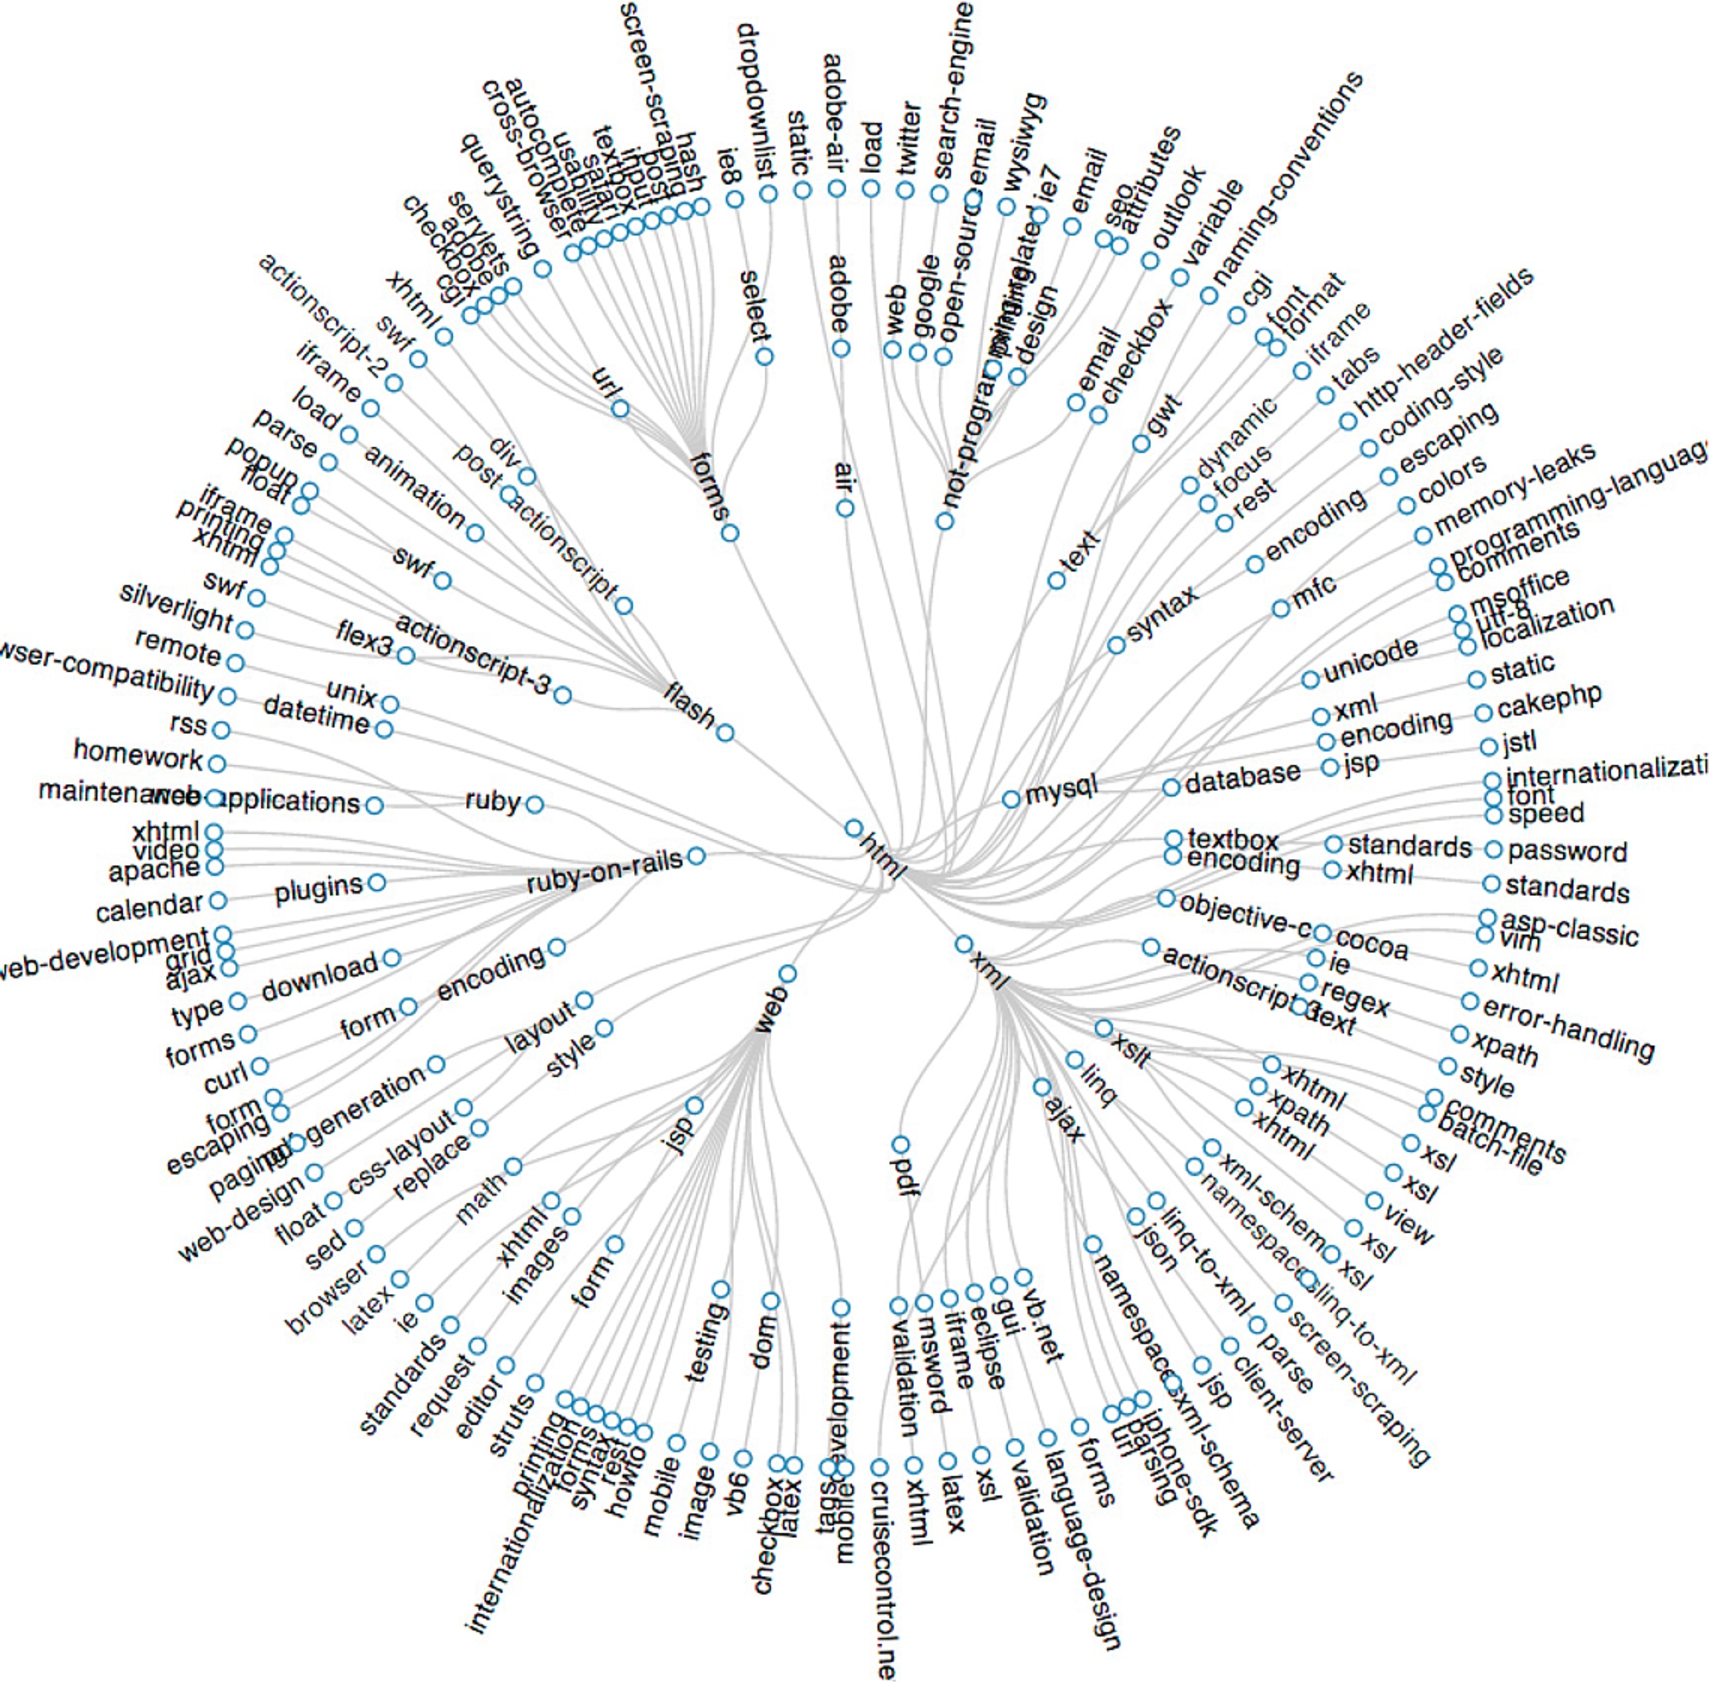
html’s tag tree.
From the observation of our dataset, we confirmed the natural intuition that high frequency tags are more generic and low frequency tags are more specific, and most of the low frequency tags are related to a more generic tag. A similar observation was also found in [21]. Besides, [32] shows that tag frequency in Q&A sites also satisfies a power law distribution [1]. For example, for a question tagged with {c++, iostream, fstream} (with tags sorted according to their frequencies), we could find that it was related to c++ and to the iostream topic of c++, and more specifically, that it focused on fstream. This inspired us to build a tag tree to represent it and compute the probability for a tag to be related to a topic. Figure 5 illustrates the process of building a tag tree. Figure 6 illustrates an example of html’s tree. Our topic extraction method is described in Algorithm 1. In the build trees process (lines 3–6), we build a tag tree according to the position of tags in a question, and record the occurrence of each node. For example, let us consider again the tag lists of questions Q1, Q2, Q3 in Fig. 3. Based on them, we construct two trees. The root of the first tree is html, the occurrence of this node is 2, it has only one child css, which has 2 occurrences, and this node has two children, layout and height, and each one occurs 1 time. The root of the second tree is c# with 1 occurrence. By processing all the tag lists, many trees are generated. We then construct an affinity matrix of the root nodes (lines 7–9). Since we applied our first-tag enrichment method, the number of root tags is not very large. The similarity of two root nodes is computed according to equation (8):

Topic Extraction
Top tags and their probabilities for some topics computed with TTD
We used the spectral clustering implementation of scikit-learn toolkit.2
Scikit-learn toolkit:
In StackOverflow, users answering a question can be considered as interested in the topics denoted by the tags of the question. As a result, a starting point for user interest detection is to model the initial situation as follows: a user answering a question acquires the tags attached to this question and gradually, each user acquires a list of tags. So we represent a user by a tag list:
Then we identify users’ communities of interests based on the user-topic distribution: a user having a high probability for a topic should be a member of the community represented by this topic.
TTD experiments and evaluation on StackOverflow data
We conducted experiments on the dataset of activities on StackOverflow between 2008 and 2009, which is available online,3
We use the Perplexity [4] metric to measure the topic extraction performance. It is a common metric in the topic modeling area, measuring how well the words in test documents are represented by the word distribution of extracted topics. The intuition is that a better model will tend to assign higher probabilities to the test dataset, corresponding to a lower perplexity value. We split the dataset (question tag lists), 80% as training set, 20% as testing set. We run LDA and our method on the training set to get the topic distribution. Then for a test set of M questions’ tag lists (
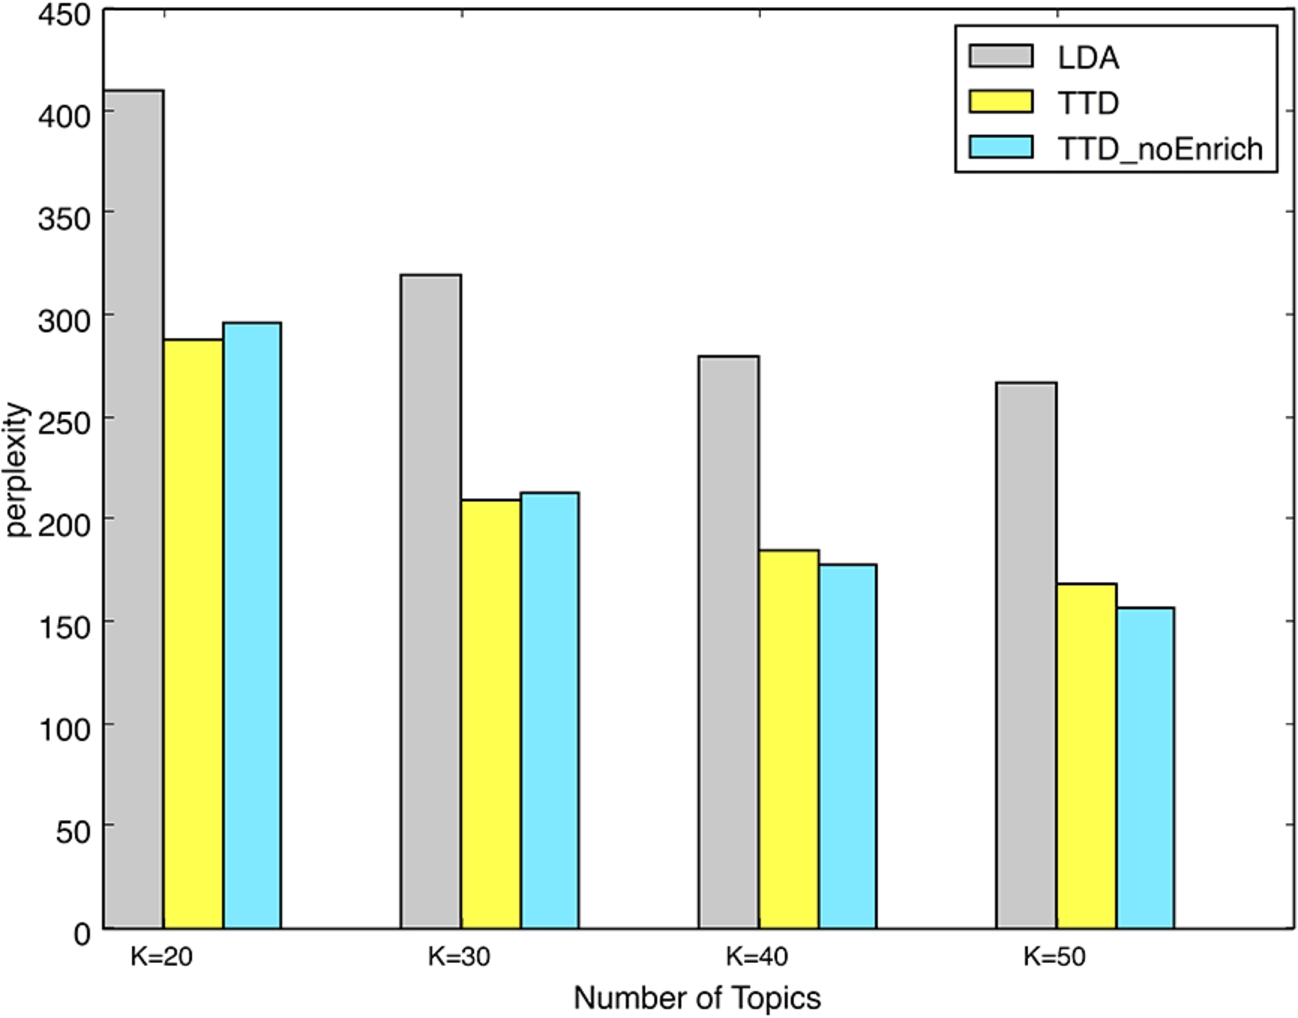
Comparison of topic extraction performances.
In our model,
Top tags for java’s sub-topic html and mysql, denoted by java_html, and java_mysql respectively, compared with topics html and mysql
Traditional community detection algorithms are based on a network structure. As there is no explicit network in our dataset and in order to compare our work with other approaches on the same dataset, we extracted a network of interactions between users: a co-answer network inspired by the notion of co-view network introduced in [8]. The idea behind it is that if two users answer the same question they share some of their interests. So, the co-answer network, to some extent, can reflect the common interests between users. We filtered the co-answer links with a rule stating that a link is kept if two users answer the same questions more than 10 times (we varied this parameter by 15, 20, 25, the results are similar, so here we report results with 10). Based on the noise-less dataset obtained, we implemented three well known community detection methods in order to compare our approach with them. In order to evaluate the results of overlapping community detection, for each user, a method should output SLPA [29]: An overlapping community detection method inspired by a classical Label propagation algorithm (LPA). SLPA algorithm can evaluate to which extent a user belongs to a community by the received propagated label (a ‘Post-process’ in SLPA algorithm). So, it can output more than one community label according to these frequencies. LDA: Similar to [32], we run LDA to build a user–topic–tag model on the given dataset, users are represented by their tag list. As the output contains a user–topic distribution, we just sort the distribution for each user and choose the top 3 topic labels as community label together with their probabilities. Clustering: We used the implementation of hierarchical clustering from scikit-learn toolkit.4
TTD: it is our method. We sort the results of user interest detection (Section 4.4) and choose the top 3 as community label together with their probabilities.
Comparison of the performances of the methods of user interest detection
Examples of user interests detected with TTD
We also evaluated the scalability of each method. However, as these methods are written in different programming languages, it is not fair to consider this as a precise evaluation; it is just an indication. To increase the stability of the comparison, we run experiments 10 times, and listed the average values. We used a Java implementation of LDA algorithm. All the other methods were implemented in Python. For our method, the time of topic detection was also counted in. For LDA and SLPA, we set the iteration number to 100. We run the experiments on a computer with 3 GHz Intel i7 CPU and 8 GB RAM. From the experiment, we could find that LDA, SLPA and our method are linear in terms of the number of users, see Fig. 8. The LDA algorithm is theoretically
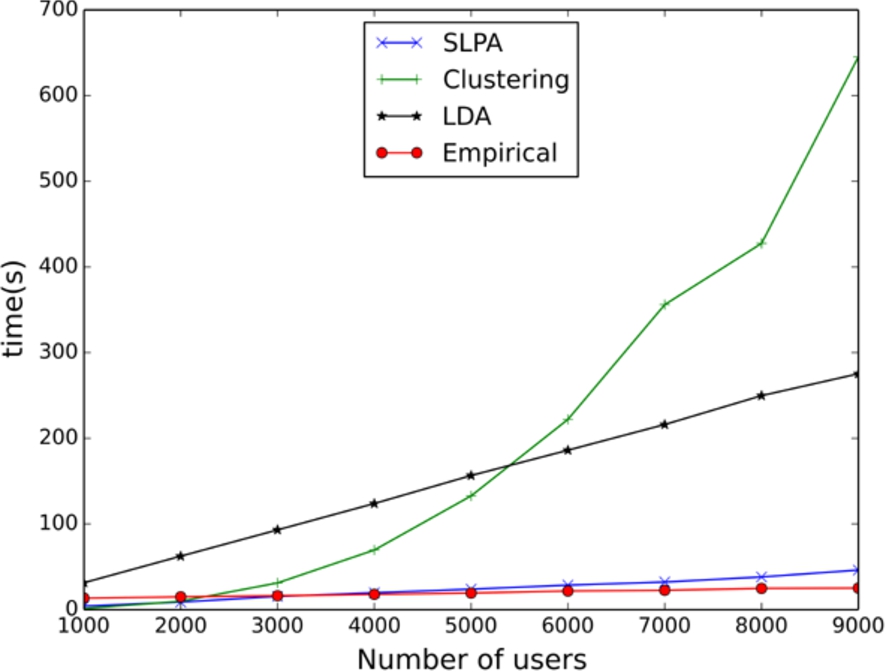
Scalability of the compared user interest detection methods.
To sum up, most community detection algorithms work well on real-life social networks which contain many triangle-shape structures. The interactions between the users in these networks are mainly based on their relationships. It is also noticeable that the relationships which a user in such network can maintain are limited and most likely restricted by the location (co-author networks in academia is also in this situation), so the overall structure of the network is flatter, scattered and with many triangle-shape structures. Comparatively, in Q&A sites, such as StackOverflow, there are no fixed relationships between users. Users interact with each other based on their own interests. And they are not aware of whom they are interacting with, so they will not maintain explicit relationships. Besides, a user can interact with any other user and mainly interacts with the “gurus” (most of questions are answered by a small group of people). So the overall structure of the network is octopus-shape [16] with less triangle-shape structures. According to [24], the average number of triangle-shape structures per user in Twitter dataset is around 35,714, while in our co-answer dataset, the number of triangle-shape structure per user is around 30 which is far less. So, graph-based community detection methods fail in such situation. The result of SLPA algorithm shows that it outputs one or two giant groups, together with many tiny groups that only contain a small number of users as depicted in Fig. 9, where each color represents a detected community. We can also see that the network contains less triangle-shape structures and a high-density core. It also indicates that the network has huge overlaps. Since clustering methods normally generate hard-partition communities, they cannot detect the overlapping communities which are typical in our case. Concerning the LDA-based methods, on one hand, in our dataset, question tag lists are quite short, and the experiment shows that our topic extraction method gives better results in this situation. On the other hand, the probabilistic graphical model requires hundreds of iterations to get stable results [9] which is more complicated and slower than our method. We also conducted similar experiments on a Flickr dataset in order to show that our method is not specific to StackOverflow. Recalling our research questions (How can we detect communities of interests in Q&A sites? How can we also identify the topics that attract them?) we believe we propose a topic detection method which is very suitable for Q&A datasets and an efficient user interest detection method to discover overlapping communities of interests.
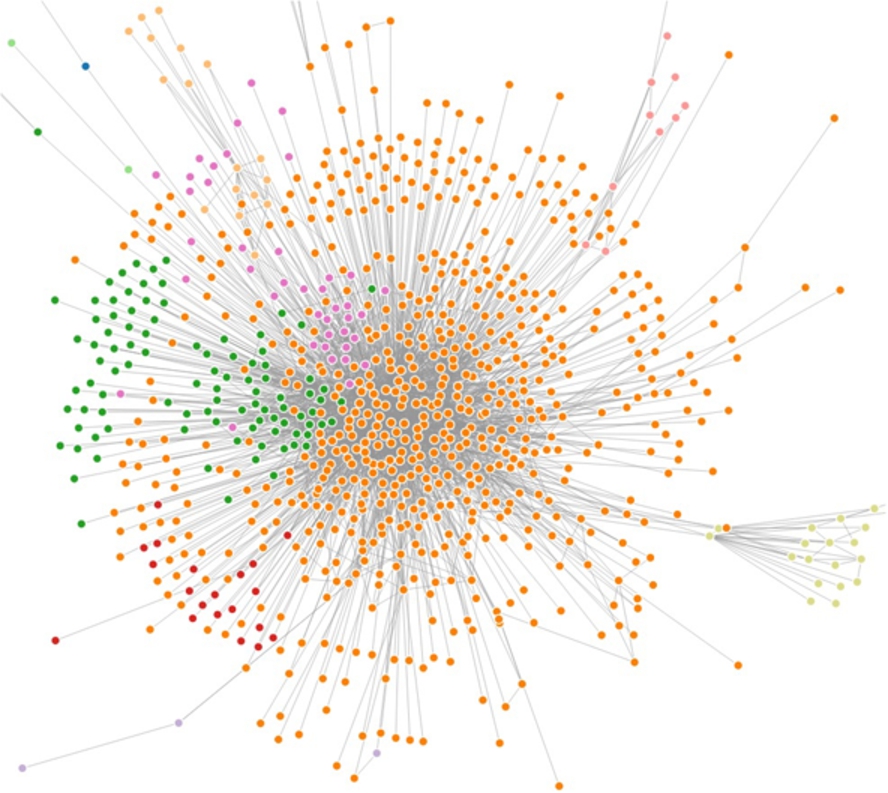
Illustration of co-answer-network by SLPA [29].
Problem definition
Let us consider StackOverflow for an example of the problem we address. In StackOverflow, as already explained, a user submits a question, then assigns between
The Temporal Topic Expertise Activity (TTEA) model we propose aims at jointly modeling topics, topic trends, user expertise, and user activities. More precisely, we aim at extracting the information listed in Table 10.
Output distributions of our model and their functionality
Output distributions of our model and their functionality
Here are the basic notions later used in the description of TTEA:
TTEA model structure
TTEA is an LDA-based model. Figure 10 represents it using the plate notation.
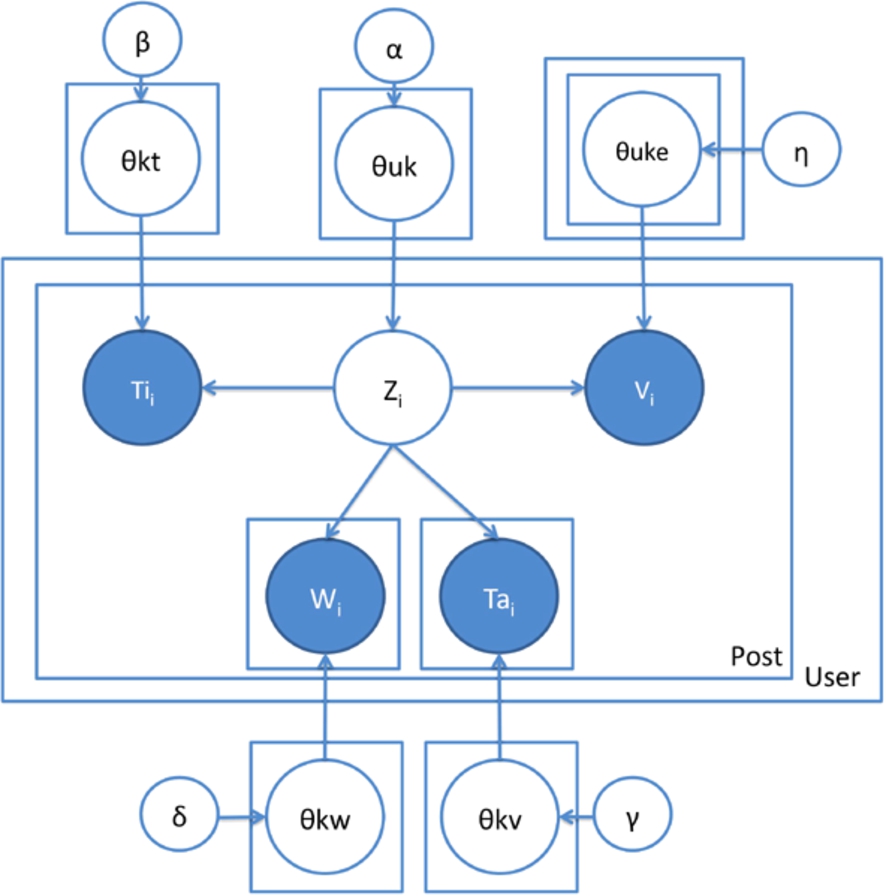
TTEA model.
Let
Contrary to [4] who applied LDA model on long documents such as news articles and assumed that each word has a latent topic, we assume in TTEA that each answer post has one topic: like in other short social media, e.g. Twitter, an answer post is normally short, each answer post is therefore suitable to be assigned with one single latent topic, and all the words in that post are considered to be generated by this topic.
For expertise modeling, we do not use votes directly because (a) the vote scores are sparse and noncontinuous, and (b) it is not reasonable to tell that a vote score 55 is better than a vote score 50 if the vote score are ranging from 0 to 3,000. Since the vote scores’ counts distribution follows a log distribution [32], we use the logarithmic value of vote score, and separate them into several expertise levels, which is one of the parameters: the expertise level.
For temporal modeling, like [12,27], we use time stamps directly. In order to model time at different levels, we simply split time stamps into different parts (month, day, and hour) and use them separately depending on the demands.
Let us consider a user u who wants to answer a question. She first selects a topic k according to her user-topic distribution
For the uth user,
draw user topic distribution
For the kth topic,
draw topic tag distribution
draw topic word distribution
draw topic time distribution
For the uth user,
for the kth topic,
draw user topic expertise distribution
For the uth user,
for the nth q&a post,
draw topic
draw time point
for the ith word,
draw word
for the jth tag,
draw tag
draw expertise level
Like [12], we use the collapsed Gibbs sampling algorithm [9] to sample the hidden variable z, based on which the unknown probabilities
The TTEA inference process is as follows. We iteratively sample the topic indicator
Then, with the result of the Gibbs sampling algorithm, we can make the following parameter estimation:
Post processing
The above model can only generate the distributions
Basic statistics on the dataset
Basic statistics on the dataset
Dataset description
We conducted experiments on a dataset from StackOverflow. This site releases its whole content every three month. For our experiments, we used the data dump from July 2008 to March 2013. Table 11 and Fig. 11 provide basic statistics on the dataset.
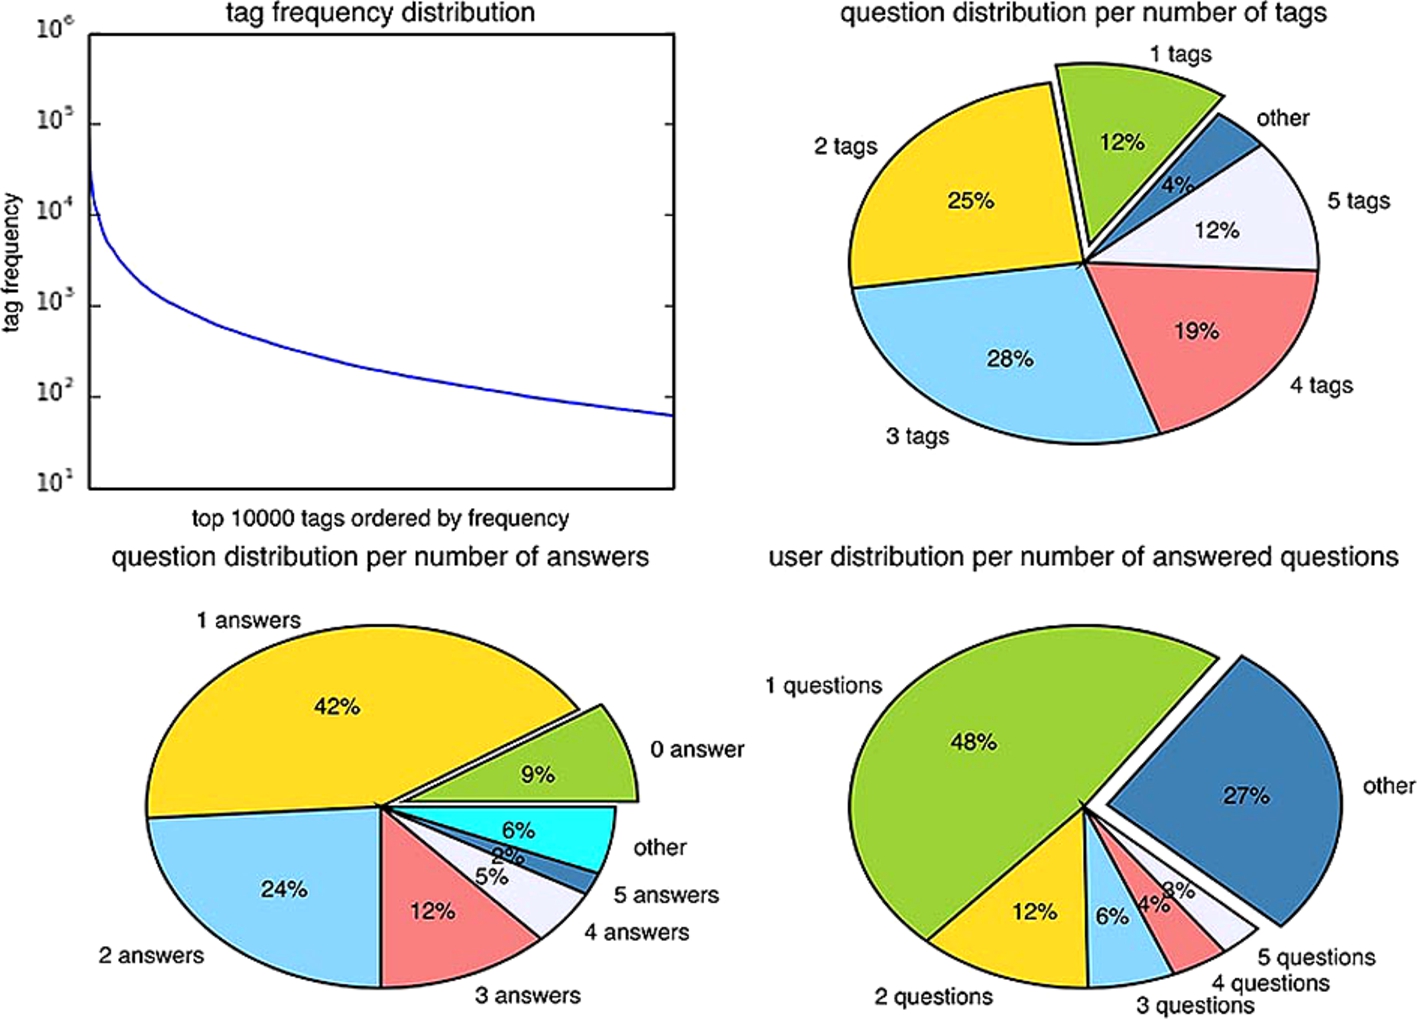
Basic perspectives of the dataset.
Top tags for different topics generated by the TTEA model
Here are some general observations about the dataset: (1) nearly half of the questions do not have accepted answers; (2) nearly half of the questions only have one answer and it maybe inadequate; (3) more than a third of the questions only have one or two tags; (4) nearly half of the users only answer one question so question routing and incentives are important problems; (5) nearly 10% percent of the questions do not have answers.
Top words for different topics generated by the TTEA model
Comparison of topic extraction performances.
Due to the large volume of the dataset over 3 years, the processing time is extremely long. To simplify the processing, for the following experiments, we randomly chose several continuous months from the dataset, with no bias to the selections.
To evaluate the effectiveness of our model, we compared it with several related works:
TTEA is our method for modeling user, topic, temporal and expertise in Q&A sites. Besides, we also model activities by adding virtual nodes. We can generate the user-topic distribution and topic-activity distribution simultaneously.
TEM: [32] proposed a model for user, topic and expertise in Q&A sites. It integrates a Gaussian Mixture Model to model expertise, which is time consuming. We simplify this process by directly modeling votes information. Besides, it does not model temporal information and user topic activities.
UQA: [10] proposed a User–Question–Answer model for modeling users and topics in Q&A sites. In certain Q&A sites, questions have category information which have proved to be very useful. The category in their model is similar to tags in TTEA model and TEM model. However we allow multiple tags for each posts while they can only set a single category.
GrosToT: [12] proposed a User–Group–Topic–Time model for modeling users, groups, topics and time in social media sites. It introduces a group level between user and topic compared with other models. It does not directly generate user-topic distribution, so we compute it with the user-group distribution and group-topic distribution.
LDA: based on [4] we apply LDA model to create a User–Topic–Post model for modeling users and topics. It can generate the user-topic distribution and topic-words distribution.
We choose the same number of topics
Performance of topic extraction
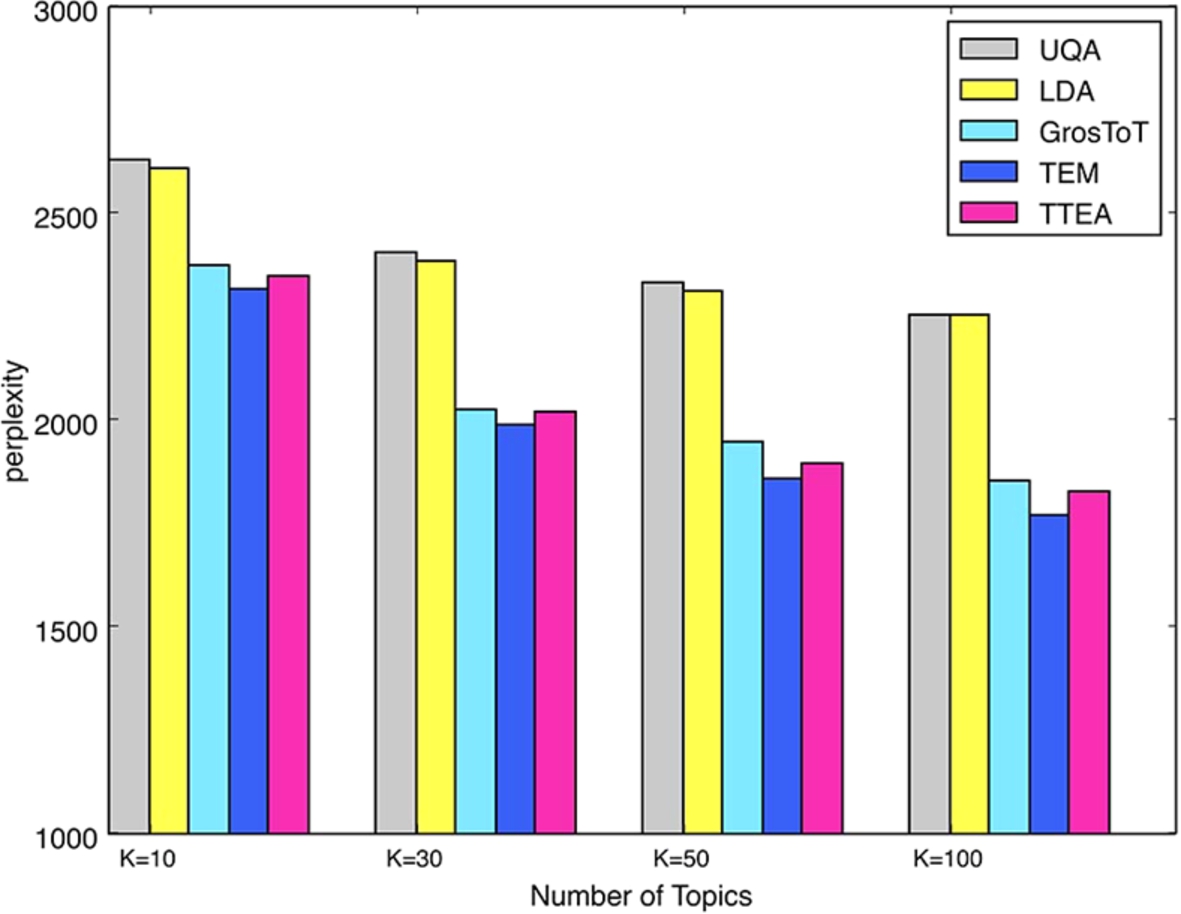
Table 12 and Table 13 show the top tags and words detected by our model. We use again the Perplexity [4] metric as a quantitative way to measure the performance of topic extraction.
We include in our training dataset all the posts in the two months from August 1st 2011 to October 1st 2011, from users having more than 80 posts (as in [32]). The resulting training dataset contains 87,516 q&a posts by 674 users. For data preprocessing, we tokenize text and removed the stop words. For the testing dataset, we use all the posts of the same set of users than the training data but this time from October 1th 2011 to January 1th 2012. So training and testing datasets have no overlap but concern the same community. We vary the number of topics: 10, 30, 50, and 100. For a testing set of M posts,
Figure 12 shows the perplexity results for our TTEA method and other state-of-the-art methods. TTEA is almost as good as TEM. But TEM integrates a Gaussian Mixture Model, which is time consuming. The training process of TEM is nearly three times longer than the other models.
[6] suggested that topic models should focus on evaluations on real-world task performance rather than on optimizing likelihood-based measures. So, in addition to the perplexity-based evaluation, we used the results of TTEA to perform real-word tasks and we evaluated them. This is described in the following subsections.
Question routing
Given a question q and a set of users U, the task is to rank all these users by their interests to answer question q. We score each user u by considering the similarity between his topics of interest and the topics of the question (
We used all the posts from July 1th 2011 to October 1th 2011 from users having more than 50 q&a posts for the training dataset. Rather than using the threshold of 80 post like in [32], we empirically set it to 50 posts to get enough users for recommendation. The resulting training set contains 297,881 posts by 2,555 users. For the testing dataset, we use all the questions posted by the same set of users as in the training set but this time from October 1th 2011 to January 1th 2012. Therefore the training and testing datasets have no overlaps. We removed testing questions which have no, or only one, answer. The resulting test dataset contains 6,044 questions, 18,077 answers and 7,888 involved users.
We also chose another period for this experiment. Besides, we vary the number of topics by 15 and 50, we vary the filter limit by 40 and 80. These experiment results are shown in Section 7.5.
In order to evaluate different models, we consider precision at position N (Precision@N or simply P@N) and recall at position N (Recal@N or simply R@N), which are widely used measures in the Information Retrieval community. Let
Question Routing experiments, Random denotes that we randomly recommend users for the test questions
Question Routing experiments, Random denotes that we randomly recommend users for the test questions
Question Routing Experiments on Another Dataset
Question Routing experiments with 15 topics
In addition, our model can capture activity and we believe this information improves question routing. The intuition is that even if a user has a high Sim score for a question, the less he is active, the less likely he is to provide an answer to that question. Therefore, we define a score SimAct to combine both topic similarity and activity level as shown in equation (29), where
Table 14 shows the results. We ran the experiments five times and listed the average scores. Our observations can be summarized as follows: (1) UQA and GROSTOT perform the better when the number of recommended users are small, and TTEA and TEM begin to outperform UQA and GROSTOT when the number of recommended users is large; (2) TTEA-ACT shows the best performances compared with the baseline competitors; (3) both TTEA-ACT and TEM-ACT perform better than the other models. The activity modeling is a generic method that could improve the performance not only of our model, but also of other models although here we only show the result for the activity model with TEM as an example; (4) even if TEM or TEM-ACT perform better than our model they remain again time consuming. Experiments show that the training process takes around
For the training dataset, we used all the posts in a three months period, from January 1th 2011 to March 31th 2011, from users having at least 50 q&a posts, rather than 80 posts like [32], in order to get enough users for recommendations. The training set contains 371,181 posts by 3,123 users. For the testing dataset, we used all the questions posted by the same set of users as in the training set, but this time from April 1th 2011 to June 31th 2011. Therefore the training and testing datasets have no overlaps. We removed questions with no or only one answer. The resulting test dataset contains 9,048 questions, 27,870 answers and 10,147 users. Table 15 shows the question routing results. We can still find that TTEA-ACT outperforms all the baseline models. Besides, Both TTEA-ACT and TEM-ACT outperform all the other models.
Table 16 shows the question routing results with a number of topics set to 15. We use the same training and testing datasets as in Section 7.4.
Table 17 shows the question routing results for the number of topics set to 50. We use the same training and testing datasets as in Section 7.4.
Question Routing experiments with 50 topics
Question Routing experiments with 50 topics
Question Routing experiments, with users having more than 40 posts
Question Routing experiments, with users having more than 80 posts
Table 18 shows the question routing results with users having more than 40 posts. We use the same period of dataset used in Section 7.4. Due to the different filter limit, the training set contains 3,457 users and 338,485 q&a posts, the testing set contains 8,579 questions, 25,500 answers and 10,135 involved users.
Table 19 shows the question routing results with users having more than 80 posts. We use the same period of dataset used in Section 7.4. Due to the different filter limit, the training set contains 1,275 users and 216,940 q&a posts, the testing set contains 2,589 questions, 8,006 answers and 4,196 involved users.
Given a question q and a set of users U, the task is now to recommend N users until one of the users gets the highest vote. The point is to rank recommended users by their expertise to answer question q. We score each user u by considering the similarity
In order to evaluate different models, we consider the percentage of successful expert recommendation until position N. A successful expert recommendation until position N means that the Nth user, recommended by an algorithm, not only answers the question but also gets the highest votes.
Expert recommendation experiments
Expert recommendation experiments
Table 20 shows the results. Random denotes that we randomly recommend users for the test questions. We ran the experiments five times and listed the average scores. We summarize our observations as follows: (1) Our TTEA shows the best performances compared with the baseline models when the number of recommended users is large. This means that when we recommend 100 users for each testing questions, in around 44% cases we have one user not only answering the question, but also winning the highest vote. (2) When the number of recommended users is large, both TEM and TTEA perform better than other models which do not model expertise, so expertise modeling can improve expert recommendation. (3) TEM uses Gaussian Mixture Model to model expertise, while we directly model votes which is less precise. Therefore, we perform badly when the number of recommended users is small. (4) After ranking users by topic similarity scores, using expertise scores to re-rank those users actually lowers the probability of the top ranked user to answer the question. The intuition behind is that a user having high expertise on a question does not necessarily have high topic similarity score with the question.
With the temporal modeling of TTEA, we can explore topic dynamics at many different levels. We present illustrative case studies to show the advantage of temporal modeling.
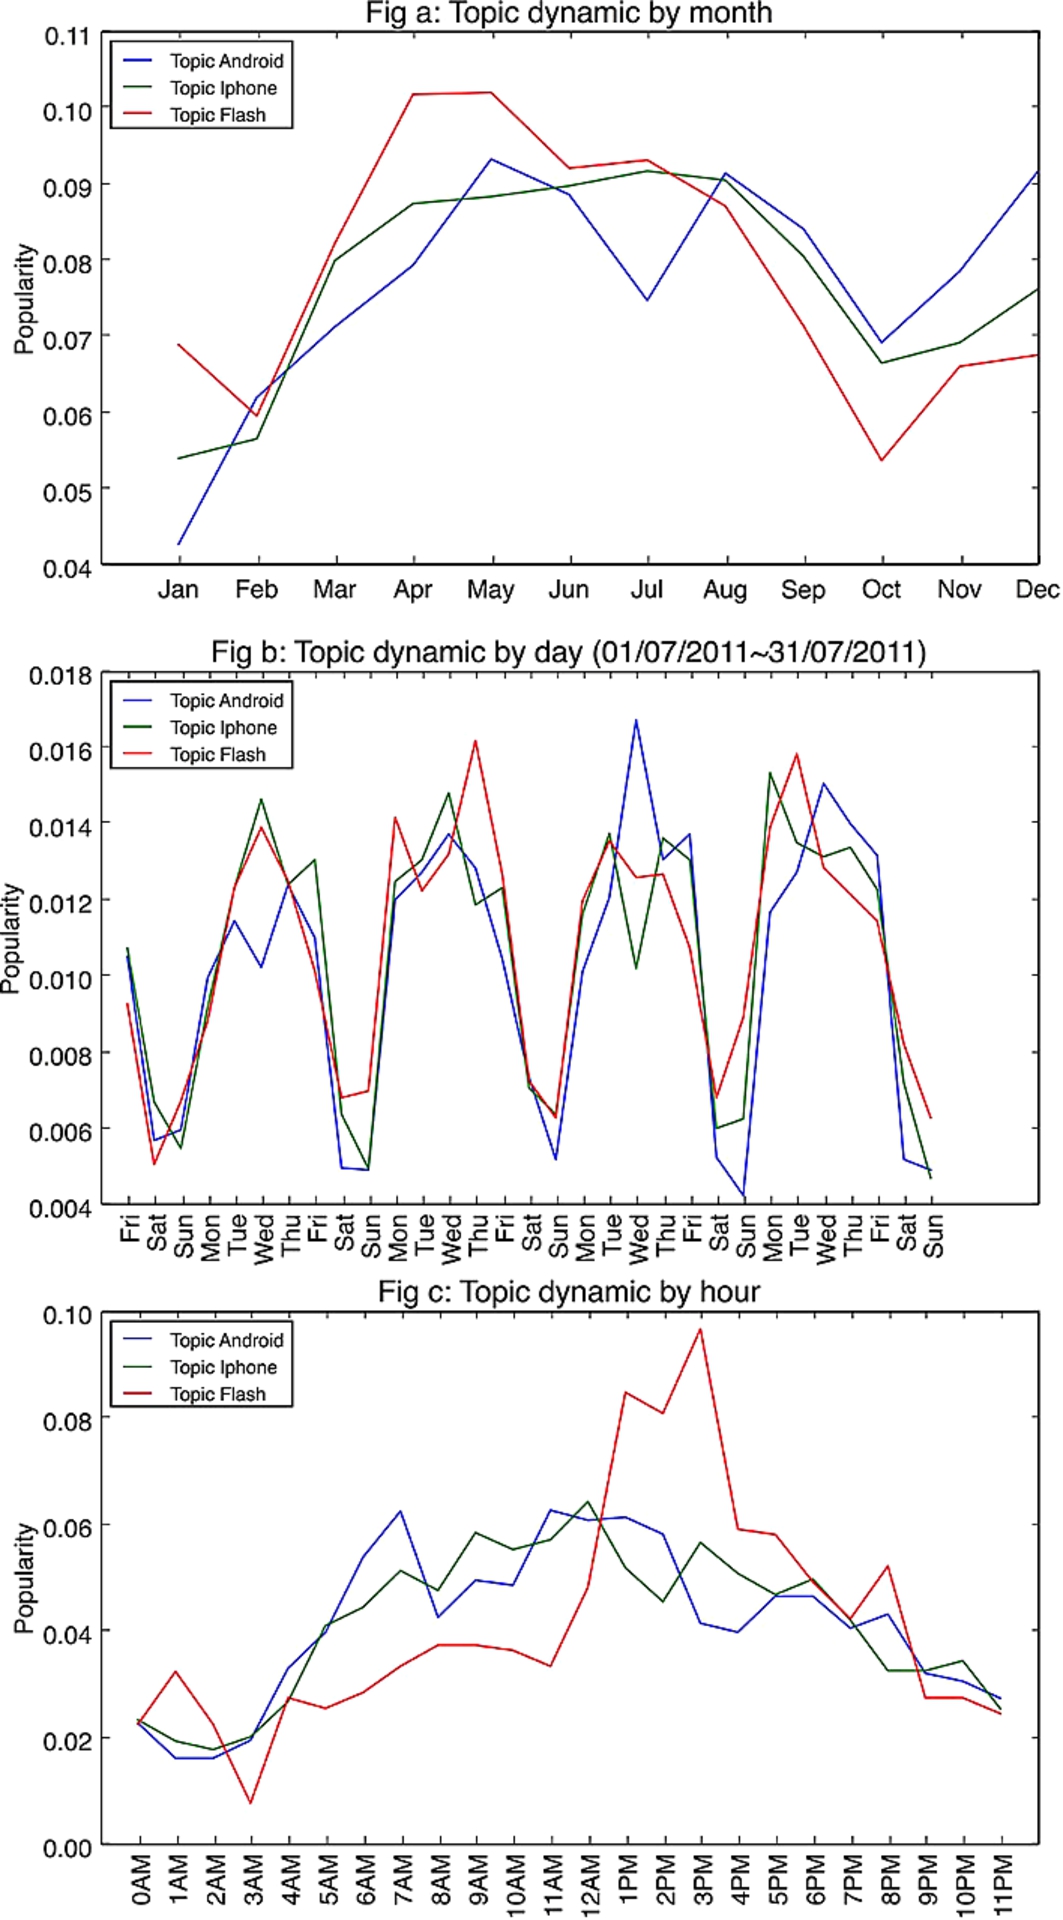
We first set the time window at the month level. Figure 13(a) shows the dynamics of Android, Iphone and Flash related topics at different months from Jan 2011 to Dec 2011. Flash related topics are more active in the early of 2011, but become less popular in the late of 2011. We then set the time window at the day level. Figure 13(b) shows the dynamics of Android, Iphone and Flash related topics from July 1st 2011 to July 31st 2011. We can see that all topics are active from Monday to Friday, and not active during the weekend. Lastly, we set the time window at the hour level. Figure 13(c) shows the dynamics of Android, Iphone and Flash related topics at different hours during a day. We can verify that both Android and Iphone related topics are more active during daytime, but Flash related topics are more active during the afternoon.
Previous figures show the topic dynamics on a global level. We now illustrate the topic dynamics at the user level. We choose top active users according to the output of
Topic dynamics.

User topic activities.
In this work, we addressed three research questions: How can we identify the common topics binding user together? How can we detect topic based overlapping communities? How can we extract topic based expertise and temporal dynamics? By applying the original LDA model on these tasks, we encountered three problems. The first one is a lack of efficiency: the complexity of the probabilistic model was prohibitive. The second problem is that the original LDA model is not enough to extract temporal and expertise information. The third one is an incomparability problem. The detected probabilities distributions cannot be compared with each other. Therefore, firstly, we proposed TTD a simpler method to detect topics and overlapping communities to solve the first problem. We conducted experiments on a dataset from the popular Q&A site StackOverflow to compare different approaches. The results indicate that for this kind of web communities our method can be a good replacement to more complicated methods for detecting overlapping communities of interests. Secondly, we proposed TTEA a more complex model to extract more information from user generated content and to fix the others problems. Our model can simultaneously uncover the topics, activities, expertise and temporal dynamics. This extracted information can enable us to improve tasks such as: question routing, expert recommendation and community life-cycle management. Again, we conducted experiments on StackOverflow dataset. We demonstrated that TTEA shows advantages in topic modeling. It also achieves good performances on question routing task and expert detection task compared with the state of the art models. We also illustrated that our model can detect user and topic temporal dynamics which could be used on user life-cycle management.
There are many future directions for this work. It is obvious that the proposed models and methods are not limited to the processing of Q&A datasets and we intend to adapt them to other kinds of social media.
Footnotes
Acknowledgements
The authors would like to thank StackOverflow for sharing their data. We thank the ANR-12-CORD-0026 Ocktopus project grant for the support of this research.