
Abstract
BACKGROUND:
The tray table in economy class air travel may cause excessive neck flexion and discomfort in passengers.
OBJECTIVE:
The purpose of this study is to examine the influence of different tray table heights on the neck posture and discomfort perception of passengers.
METHODS:
A passenger experience survey was used to determine the passengers’ view that the tray table was not high enough, and that most passengers were dissatisfied with the overall comfort evaluation of the tray table, especially passengers with obesity. Three head-neck angles and discomfort perceptions of six body parts in 58 participants were recorded by neck posture 3D scanning and perceived level of discomfort assessment, respectively.
RESULTS:
Tray tables at the original height (68 cm) caused unnatural neck posture and discomfort in participants. Raising the tray table can improve the neck posture of participants and reduce discomfort. However, raising the tray table too high will cause more shoulder discomfort in participants. Based on the results, 78 (±2) cm is suggested as the suitable thresholds range of tray tables for economy class air travel.
CONCLUSION:
The results and findings of this study could provide a theoretical base for the optimization of tray table design.
Keywords
Introduction
Most travelers fly in economy class [1]. Compared with business class and first class, economy class passengers have a smaller in-flight space, and therefore many interior design and layout indicators (e.g., seat pitch, seat width, head support, and armrest positions) affect the comfort of economy class [2–7]. Thus, it is significant to study how comfortable passengers are in economy class [8–10].
As passenger comfort research on economy class progresses, studies have shown that certain design indicators were originally ignored, resulting in a reduction in the overall comfort of the cabin [2, 10–12]. The tray table height is one of these indicators, and its design has evolved [13, 14]. To our knowledge, there are relatively few studies that have focused on the effects of aircraft tray table height and neck posture on passenger comfort. Initially, designers prioritized legroom rather than the neck posture of passengers [15, 16]. Generally, the headrest of the passenger seat is meant to maintain head and neck posture of passengers, which is an important comfort factor [6, 10]. However, it is questionable whether comfortable contact between the head and headrest is always achieved [6, 17], as the headrest only works when the passenger is leaning back on the seat. In many cases (i.e., eating, reading, using a smartphone, and using a tablet), the passenger’s head does not contact the headrest; thus, the cabin design indicators that affect the head and neck posture of passengers relate to the visual target location more than the seat headrest [6, 18]. When the tray table is used to support display media, such as a smartphone, tablet, or laptop, its height will directly affect the head and neck posture of passengers [18–20]. Similar issues also exist in the cabin of other public transport vehicles, such as high-speed rail, coach or cruise ship [21–23].
Many studies have researched the interactive relationships among display positioning, neck and shoulder posture, and muscle activity [6, 24–27]. Excessive neck flexion is one of the direct causes of neck pain [28–31]. There are also some studies on the height of desks in different context, such as offices, factories, and classrooms [32–37]. These studies showed that the appropriate table height can help people to be safer and more efficient in their work and study. The use of handheld devices is an important cause of excessive neck flexion [20, 38–42]. Hence, higher display locations for devices can lead to decreased neck flexion, returning the user closer to the neutral posture and thus improving comfort [43, 44]. Therefore, we hypothesized that increasing the seat tray table height to an optimal level could reduce passenger neck flexion and improve comfort.
Comfort is a subjective feeling that rises from the interactive process between a person and an object in a given environment and context [43]. The comfort of aircraft passengers is affected by the aircraft features and the cabin environment [45]. Therefore, comfort research must involve collection of not only objective data, but also the subjective feelings of participants [46]. The perceived level of discomfort (PLD) intuitively reflects the discomfort of a specific body part. The PLD is measured by the Borg’s perceived level of exertion (PLE) scale rating [47]. The PLD has been used by many scholars to help participants accurately describe the discomfort level of a certain part of the body, such as the neck [48], back [49], lower limbs [50, 51], elbow [9], and wrist [52]. Thus, PLD provides an effective way to study the interaction among the tray table, neck posture and the comfort of passengers.
Experimental devices used in previous studies have included a camera with a video image analyzer [19], an infra-red 3D motion analysis system [20], electronic goniometers [53], and sagittal photographs and radiographs [54]. These devices have some physiological effects (e.g., the load of attached instrumentation or radiation exposure) on participants and place limitations on the experimental environment due to interference of ambient light or occlusion of the camera [55, 56]. Furthermore, such equipment is difficult to deploy in the narrow space of a passenger seat in an aircraft cabin. Handheld 3D scanning equipment has been effectively applied in some studies on anthropometric data, with high accuracy and efficiency [57–59]. However, handheld 3D scanners are not sensitive to the light conditions of the experimental environment and have fewer space constraints and are thus more suitable for measurements in limited-space environments.
The objectives of this study were to: 1) conduct a survey on the use of the tray table to determine the design issues that affect passenger experience in the economy class cabin and evaluate the overall comfort of the tray table; and 2) assess the perceived discomfort of the tray table height using data on neck posture (3D scanning) and PLD. To verify our hypothesis, this study comprised two parts: a passenger experience survey and the perceived discomfort assessment (Fig. 1).

Overview of the current study.
Participants
In the first part (passenger experience survey) of this study, 161 participants were recruited when they were “just arriving” at the Xi’an Xianyang International Airport between March 2019 and June 2019 (Table 1). The participants, all of whom have five or more flight experiences (>2 hours per flight) in economy class in the past year, comprised 102 males and 59 females (aged 38.6±17.3 years, weight: 70.1±12.6 kg, stature: 171.6±9.9 cm). According to the Human Dimensions of Chinese Adults GB/T10000-1988 (Standardization Administration of the People’s Republic of China, 1988), the male heights ranged between the 10th to 99th percentile and the female heights ranged between the 50th to 99th percentile. In terms of body mass, the males ranged between the 50th to 99th percentile while, the females ranged between the 10th to 99th percentile.
Participant anthropometry: Mean (SD)
Participant anthropometry: Mean (SD)
Fifty-eight young adult participants (n = 29 males) with no history of neck, back, and upper extremity pain took part in the perceived discomfort assessment of this study. The participants included members of the local university student population as well as members of the general population. They were recruited by email, campus solicitations, and social networks. All participants provided informed consent prior to participation in this study. The total flight experience of the participants was≥five times. The age, stature, and body mass of participants are shown in Table 1. Based on the GB/T10000-1988, the male heights ranged between the 10th to 99th percentile and the female heights ranged between the 50th to 95th percentile. In terms of body mass, the males ranged between the 50th to 99th percentile while, the females ranged between the 10th to 95th percentile. Thus, the participants in this study represented a broad range of the population.
Passenger experience survey
Sixteen questions were included in this survey (Appendix), which comprised two sections and was designed to take no longer than 20 min to complete. Two hundred survey questionnaires were distributed to “just arriving” travelers at the Xi’an Xianyang International Airport. Four graduate students took three months to complete the field survey. Finally, 161 valid questionnaires were collected. The first section contained six questions relating to the participant’s age, gender, weight, stature, total flight experience, and the duration of most recent flight. The second section of the questionnaire addressed the following points [60–62]:
- (1) The use of tray tables (questions 7–8).
- (2) Passenger’s attitude regarding the height of the tray table (questions 9–11).
- (3) Effect of tray table height on passengers’ dining experience (questions 12–15).
- (4) Passenger’s overall comfort evaluation (OCE) of the tray table (question 16).
To better understand the difference between the height of the tray table in the cabin and at the dining table in different contexts (as an extension of question 11; e.g., home, cafeteria, and restaurant), a small-scale online supplementary survey was conducted. All 79 of these participants were undergraduates in our university. Participants were asked to measure the vertical height of the tabletop and seat surface to the ground when they ate in different contexts. In addition, participants were required to briefly describe their discomfort after completing question 6, and to explain the reason after completing question 9. At the end of questionnaire, participants were asked to provide some suggestions for improving the design of the tray table.
Perceived discomfort assessment
This part was completed in an economy class aircraft cabin simulation platform in the laboratory (MA-700, AVIC XAC Commercial Aircraft Co., Ltd. Fig. 2). Two rows of seats were set. Previous studies showed that the range of economy class seat pitch is 28 (Quigley et al. 2001) to 36 (economy-plus or super-economy class, [7]) inches (71.1–91.4 cm). Accordingly, the seat pitch of this experiment was set to 33 inches (83.8 cm, median of the range) to minimize the effect of narrow seat pitch on subject posture. Other fixed parameter (e.g., seat pan length, recline angle, and seat pitch) settings are shown in Fig. 2.
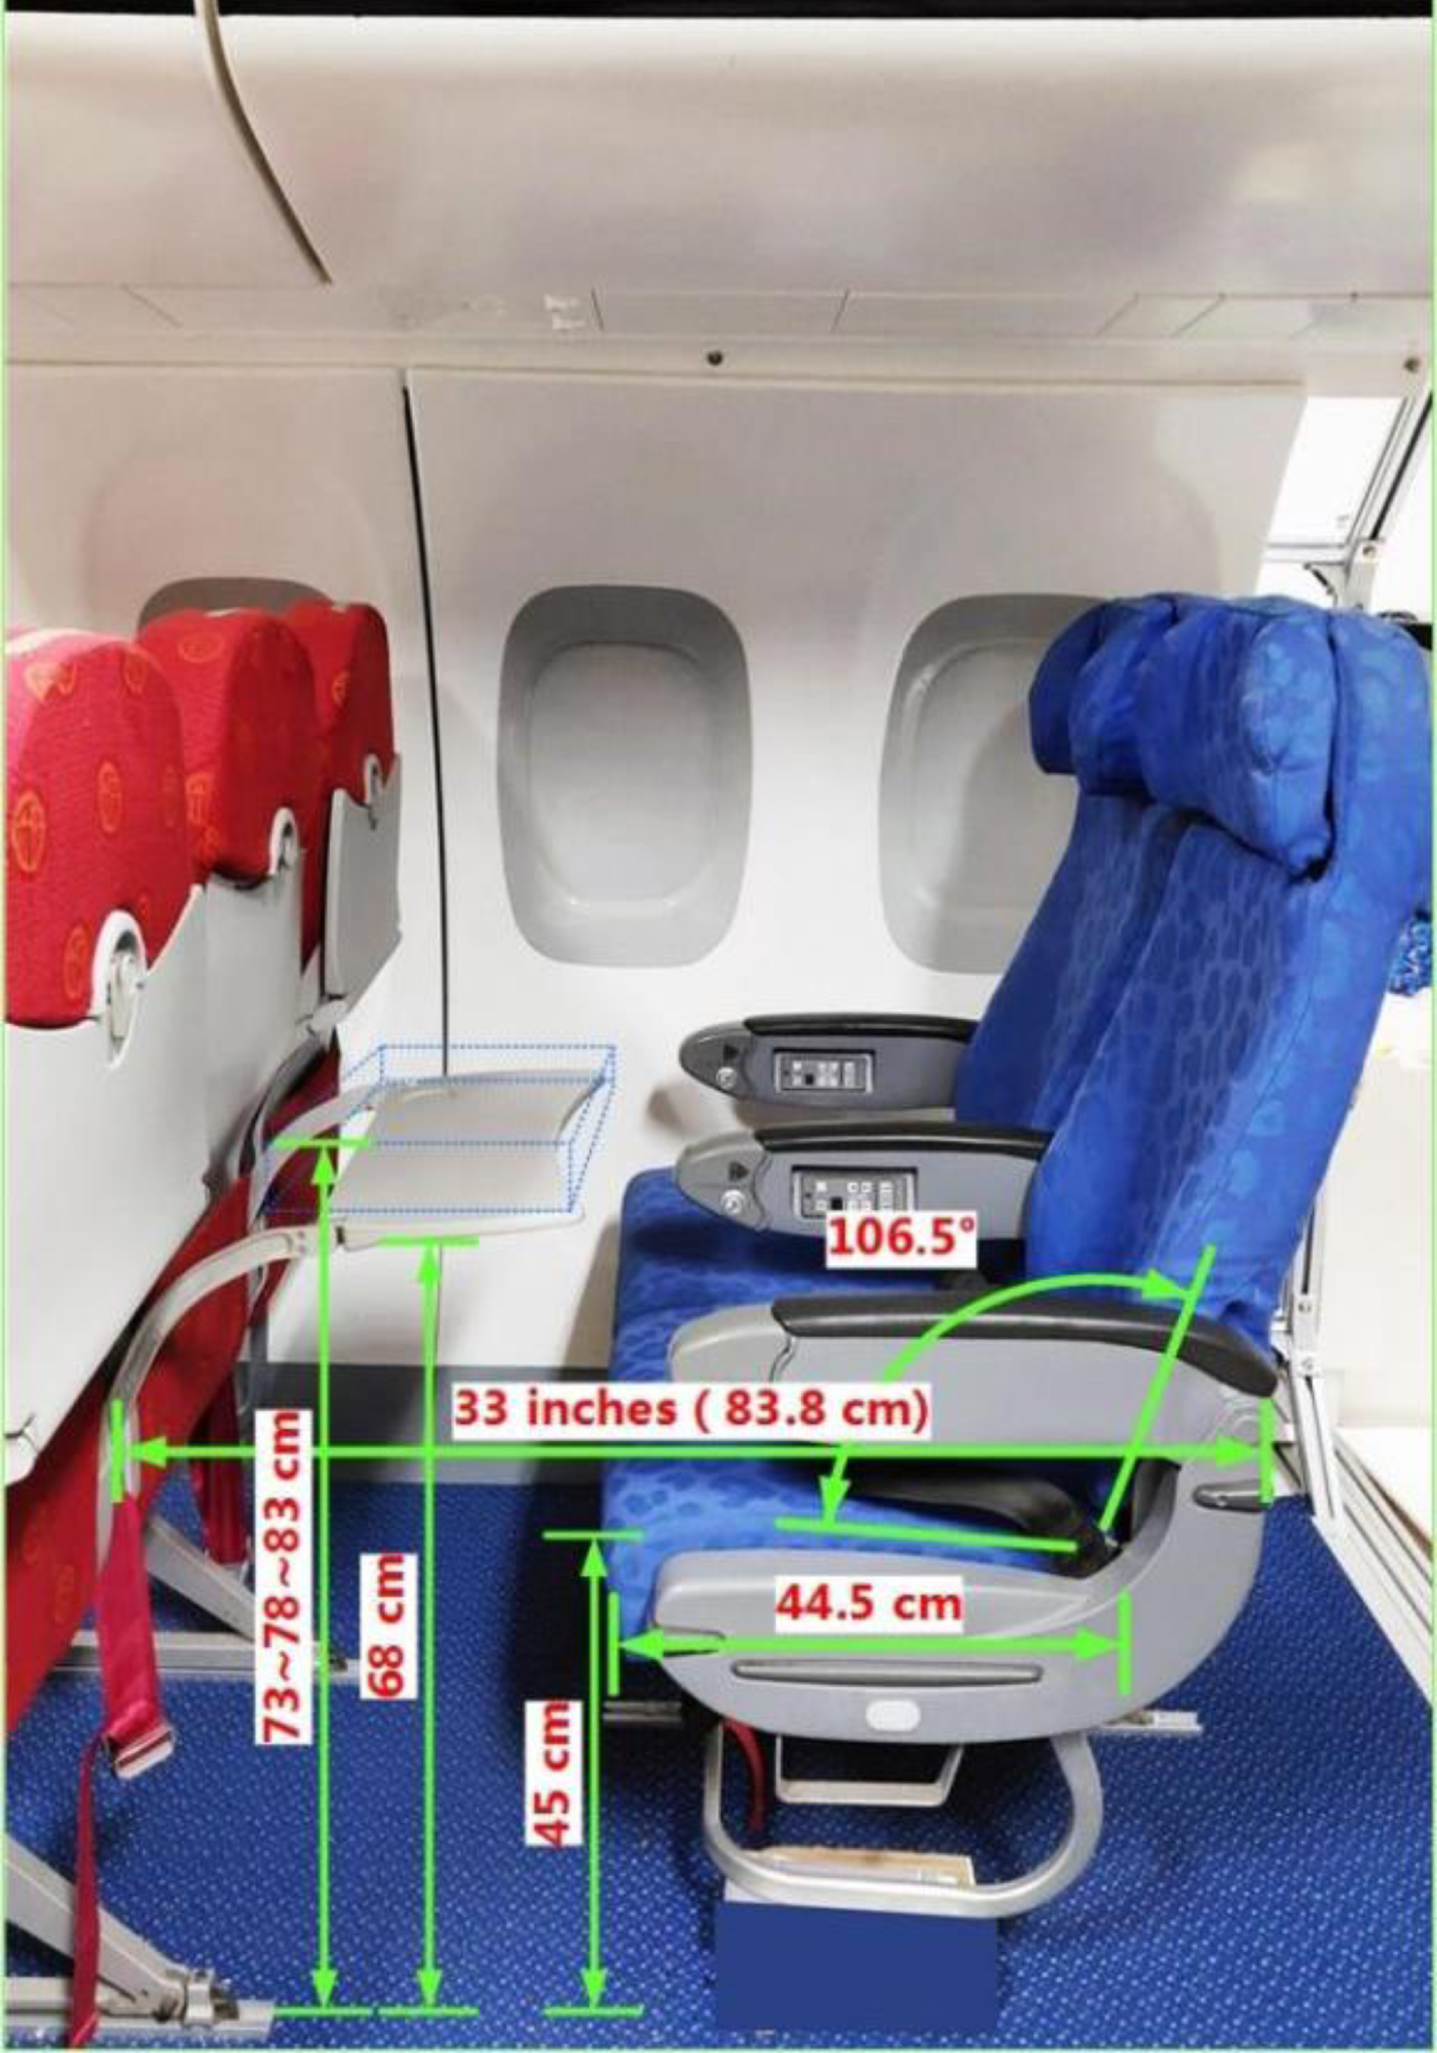
Aircraft cabin (simulation) used in this study: seat pitch = 83.8 cm; tray table height = 68 cm, 73 cm, 78 cm, and 83 cm; angle of the seat pan and backrest = 106.5°; seat pan length = 44.5 cm; seat surface height = 45 cm.
The neck posture data were collected using an EinScan-Pro+ Handheld 3D Scanner (accuracy: 0.1 mm, SHINING 3D Tech. Co., Ltd, China). The 3D models of passenger postures were saved by EinScan-Pro v2.6.0.9 in obj format with coordinate data. Three landmarks were marked on the canthus, tragus, and C7 spinous process (Fig. 3) for measuring the head-neck angles. The 3D model data were imported to Rhinoceros 5.0 (Robert McNeel & Associates, USA) for processing. The three head-neck angles were measured with curve projection and angular dimension tools according to previous studies [20, 54]. Three head-neck angles were measured in this part of the experiment: head flexion angle (HFA), neck flexion angle (NFA), and cranio-cervical angle (CCA) (Fig. 3). The HFA was measured as the angle between the vertical line and the line from the mid-tragus (mid-point of the left and right tragus markers) to the mid-canthus (mid-point of the left and right canthus markers). NFA was measured between the vertical line and the line from the mid-tragus to the C7 spinous process. CCA was measured between the line from mid-canthus to mid-tragus and the line from the mid-tragus to the C7 spinous process. Previous studies [5, 54] have shown that these angles are primary biomechanical outcomes for defining human neck posture.
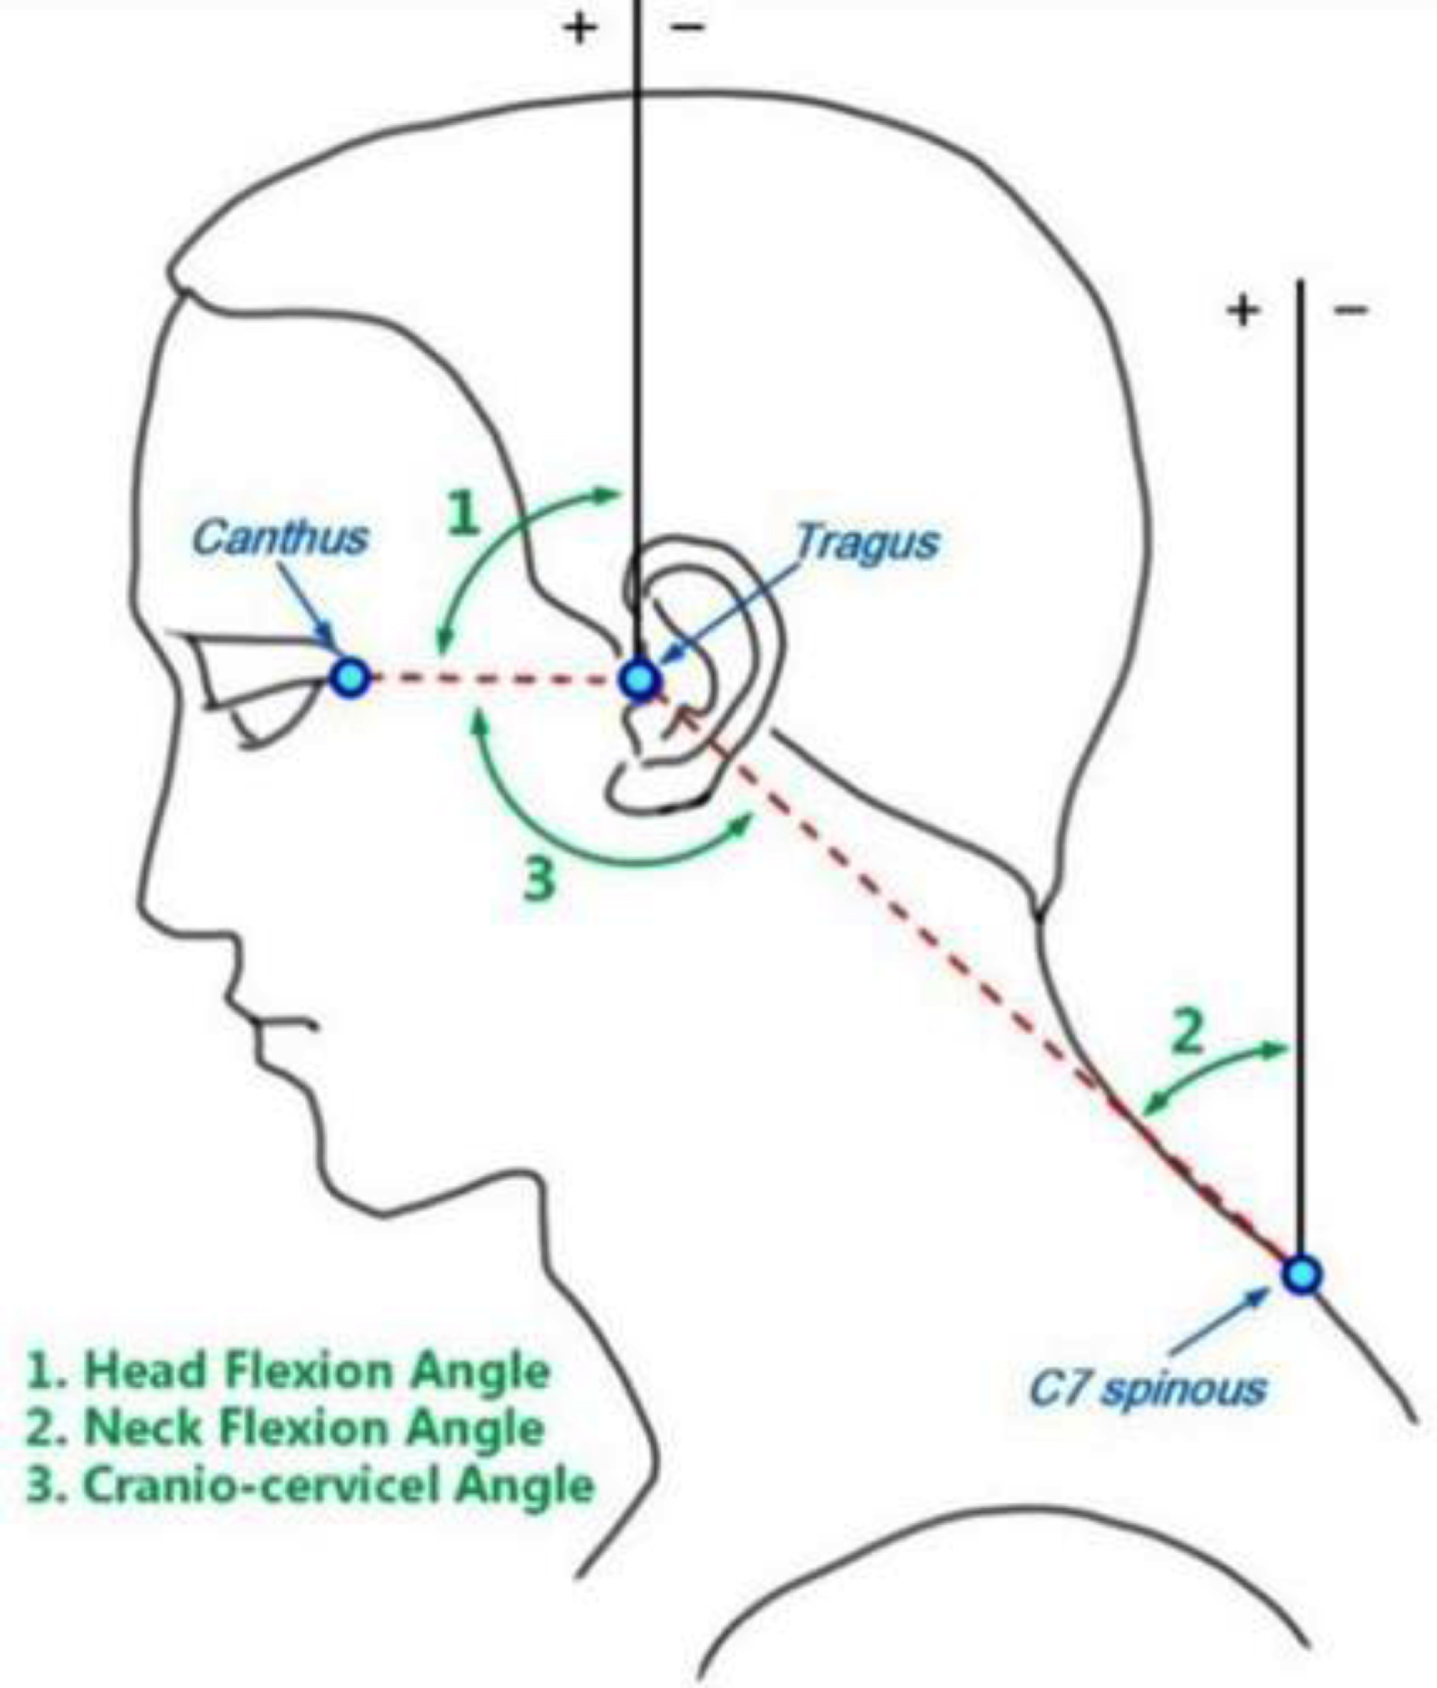
Landmarks and head-neck angles used in this study.
Results of passenger experience survey (questions 7–15)
Four reflective auxiliary markers were placed aside to assist locating target surfaces in 3D modeling. The reflective marker had a circular diameter of 6 mm, thickness of 0.15 mm, and weight of 0.2 g. Compared with the surface optical marker ball used in previous studies, the reflective marker used in this study is lighter and closer to the skin, such that it greatly reduces the instrumentation load to the body, thus improving the accuracy of the measurement [18, 54]. Other experimental materials included a smartphone (screen size: 16.5 cm), a tablet computer (Huawei M6, screen size: 27.4 cm) with a smart-cover, and a magazine (size: 21.0×28.5 cm). Notably, travelers will likely replace laptop computers with tablets as these convenient devices become more popular [20]. Therefore, we chose a tablet as the research object in this study rather than a laptop.
Before this part of the experiment, participants were informed of the experimental process and study objectives through written and verbal description. Participants also completed an informed consent document prior to data collection. In a repeated-measures laboratory experiment, 58 participants were asked to complete the experimental tasks under 12 conditions: 3 (tasks)×4 (tray table heights).
According to the results of the survey above (see Results), apart from dining, the most common uses of the tray table on the plane by passengers were using a smartphone, laptop or tablet, and reading. Therefore, the experimental tasks were designed to include the following: gaming with smartphone (Fig. 4a); watching movie on tablet (Fig. 4b); and reading magazine (Fig. 4c). The three tasks also represent the typical neck postures and tilt angle of the visual target plane that passengers assume when they are using the tray table. The three tilt angle ranges included: 40°–60° for gaming with a smartphone; 60°–80° for watching movie on a tablet; and 0°–20° for reading magazine placed flat on the tray table.
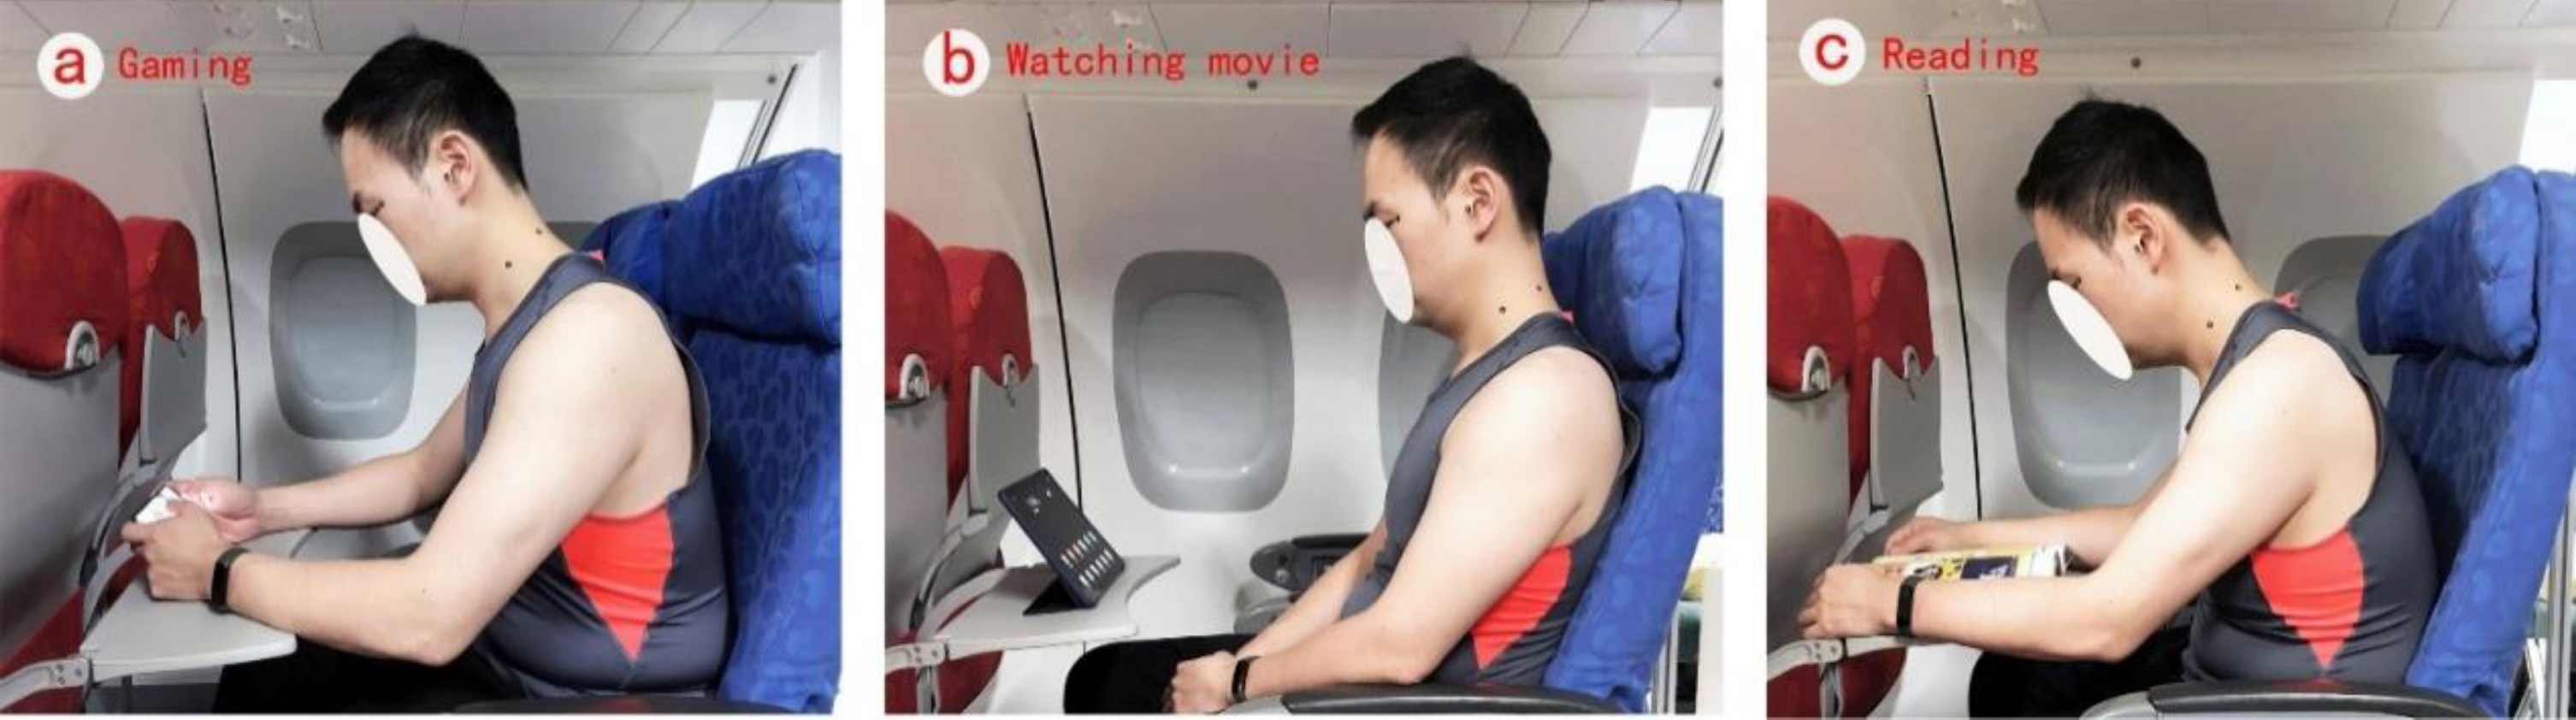
Tasks for perceived discomfort assessment: (a) holds the smartphone horizontally with both hands and keeps their wrists on the tray table; (b) places the tablet on the tray table with an accessory device; (c) places the magazine flat on the tray table and holds the magazine with both hands.
The four tray table height conditions were 68 cm, 73 cm, 78 cm, and 83 cm, and were set based on equipartition method. The first height of 68 cm is the average tray table height in the economy class of five different airlines (China Eastern Airlines, 68 cm; China Southern, 68 cm; Hainan Airlines, 69 cm; Spring Airlines, 67 cm; and Shandong Airlines, 68 cm). Based on the survey results (Table 3), the average height of the common table is 78 cm. In a repeated-measures laboratory experiment, 58 participants were asked to complete the experimental tasks under 12 conditions: 3 (tasks)×4 (tray table heights). After reflective markers were adhered to participants’ skin, they were asked to rest for at least 10 minutes. Prior to commencement of the tasks, participants were briefed about the tasks. The 12 sessions were separated into four stages by tray heights and each stage was 30 minutes apart. In each session, the participant was asked to perform one task for 5 minutes. Five-minute breaks were given between each session to minimize residual fatigue effects from the previous session. The demonstration order of the four stages was randomized and counterbalanced to reduce potential systematic biases. All participants completed the 12 sessions and finished a PLD assessment at the end of each session. The PLD assessment was conducted based on the combination of a modified Borg’s perceived level of exertion (PLE) scale [47] and a local postural discomfort (LPD) map [63]. The PLD scale (Fig. 5) in this paper was assessed using a modified Borg’s PLE scale [48].
Results of supplementary survey for question 11
Note. Data presented are means, and only integers are retained.

Perceived level of discomfort (PLD) scale for neck postures: (A) neck, (B) left trapezius, (C) right trapezius, (D) middle of trapezius, (E) left scapula, (F) right scapula.
Statistical analysis was conducted at α= 0.05 with SPSS R24.0 (IBM, USA), and p < 0.05 was considered statistically significant. For the survey analysis, a t test was performed to examine the difference between the sexes in the mean OCE rating. A one-way ANOVA with repeated measures was employed to determine the differences in the mean OCE rating of four body mass index (BMI) groups, with the Tukey’s honestly significant different (HSD) test for post hoc pairwise comparisons. The correlation between the mean OCE rating, participant stature, and BMI were examined by Spearman’s rank correlation coefficient tests.
For the assessment analysis, the 3D model data were imported to Rhinoceros 5.0 for processing. A one-way ANOVA with repeated measures was used to determine the differences in the mean head/neck angles and the mean PLD values of the participants across the four tray table heights. In addition, Spearman’s rank correlation coefficient tests were used to examine the relationship between the mean PLD values and stature of participants. A t test was also performed to examine the difference of the mean PLD values between sexes.
Results
Survey
The passenger experience survey results of 161 participants are shown in Table 2. Among the selection results of the nine questions (7–15), a total of 13 options were selected by more than 50% of the participants. More than 98% of the participants chose to use the tray table when flying. The situations in which participants most often chose to use the tray table were eating (96.27%), using a tablet or laptop (77.02%), and reading (53.42%). A total of 83.23% of participants felt the tray table on the aircraft is too low, and 86.34% of participants thought the tray table should be raised. Compared with the usual dinner table used by participants, 90.06% of them thought the tray table on the aircraft is lower. A total of 86.34% of participants felt uncomfortable when eating on the aircraft. More than half of the participants chose to pick up their lunch box when eating foods like soup (76.40%), porridge (50.31%), and noodles (51.55%). Finally, 81.12% of participants thought that the reason why they picked up the lunch box was that the tray table was not high enough.
The results of the supplementary online survey for question 11 are shown in Table 3. Data on the tray table height (from the tabletop to the ground) and the seat height (from the seat surface to the ground) in economy class were from the average of five different airlines in China (China Eastern Airlines: tray table height = 68 cm, seat height = 45 cm; China Southern: tray table height = 68 cm, seat height = 46 cm; Hainan Airlines: tray table height = 69 cm, seat height = 46 cm; Spring Airlines: tray table height = 67 cm, seat height = 44 cm; and Shandong Airlines: tray table height = 68 cm, seat height = 44 cm).
The last question of the questionnaire (question 16) asked participants to make an OCE rating of the current economy class seat tray tables on a 10-point scale (1 = most discomfort, 10 = most comfort). The results showed that the mean score was 5.76±1.02. There was a significant difference in OCE score (p < 0.001, t = –7.270) between men (5.37±0.86) and women (6.42±1.01). Participants were divided into four BMI groups based on the Guidelines for Prevention and Control of Overweight and Obesity in Chinese Adults (Ministry of Health of the People’s Republic of China, 2006): underweight (<18.5), standard (18.5–25), overweight (25–28), and obese (>28). There were significant (p < 0.001) differences in the mean OCE of each group, and individuals with obesity had lower OCE scores than other groups (Fig. 6).

Mean of overall comfort evaluation (OCE) across body mass index (BMI) groups.
According to the post hoc comparisons, the OCE scores of people with obesity were significantly (p < 0.05) lower than that of the other groups (Fig. 6). Spearman’s rank correlation coefficient test showed a significant (p < 0.001) negative correlation (rho = –0.634) between OCE and participant stature. There was a significant (p < 0.001) negative correlation (rho = –0.326) between OCE and participant BMI.
The results of participants’ neck posture are shown in Fig. 7. The mean HFA and HFA degree of the participants decreased as the height of the tray table was raised gradually (from 68 cm to 73 cm, 78 cm, and 83 cm), while the CCA increased accordingly.
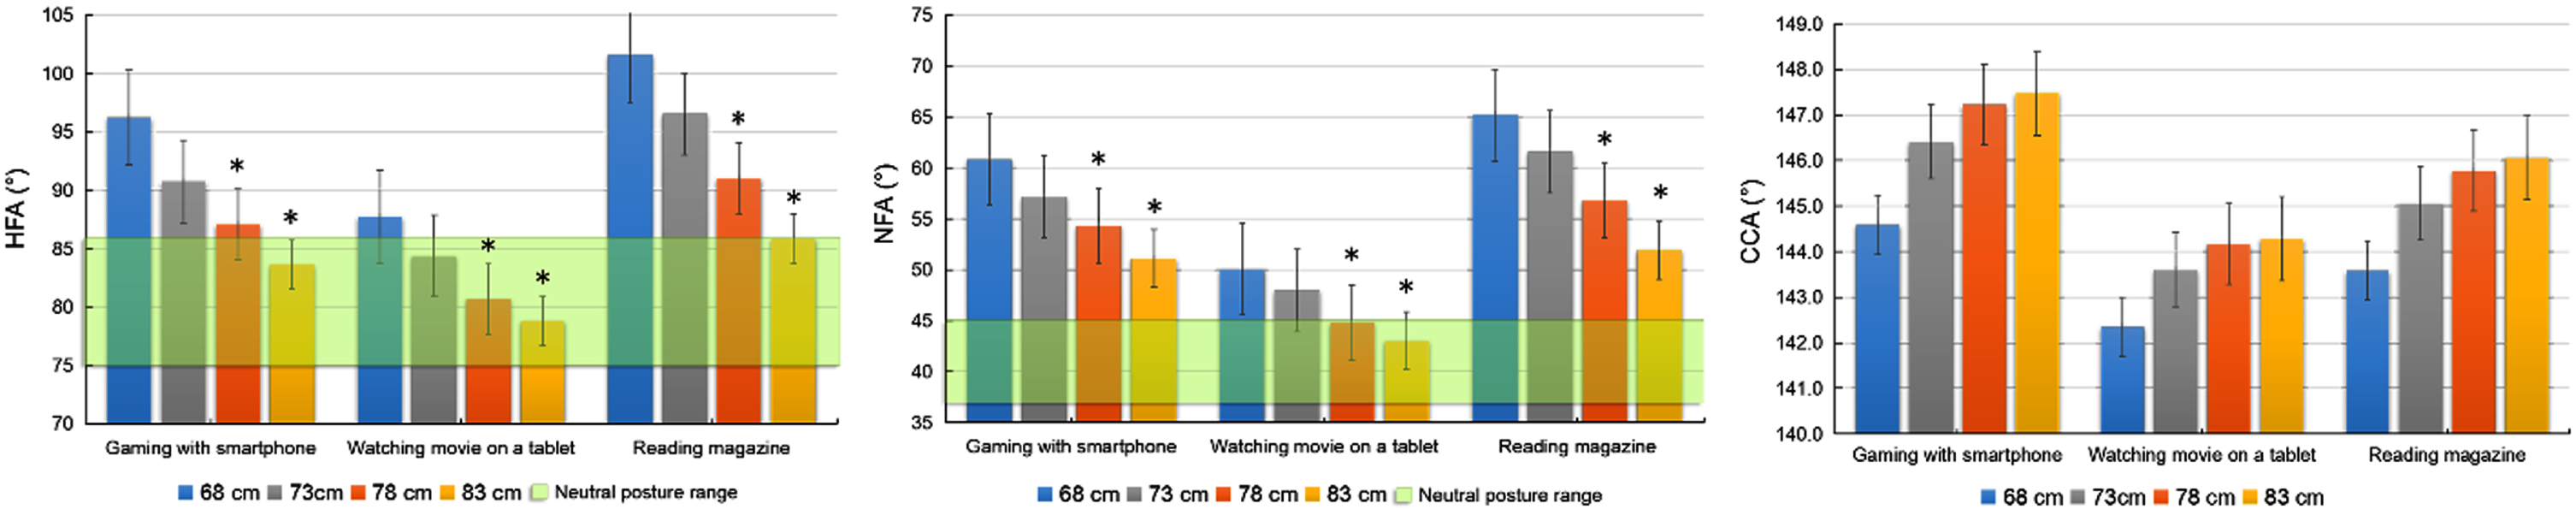
Mean charts of head/neck angles (CCA: cranio-cervical angle; HFA: head flexion angle; NFA: neck flexion angle).
The results of one-way ANOVA between the head/neck angles and tray table heights are shown in Table 4. The results of post hoc pairwise comparisons are as follows: when the height of the tray table increased from 68 cm to 78 cm and 83 cm, the mean HFA and HFA degree of the participants decreased significantly (p < 0.05); the mean CCA degree of the participants increased as the height of the tray table was raised gradually, but the increase was not significant (p > 0.05).
One-way ANOVA between the head/neck angles and tray table height
Note. Data presented are mean (SE). * Indicates the mean difference is significant at the 0.05 level. CCA: cranio-cervical angle; HFA: head flexion angle; NFA: neck flexion angle.
The results of PLD assessment are shown in Fig. 8. The mean PLD values of the participants’ six body parts showed a general downward trend as the height of the tray table was raised gradually (from 68 cm to 73 cm, 78 cm, and 83 cm). However, when the height of the tray table was 83 cm during the gaming with smartphone task, the mean PLD values of the participants’ B, C, and D body parts were greater than when the height of the tray table was 78 cm. A similar situation was also present during the reading magazine task; when the height of the tray table was 83 cm, the mean PLD values of participants’ B, C, D, E, and F body parts were greater than those when the height of the tray table was 78 cm.

Mean chart of PLD values in the three experimental tasks.
The results of one-way ANOVA are shown in Table 5. The results of post hoc pairwise comparisons are as follows: when the tray table was raised from 68 cm to 73 cm, the mean PLD values of the participants’ six body parts did not decrease significantly after they completed the experimental tasks (p > 0.05) and the mean PLD values of the part A decreased significantly after the tray table was raised from 68 cm to 78 and 83 cm (p < 0.05). In addition, during the gaming with smartphone task, the mean PLD values of the part B and C decreased significantly only when the tray table was raised from 68 cm to 78 cm; during the reading magazine task, the mean PLD values of parts E and F decreased significantly when the tray table was raised from 68 cm to 78 and 83 cm, respectively (p < 0.05).
One-way ANOVA between the PLD values and tray table height
Note. Data presented are mean (SE). * Indicates the mean difference is significant at the 0.05 level.
The results of correlation test are shown in Table 6. There was a significant positive correlation between the participants’ stature and the mean PLD values of their body part A (p < 0.001), part B (p < 0.001), part C (p < 0.001), and part D (p = 0.001). There was no significant (p > 0.05) difference in the mean PLD values between male and female participants.
Correlation test between PLD values and stature of participants
Note. The mean difference is significant at the 0.05 level. **Correlation is significant at the 0.01 level (2-tailed).
Results of the current study revealed that the height of the tray table in an economy class cabin will affect the comfort of aircraft passengers, and an insufficient tray table height will lead to an unnatural eating posture and excessive neck flexion in passengers.
The survey results showed that almost all passengers chose to use the tray table when flying. Except for eating, the most frequent reasons for tray table use were for laptops or tablets, using a smartphone, and reading. These findings are consistent with some previous studies on common activities of passengers on public transport [12, 64]. The majority of passengers thought that the height of the tray table in the cabin was too low. Most passengers felt that the tray tables in the cabin were lower than the dinner tables they usually used, which was consistent with the results of the supplementary online survey for question 5 (Table 3). A majority of passengers felt that a low tray table would cause discomfort while eating. Many of them said they would pick up lunch boxes when eating on the plane. This problem is exacerbated by the fact that the seat pitch in economy class is not spacious. Participant descriptions of discomfort included feelings of stomach compression and poor swallowing, findings consistent with some studies on eating posture [65, 66].
According to the OCE results, the mean OCE score was only 5.76 (1–10 points), which means passengers were not very satisfied with the tray table in economy class. Group comparison results show that passengers with obesity were more dissatisfied with the tray table than those in lower BMI groups. As Park et al. reported, aircraft passenger spaces designed without proper anthropometric analyses can create serious problems (e.g., excessive body pressures, contact stresses, and postural fixity) for passengers with obesity. Thus, the inappropriate height of the tray table will also cause adverse effects on this subset of passengers. Compared with male passengers, female passengers reported better satisfaction with the tray table, which might be due to the shorter height of females compared to males in this study. This is consistent with our findings that passengers’ satisfaction with tray tables was negatively correlated with their stature. Taken together, the results of the passenger experience survey suggest that the tray table height is not high enough and causesdiscomfort.
When the tray table height was 68 cm, the 3D scanning results showed the mean HFA and NFA degrees measured in the three experimental tasks were all beyond the neutral posture ranges (HFA: 75°–86° and NFA: 37°–45°) reported in previous literature [26, 68–70]. According to the PLD assessment results, after completing each of the three experimental tasks, participants perceived moderate and somewhat high discomfort (mean PLD values: 2.74–3.81) in body part A; very light and light discomfort (mean PLD values: 1.23–2.59) in body parts B, C, and D; very light discomfort (mean PLD values: 0.82–1.75) in body parts E and F. These results indicate that the original height (68 cm) of the tray table will cause passengers’ excessive neck flexion and discomfort when they use it.
After the tray table was raised to 73 cm, among the three tasks, the mean HFA and NFA degrees decreased the most in the Gaming with smartphone task (HFA: –5.47°; NFA: –3.65°), and the decreased degrees of the Reading magazine task (HFA: –5.07°; NFA: –3.60°) were larger than that of the Watching movie on a tablet task (HFA: –3.34°; NFA: –2.08°). However, the measurements were still outside the neutral posture range. The mean PLD values of the participants’ six body parts also decreased after they completed each of the three experimental tasks. The mean PLD values of body part A decreased the most (Gaming with smartphone: –0.54; Watching movie on a tablet: –0.58; Reading magazine: –0.52) among all the body parts. Since all changes were not significant (p > 0.05), the height of the tray tables could be further raise.
After the tray table was raised to 78 cm, compared with the measurements when the tray table was 68 cm, the mean HFA and NFA degrees of the participants in the three experimental tasks decreased significantly (p < 0.05). The mean HFA and NFA degrees of the participants in Reading magazine task (HFA: –10.56°; NFA: –8.37°) decreased the most among the three tasks, and the decreased degrees of the Gaming with smartphone task (HFA: –9.14°; NFA: –6.5°) were larger than that of the Watching movie on a tablet task (HFA: –7.04°; NFA: –5.22°). In addition, the mean HFA and NFA degrees measured in the watching movie on tablet task were in the neutral posture ranges. The mean PLD values of the participants’ six body parts decreased after they completed each of the three experimental tasks, and the value of body part A decreased the most (Gaming with smartphone: –1.29; Watching movie on a tablet: –0.92; Reading magazine: –1.23) and significantly (p < 0.05). This shows that raising the tray table can improve the neck posture of passengers and make them feel more comfortable. Moreover, the mean PLD values of the participants’ B and C body parts decreased significantly (p < 0.05) after they completed the gaming with smartphone task; the mean PLD values of the participants’ body parts E and F decreased significantly (p < 0.05) after they completed the reading magazine task. This shows raising the tray table can also improve the shoulder and back comfort of the passengers when they are gaming with a smartphone and reading.
When we further raised the tray table to 83 cm and compared the data with the measurements when the tray table was 68 cm, the mean HFA and NFA degrees of the participants in the three experimental tasks decreased significantly (p < 0.05). The mean HFA and NFA degrees of the participants in the Reading magazine task (HFA: –15.73°; NFA: –13.26°) decreased the most among the three tasks, and the decreased degrees of the Gaming with smartphone task (HFA: –12.57°; NFA: –9.69°) were larger than that of the Watching movie on a tablet task (HFA: –8.93°; NFA: –6.99°). Moreover, all the mean HFA degrees of the three tasks and the mean NFA degree of the watching movies on tablet task were in the neutral posture ranges. These results indicate that a higher tray table can reduce neck flexion in passengers, leading to a comfortable neck posture. Similar findings like higher display locations, which can lead to decreased user’s neck flexion by returning them closer to a neutral posture, have been widely reported in previous studies [6, 72] that did not focus on the tray table in aircraft.
After the participants completed each of the three experimental tasks, among their six body parts, the mean PLD values of body part A decreased (Gaming with smartphone decreased: 1.99; Watching movie on a tablet decreased: 1.39; Reading magazine decreased: 1.73) the most and significantly (p < 0.05). The mean PLD values of their body parts E (–0.64) and F (–0.63) decreased significantly (p < 0.05) after they completed the reading magazine task. However, after the participants completed the tasks of gaming with smartphone and reading magazine, the mean PLD values of their body parts B (Gaming with smartphone: +0.16; Reading magazine: +0.10), C (Gaming with smartphone: +0.16; Reading magazine: +0.09), and D (Gaming with smartphone: +0.09; Reading magazine: +0.28) were higher than those measured when the tray table was 78 cm high. Grimes and Legg stated that a mismatch in seated elbow height and desk height has been significantly related to reported neck and shoulder pain. During the gaming with smartphone and reading magazine tasks, the height of the tray table determines the elbow height of the participants. Therefore, an improper tray table height will cause passenger’s shoulder discomfort. Straker et al. stated that a mid-height display may be more appropriate for people than a high display, and the mid-height display also results in a more upright and symmetrical posture and lower mean muscle activity. This means that raising the tray table properly can reduce passengers’ neck discomfort, but raising the table too high will cause shoulder discomfort. Therefore, according to the results of this study, the appropriate height adjustment range of tray table in economy class is between 73 cm and 83 cm. Although the mean CCA degrees of the participant increased with the gradual raising of the tray table in the three experimental tasks, the changes were not significant. Our observation was consistent with the findings from a previous study by Young et al., suggesting that postural responses to tray table height configurations are representative of complex changes in the cervical spine/musculature [68].
The PLD assessment results showed that the discomfort of participants in body part A (neck) was the highest, followed by parts B and C (trapezius muscles on both sides), then part D (middle of the trapezius), and the lowest were parts E and F (bilateral scapula). In addition, among the six body parts of the participants, the mean PLD values of body part A decreased the most as the height of the tray table was raised gradually. These data demonstrate that the effect of the tray table on the discomfort of passengers’ neck is the most obvious, followed by the shoulder. This is consistent with previous research, which proposed that low display positions place users at risk of developing neck and shoulder discomfort [19, 75].
The PLD assessment of this study focused on collecting participant’s discomfort perception of individual parts of their body under different posture conditions. Hence, the time range selected for the assessment was to minimize the psychological and physiological load caused by participants repeating each task. Discomfort is a subjective measure, and the results may vary depending on the individual characteristics or propensity of the subjects, which cannot be ignored. Before the PLD assessment, the feedback of subjects did not show a differential preference for the simulation cabin. The possible explanations for this may be related to the unintentional feedback/reactions from the subjects that was formed by their economy class experience [76, 77]. Therefore, this study did not further test the effects of individual characteristics or propensity.
In summary, the results of the passenger experience survey show that: 1) other than eating, passengers often use the tray table when using a smartphone or a laptop/tablet and while reading; 2) passengers generally believe that the current tray table in economy class is not high enough; and 3) passengers were not very satisfied with the current tray table in economy class, especially passengers with obesity. According to the results of the perceived discomfort assessment, the 68 cm high tray table commonly used in economy class will lead to excessive flexion of the passenger’s neck, an unnatural neck posture, and discomfort. As the tray table is gradually raised, the passenger’s neck posture tends to be neutral, and the discomfort of neck also decreases. However, a tray table that has been raised too high will cause shoulder discomfort. In this study, the appropriate height adjustment range of the tray table was suggested as 73–83 cm, which can provide a positive understanding for related designers to design a tray table with adjustable and suitable thresholds. The median value of this adjustment range is 78 cm. Considering the previous studies on table height [33–35] and the results of the supplementary online survey for question 5 (Table 3), the appropriate heights of a common table was 76–80 cm. Therefore, for tray table with fixed height, 78 (±2) cm was suggested as the suitable thresholds. The findings of this paper can provide a basis for the design of economy class tray tables with appropriate height in the future, and a reference for research methodology of human posture and comfort.
There are some limitations to this study. As a result of the laboratory environment and the simulated tasks, participants may have altered their natural behavior when interacting with the tray table in the simulation cabin. Measurements for each experimental condition were also only collected for a short time, which may have allowed users to adopt postures that they would not have been able to maintain for a longer period of time. In addition, the sample size of this study was convenient samples. Hence, only the sexual differences of PLD were tested, and no significant differences were achieved. As mentioned above, discomfort is a subjective measure, and the results may vary depending on the individual characteristics or propensities. Therefore, further assessment is needed for the comparison between the unintentional feedback/reactions and individual characteristics/propensities. This study did not address seat pitch changes, which may alter the posture of participants. Future research will study the influence of seat pitch on the posture of aircraft passenger when using a tray table at different heights. This study did not evaluate the comfort of the upper limbs and lower back of the subjects. These two body parts can be used as measurement objects for future research to analyze the influence of different tray table heights on passenger comfort. The height of the seat surface used in this study was fixed, but in a real-world situation, the seat surface height on different airlines is not identical. Therefore, it is necessary to consider the influence of different seat surface heights in future research. Finally, we lacked enough data to analyze the best comfort-matching relationship between passenger height and tray table height, a topic for future research.
Conclusions
This study demonstrated that the average current tray table height in economy class air travel is too low, resulting in excessive neck flexion and neck discomfort to passengers and putting them at risk for neck musculoskeletal harm. Properly raising the height of the tray table can improve the neck posture of passengers and improve their level of comfort. This aligns with findings from other studies regarding ideal computer display locations and neck posture comfort. This study showed an accurate way to rapidly assess the neck posture and comfort of aircraft passengers using 3D scanning and PLD assessment data. These methods are advantageous for measuring human head-neck angles, particularly in narrow spaces like an aircraft passenger experiences in an economy class seat. The findings of this study can inform optimization of tray table height and would also be of benefit for designers of aircraft cabins.
Ethical approval
Not applicable.
Informed consent
All participants were informed of the experimental process and study objectives through written and verbal descriptions.
Conflict of interest
The authors declare that they have no known competing financial interests or personal relationships that could have appeared to influence the work reported in this paper.
Footnotes
Acknowledgments
The authors thank the participating individuals for their time and effort.
Funding
This study is partly supported by the Program of Introducing Talents of Discipline to Universities (Grant no. B13044, Ministry of Education of China), the Special Research Foundation for Civil Aircraft (Grant no. MJ-2015-F-018, Ministry of Industry and Information Technology of China), and the National Key R&D Program (Grant no. 2019YFB1405701 and 2019YFB1405702, Ministry of Science and Technology of China).
Appendix
|
|
| Hello! Dear friend: |
| We are carrying out a comfort study on the tray tables in the economy class cabin. Would you like to spare a few minutes to answer the following questions in this questionnaire carefully and authentically? We will ensure that your answers will be kept strictly confidential. |
|
|
| 1. Gender: ○ Male ○ Female 2. Age: () 3. Stature: () cm 4.: () kg |
| 5. Duration of last flight: ○ Less than 2 hours ○ 2–4 hours ○ Above 4 hours |
| 6. Total flight experience: ○ 1 time ○ 2–4 times ○ 5 or more times |
|
|
| 7. Do you use the tray table when flying? |
| ○ Yes ○ No |
| 8. In what kind of situation do you need to use the tray table? (Multiple choice) |
| ○ Eating ○ Using smart-phone ○ Using tablet or laptop ○ Reading ○ Other |
| 9. How do you feel about the height of the tray table on the aircraft? |
| ○ Too high ○ Too low ○ Just right |
| 10. Do you think the tray table should be raised? |
| ○ Yes ○ No |
| 11. How does the height of the tray table compare with your usual dinner table? |
| ○ Almost the same ○ Higher ○ Lower |
| 12. When you eat on the aircraft, do you feel uncomfortable because of the tray table height? |
| ○ Yes ○ No |
| 13. Do you pick up your lunch box when you eat on the aircraft? |
| ○ Yes ○ No |
| 14. With what kind of food do you need to pick up the lunch box when eating on the aircraft? (Multiple choice) |
| ○ Bento ○ Sandwich ○ Soup ○ Porridge ○ Noodle ○ Steak ○ Salad |
| 15. Is it because the tray table is not high enough that you need to pick up the lunch box when you eat on the aircraft? |
| ○ Yes ○ No |
| 16. Would you please make an overall comfort evaluation rating of the current economy class seat tray tables on a 10-point scale (1 = most discomfort, 10 = most comfort) |
| ○ 1 ○ 2 ○ 3 ○ 4 ○ 5 ○ 6 ○ 7 ○ 8 ○ 9 ○ 10 |
| Some of your suggestions for improving the tray table: |
| Thank you very much for your cooperation! |