
Abstract
BACKGROUND:
Effective targeting of workplace upper extremity musculoskeletal disorder (MSD) prevention strategies requires the identification of demographic groups most at risk. Workers’ compensation data provides an effective means of surveillance of MSDs at the population level.
OBJECTIVE:
The primary purpose of this study was to identify the effects of age and sex on rates of tendon injuries of the wrist and hand, carpal tunnel syndrome (CTS), epicondylitis, and soft tissue shoulder injuries in Ontario, Canada between 2000–2019 using workers’ compensation data from the Association of Workers Compensation Boards of Canada (AWCBC).
METHODS:
Age and sex specific rates of lost-time injury claims from the four identified injury categories as well as “non-specific” upper extremity MSDs which did not fit into the four categories were calculated by standardizing injury claim totals with “at-risk” population estimates from the Canada Labour Force Survey. A multiple regression analysis was used to analyze the effects of age and sex on rates of specific injury claims.
RESULTS:
Statistically significant age and sex effects were identified for rates of claims from tendon injuries of the wrist and hand, CTS, and shoulder injuries, while only age effects were significant for epicondylitis. Between 2000–2019, rates of claims from the four injury categories studied and the magnitude of the age and sex effects declined substantially over time.
CONCLUSION:
Detailed surveillance of workplace ergonomic hazards in Ontario workplaces is needed to determine what is causing rates of upper extremity claims to decline.
Introduction
Musculoskeletal disorders (MSDs) are the leading cause of work-related occupational health problems around the world [1–3]. Among work-related MSDs, injuries affecting the upper extremity are highly prevalent, ranking alongside the low back with the most worker claims [1]. For example, in Canada, injuries to the upper extremity accounted for approximately 23% of all accepted lost time worker claims between 2000–2019 [1]. A growing body of evidence suggests that extended absences from work and costs due to injury are disproportionately caused by a minority of highly costly repetitive strain injuries (RSI) – injuries due to repeated exposure to force, awkward postures, or other risk factors over time, rather than from a single, acute event [4]. Common examples of upper extremity RSIs include carpal tunnel syndrome (CTS), epicondylitis, tendinitis, and tenosynovitis [5]. Compared to injuries to other body parts, upper extremity RSIs can result in longer absences from work, greater loss in worker productivity, increased monetary compensation claims, and higher frequency of subsequent injury-related work absences [3, 6–11]. To implement successful and evidence-based injury prevention strategies, effective monitoring of work-related injuries is required to understand which groups of workers are at greatest risk for injury and track the factors driving injury rates.
Several biomechanical and personal factors are known to increase risk for work-related upper extremity RSIs. Biomechanical risk factors include exposure to high forces and vibration, awkward postures, and performing repetitive tasks, which can be examined observationally in the workplace and through lab-based experimental studies [5, 12–15]. Biomechanical risk factors can be quantitatively assessed as a dose-response relationship to help establish guidelines for safe work practice. However, effective targeting of prevention strategies also requires an understanding of personal factors that may predispose an individual to an increased risk of injury. Although the effects of age and sex on MSDs have been examined previously, few studies have focused on specific upper extremity injuries. Understanding the relationship between personal factors and upper extremity disorders is especially important as worker demographics have shifted towards older and more female workers over the past twenty years, with the labour force expected to continue aging through the next decade [16, 17]. Among studies evaluating specific upper extremity disorders, females are generally observed to experience a greater incidence of CTS, tendinitis, epicondylitis, and shoulder injuries, although some studies have found no differences between sexes [18–25]. Rates of shoulder injuries have been observed to increase linearly with age, while CTS and epicondylitis follow a parabolic curve with age, peaking around 45 years of age and declining with increasing age [25, 26]. With constantly shifting worker demographics, frequent up-to-date observations of the effects of age and sex on rates of workplace upper extremity MSDs are needed.
Examining the relationships between personal factors, such as age and sex, and MSDs requires the surveillance of a large, diverse group of workers over a long period of time. Studies commonly achieve large sample sizes by observing pooled cohorts, across multiple job sites and industries; however, this can be expensive and time consuming [19]. Alternatively, worker compensation systems are an effective source of data for examining personal risk factors for workplace injuries at the population-level. Workers’ compensation systems provide workers with wage-loss benefits and medical coverage following a work-related injury or illness. In the USA, California and Washington State’s workers’ compensation systems have been used to examine work-related MSDs across several studies [10, 27–29]. In Canada, The Association of Workers’ Compensation Boards of Canada (AWCBC) collects data on cases of workplace injuries which resulted in a worker receiving compensation due to lost wages or permanent disability from each of the regional (i.e., provincial, territorial) compensation systems. For Canada’s most populous province, Ontario, AWCBC data was last used to examine the effects of age and sex on specific types of upper extremity MSDs in 1997 [26]. The authors found that females had higher rates of CTS and epicondylitis, and males had higher rates of rotator cuff tear/syndrome. Rates of rotator cuff tear/syndrome increased linearly with age, while rates of CTS and epicondylitis followed a parabolic relationship with age, peaking in the 45–54 age group. Although the AWCBC data has not been used to analyze specific types of upper extremity disorders specifically since 1997, a study of all workplace MSDs reported a 3.4% annual decrease between 2004–2011 [30]. Further research is needed to assess whether declining rates of workplace MSDs over time are reflected in rates of specific upper extremity disorders across sex and age categories.
The purpose of this study was to assess the effects of sex and age on rates of workplace upper extremity MSDs in Ontario over the past two decades from 2000–2019. We hypothesized that the effects of age and sex will be similar to those observed in 1997 [26]. We expected males to have higher rates of rotator cuff tear/syndrome, and females to have higher rates of CTS and epicondylitis. We also predicted that rates of CTS and epicondylitis increase with age, peaking in the 45–54 age group and decline in older age groups, while rates of rotator cuff tear/syndrome increase linearly with age.
Methods
The Workplace Safety and Insurance Board of Ontario (WSIB) insures over 5 million workers in the province of Ontario against lost wages from work-related injuries. WSIB maintains a record of all workplace injuries which resulted in compensation for lost wages, or a permanent disability with or without any lost time at work [31]. We acquired lost time injury claims data from the AWCBC over the years 2000–2019 for the province of Ontario, Canada. Total injury claims were provided for each combination of the following five independent variables: (1) the injury sustained (termed the “nature” of injury), (2) the injured body part, (3) the year in which the claim was accepted, (4) the age group of the worker, and (5) the gender of the worker. The classifications are according to the National Work Injuries Statistics Program (NWISP) coding standards which are based on the Canadian Standards Association (CSA) Z795-96 codes [32]. Recognizing that gender (social construct) and sex (biological attribute) are not equivalent terms, it should be noted that the classifications provided under the gender variable were sex-specific attributes: male and female. Thus, for the purposes of this paper, we will be referring to these as sex differences. Only the nature of injuries associated with injuries to musculoskeletal tissues were requested [33]. In total, there were 877,763 accepted claims between 2000–2019, of which 167,099 were upper extremity claims. To protect the anonymity of the claimants, categories where only 1–3 claims are accepted were coded with an ‘X’ by the insurance board. For these instances, we assumed the number of claims to be 2 in our analyses. As imputation can increase uncertainty for categories with few claims, the ‘65 years and older’ age category was removed from further analysis. No ethics review and approval were sought as data were available online as per request and no identifying information was collected or requested by the researchers.
Claims specific to the upper extremity were extracted based on the nature of the injury and body part classifications. As the focus here was on upper extremity musculoskeletal disorders developed over time, we narrowed down the claims to only include the nature of injuries typically considered as RSIs. These injuries were grouped into four categories: (1) Shoulder Injuries, (2) Epicondylitis, (3) Carpal Tunnel Syndrome, and (4) Hand and wrist tendon-related injuries (Table 1). Upon inspecting the data, a few incongruities between the nature of injury and the body part classification were identified. For instance, multiple carpal tunnel syndrome claims had been labelled as occurring in the leg. Since it is difficult to determine whether the body part or the injury itself was mislabeled, we only included matching combination of natures of injury and afflicted body parts (Table 1). Table 2 includes all instances of incongruent injury/body part combinations that were removed from further analysis. It is worth noting that many of these incongruent instances had very few claims and represented a small percentage of all claims.
Accepted lost time injury claims included in the categories identified for analysis of specific upper extremity musculoskeletal disorders
Accepted lost time injury claims included in the categories identified for analysis of specific upper extremity musculoskeletal disorders
Claims are categorized according to the nature of injury and part of the upper extremity injured, with numbers representing the total number of claims across all age groups and both sexes from 2000–2019. Zeros indicate the body part-injury combination was included in the category with no accepted claims. ‘–’ indicates the body part-injury combination was excluded from the category. Note: the abbreviation “n.e.c.” stands for not elsewhere classified.
Accepted lost time injury claims excluded from further analysis due to a mismatch between injured body part and the nature of injury
Note: the abbreviation “n.e.c.” stands for not elsewhere classified.
Although the focus of the analysis was on specific upper extremity injuries (e.g., CTS, epicondylitis), we observed that most lost time injury claims were categorized as vague, non-specific injuries that did not delineate the diagnosis or injured tissues (Table 3). Most notably, the nature of injury coded as “02100 - Sprains, strains, tears uns[pecified].” accounted for greater than 50% of all total upper extremity claims (∼90,003 claims of the total 167,099 upper extremity claims). Given the large proportion of the total claims such injury classifications comprise and that these categories may contain several cases of RSIs despite not clearly describing the injury experienced by the worker, we considered them as a separate category of injuries which will be referred to as ‘non-specific claims’. Non-specific claims totals for each upper extremity body part are presented in Table 3.
Lost time injury claims with ‘non-specific’ injury coding by body part
Note: the abbreviations “uns.” and “n.e.c.” stand for unspecified and not elsewhere classified, respectively.
To allow for comparison of lost time claims across age groups, sex, and years, the data were normalized according to Canadian labour force statistics. Although data were available on the total percentage of workers with WSIB coverage annually, these were not categorized by age or sex, making it difficult to assess the at-risk, insured population of workers based on demographic groups. Assuming uniform coverage rates across age and sex groups may skew injury rate ratios as specific age/sex groups may be disproportionately represented in industries which do not require workers’ compensation coverage. In the absence of detailed age- and sex-specific WSIB coverage data, injury rates were calculated by combining the claims counts with an at-risk population estimate derived from the Canada Labour-Force Survey public use microdata files. This method was described in detail and tested by Zakaria et al., (2002) and is summarized here [4]. Each month, Statistics Canada surveys the Canadian labour force, recording demographic characteristics as well as the number of hours worked in a single week, referred to as the “reference week”. The reference week is assumed to be reflective of the rest of the month [34]. These data are published monthly by Statistics Canada in a “public-use microdata file”. We obtained monthly files from 2000–2019 and averaged the hours worked and number of workers across the months each year to produce yearly estimates of the average weekly hours worked by the employed population in Ontario for each combination of age and sex. For each age and sex combination, the number of employed workers was multiplied by the estimated weekly hours worked to produce the estimated total hours worked weekly. The weekly estimated hours worked for each grouping was multiplied by 52 weeks and divided by 2000 (assuming 40 hours a week for 50 weeks) to produce an annual estimate of the total hours worked by the employed labour force termed full-time equivalents (FTE). Self-employed and unpaid family workers were removed from the estimates since they are unlikely to have WSIB coverage. Claims were then normalized to 100,000 FTE, allowing for comparison of rates of claims across age groups and sex over eachyear.
The research question aimed at evaluating the effects of sex, age, and year on rates of lost-time injury claims (i.e., claims normalized to 100,000 FTE). To answer this question, a separate multiple regression model was constructed for each of the following four injury types: (1) Shoulder Injuries, (2) Epicondylitis, (3) Carpal Tunnel Syndrome, and (4) Hand and wrist tendon-related injuries. For each of these injuries, the main effects of sex, age, and year were first included in the model. Visual inspection of the data was used to assess the addition of potential interactive effects and non-linearities to include in the model. As relative claims appeared to change at different rates for males and females over time, the interaction between year and sex was included. The distribution of relative claims across age groups appeared to change over time, so an interaction term between age and time was included. Since the distribution of relative claims across the age groups also appeared to vary by sex, the interaction between age and sex was included. To test whether potential interactions between age and sex changed over time, a three-way interaction between age, sex, and year was included. For the CTS and epicondylitis data, the age distribution of relative claims appears to follow an inverted parabolic curve, such that middle aged workers displayed the greatest number of relative claims that tapered at younger and older age groups. To model this effect, a quadratic age term (age2) as well its interactions with year and sex were added to the models for CTS and epicondylitis. Data transformation and analyses were performed using the tidyverse package in R studio [35]. Regression assumptions were visually inspected using the performance package [36]. Multicollinearity was observed for all four models, which was resolved by mean-centering the age, age2, and year terms in the models. An alpha value of 0.05 was set for all analyses. All analyses were performed in R(version 3.5.1) [37].
Table 4 presents the intercepts and coefficient estimates of the multiple regression models for each of the 4 specified injury categories: (1) Shoulder Injuries, (2) Epicondylitis, (3) Carpal Tunnel Syndrome, and (4) Hand and wrist tendon-related injuries. Overall, all four models indicated rates of claims have decreased between 2000–2019. There was a shift towards a more equal distribution of rates of claims across age groups in all four models as time progressed from 2000 to 2019. Similarly, as time progressed from 2000 to 2019, there was a shift towards more equal rates of claims between the sexes, except for shoulder injuries which remained more common in males than females. Figure 1 displays the total number of claims and rates of claims (i.e., claims per 100,000 FTE) for the four injury categories grouped by age, sex, and year. The following sections describe in detail the results for each specific injury category. Please note that although significant interaction effects were observed and take priority, we start each section describing the main effects first and explain how these main effects are conditionally dependent upon other variables to ease interpretation of the interaction effects.
Model summary and estimates of coefficients and intercepts of multiple regression models of rates of lost-time injury claims categorized as (1) shoulder injuries, (2) epicondylitis, (3) carpal tunnel syndrome, and (4) hand and wrist tendon-related injuries
Model summary and estimates of coefficients and intercepts of multiple regression models of rates of lost-time injury claims categorized as (1) shoulder injuries, (2) epicondylitis, (3) carpal tunnel syndrome, and (4) hand and wrist tendon-related injuries
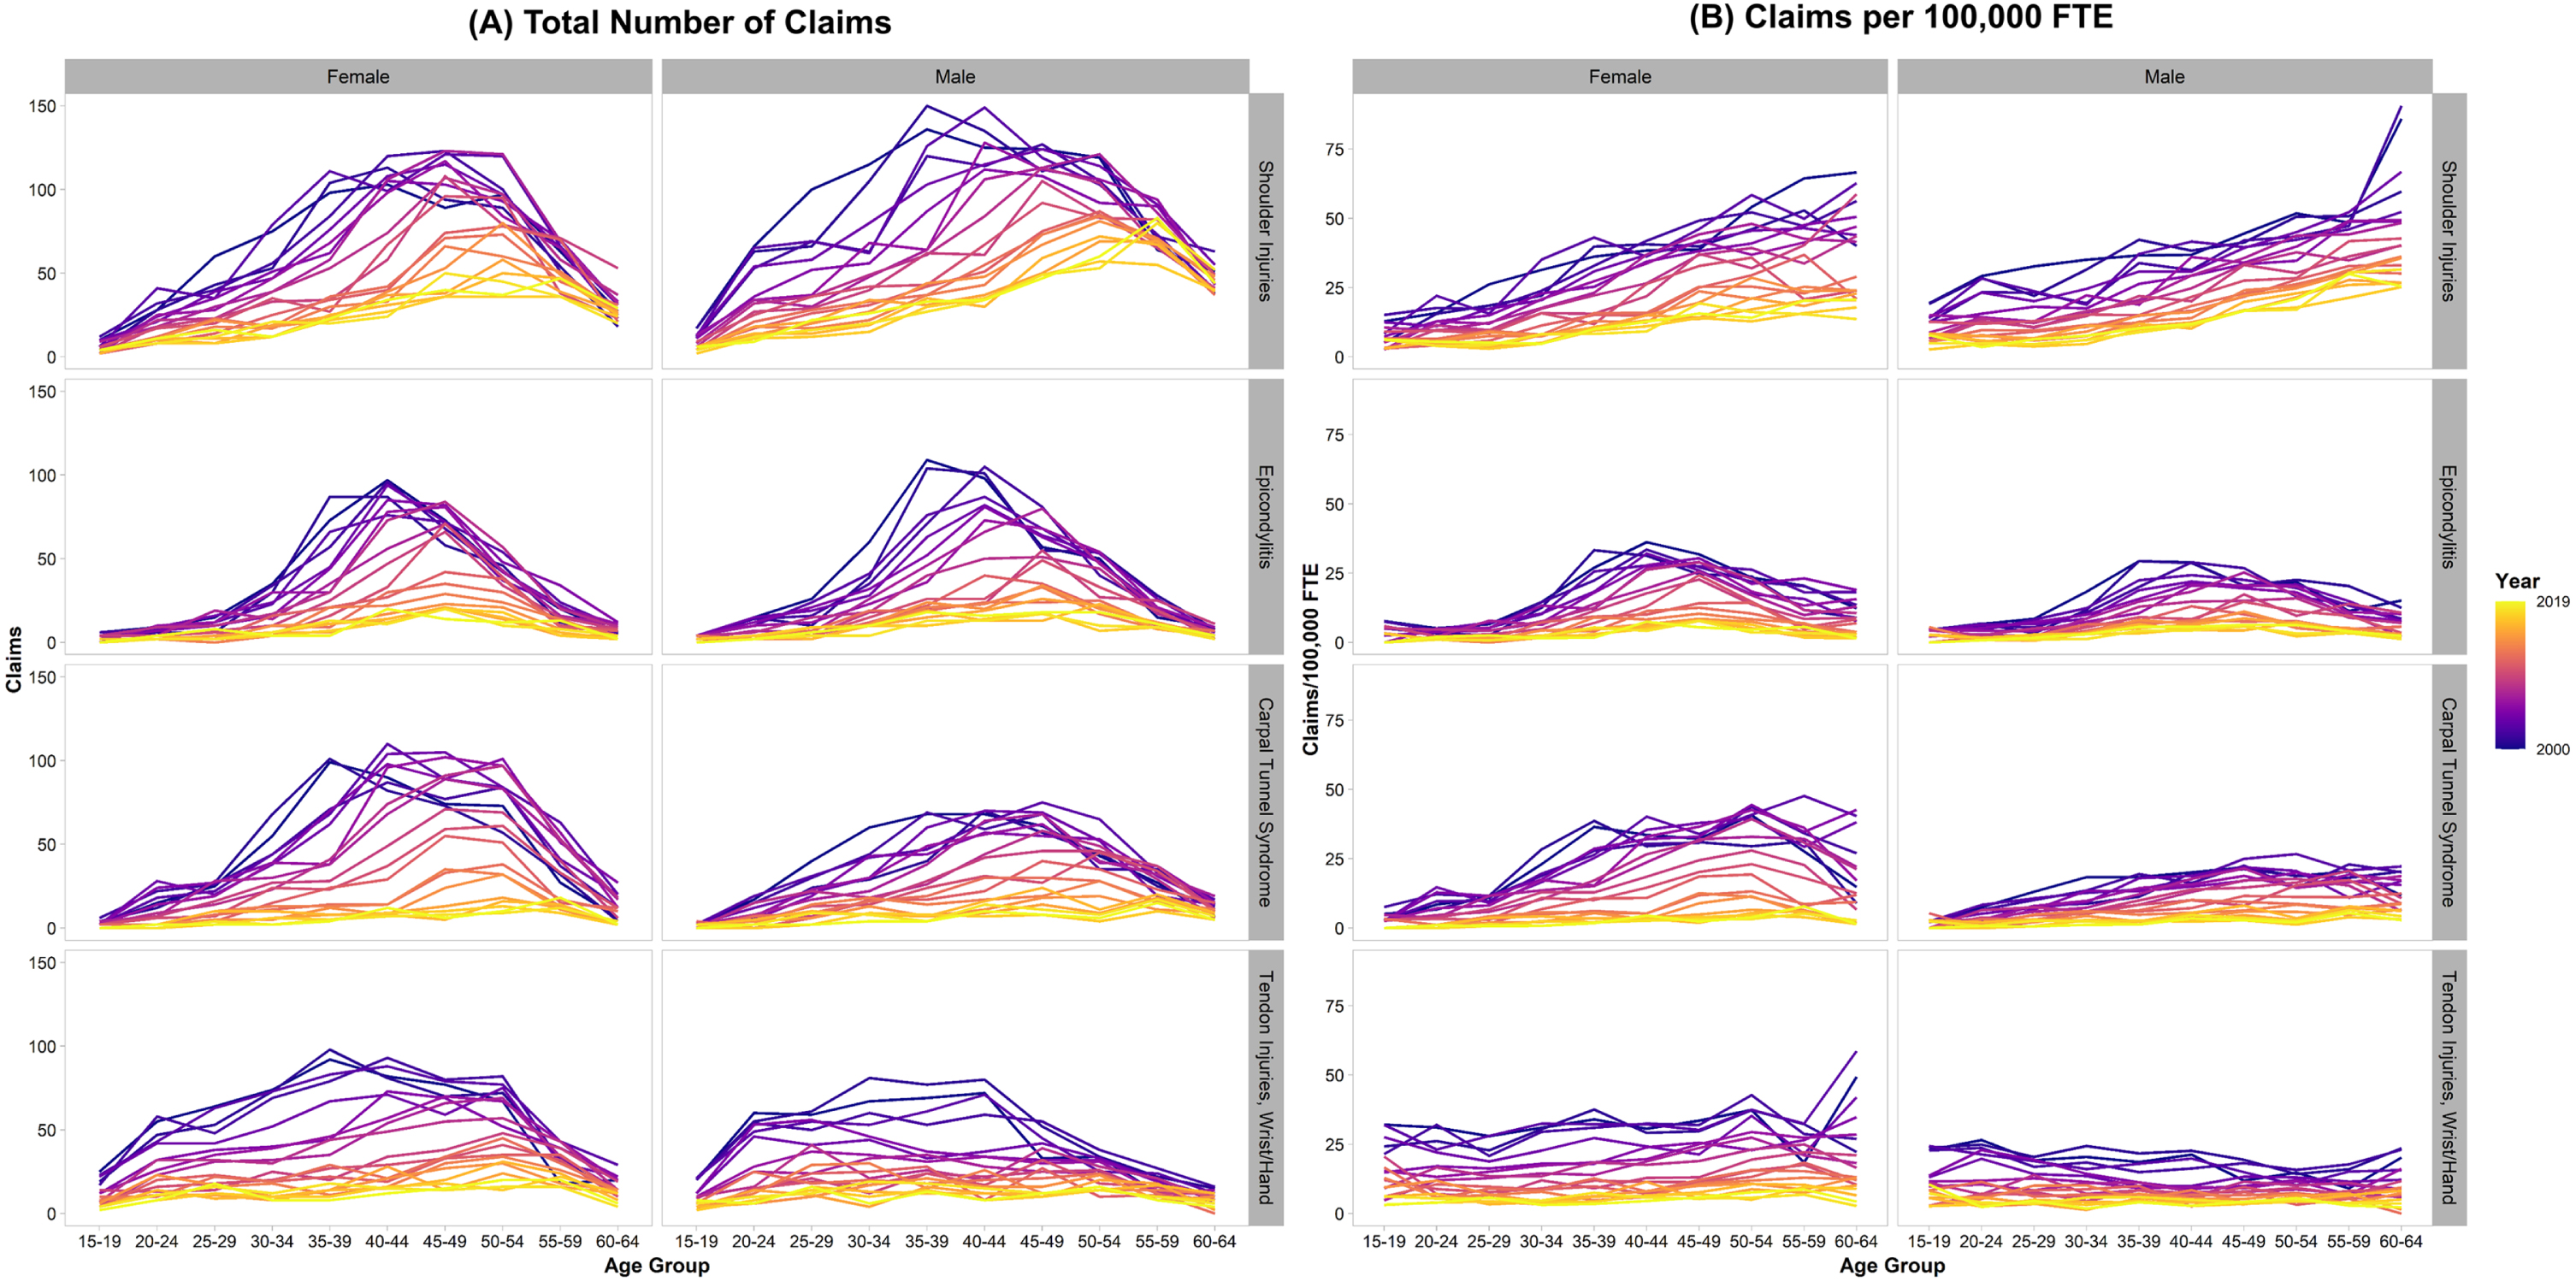
Accepted workplace lost-time injury claims with a specific injury classification in Ontario from 2000–2019 by the worker’s age group. The left panel (A) displays the total number of claims, and the right panel (B) displays claims normalized to 100,000 full time equivalents (FTE). Claims are categorized by the type of injury based on the nature of injury and injured body part: Shoulder injuries (1st row), epicondylitis (2nd row), carpal tunnel syndrome (3rd row), and tendon injuries of the wrist/hand (4th row). Claims are grouped by the year in which they were accepted (earlier years are in purple, more recent years are in yellow), and the worker’s sex (females = left column, males = right column).
Overall, rates of injury claims (i.e., claims per 100,000 FTE) for soft tissue shoulder injuries have decreased over time for both males and females (main effect of year, β= –1.594, p < 0.001). On average, males had a slightly higher rate of claims than females, with the gap increasing between 2000–2019 (main effect of sex, β= 1.662, p < 0.001; sex×year interaction, β= 0.049, p < 0.001). Although rates of claims increase with age (main effect of age, β= 0.731, p < 0.001), the effect of age is dependent upon time, with the increase in rates of claims among older worker groups compared to younger groups diminished in recent years versus 20 years ago (age×year interaction, β= –0.046, p < 0.001). Although the effect of age was similar across both males and females, with no significant interaction between age and sex (p = 0.404), we observed that the diminishing age effect over time is larger among females than males (age×sex×year interaction, β= 0.017, p < 0.001). In Fig. 1, the interactive effects of age, sex and year can be observed by the relationship between claims and age becoming flatter over time and at a slightly faster rate among females than males.
Epicondylitis
Overall, rates of epicondylitis claims have decreased over time (main effect of year, β= –1.296, p < 0.001). Like soft tissue shoulder injuries, rates of epicondylitis claims generally increased with age, with the effect of age diminishing over time (main effect of age, β= 0.240, p < 0.001; age×year interaction, β= –0.020, p < 0.001). However, rates of epicondylitis claims did not increase linearly with age, but rather followed an inverted quadratic curve, increasing with age, peaking in the 45–49-year-old age group, and decreasing in the older ages (main effect of age2, β= –0.0189, p < 0.001). The effect of age2 also diminished over time such that a more even distribution of rates of claims across age groups is seen in recent years (age2×year, β= 0.00181, p < 0.001). This can be observed as a flattening of the age curve in Fig. 1.
Carpal tunnel syndrome
Overall, rates of CTS claims have decreased over time (main effect of year, β= –1.907, p < 0.001). Similar to epicondylitis, although rates of CTS claims generally increased with age, reaching a peak in the 40–45-year-old age group before declining in the older age groups (main effect of age, β= 0.413, p < 0.001, main effect of age2, β= –0.0163, p < 0.001), the effect of age and age2 diminished over time, resulting in more even CTS claim rates across age groups (age×year interaction, β= –0.041, p < 0.001; age2×year interaction, β= 0.00188, p < 0.001). In general, although females had higher rates of CTS claims than males (main effect of sex, β= –6.706, p < 0.001), the gap in rates of claims between males and females was dependent on age, with the greatest disparity between sexes occurring among the 45–49- and 50–54-year-old age groups (age×sex interaction, β = –0.156, p < 0.001; age2×sex, β= 0.00905, p < 0.001). Furthermore, the gap between rates of claims for males and females has diminished over time (sex×year, β= 0.907, p < 0.001). The narrowing of the gap between male and female claim rates occurred to the greatest extent in the 45–49- and 50–54-year-old age groups, in which rates of claims declined faster for females than males (age×sex×year, β= 0.021, p < 0.001).
Tendon wrist and hand
Overall, the claim rates for tendon injuries of the hand and wrist have decreased over time (main effect of year, β= –1.575, p < 0.001). On average, there are more claims among females than males (main effect of sex, β= –6.615, p < 0.001); however, this sex difference has diminished over time (sex×year, β= 0.706, p < 0.001). Specifically, the difference in relative claims between females versus males was larger 20 years ago compared to recent years. Although a main effect of age was found (β= 0.176, p < 0.001), the relationship between claims and age was dependent upon sex (age×sex interaction, β= –0.225, p < 0.001). Older females display greater rates of claims than younger females. The opposite is true of males, who display decreases in rates of claims with increasing age. It should be noted that for both females and males, the effect of age has diminished over time, such that the increase in claims with age in females and the decrease in claims with age in males is not as large in recent years compared to 20 years ago (age×sex×year interaction, β= 0.02, p < 0.001). In Fig. 1, the interactive effect between age, sex, and year is evidenced by the increasing (or decreasing) relationship between claims and age in females (or males) becoming more horizontal over time.
Non-specific claims
Absolute and relative claims due to non-specific injury categories are presented in Fig. 2 by body part, age, sex, and year. Although no statistical tests were performed on non-specific injuries, it appears that the rates of claims due to non-specific injuries decreased between 2000–2010. Between 2010–2019, rates of non-specific hand and wrist claims have shown no substantial increase or decrease. In contrast, rates of non-specific arm and shoulder claims have slightly increased between 2014–2019.

Accepted workplace lost time injury claims with a ‘non-specific injury’ classification in Ontario from 2000–2019 by the worker’s age group. The left panel (A) displays the total number of claims, and the right panel (B) displays claims normalized to 100,000 full time equivalents (FTE). Claims are categorized by the injured body part: Shoulder injuries (1st row), arm injuries (2nd row), and finger/hand/wrist injuries (3rd row). Claims are grouped by the year in which they were accepted (earlier years are in purple, more recent years are in yellow), and the worker’s sex (females = left column, males = right column).
The objective of this study was to evaluate the effects of sex and age on lost-time injury claims of soft tissue shoulder injuries, epicondylitis, CTS, and tendon-related injuries of the wrist/hand in Ontario between 2000–2019. A recent analysis of work-related injuries in Ontario reported declining rates of claims due to non-traumatic and traumatic musculoskeletal disorders between 2004–2011 [30]. The results of our study indicate a continuation of this trend, as evidenced by a decreasing injury claim rate in all four groups of repetitive strain injuries. Non-specific claims also declined between 2000–2010. However, between 2010–2019 rates of non-specific claims at the hand and wrist have stabilized and rates of claims at the arm and shoulder have increased. The results of this study also indicate that there were differences in rates of claims between the sexes and age groups. However, these differences were generally more pronounced 20 years ago than in recent years. Overall, the results of this study indicate that rates of reported, compensable workplace upper extremity disorders have declined in Ontario over the past 20 years and that the burden of such disorders based on demographic groups has changed dramatically during this period.
This study found that rates of shoulder injuries, epicondylitis, CTS, and tendon disorders of the hand/wrist fell precipitously between 2000 to 2019, declining by 60.6%, 77.5%, 86.7%, and 78.9%, respectively, compared to just 32.4% for non-specific UE claims. The most recent study of WSIB Ontario also indicated declining rates of lost time claims due to all MSDs between 2004–2011 [30]. Similar declines in rates of upper extremity lost time injury claims have been observed in Washington State and California’s workers’ compensation systems [21, 27–29]. In Washington State, between 1999–2013 rates of rotator cuff syndrome, epicondylitis, tendinitis of the hand/wrist, and CTS decreased by 1.2%, 6.3%, 4.8%, and 6.2% per year respectively [21]. There are many factors which may have contributed to a decline in rates of upper extremity lost time injury claims. First, it is possible that exposure to biomechanical risk factors for upper extremity MSDs has decreased in Ontario workplaces over the past 20 years. However, no longitudinal studies of workplace exposures in Ontario have been conducted recently. Another possible factor in declining rates of claims is that fewer workplace upper extremity disorders are resulting in compensation claims. The underreporting of workplace injuries has been reported by multiple studies across industries and jurisdictions [38–42]. Shannon and Lowe found that 40% of Canadian workers who incurred a compensable injury did not file a claim [41]. Workers may choose not to file a claim because of the severity of the injury, fear of retaliation from the employer, or not knowing about workers’ compensation coverage [41, 42]. Unfortunately, it is not possible to determine the cause of declining rates of upper extremity lost time injury claims without the mass surveillance of biomechanical exposures in Ontario workplaces.
As rates of lost-time injury claims due to upper extremity disorders have declined, the effects of age and sex have diminished. In 2000, females had higher rates of claims of epicondylitis, CTS, and tendinitis of the hand/wrist than males, while males had higher rates of shoulder injuries. Rates of shoulder injuries and tendon injuries of the wrist/hand increased linearly with age, while rates of CTS and epicondylitis increased with age, peaking in the 45–49- and 50–54-year-old age groups, and decreasing in the older age groups. These results are consistent with the most recent study of the effects sex and age on Ontario workers’ compensation claims by Zakaria (2002) [26]. However, over the past 20 years, the sex and age specific differences in rates of upper extremity claims have become less pronounced. Studies have consistently identified females and older workers to have a greater incidence of workplace upper extremity disorders than males and younger workers [18–24]. Further, females are associated with biomechanical and physiological risk factors for CTS such as smaller carpal tunnel cross sectional area, and hormone related menopausal symptoms [43, 44]. While sex effects on the prevalence of rotator cuff tears and epicondylitis have not been consistently identified, females may experience work-related RSIs at higher rates than males due to psychosocial factors. Females are found to have lower levels of autonomy at work and perform more repetitive tasks than males with the same job [45, 46]. It is plausible that generally low rates of claims are obscuring sex and age effects in recent years. As discussed above, rapidly declining rates of specific upper extremity claims may be attributed to lower rates of injury reporting, low rates of compensation awarded for specific reported injuries, or declining rates of workplace injuries. It is also plausible that compensable cases of soft tissue shoulder injuries, epicondylitis, CTS, and tendon related injuries of the wrist/hand, have been categorized as non-specific upper extremity disorders which have declined to a smaller degree.
It is important to consider the results of this study in light of a few limitations. First, compensation claims can underestimate the true incidence of work-related MSDs. Only accepted lost-time injury claims were considered in this study. Thus, denied claims, underreporting by workers or employers (due to a lack of knowledge of workers’ compensation coverage, fear of job or income loss), MSDs not severe enough to result in lost time claims, and not capturing workers outside of the compensation system (e.g., unpaid family workers and independent contractors) were not included. Second, the use of administrative data to estimate injury rates allows for the possibility of misclassification. We found several instances of misclassification of injuries based on the nature of injury and body part (Table 2). Third, the WSIB does not publish detailed statistics about worker coverage by demographic, thus normalizing the data required us to make assumptions using generalized labour force data. The use of labour force statistics for normalizing is also subject to several limitations. Irregularities in hours worked due to labour disputes, holidays, or unexpected economic events occur. The impact of these irregularities was investigated by Webber in 1994 [47]. Webber found that over a five-year period, the total annual hours worked estimated by the labour force survey was impacted by –1.0% to +1.5%.
Conclusions
This detailed analysis of age and sex on lost-time injury claim rates in Ontario from 2000–2019 found that rates of upper extremity claims declined significantly across all sex and age groups. The most significant declines in rates of claims were observed for epicondylitis, CTS, and tendinitis of the wrist/hand. Along with the decline in overall claim rates, disparities in rates of claims between sex and age groups have been reduced. Again, this effect was most severe for epicondylitis, CTS and tendinitis of the wrist/hand, injuries known to affect older workers and females at higher rates. Despite rates of claims from the four major injuries analyzed in this study falling precipitously from 2000–2019, work-related upper extremity MSDs remain a massive burden on Ontario workers. The majority of upper extremity claims over the past two decades were non-specific injuries, which declined by a much smaller margin. Future studies should expand our analysis to all of Canada, to examine whether the findings of this study are unique to Ontario’s workers compensation system.
Ethics statement
No ethics review or approval was sought, as the data was available online as per request and no identifying information was collected or requested by the researchers.
Conflict of interest
The authors declare that they have no conflict of interest.
Footnotes
Acknowledgments
The authors are grateful to the Association of Workers’ Compensation Boards of Canada (AWCBC) and the National Work Injury/Disease Statistics Program (NWISP) for providing the dataset. Specifically, they would like to thank Jilal Jemal and Kelvin Yang for preparing the data upon their request. All interpretations of AWCBC/NWISP data are those of the authors and not those of the AWCBC or any of its member Boards or Commissions.
Funding
This work was supported by research funding from the Natural Sciences and Engineering Research Council of Canada (NSERC Discovery Grant RGPIN-2016-06460 to Peter J. Keir and an NSERC CGS-D to Daanish M. Mulla).