
Abstract
Introduction
Dual-energy imaging has long been used for material identification, and the principles and analytical methods for density measurements using material decomposition have been previously reported [1, 2]. The fundamental principle underlying dual-energy imaging is that the mass attenuation coefficients of various materials can be expressed using two different basis materials. In other words, assuming that the mass attenuation coefficients of each basis material are known, the density of each material can be determined via computed tomography (CT) using two types of tube voltages; therefore, two basis materials (hereafter referred to as the material basis pair) can be expressed as density images.
The recent popularization of dual-energy CT has led to the application of this technology to the differential diagnosis of benign and malignant tumors via differential imaging with iodine contrast mediums [3]. In a previous study of dual-energy CT-based fat measurements, Li et al. [4] studied phantoms containing porcine liver and fat mixtures using dual-energy CT and reported that the changes in the attenuation curve obtained using virtual monochromatic X-ray imaging were correlated with the changes in the fat content. In another study, Zheng et al. [5] measured the fat content using virtual monochromatic X-ray dual-energy subtraction imaging technology. In addition, Patel et al. [6] used a rapid kilovolt peak-switching dual-energy (RSDE) CT with a contrast medium on hepatic steatosis patients and found that the fat content values were correlated with the liver-spleen difference in Hounsfield units (HU). The fat density threshold for clinically significant steatosis was calculated using the receiver operating characteristic (ROC) analysis, even though the correlation between the fat content of a patient and the CT values in unenhanced CT images was found to be inadequate for diagnosis [6]. Even though these reports described the effectiveness of a relative density measurement and its correlation with fat content, they failed to address the accuracy of the fat density measurement. This is an important issue because CT diagnostic imaging for fatty liver has a general sensitivity of 43–95% and a specificity of 90%; for intrahepatic fat contents below 30% wet weight, the reliability of CT diagnostic imaging has been reported to be poor [7–9].
In this study, which aims to accurately diagnose the progression of fatty liver, the “intrahepatic fat content” was replaced by phantoms with variable fat and liver contents with known properties, and the RSDE measurement accuracy was evaluated via a statistical analysis. Dual-energy CT was then performed to develop a noninvasive and nonenhanced image diagnosis method for quality assurance when assessing the progression of fatty liver. We prepared a phantom with a homogenous fatty component to test the fat density and used dual-energy CT to assess the accuracy of the density values that corresponded to the fat content.
Materials and methods
Fat-Liver phantom
To quantify the intrahepatic fat content, we created lard-liver phantoms with additional fat contents ranging from 0% (liver: 100%) to 100% (liver: 0%) with extra fat contents of 1%, 3%, 5%, 10%, 20%, and 30%. These values were chosen because the fatty liver threshold is defined as a fat (triglyceride) accumulation of 5% [10]. The porcine and lard used in this study are commonly used in the food industry. The main component of lard is fat, which is also found accumulating in liver [11]. The materials used in this study were radiologically equivalent to those found in a human liver, therefore enabling us to compare the CT values with a patient’s liver. To avoid the inclusion of air in the phantom, which would lead to erroneous CT values, mixing was performed under a quasi-vacuum state to sufficiently degas the mixture. A total of eight different phantom tubes were prepared. To calculate the mass attenuation coefficients for 0% (liver: 100%) and 100% (liver: 0%) additional fat content, the lard and liver densities were obtained from the volume and weight of the phantom materials, i.e., ρLiver = 1090.6 mg/cm3 and ρFat = 897.5 mg/cm3. The porcine liver used in this study originally had a fat content of 3.65% whereas lard consists of 100% fat [11]. Therefore, the fat content referred to in this study is the volume fraction of the extra fat added to the native fat contained in the porcine liver. Then, we used the calibrated additional fat densities as a reference in the accuracy verification for the other fat contents and obtained the following results: 0% : 0 mg/cm3, 1% : 10.4 mg/cm3, 3% : 31.2 mg/cm3, 5% : 51.9 mg/cm3, 10% : 102.9 mg/cm3, 20% : 201.4 mg/cm3, 30% : 297.1 mg/cm3, and 100% : 897.5 mg/cm3. Hereafter, the fat densities specified above are referred to as the “reference densities (ρr).” The tubes enclosing the fat-liver mixtures were installed in a 200-mm, liver-equivalent cylindrical phantom (Model: LSCT-001, Kyotokagaku, Kyoto, Japan).
CT image acquisition
X-ray CT images were obtained using a Discovery CT750 HD scanner (Application Software 11MW44.11.V40_PS_HD64_G_GTL, General Electric Healthcare, Waukesha, WI, USA). The scanning procedure involved RSDE imaging that periodically switched between voltages of 140 kVp and 80 kVp and single-energy CT (SECT) imaging [3–6]. Data were acquired at a pitch factor of 0.984 with detector collection rows of 0.625×64 mm2 (with a beam width of 40 mm), a large bow-tie filter, an image slice thickness of 5 mm, and a standard image reconstruction function. The same transverse plane of the phantom was scanned five times to compute the average and standard deviation of the CT values. In addition, the computed tomography dose index volume (CTDIvol) was varied (8.91 mGy, 10.18 mGy, 12.09 mGy, 14.79 mGy, and 17.49 mGy) to investigate the effect of the scan dose on the measurement accuracy.
For comparisons with images taken using conventional CT methods, imaging was conducted using SECT with tube voltages of 80 kVp, 100 kVp, 120 kVp, and 140 kVp. To address the concerns related to the effective energy fluctuation, we examined the reproducibility of the effective energies using a silicon semiconductor detector (X2 R/F SENSOR, RaySafe, Billdal, Sweden) for five repeated measurements. The resulting effective energy ranges were 45.48±0.02 keV, 50.33±0.02 keV, 54.38±0.00 keV, and 57.40±0.02 keV at 80 kV, 100 kV, 120 kV, and 140 kV, respectively. During the phantom scan, the auto exposure control (AEC) noise index was set to 11. Based on consultations with our radiologists, this value is chosen for use in daily clinical practice as the minimum radiation dose necessary to obtain readable images.
The other scanning conditions were the same as for the RSDE measurements. For the image analysis, the Advantage Workstation software package (AW, Version_AW4.5_02.113_CTT_5.X, General Electric Healthcare, Waukesha, WI, USA) was employed. Of the several functions provided by AW, the Gemstone Spectral Imaging (GSI) viewer performed the material decomposition analysis and produced the density images.
Theory of material density imaging [12]
In RSDE, preforming material decomposition requires the mass attenuation coefficients of the base materials, the liver and fat in our case, to be known in advance for use as a basis material pair. The mass attenuation coefficients were calculated according to the following procedure. First, the fat density phantom was imaged using RSDE CT to obtain CT images. Then, regions of interest (ROIs) were set on the phantom regions of the liver or fat alone to measure their CT values, which were then converted to the linear attenuation coefficients for the liver and the additional fat in the virtual monochromatic images (40–140 keV) generated by the GSI viewer of AW [13]. Using the calibrated values of the liver and fat densities of the phantom, we then computed the mass attenuation coefficients from 40 keV to 140 keV. Once the mass attenuation coefficients of the liver and fat are obtained, they can be used as additional pairs of basis materials by feeding them into the GSI viewer.
The fat and liver density distributions were obtained using the following equations:
where 1 - α is the volume fraction of the fat in the phantom,ρis the phantom density, ν is the mass attenuation coefficient, E is the effective energy, and the subscripts Fat, Liver, L, and H refer to fat, liver, low energy, and high energy, respectively. The intensity of the density image indicates the volume-weighted density of the fat or liver in mg/cm3. ROI in approximately the same area for each material were set for the material density images reconstructed from the transverse sections, and the fat density was measured. Hereafter, we refer to the RSDE measurements as the “measured values (ρ M ).” These measurements were compared with the previously measured reference values to verify the measurement accuracy, which was defined as the difference between the reference and measured values and is given by (ρM - ρ r )/ρ r .
All data were analyzed using the Tokei–Kaiseki version 2.0 and the Tahenryo–Kaiseki version 2.0 for Mac software packages (Esumi Ltd, Tokyo, Japan). A regression analysis using an ordinary least squares method was performed for the CT values against the photon energy. R-square (R2) represents a determination coefficient calculated via a regression analysis. A simple linear regression using an ordinary least squares method was performed for the CT values against the reference fat densities. The statistical significance of the measured fat densities against the 0–5% fat fraction was explored using Welch’s t-test. Similarly, the measured linear attenuation coefficients for the cases with 0–100% fat content for 80 kVp (effective energy: 45 keV) and 140 kVp (effective energy: 57 keV) in RSDE were also compared using Welch’s t-test. The slope and intercept of the regression line between the measured fat density and the reference fat density were tested against the null hypothesis of slope = 1.0 and intercept = 0.0. All values are expressed as mean±standard deviations. A P-value of < 0.05 was considered to be statistically significant in the two-sided test.
Results
SECT and RSDE images
Figure 1(a) shows an overview of the phantom, Fig. 1(b) shows a SECT image at 120 kVp, and Fig. 1(c) shows a fat density image obtained from RSDE. The phantom tubes containing 0%, 1%, 3%, 5%, 10%, 20%, 30%, and 100% fat in the homogenized porcine liver were placed clockwise around the centerline. An inspection of Fig. 1(b) shows that the CT values decreased with increasing fat content. In Fig. 1(c), the intensity tended to increase as the fat content increased because the image represents the fat density. A total of 10 slices in the longitudinal direction for all phantoms were scanned at intervals of 5 mm at 120 kVp to test the uniformity. The CT value, standard deviation, and coefficient of variation were 0% : 74.883±1.002 coefficient of variance (CV), 0.013; 1% : 74.161±1.092 CV, 0.015; 3% : 70.753±1.407 CV, 0.020; 5% : 66.370±1.724 CV, 0.026; 10% : 55.913±1.613 CV, 0.029; 20% : 34.217±1.341 CV, 0.039; 30% : 9.868±0.464 CV, 0.047; and 100% : –114.243±1.217 CV, 0.011, respectively. The obtained standard deviations of the fat density during the 5 scans at a dose of 12.09 mGy were±2.8 mg/cm3,±2.8 mg/cm3,±3.4 mg/cm3,±2.6 mg/cm3,±2.6 mg/cm3,±7.9 mg/cm3,±5.9 mg/cm3, and±7.9 mg/cm3 for 0%, 1%, 3%, 5%, 10%, 20%, 30%, and 100%, respectively.
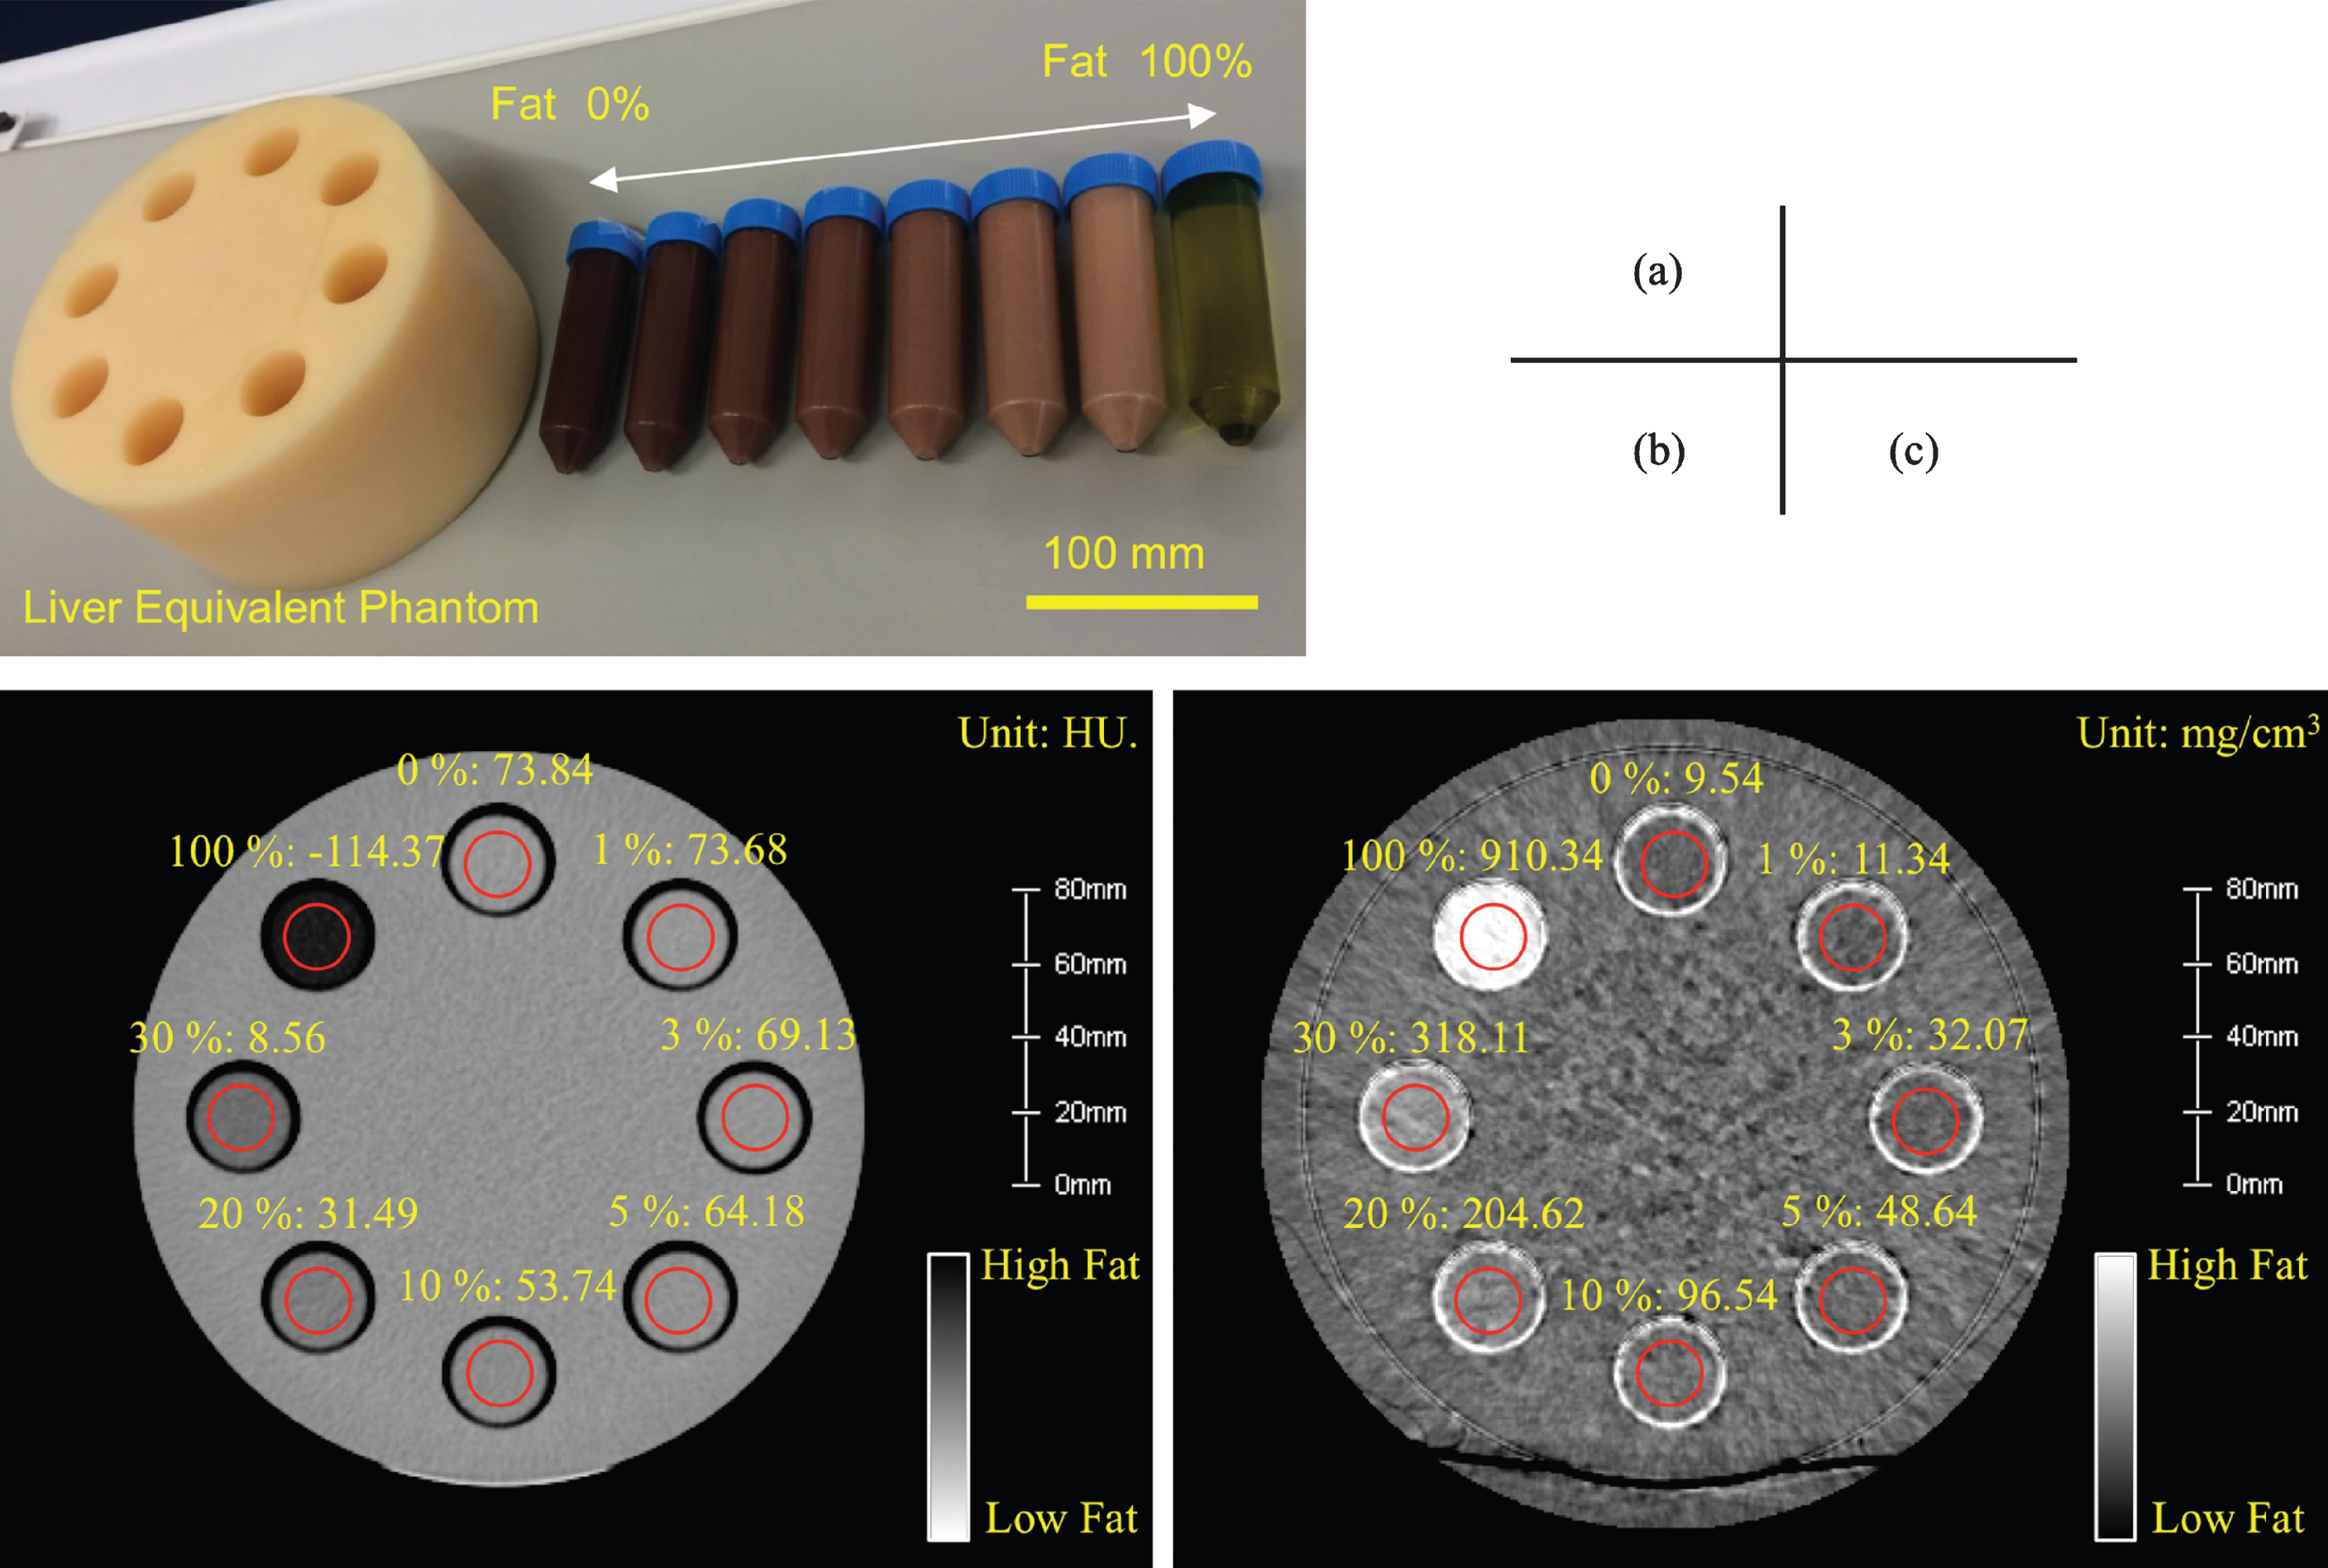
(a) Fat density verification phantom. Fat weight contents were varied in a total of eight different phantom tubes: 0%, 1%, 3%, 5%, 10%, 20%, 30%, and 100%. The fat-liver mixtures were stirred below atmospheric pressure to ensure sufficient degassing. The tubes were installed concentrically around the center of the liver equivalent phantom (diameter: 200 mm). (b) SECT image taken with a tube voltage of 120 kVp showing the CT-value distribution (Window Level: 40, Window Width: 400, and Slice Thickness: 5 mm) and the CT value measured by the ROI in the red frame. The unit is Hounsfield Unit. (c) RSDE image taken with tube voltages of 80 kVp and 140 kVp showing the fat density distribution using the fat and liver material basis pair (Window Level: 200 mg/cm3, Window Width: 1500 mg/cm3, and Slice Thickness: 5 mm) and the fat density measured by the ROI in the red frame. The unit is physical density (mg/cm3).
Figure 2 compares the spectral HU curves for liver and fat measured using RSDE and the CT values obtained using SECT for each tube voltage. The regression analysis result of the quadratic function (y = ax2 + bx+ c) for SECT and RSDE is shown in the figure. For the SECT measurements, the CT values of the liver exhibited a negative slope (coefficient a: 0.0028, coefficient b: –0.4944, R2 = 0.9669), and the CT values of fat exhibited a positive slope (coefficient a: –0.0916, coefficient b: 12.115, R2 = 0.9993). For the RSDE measurements, the liver spectral HU curve exhibited a negative slope (coefficient a: 0.0025, coefficient b: –0.499, R2 = 0.9975), and the fat spectral HU curve exhibited a positive slope (coefficient a: –0.0861, coefficient b: 12.128, R2 = 0.9998). Figure 3 illustrates the linear attenuation coefficients calculated from the CT values shown in Fig. 2. The linear attenuation coefficients of liver and fat at 54.38 keV, i.e., an effective energy of 120 kVp, were 0.2330 cm-1 and 0.1921 cm-1, respectively. Figure 4 shows the mass attenuation coefficients calculated from the linear attenuation coefficients using the actual densities measured during phantom preparation. The mass attenuation coefficients of RSDE could be calculated with an accuracy comparable to that achieved for a mass attenuation coefficient of SECT. The mass attenuation coefficients of liver and fat at 54 keV were 0.2136 cm2/g and 0.2113 cm2/g, respectively. The obtained mass attenuation coefficients in the 40–140 keV range were input into the GSI viewer and set as material basis pairs to be used in the material decomposition analysis.
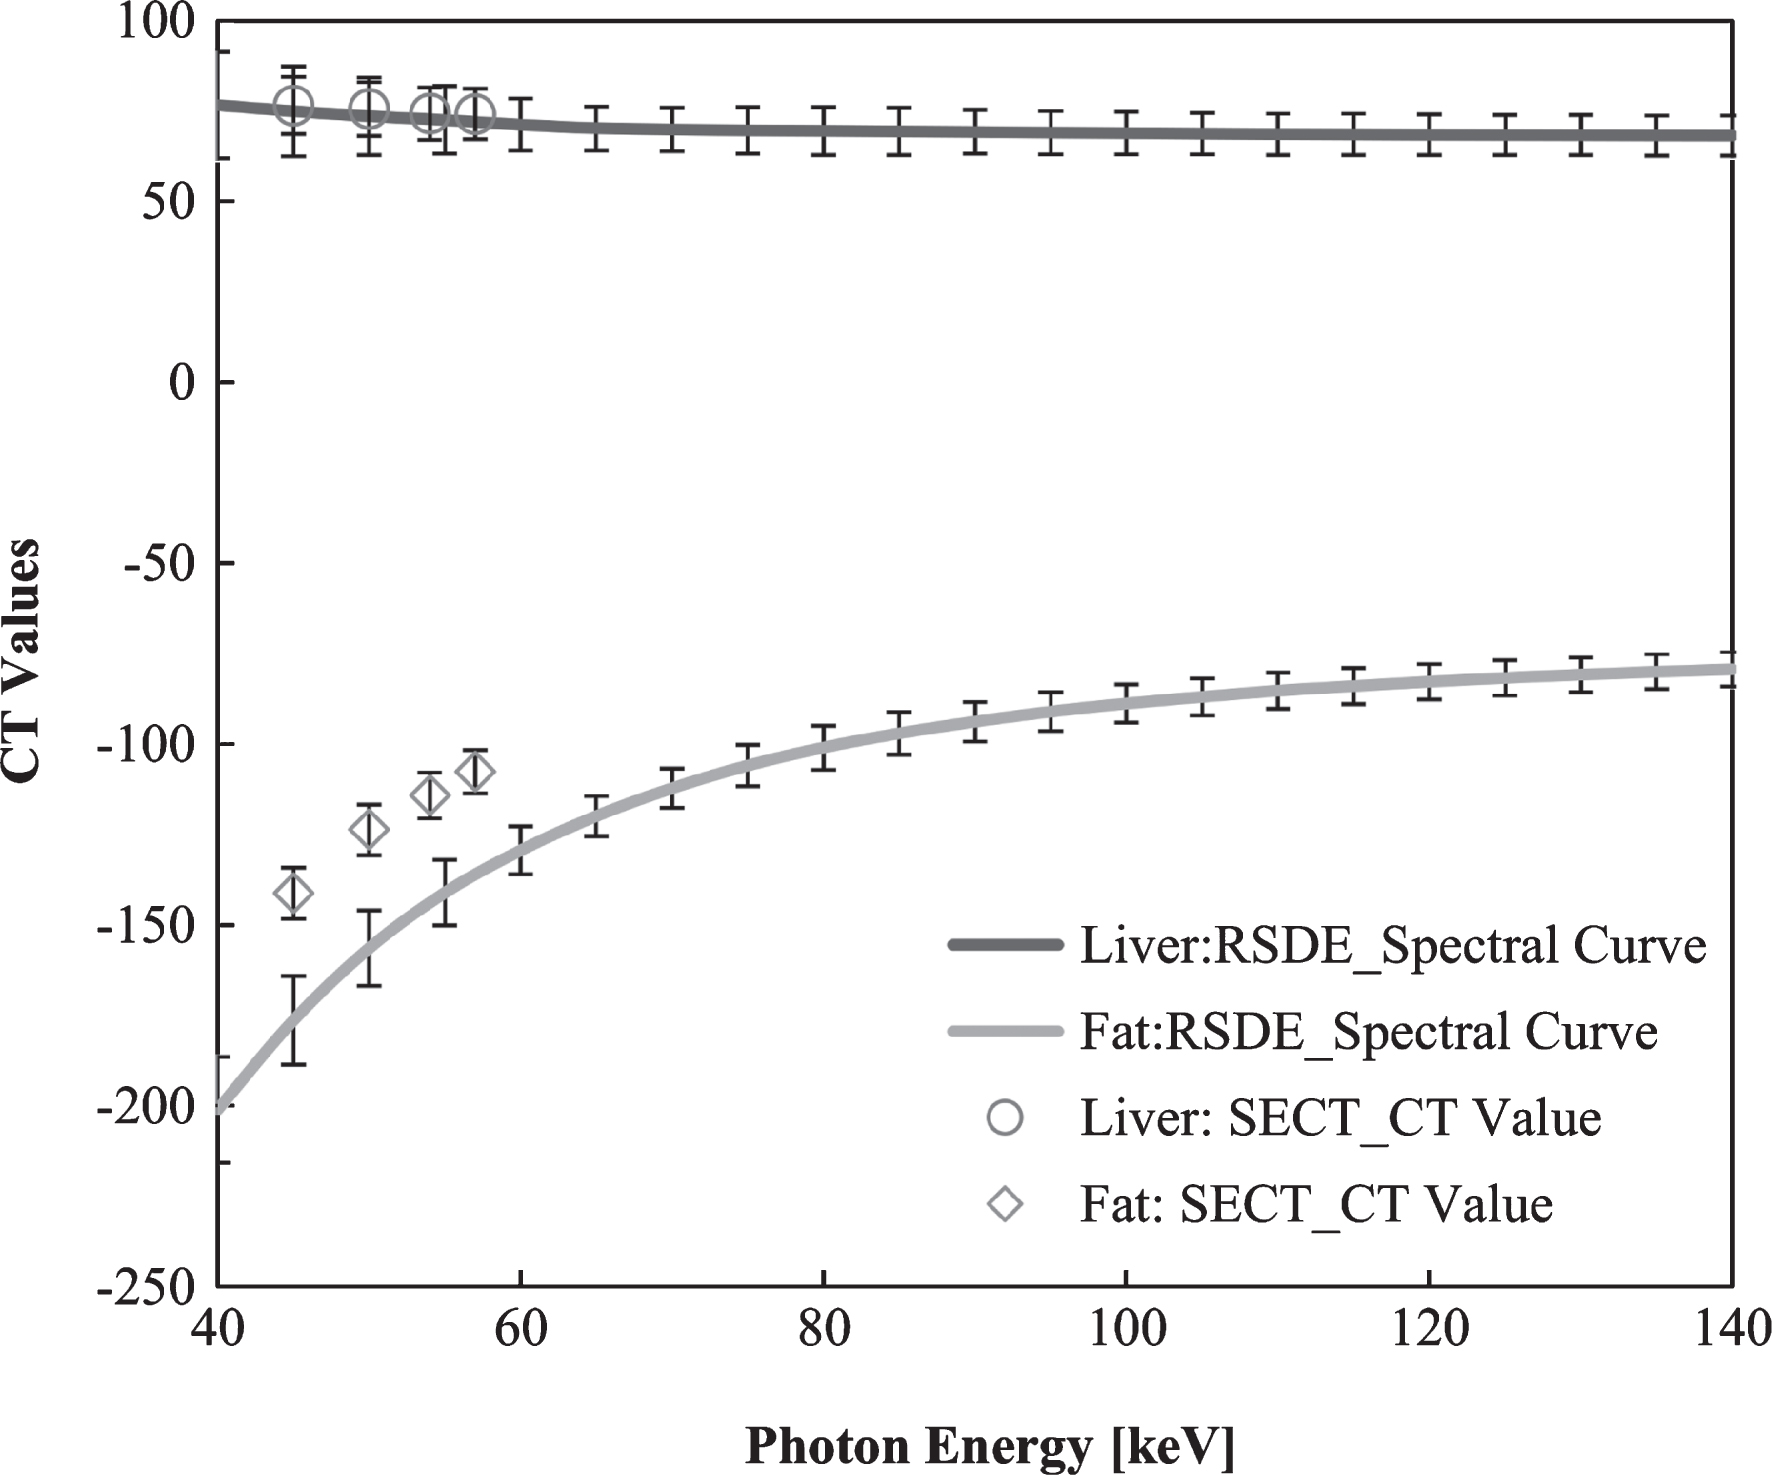
Spectral HU curves per 1 keV for liver and fat obtained with RSDE compared with the CT values obtained with SECT at the effective energies 45.48 keV, 50.33 keV, 54.38 keV, and 57.40 keV for tube voltages 80 kVp, 100 kVp, 120 kVp, and 140 kVp, respectively. The mean and standard deviations were calculated for 2356 pixels in the ROI.
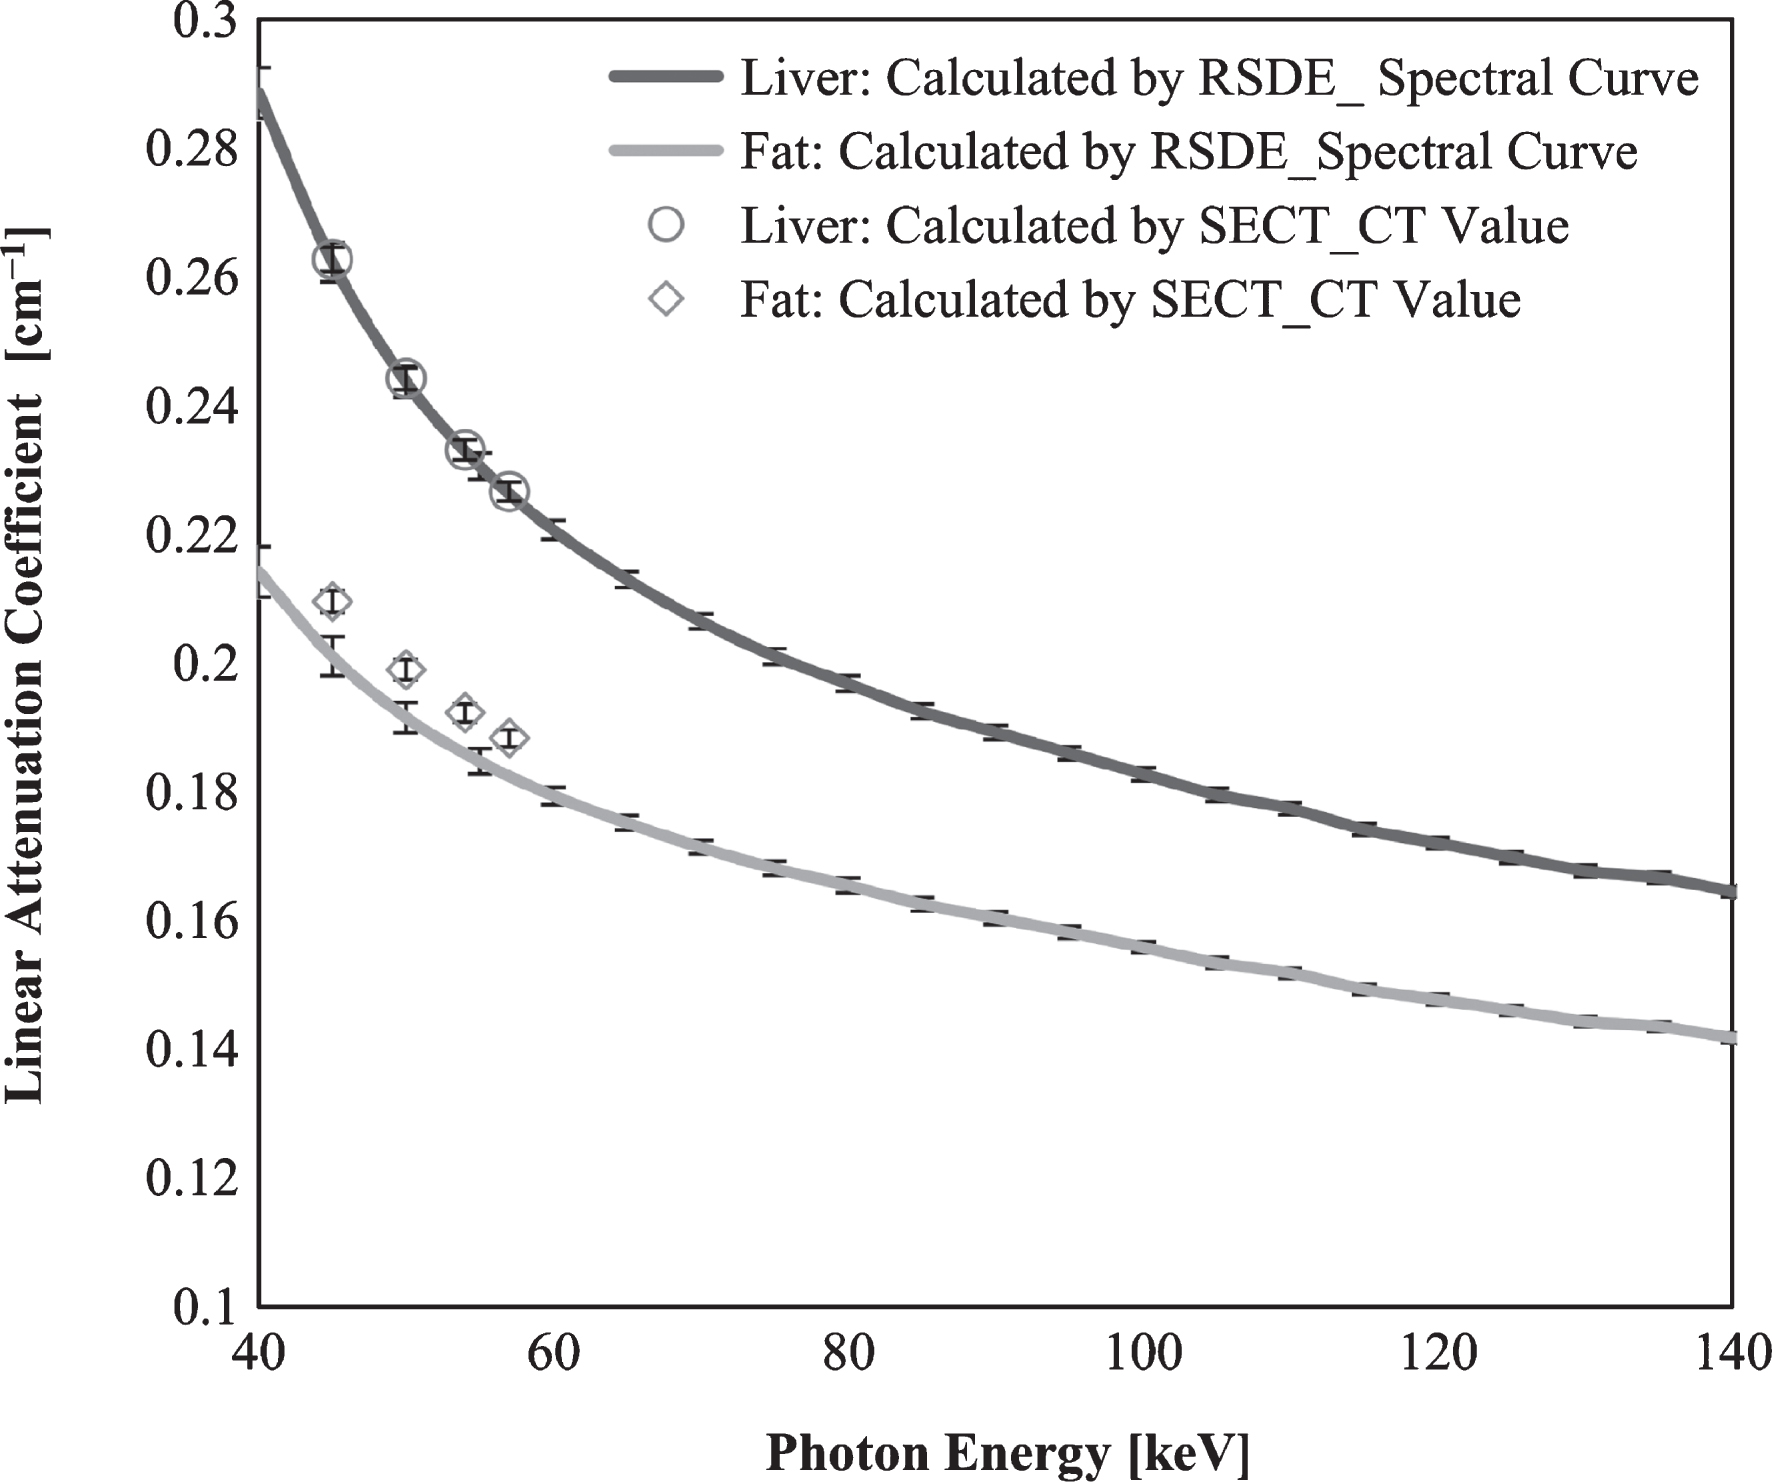
Linear attenuation coefficients per 1 keV calculated from the RSDE spectral curve and the SECT CT values for liver and fat. The mean and standard deviations were calculated for 2356 pixels in the ROI.
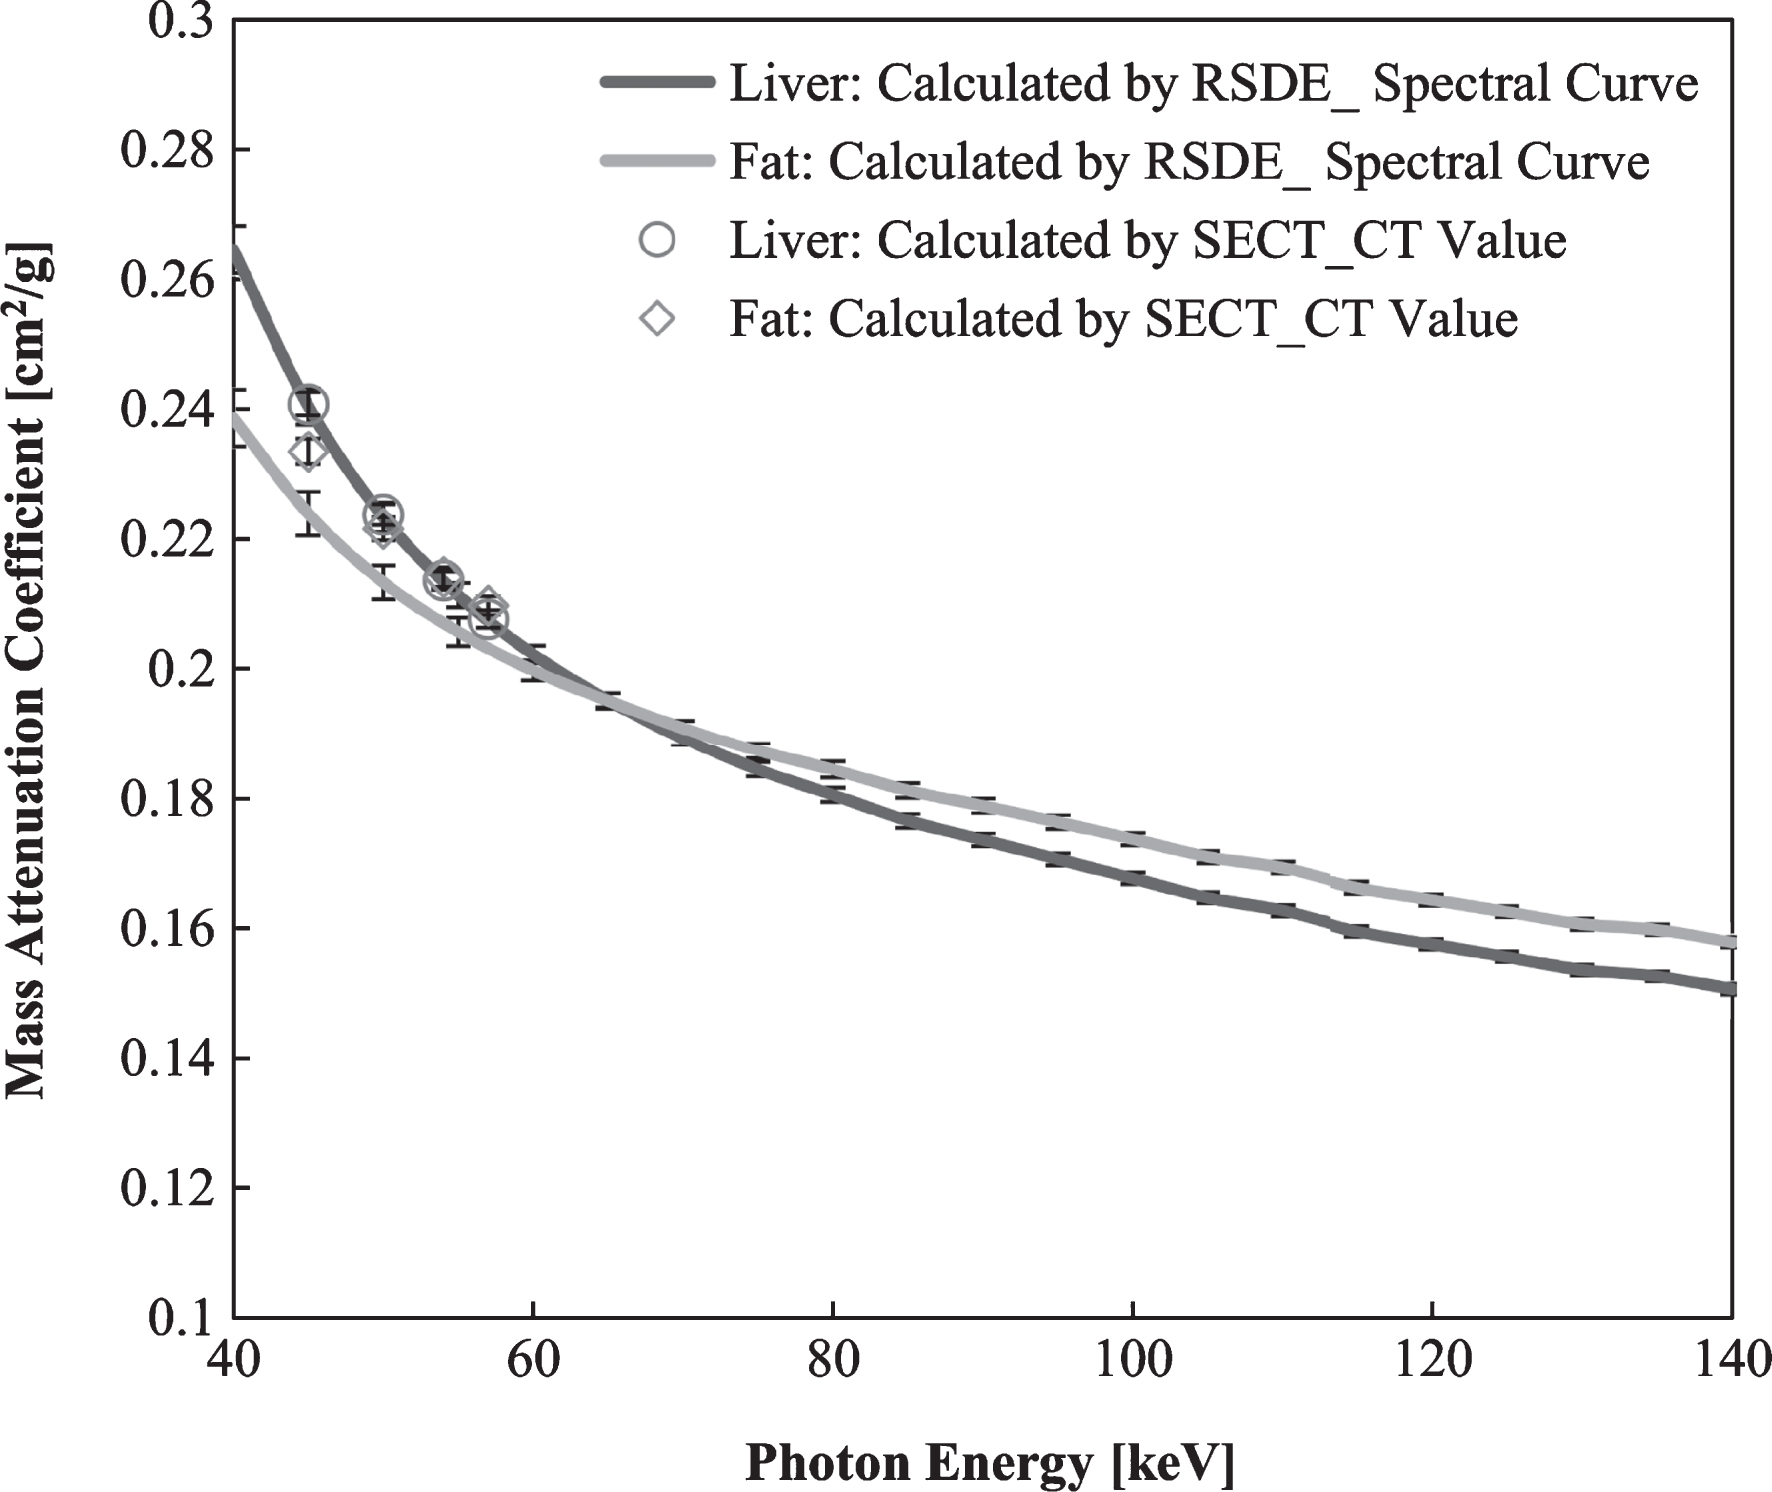
Mass attenuation coefficients per 1 keV obtained from the linear attenuation coefficients for liver and fat divided by the reference densities. The mean and standard deviations were calculated for 2356 pixels in the ROI.
Figure 5 shows the results of the comparison of the fat density reference values and the CT values obtained using the 80 kVp, 100 kVp, 120 kVp, and 140 kVp SECT images. For fat contents less than 5%, which is the threshold for fatty liver diagnosis, the CT values fluctuate with the tube voltages [10]. A regression analysis demonstrated that the slopes of the regression fitting ranged from –0.204 to –0.244 and the determination coefficient R2 value was 0.999 with a statistical significance of p < 0.001 for 80–140 kV.
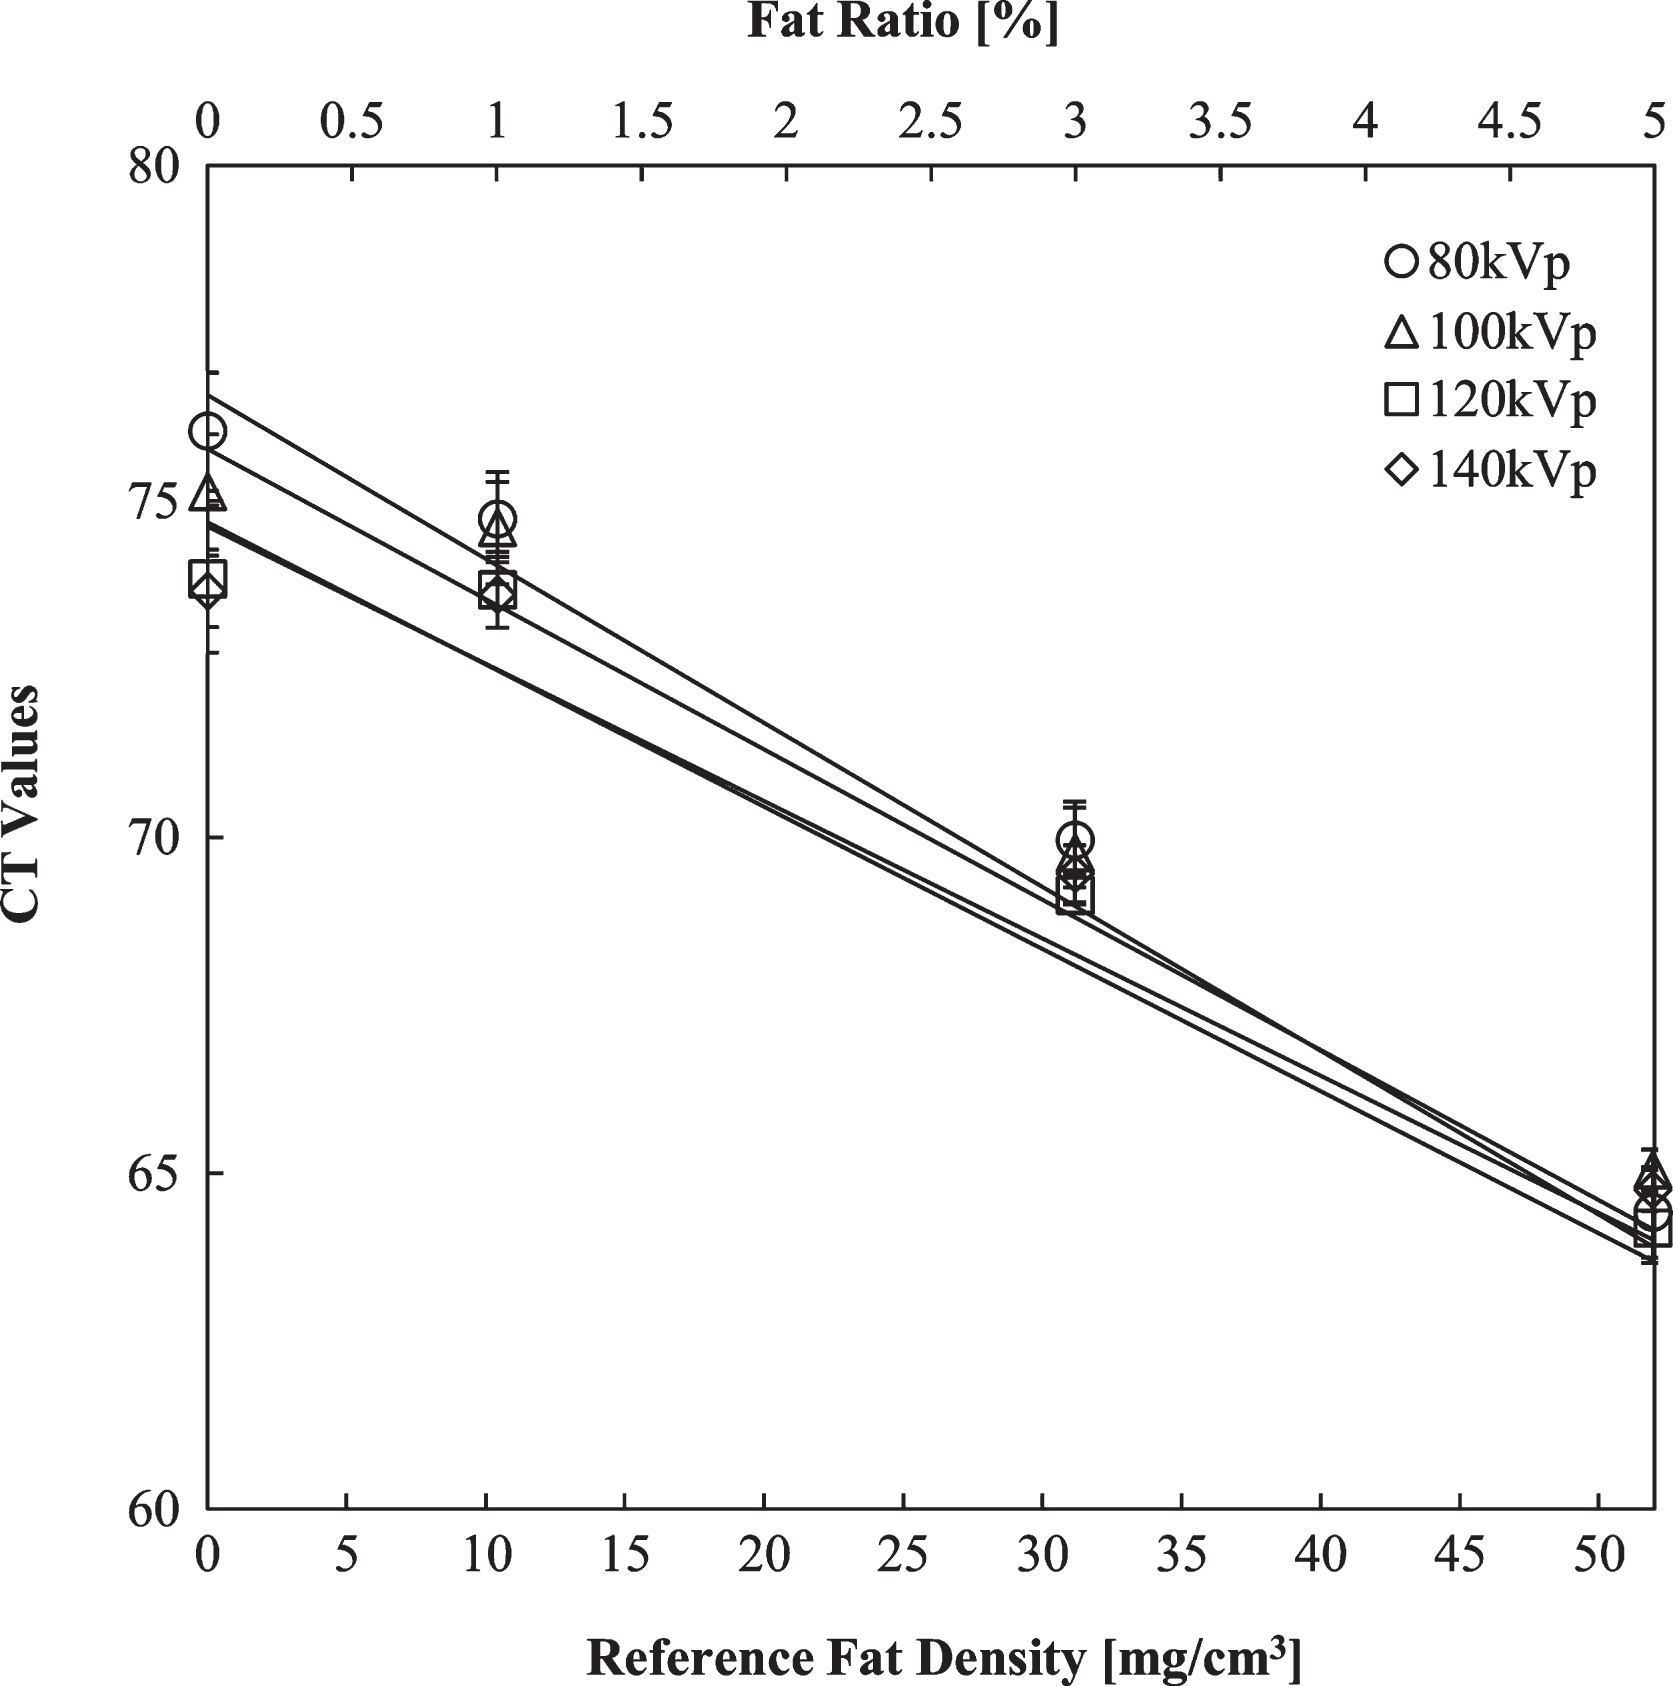
CT values and fat contents measured for the fat–liver phantom using SECT. The top axis shows the fat weight ratio and the bottom axis shows the reference fat density. The mean and standard deviations were calculated for 2356 pixels in the ROI.
Figure 6 shows a box plot of the low fat densities at 0%, 1%, 3%, and 5% fat fractions in the same transverse plane (N = 5) at 12.09 mGy together with the results of Welch’s t-test between the adjacent fat contents. This range is of particular interest for fatty liver diagnosis. For the other exposure doses, the differences between the adjacent fat contents (1–3%, 3–5%, 10–20%, 20–30%, and 30–100%) were statistically significant (p < 0.01). However, the differences between the phantoms with 0% and 1% content were not significant (p > 0.05) for all doses. Table 1 shows the averages and standard deviations of the fat densities for all fat contents and exposure doses. There is no significant difference when the radiation dose is changed from 8.91 mGy to 17.49 mGy.
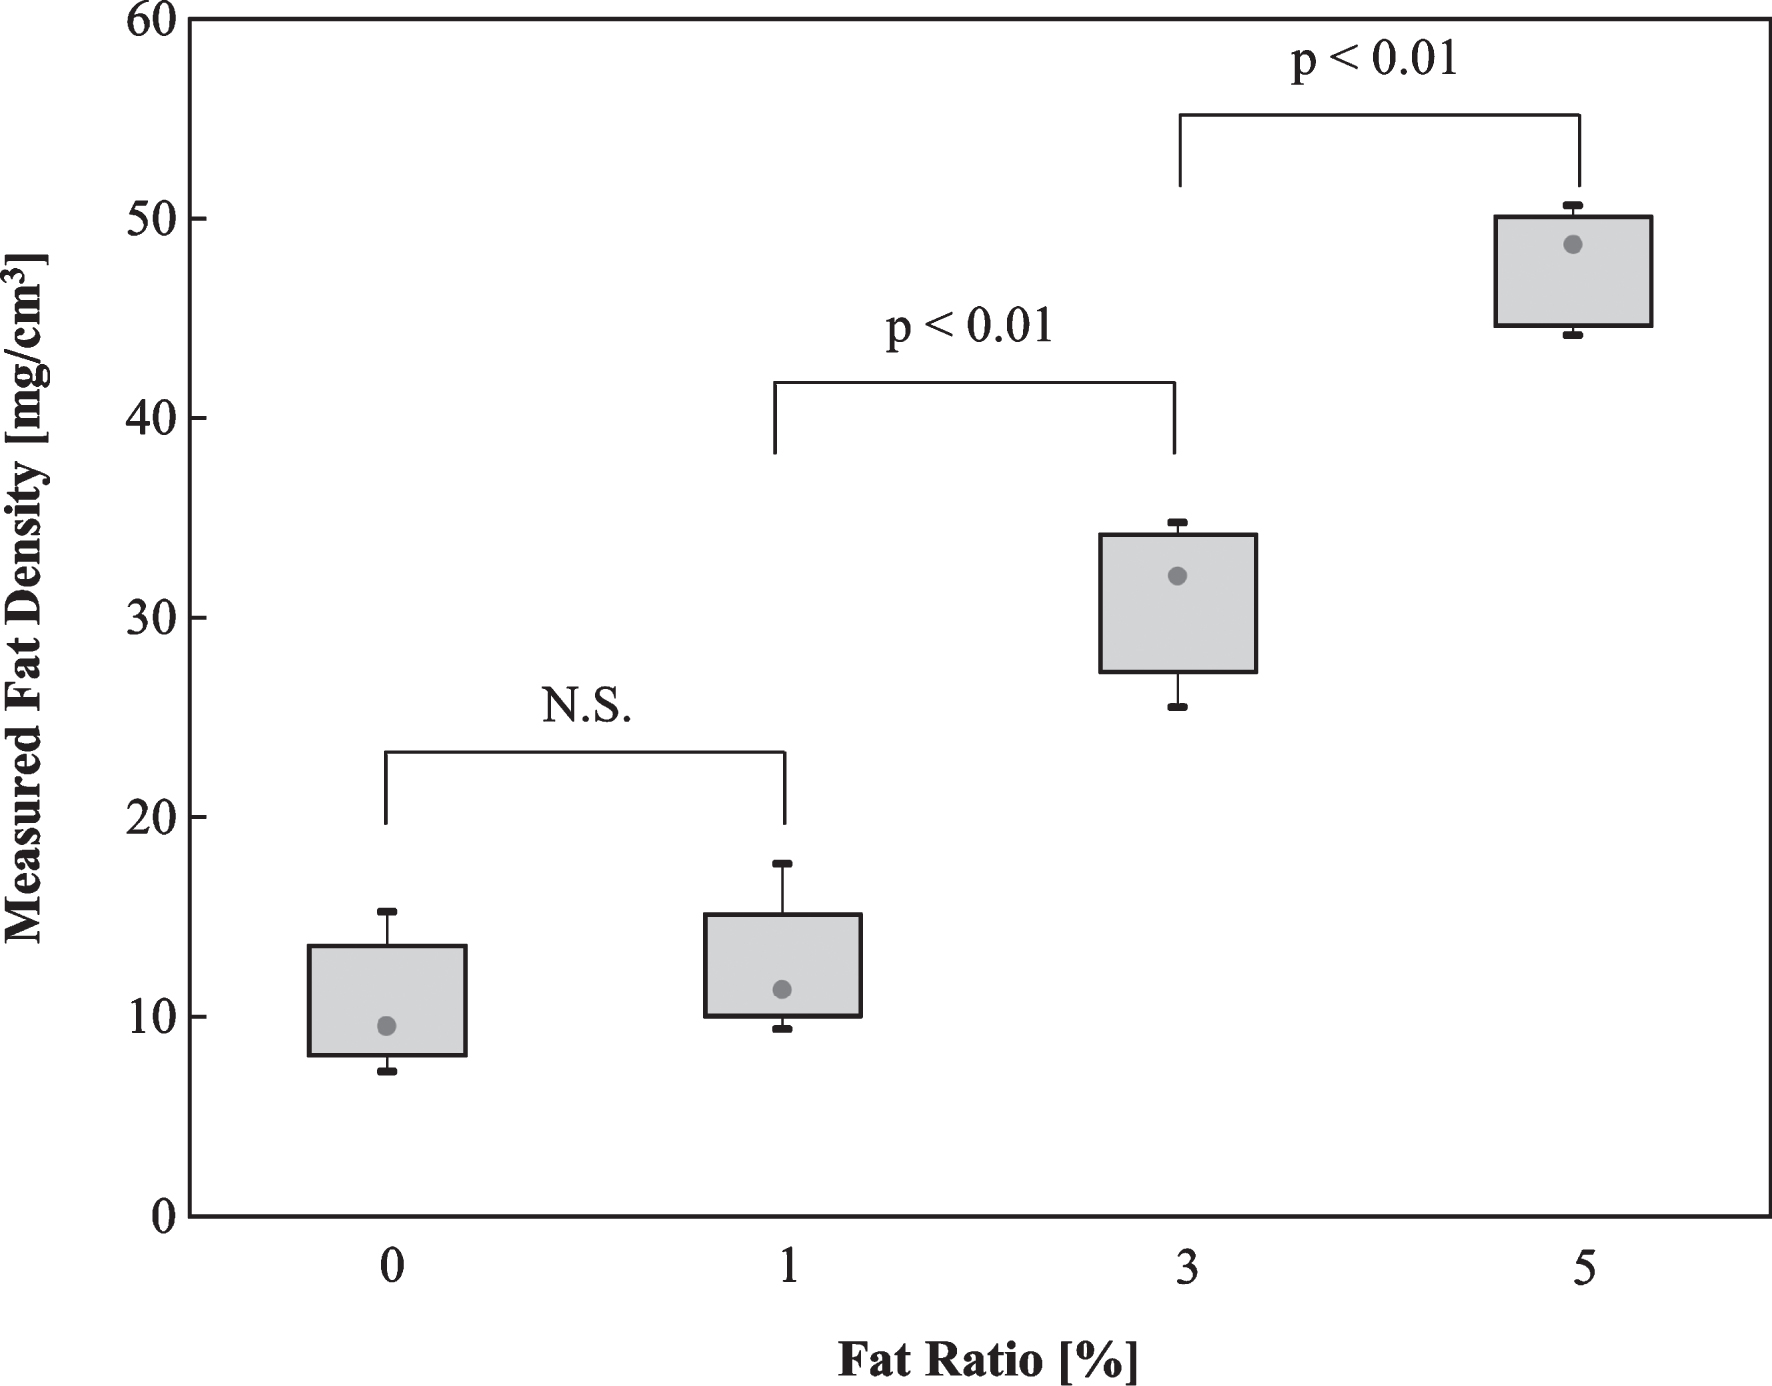
Statistical significance between the adjacent fat densities in the low fat range (0–5%) measured by RSDE(CTDIvol: 12.09 mGy). The error bars show standard deviations for the five independent measurements.
Fat contents measured using RSDE and the effect of the exposure dose (N = 5)
Avg.: Average, SD: Standard Deviation.
The distribution of the linear attenuation coefficients in ROIs (2357 voxels) set for the fat and liver from monochromatic images are plotted in Fig. 7 for 45 keV and 57 keV, which are the effective energies for the 80 kV and 140 kV tube voltages. This plot indicates that the linearity of the measured linear attenuation coefficients is closely related to the fat content. Figure 8 shows a comparison between the reference density measured during the phantom preparation and the RSDE measurement. The regression analysis showed a good agreement between the reference density and that obtained by the RSDE measurements. The regression analysis yielded a slope value of 0.999 with an intercept at –1.5784 mg/cm3 (R2 = 0.9994). For other doses, the slope ranged from 0.9856 to 0.9964 with determination coefficients of R2 higher than 0.999. Statistical testing against the slope value of 1 and the intercept of 0 showed that the result was statistically not significant. The p values of slopes and intercepts were 8.91 mGy: p = 0.059 and p = 0.428, 10.18 mGy: p = 0.745 and p = 0.262, 12.09 mGy: p = 0.141 and p = 0.665, 14.79 mGy: p = 0.133 and p = 0.917, 17.49 mGy: p = 0.198 and p = 0.932, respectively. However, as shown in Table 2, the deviation from the reference density was 8.9–27.7% at 1% fat content, while the deviation ranged from –10.5% to 13.0% for 3% fat content, where the measurement became statistically significant.
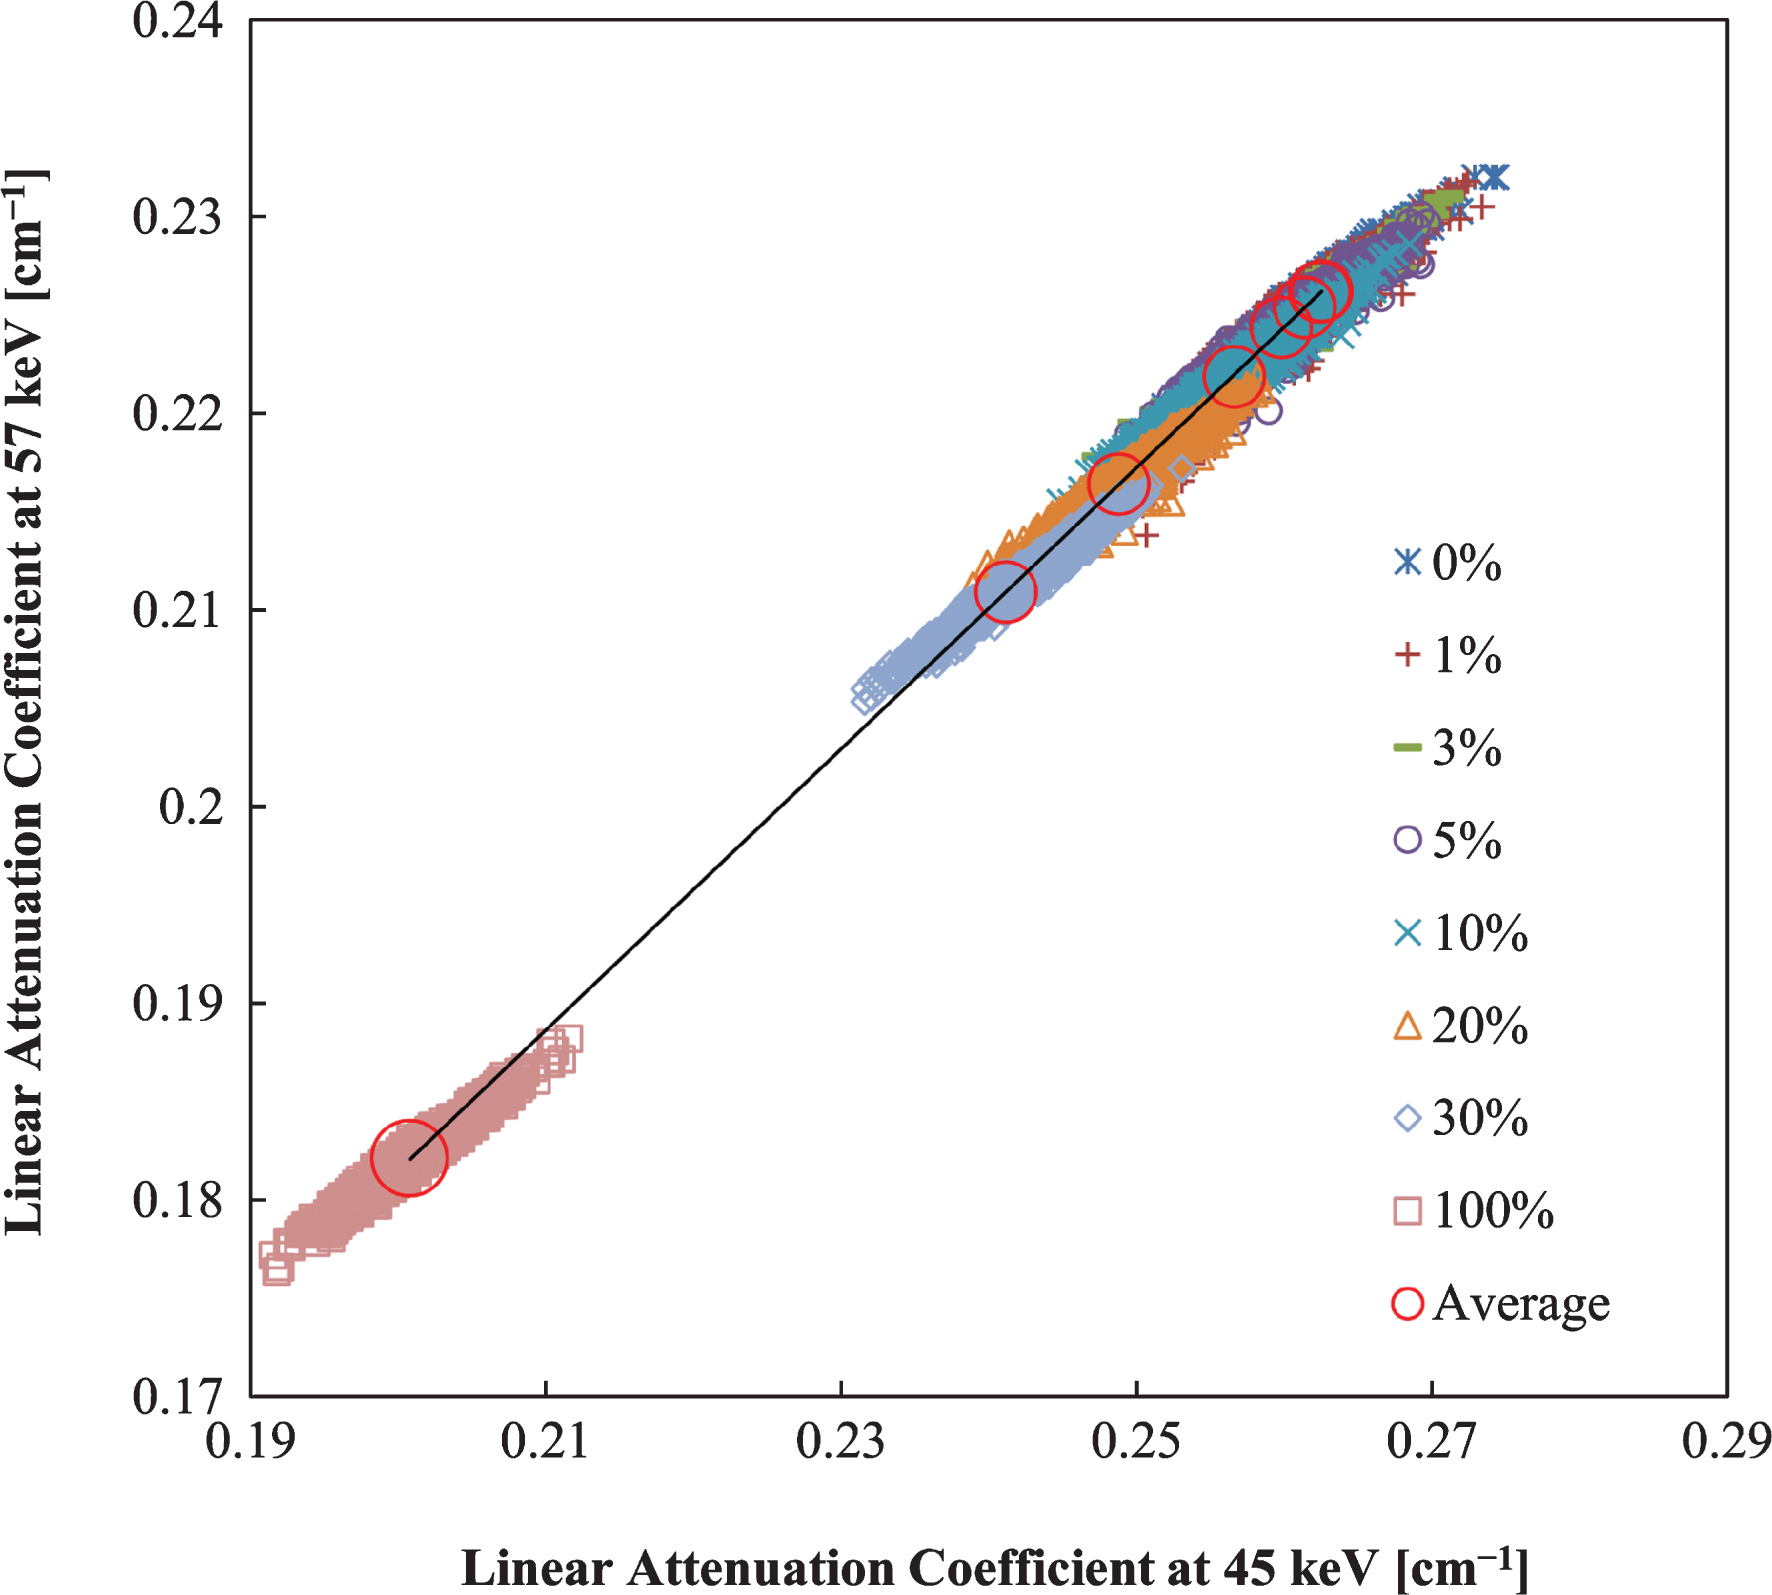
Correlations between the linear attenuation coefficients at 80 kVp and 140 kVp (effective energies: 45.48 keV and 57.40 keV, respectively) for the fat density verification phantom derived using RSDE (CTDIvol: 12.09 mGy). The scatter plots correspond to each pixel in the ROI. The circle shows the average pixel values. The results of the regression analysis were R2 = 0.9999, slope: 1.4009, and intercept: –0.0543 cm-1.
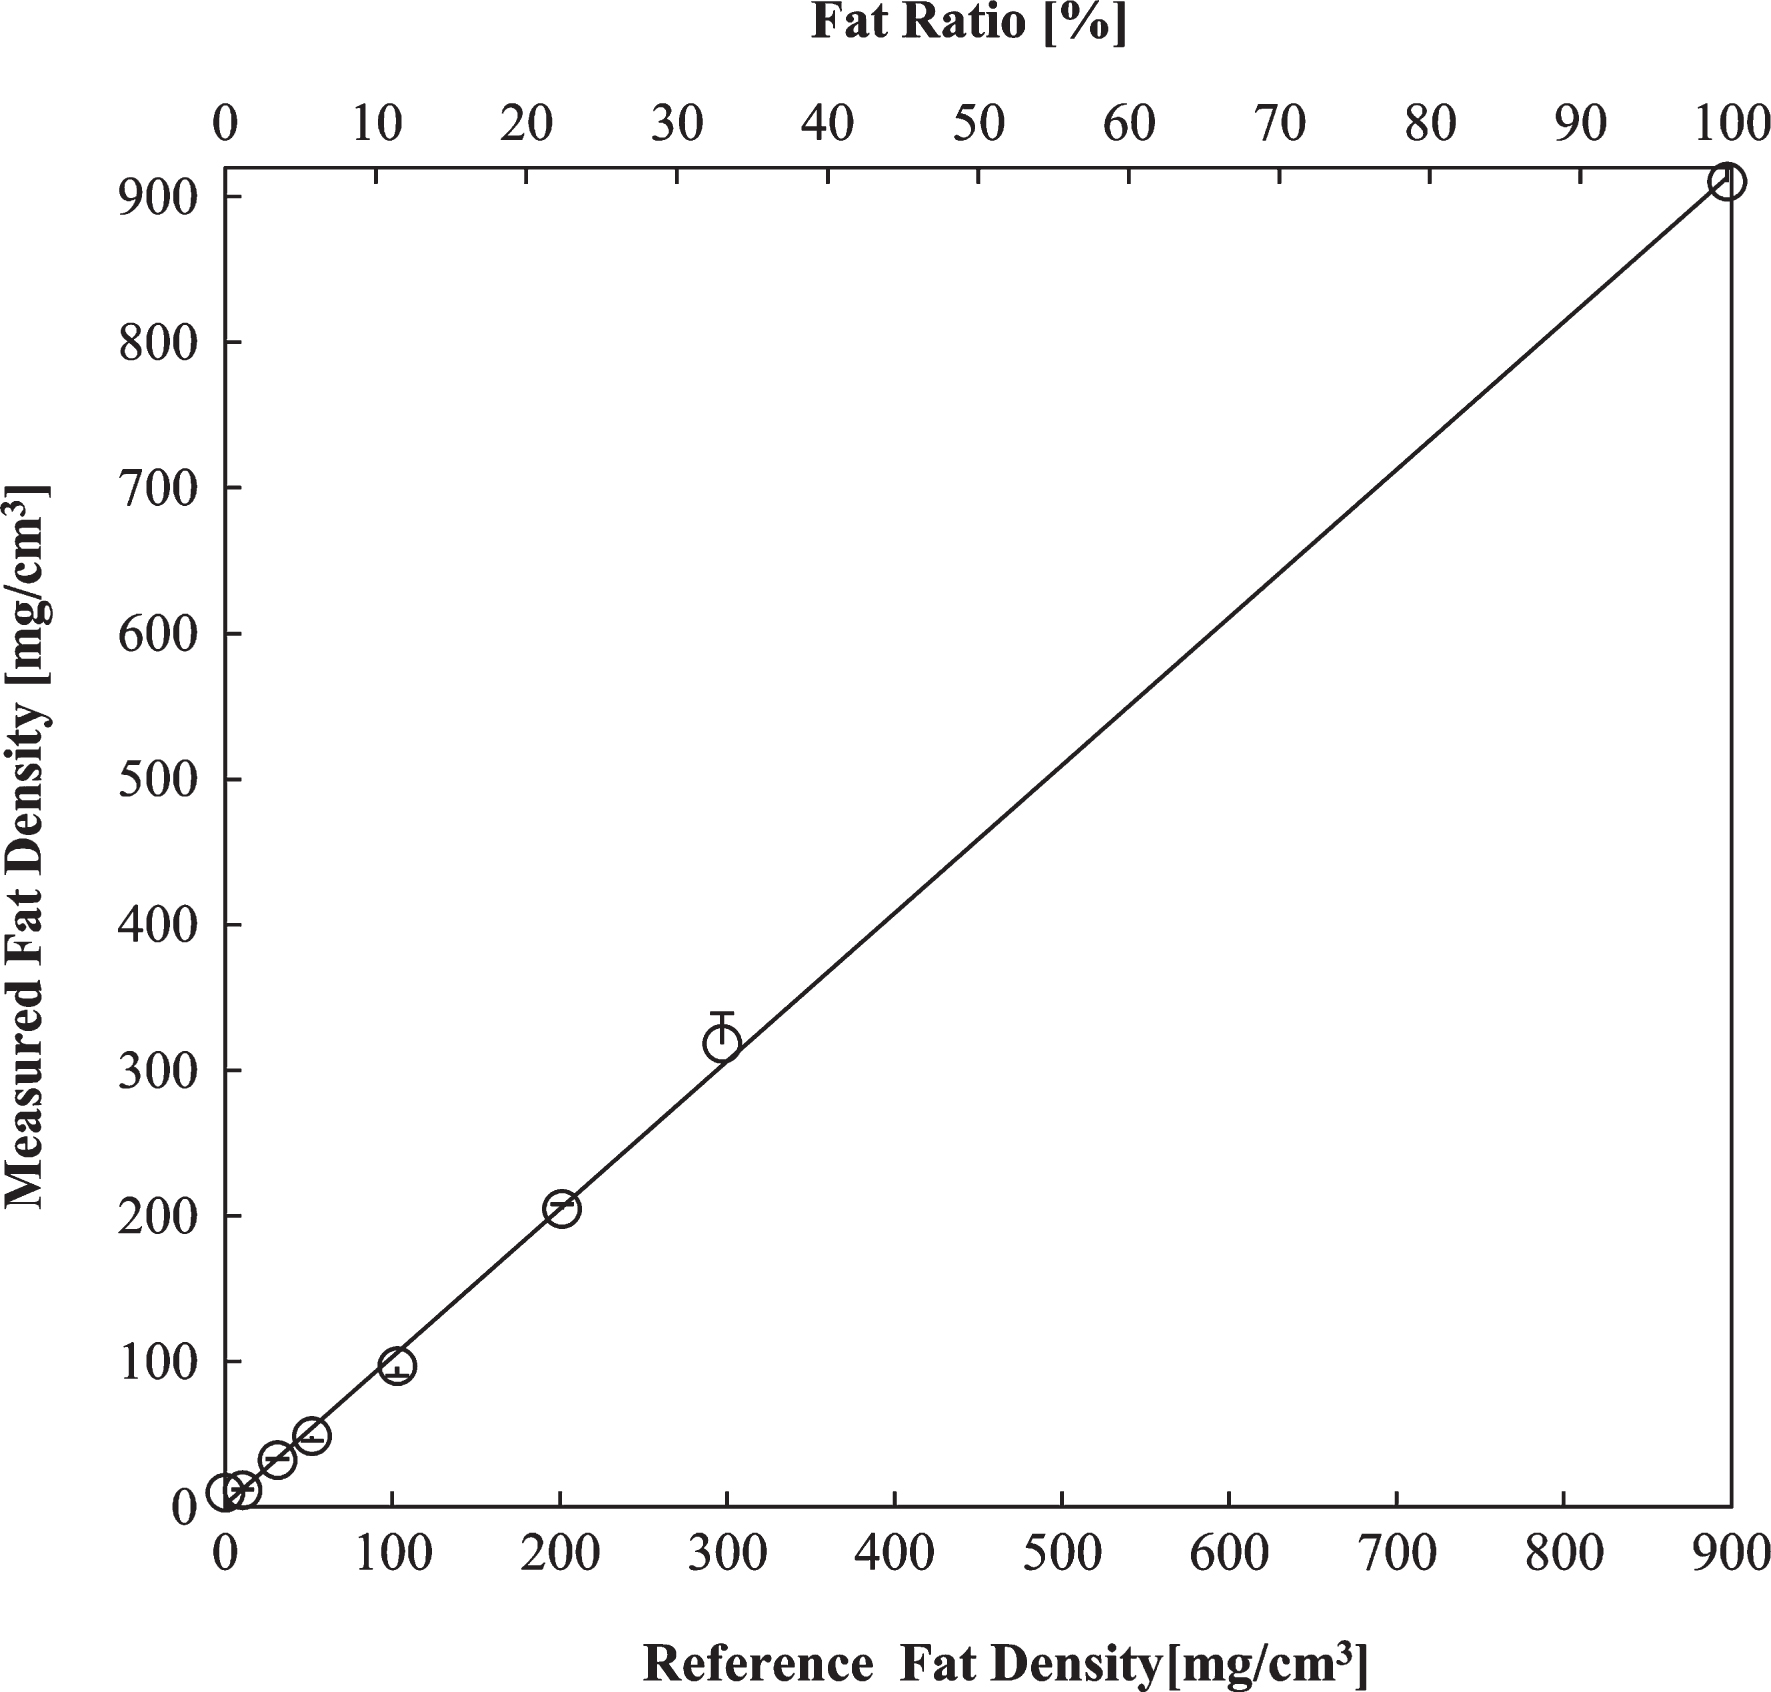
Correlations between the reference density and the measured density using RSDE for the fat density verification phantom (R = 0.997 for CTDIvol: 12.09 mGy). The top axis shows the fat weight ratio and the bottom axis shows the reference fat density. The mean was derived from the average pixel values in the ROI. The error bars represent the relative error in the calculated measurements. The results of the regression analysis were R2 = 0.9994, slope: 0.9997, and intercept: –1.5784 mg/cm3.
Deviation in the RSDE measurements from the reference fat density
N.S.: Not significant, *: p < 0.01.
Based on the phantom measurement results, we discuss the difference between the CT values obtained using SECT and those obtained using RSDE, the accuracy and deviation of the fat density measurements, the limitations of the RSDE analysis, and the exposure dose in RSDE.
Measurements of the fat density
In this study, the difference in the CT values was approximately 10 for fat contents of 0–5%, below the threshold for fatty liver diagnosis (Fig. 5). Even though we investigated the effect of CTDIvol in this study, CT values can easily be changed by the tube voltage, the type of filters, and the build of the patient, causing a variation in the effective energy between the different CT systems. The mass attenuation coefficient, as well as the linear attenuation coefficient, is sensitive to the effective energy changes. In addition, the variation appears to increase in the low fat region, as shown in Fig. 5. This may be due to the location of the dose evaluation. Conventional SECT refers to the effective energy at the gantry center, and the use of multiple phantoms in the presented setup might affect the actual effective energy. The±5 HU variation of the normal human liver CT values for SECT also affects the measurement [14]. Therefore, the CT value-based fat-liver mixture measurement is susceptible to variations in hardware and measurement techniques that cause the effective energy to change, degrading the accuracy of the measurement of fractional changes in the fat content.
Conversely, RSDE enables us to decompose the linear attenuation coefficient into the density and the mass attenuation coefficient. The difference between the fat and liver at 54.38 keV, corresponding to the effective energy of a conventional 120 kV SECT scan, was 0.0468 cm-1 (Fig. 3), whereas that of the mass attenuation coefficient was 0.0089 cm2/g (Fig. 4). This suggests that the density makes the dominating contribution to the difference in the linear attenuation coefficient, as well as the CT value. Therefore, we expect that improved accuracy can be obtained using the density-based diagnosis of fatty liver.
Measurement accuracy and limitations
In this study, the fat density was given by the product of the actual lard density (ρFat = 897.5 mg/cm3) and its volume fraction (1–α) as shown in Equation (1), Section 2.3. In other words, when the lard content was zero (α = 1), the fat density theoretically became zero. Note that the calculated fat density is the amount of extra fat added to the native fat content in the porcine liver used in this study.
As shown in Fig. 6, the fat density measurement became statistically significant (p < 0.01) for fat contents exceeding 1% with a difference greater than 2%. The statistical analysis demonstrated that differences in fat contents higher than 2% are statistically significant for fat contents above 3% (Table 3) while 0–1% fat fraction differences are statistically insignificant, likely because the system generates a baseline bias on the order of 10 mg/cm3 even at 0% fat content, as shown in Table 1. To verify this baseline bias, we measured the fat density of the liver-equivalent phantom and found that the fat density was 21.21±3.21 mg/cm3 (N = 3). Because the phantom consists of polyurethane and calcium without any fat component (H: 7.99%, C: 69.24%, N: 4.38%, O: 16.39%, and Ca: 2.00%), this suggests that the fat density obtained for 0% fat originates from a system bias rather than the presence of native fat in the porcine liver. Summarizing these findings, with the exception of the case of 0% fat content, the present approach is capable of producing statistically significant results for fat content differences greater than 2%. This limitation also applies to the measurements at 45.48 keV and 57.40 keV corresponding to the effective energies of 80 kV and 140 kV in the rapid kV-switching system and sets the detection limit of the presented system. The resulting variations of the CT values, linear attenuation coefficients, and mass attenuation coefficients were less than 0.04% for both the liver and the fat phantoms (data not shown). Because these variations were smaller than the fat content in the phantoms (>1%), we concluded that the effective energy fluctuations do not have a significant effect on the fat density measurements.
Linear attenuation coefficients of the fat contents and their statistical significances
Linear attenuation coefficients of the fat contents and their statistical significances
Figure 8 shows that a good correlation between the reference densities and the measured densities (R2 = 0.9994, p < 0.0001) was obtained. The regression analysis showed a slope of 0.9839 and an intercept of –1.5784 mg/cm3. To verify the statistical significance of these results, the null hypothesis of a slope of 1 and an intercept of 0 was tested against the regression line. The null hypothesis was denied for both the slope and the intercept (p = 0.1413 and p = 0.6653, respectively), suggesting that the regression line can be used for fat density estimations. Conversely, the deviations in the measured fat density from the reference values ranged from –6.3% to 13.0% for fat contents higher than 3%, for which the measurement became statistically significant (Table 2). At a fat content of 5%, which is the threshold for fatty liver diagnosis, the deviation varied from –3.5% to –7.5%. Even though statistically insignificant at 1%, the deviation changed from 8.9% to 27.7%. We noticed that the fat densities were either systematically underestimated (5% or 10%) or overestimated (1% or 100%) depending on the fat content. The precise identification of the origin of this effect is outside the scope of this study and requires a thorough investigation of the hardware and the calculation algorithm. Another limitation of this approach is that the presented method is unique to the particular equipment we used. Other implementations employ different devices, material basis pairs, and software algorithms, preventing inter-equipment comparisons. In addition, the phantoms used in this study may represent only a few types of fat distributions in an actual fatty liver. When clinical testing begins, patients must be carefully chosen such that the presented analysis is applicable.
ICRP Publication 87 (Managing Patient Dose in Computed Tomography) [15] defines the abdominal CT dose for adult patients as 35 mGy in CTDIvol. Shinozaki et al. [16] scanned the pelvic region using SECT (Discovery 750HD CT, GE Healthcare) and reported that the maximum dose was 25.03 mGy. The Japan Association of Radiological Technologists issued a guideline (“Target Values for Reducing Doses in Radiation Diagnosis,” 2006) to recommend 20 mGy CTDIvol as the maximum dose for abdominal scans [17]. Even though no AEC devices were installed, the maximum dose in RSDE was 17.49 mGy CTDIvol, lower than the SECT recommendations. Such lower doses would justify the use of RSDE for fat density measurement and would enable us to maintain the quality of the density images by optimizing the exposure dose.
Conclusions
This study provided the basics to quantitatively evaluate the progression of mild-to-moderate (fat content higher than 3%) fatty liver using RSDE. We scanned phantoms composed of fat and liver mixtures using SECT and RSDE and conducted a quantitative analysis of the fat density. Due to variations in the effective energy, it was difficult to obtain accurate CT-based fat density measurements using SECT, particularly in the low fat range. In the RSDE measurements, following the virtual monochromatic X-ray image reconstruction, the mass attenuation coefficients of the fat and liver were calculated at different energies to assign the fat and liver as a new material basis pair. Using this data set, the fat densities of the phantoms with variable fat concentrations were measured. The statistical analysis of the results showed that, with the exception of the case with 0% fat content and fat content differences smaller than 2%, the presented approach is capable of producing statistically significant results. However, the deviation in the measured values from the reference values ranged from –6.3% to 13.0% for fat contents ranging from 3% to 100%. The maximum exposure dose in RSDE in this study was lower than that recommended in the SECT guidelines. This justifies the clinical use of RSDE for fatty liver progression diagnosis, given the knowledge of the limitations and constraints found in this study.
Footnotes
Acknowledgments
This work was supported in part by Grants-in-Aid for Research from the National Center for Global Health and Medicine (26A201). We wish to thank Mr. Muramatsu (Ph.D) of National Cancer Center Hospital East (Department of Radiology), who permitted us to borrow a cylindrical phantom for testing. We wish to thank Mr. Hiramoto of GE Healthcare Japan for providing valuable insights.