
Abstract
BACKGROUND:
Breast cancer, the most common malignancy among women, has a high mortality rate in clinical practice. Early detection, diagnosis and treatment can reduce the mortalities of breast cancer greatly. The method of mammogram retrieval can help doctors to find the early breast lesions effectively and determine a reasonable feature set for image similarity measure. This will improve the accuracy effectively for mammogram retrieval.
METHODS:
This paper proposes a similarity measure method combining location feature for mammogram retrieval. Firstly, the images are pre-processed, the regions of interest are detected and the lesions are segmented in order to get the center point and radius of the lesions. Then, the method, namely Coherent Point Drift, is used for image registration with the pre-defined standard image. The center point and radius of the lesions after registration are obtained and the standard location feature of the image is constructed. This standard location feature can help figure out the location similarity between the image pair from the query image to each dataset image in the database. Next, the content feature of the image is extracted, including the Histogram of Oriented Gradients, the Edge Direction Histogram, the Local Binary Pattern and the Gray Level Histogram, and the image pair content similarity can be calculated using the Earth Mover’s Distance. Finally, the location similarity and content similarity are fused to form the image fusion similarity, and the specified number of the most similar images can be returned according to it.
RESULTS:
In the experiment, 440 mammograms, which are from Chinese women in Northeast China, are used as the database. When fusing 40% lesion location feature similarity and 60% content feature similarity, the results have obvious advantages. At this time, precision is 0.83, recall is 0.76, comprehensive indicator is 0.79, satisfaction is 96.0%, mean is 4.2 and variance is 17.7.
CONCLUSIONS:
The results show that the precision and recall of this method have obvious advantage, compared with the content-based image retrieval.
Introduction
Whether in developed or developing countries, breast cancer is one of the most common malignancies among women, and the mortality rate remains high [13]. The survey from World Health Organization (WHO) shows that early diagnosis of breast cancer is an important basis for breast cancer treatment and survival improvement, and thus, early detection, diagnosis and treatment of breast cancer can reduce the patients’ mortality effectively [30]. Among examination methods, compared with biopsy, ultrasound and other methods, mammography is an important way to check breast disease, due to its superiority of early lesions check and little injury, and it is identified as the most effective method of breast examination by the Food and Drug Administration (FDA) [20].
Some studies on medical image databases [22] shows that medical image retrieval can provide services for clinical diagnosis. Image retrieval can find and compare similar images, to provide references for difficult diagnosis and improve the accuracy of diagnosis effectively. In the 1990s, Content-based Image Retrieval (CBIR) is proposed, and Content-based Medical Image Retrieval (CBMIR) is an important application in medicine. CBMIR mainly extracts content-based medical image feature, including shape, texture and topology, to form feature vectors to describe medical images [10].
Breast is divided into five parts, including outer upper quadrant, outer lower quadrant, inner upper quadrant, inner lower quadrant and areola area. The study shows that incidence in outer upper quadrant is 1/3 or more, the areola area is about 1/3 and the rest parts are about 1/3. Thus, the location of breast cancer has a strong regularity, and the location of breast lesions can provide an important reference for the diagnosis. However, the existing technique, CBMIR, has limitations in mammography, due to the lack of lesion location information.
This paper proposes a similarity measure method combining location feature for mammogram retrieval. The location information and content information are both taken into account and image fusion similarity is constructed by location similarity and content similarity. The main contributions are as follows: A standard location feature vector based on Coherent Point Drift (CPD) is constructed, and a method of location similarity measure is proposed. Firstly, the center point and radius of the lesion are extracted. Then, the standard position vector is obtained based on CPD and the standard reference image. Finally, according to the location similarity measure method, the ratio of intersection to union of the approximate area is taken as the location similarity of the image pair. A content similarity measure method based on Earth Mover’s Distance (EMD) is proposed. Firstly, the content features of the image pair is extracted, which is based on Histogram of Oriented Gradients (HOG), the Edge Direction Histogram (EDH), the Local Binary Pattern (LBP) and the Gray Level Histogram. Then, according to content similarity measure method based on EMD, the content similarity of the image pair can be obtained. A similarity measure method of fusing location feature and content feature is proposed. The location similarity and content similarity is fused proportionally to determine the image fusion similarity, where the location similarity is obtained by the standard location feature vector and the content similarity is obtained by EMD. The experiment is carried on 440 mammograms, which are women molybdenum target mammograms from 31 to 73 years old in Northeast China, and the validity of this method is validated. Compared with content-based image retrieval, this method has obvious advantages in the precision and recall.
Mammogram Retrieval
In recent years, many related work are published on the topic of feature extraction. It is the key to choose appropriate features for image retrieval, since redundant or invalid features may degrade the performance of the retrieval system, and the correctly selected features can represent the image more efficiently. In 2005, Hilary Alto et al. [1] extract texture feature, shape feature and edge sharpness of breast images similar lesions, and then analyze whether the lesion is early lesions or pejorative. In 2007, Renchao Jin et al. [14] present a study on the feature effectiveness of 32 mammograms, and find that 24 features of them, including the number of pixels at the edge and normalized radial length of area ratio, can describe the pathology of breast lesions effectively. In 2010, Oliveira et al. [24] propose a breast image retrieval method based on the mammary gland density. Breast density texture is obtained by two-dimensional principal component analysis after dimensionality reduction.
In 2012, Chia-Hung Wei et al. [35] propose a CBMIR system, mainly selecting lesion shape and edge feature. In 2014, D. Abraham Chandy [5] proposes a retrieval method of four statistical texture features based on horizontal gray statistic matrix. In the experiment, texture features, such as calcification feature, structure and symmetry, compared with the texture feature Gabor operator, this method can extract fewer texture feature elements. In 2016, Jingjing Liu et al. [19] propose a new CBMIR system for a large number of mammograms, using unsupervised hash algorithm, named Composite Anchor Graph Hashing with Iterative Quantization (C-AGH-ITQ). This algorithm can retrieve the Region of Interest (ROI) of breast images in Hamming space, and form composite binary code in real time.
After extracting the appropriate features, the complexity and feasibility of calculating the similarity is important and many scholars contribute to similarity measure. In 2012, Chia-Hung Wei et al. [35] propose a CBMIR system, selecting the lesion shape and edge feature and proposing a similarity measure method of combining hierarchical layout of graphic feature and weighted distance measurement. In 2014, SantosL et al. [26] use clustering method of hierarchical near-duplicates to increase the similarity queries diversity of CBMIR system. A method is proposed, which is domain-independent and parameter-free, by controlling the largest area. Also, this method reduces further query refinement need or relevance feedback cycles. In 2016, Bedo et al. [2] propose a CBMIR system of using the overall strategy and giving perceptual parameters based on the query image. An appropriate similarity sense is proposed and Extreme Learning Machine (ELM) is used for classification. The classification result can provide a determinate perceptual parameter, which defines the search space for the similarity query when retrieving the most similar images. EMD, presented by Y. Rubner in 1998 [25], are used in the image retrieval system [15, 33]. In recent years, Ling H and Okada K propose a CBIR system interaction using the multi-band wavelet feature and EMD interactively and EMD is used to measure the distance between different images in the database [18]. In 2017, F. Nayyeri and M.F. Nasrudin propose a rapid matching minimum weight matching algorithm based on EMD embedded in L1, which is used to calculate similar images of a given query image for different distance measure [23].
Methods
In this paper, a method fusing content feature and location feature is proposed for image retrieval. Firstly, for content feature, each image is taken out of the database. The query image and dataset images are pre-processed, including image denoising, enhancement and chest muscle removal. After this, content feature can be extracted. Secondly, for location feature, images need to be pre-processed in the same way. And lesion segmentation is performed, including binarizing, cutting suspected lesion in square and suspected lesion segmentation. Also, image registration is performed, including contour detection and registration. After this, lesion location feature can be extracted. Thirdly, content similarity and lesion location similarity can be calculated. Finally, content similarity and lesion location similarity are fused to obtain the fusion similarity, and the specified number of the most similar images can be returned according to fusion similarity. The process is shown as Fig. 1.
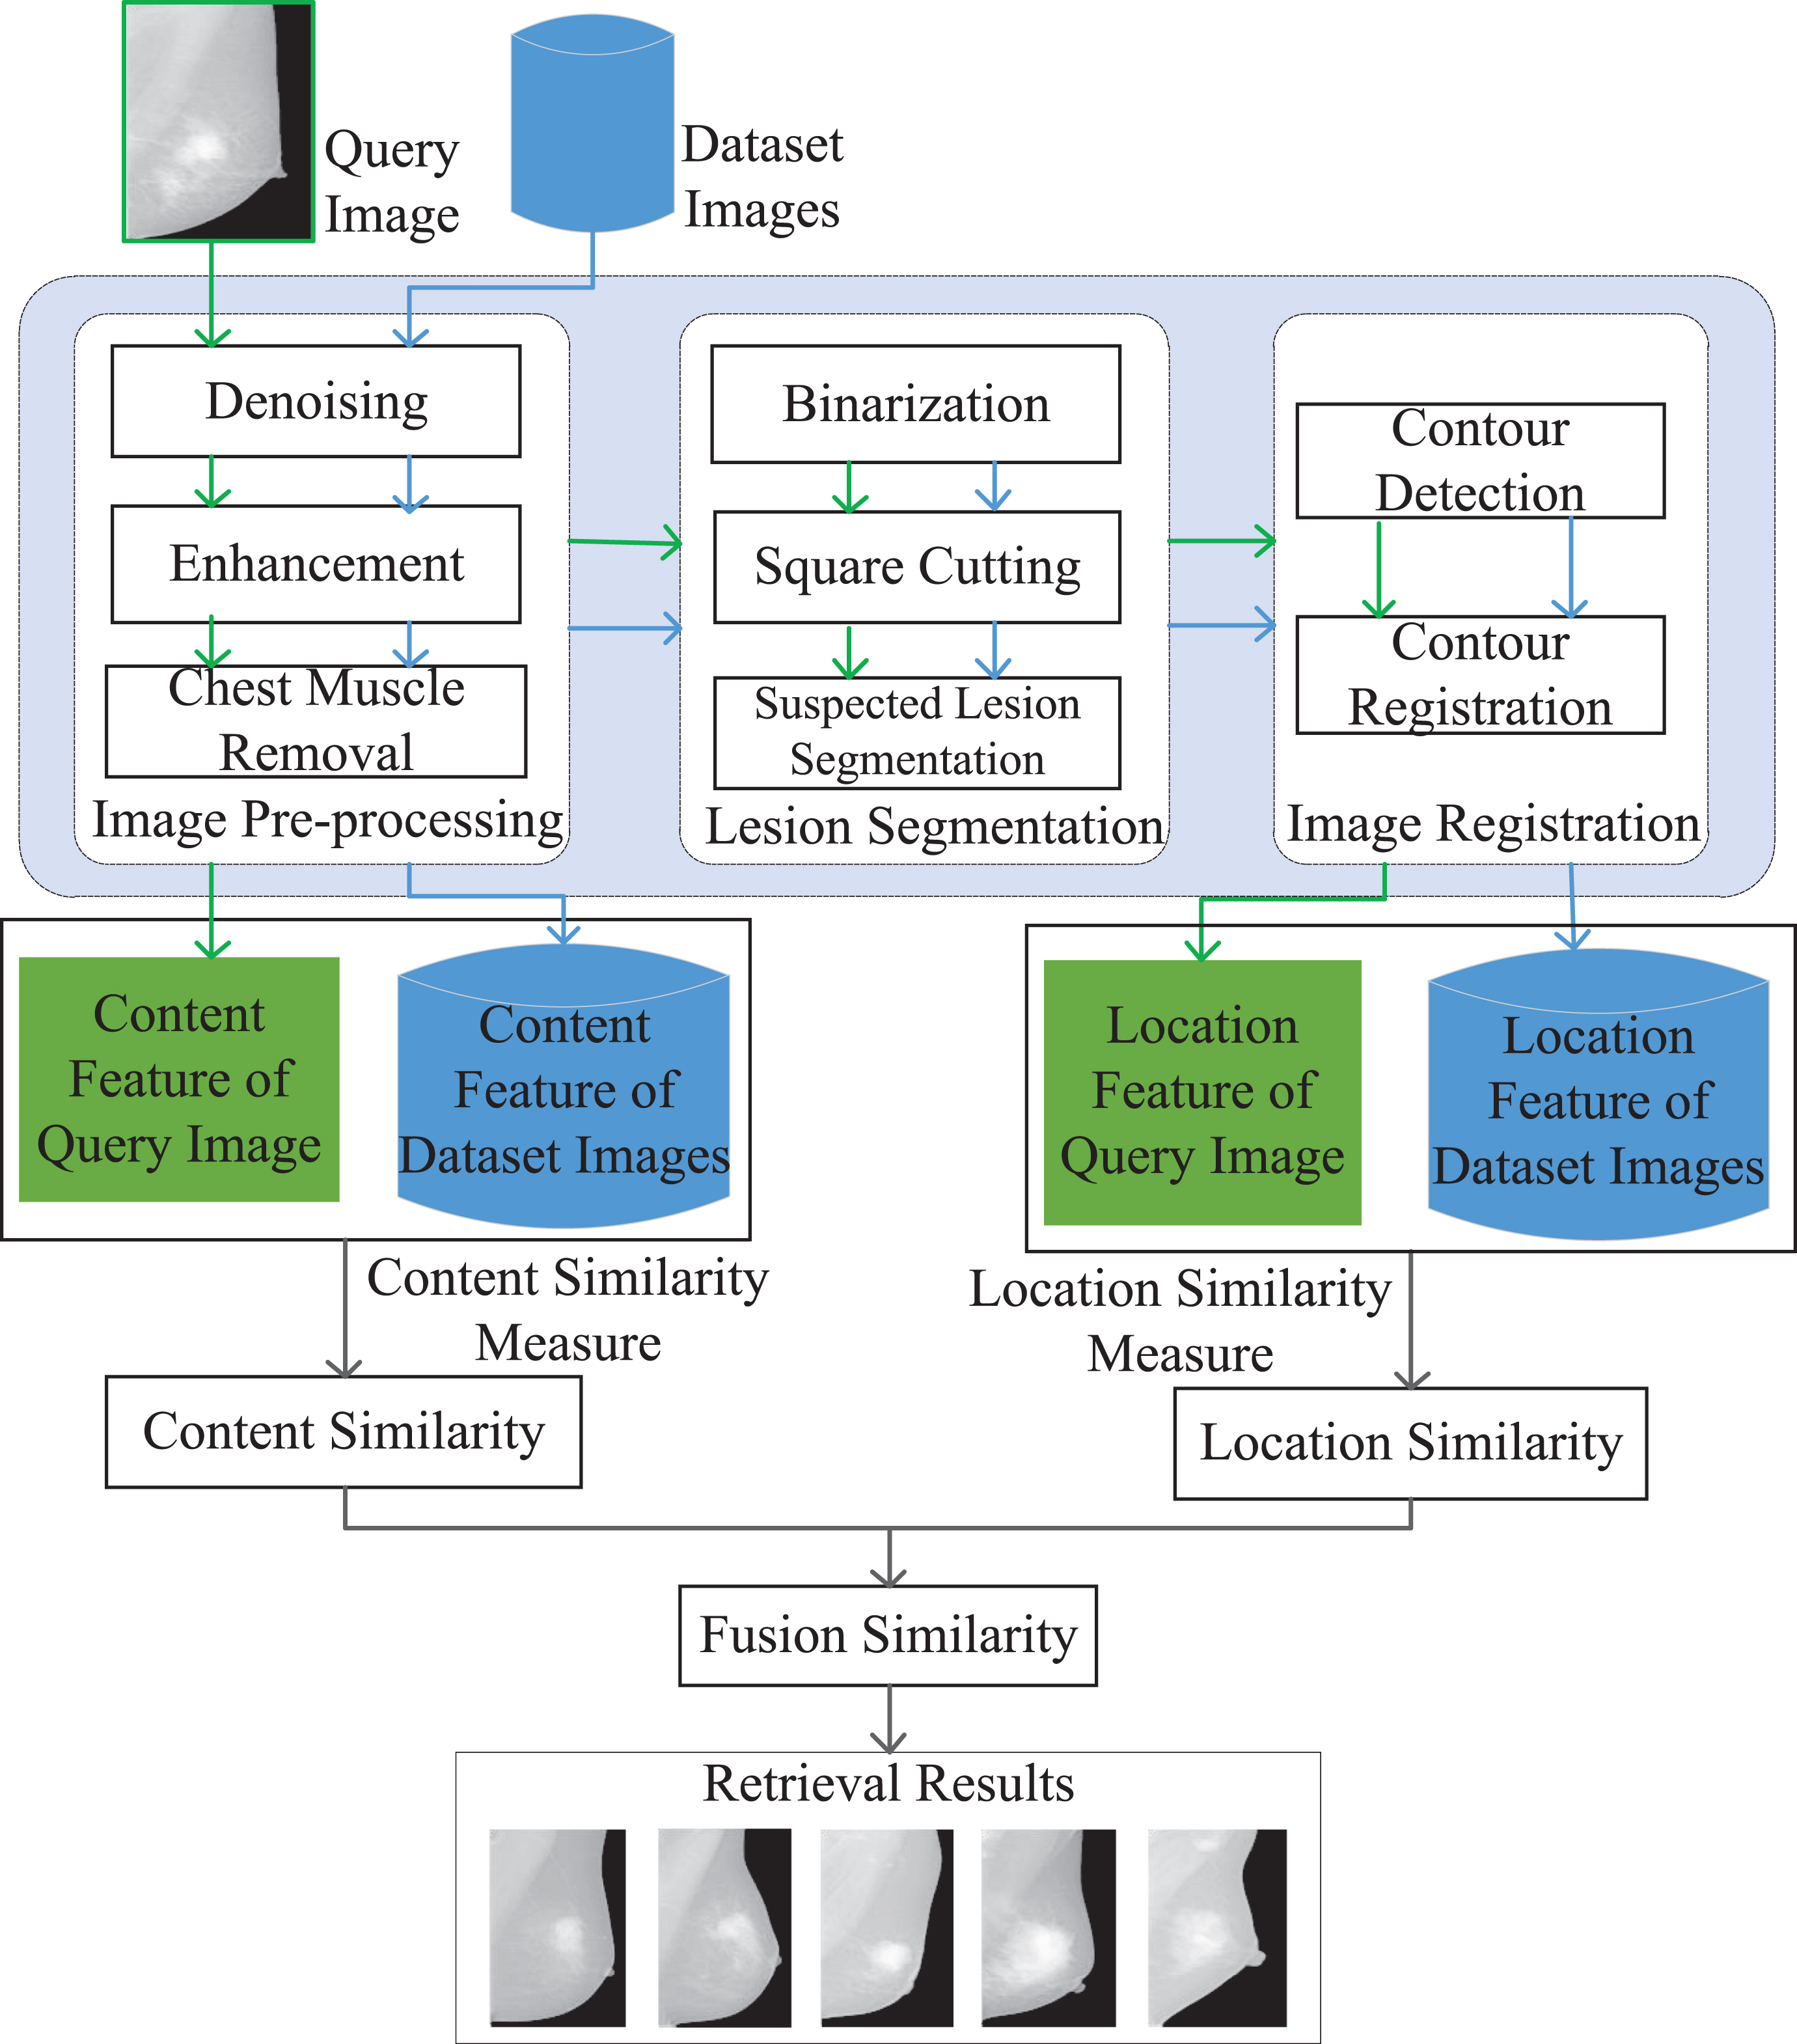
Process of Image Retrieval.
In order to obtain location feature and content feature for mammograms retrieval, image process is needed, which includes image pre-processing, lesion segmentation and image registration. Content-based image retrieval only needs pre-processing, but location-based image retrieval needs to get the suspected lesions location and create a feature set base on it. And since the size of the breast is different, in order to reduce the error, image registration is necessary.
Image Pre-processing
Image pre-processing includes image denoising, image enhancement, and chest muscle removal. During acquisition and transmission, mammograms may take with lots of noise, so reducing noise and increasing the contrast between the suspected lesion and the surrounding tissue is the main task of image pre-processing. Because chest muscle may be in the mammogram, removing the chest muscle is essential [8].
In this paper, typical non-linear filtering technique-Median Filter is used for denoising [3]. Contrast enhancement method is used for image enhancement [34]. When removing the chest muscle, after the image is binarized, use Hough Transform [11] to detect the chest wall line and remove the muscle part. Hough transform is to convert a point on a detected straight line, y = mx + c, from XY-coordinate to a relevant line on MC-coordinate. The intersection coordinate (m, c) of the relevant lines on MC-coordinate is the detected straight line parameter by Hough transform (m is the slope and c is the intercept of the detected straight line.). In the experiment, every pixel point in the image is detected and every point has one relevant line on MC-coordinate. If some lines intersect at one point on MC-coordinate, the relevant pixel points in the image are probably in one straight line. In this way, several straight lines can be detected, but the longest one is the chest wall line (At this time, there is the largest number of lines intersecting at one point on MC-coordinate and there is the largest number of relevant pixel points in one straight line in the mammograms.).
Fig. 2 is the demonstration for pre-processing. Breast tissues can be classified into fatty, glandular or dense. Some mammograms have dense breast lesion, but some have uniform breast lesion. In Fig. 2, (a), (b) and (c) is the example for dense breast lesion. (d), (e) and (f) is the example for uniform breast lesion.
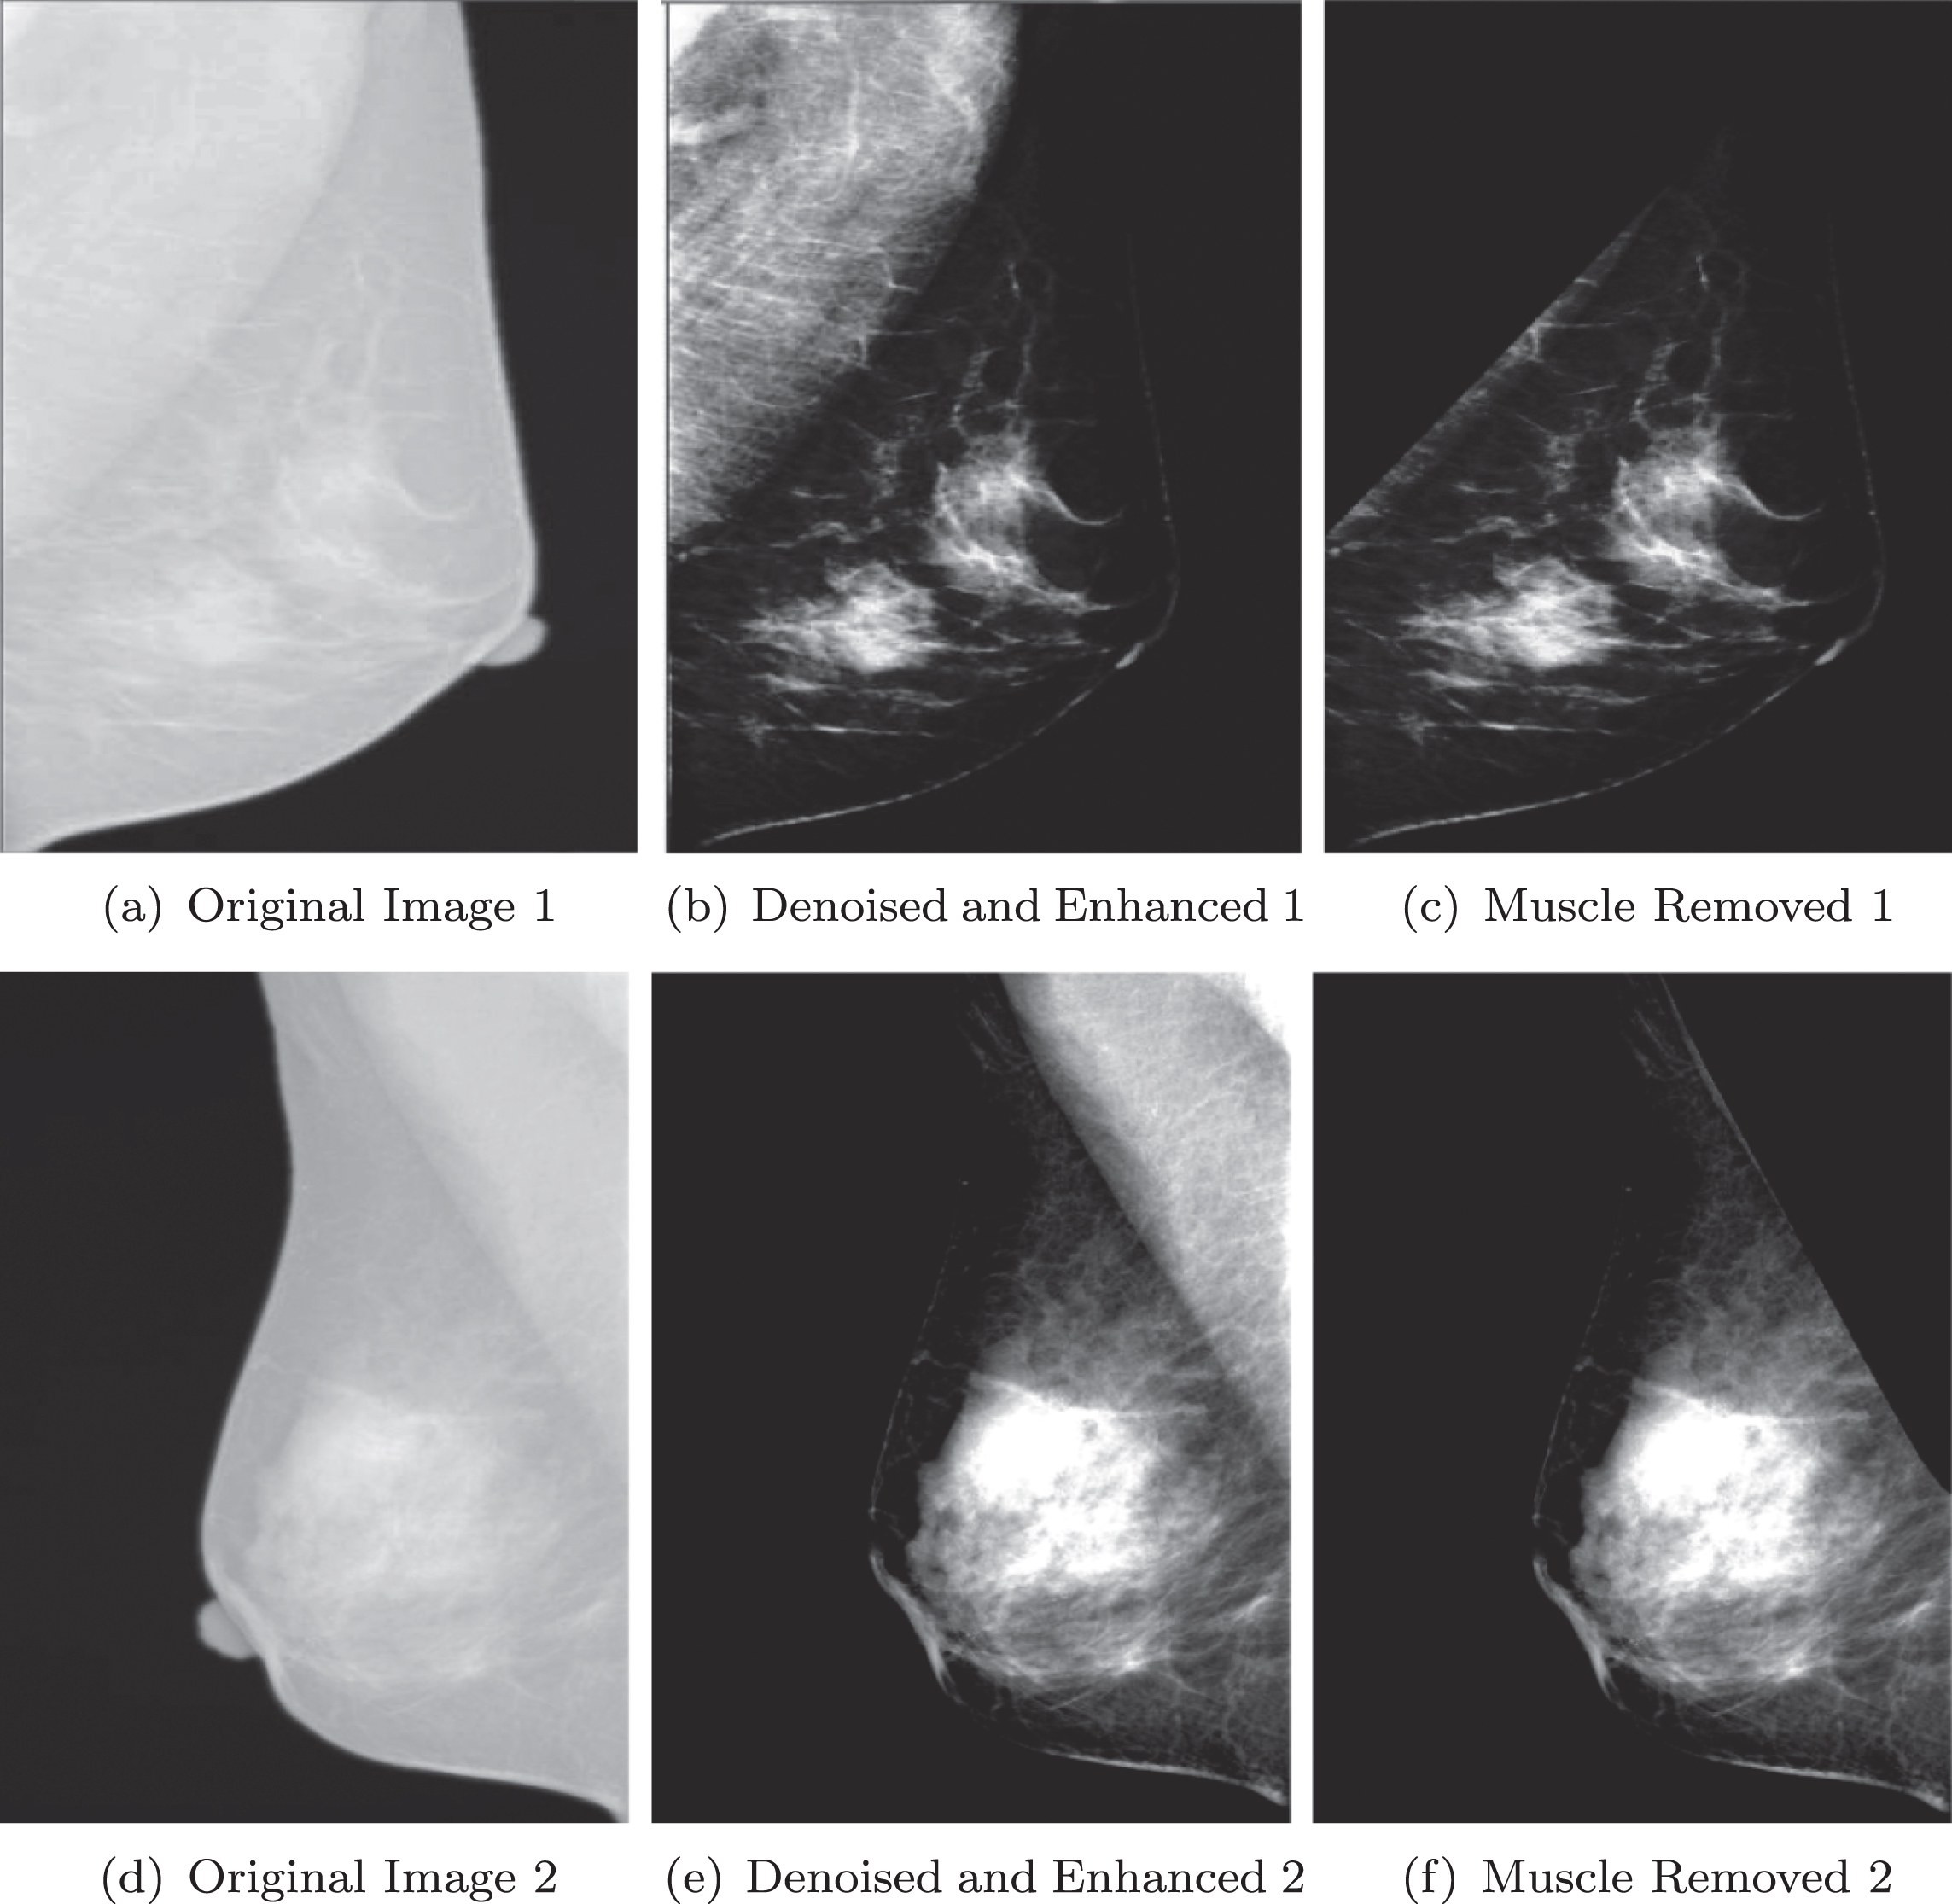
Demonstration for Image Pre-processing.
Firstly, the pre-processed image is binarized. Otsu algorithm is used to determine the threshold [17], and the image can be binarized.
Then, ROI is detected automatically. After binarizing, highlighted area in the image is preserved, which is the connected area calculated by 8 neighborhoods. In every highlighted area, the maximum value X max and minimum value X min of X-axis are found. Similarly, the maximum value Y max and minimum value Y min of Y-axis are found in the highlighted area. Then, ((X max + X min )/2, (Y max + Y min )/2) is deemed to be the center of square. Also, the distance between every pixel point and the center is calculated and the maximum distance is deemed to be half of the square side length. Thus, every highlighted area is cut in square. According to the experience, a square region of ROI has pixels in the range of 2500 to 40000 pixels, so the real ROI can be selected from multiple square regions. As is shown in Fig. 3, (a) and (b) are dense breast lesion examples for ROI detection. (c) and (d) are uniform breast lesion examples for ROI detection.
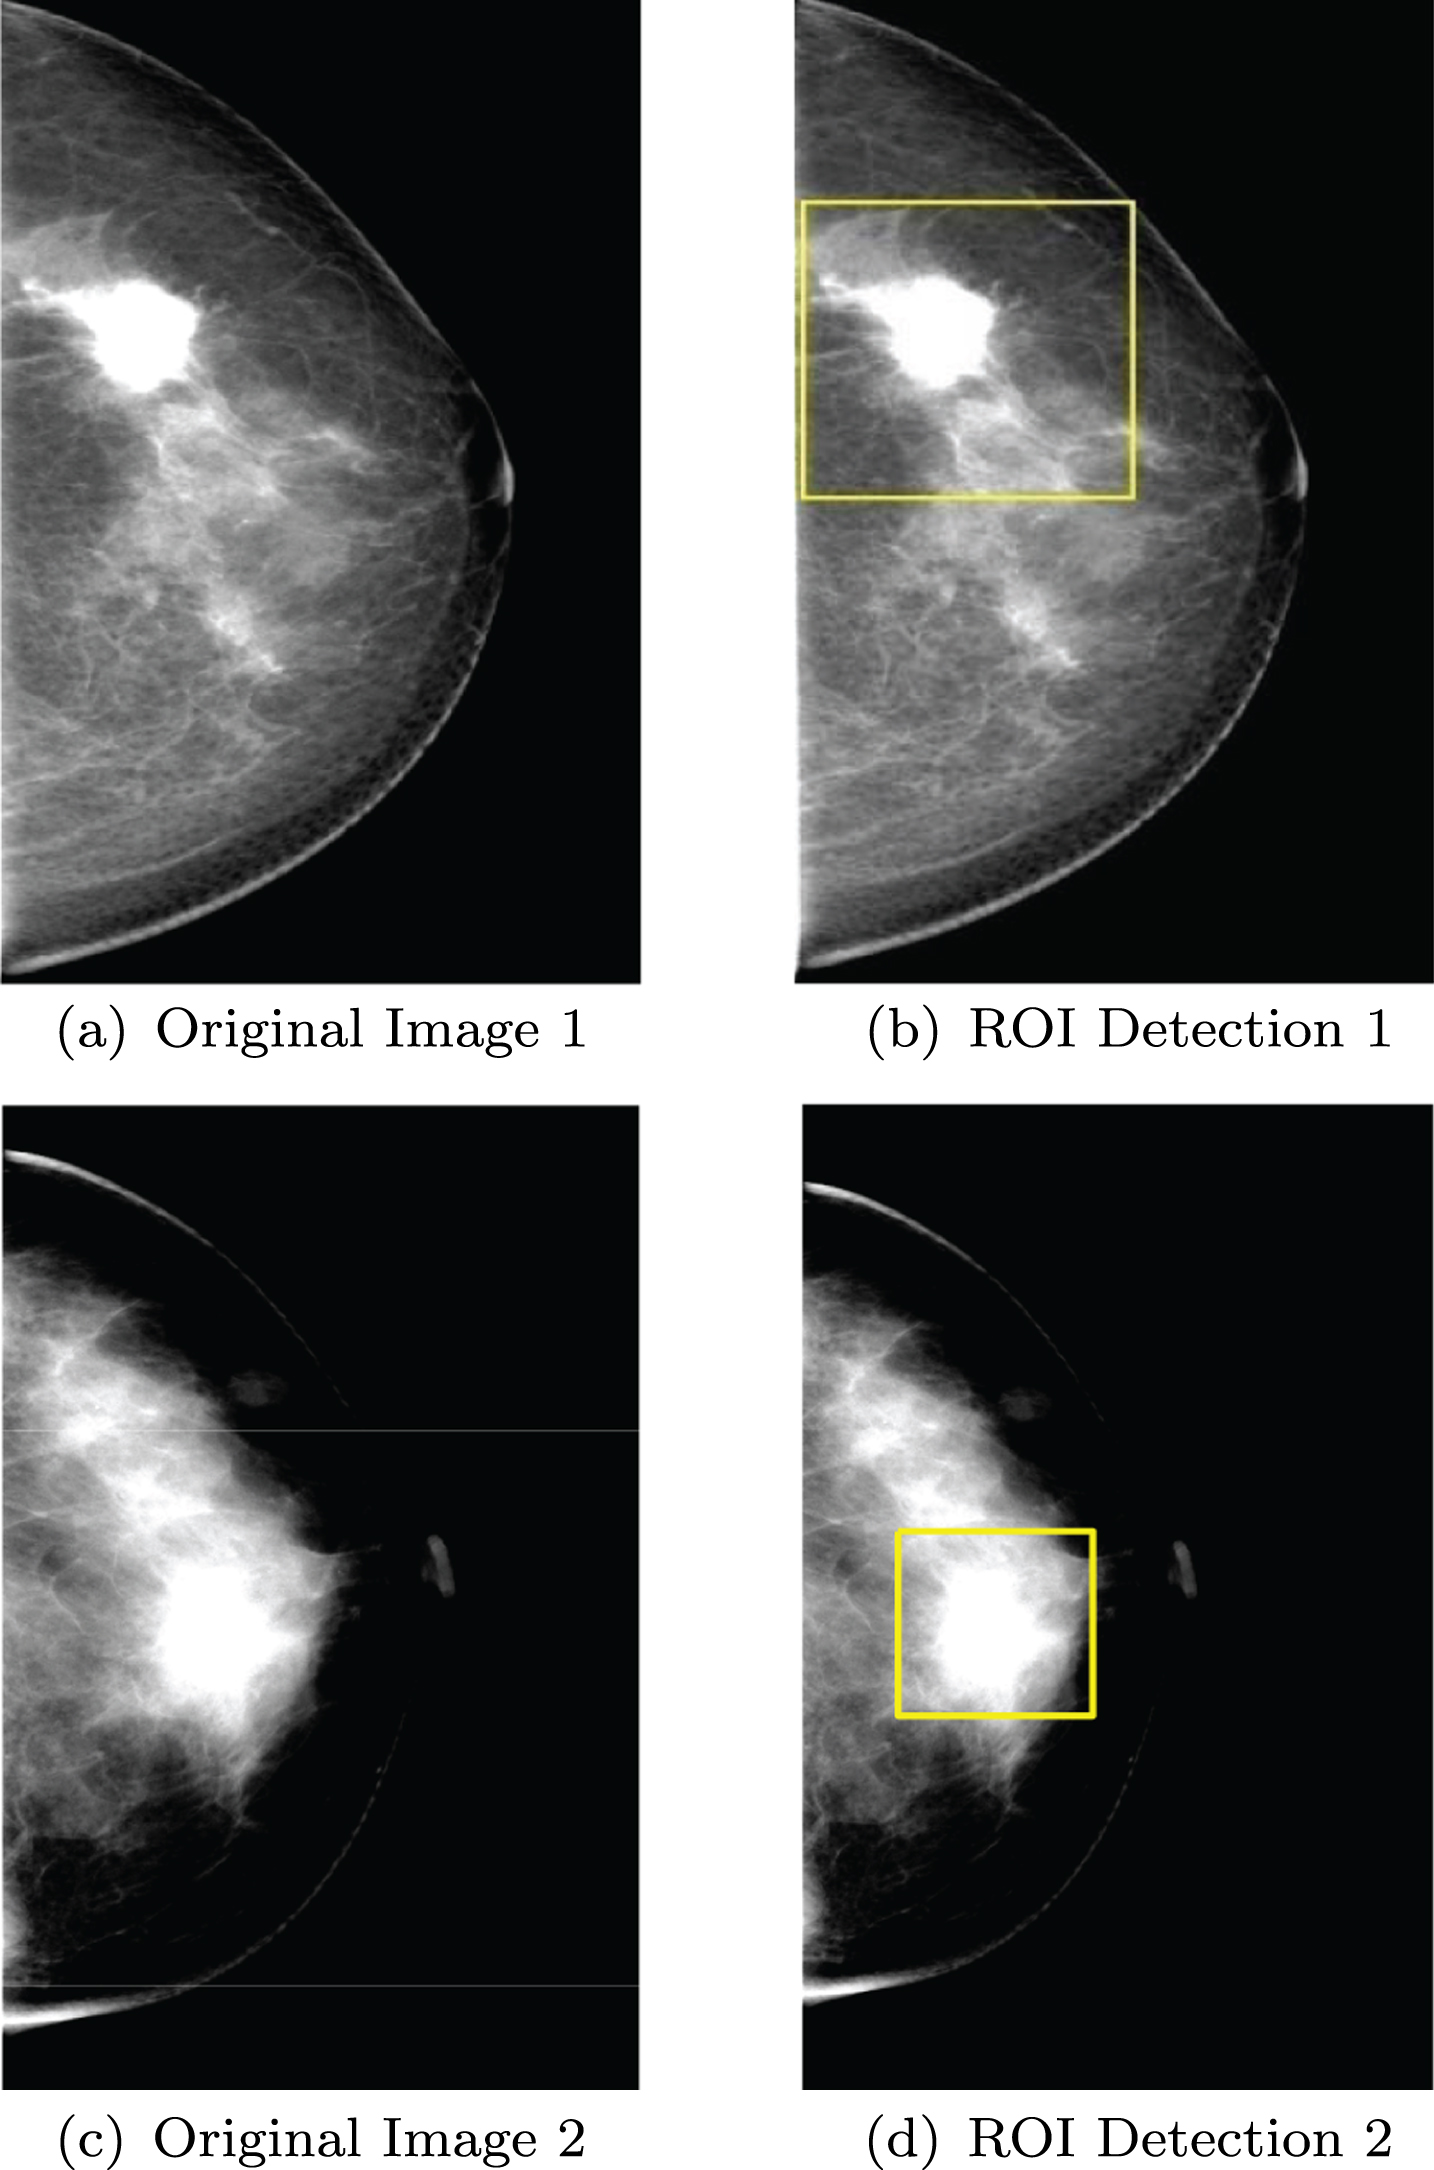
Demonstration for ROI Extracted.
Finally, in order to obtain the lesion location accurately, the suspected lesion segmentation in ROI is required. Otsu multi-threshold algorithm is used for segmentation. This method is to calculate between-cluster variance of the image pixels. A set of optimized thresholds is found when between-cluster variance is the largest. In the experiment, we processed the images in batches with selecting 9 thresholds. We found that the 9th threshold (the largest) in each experiment had the best segmentation effect. The result is shown in Fig. 4.
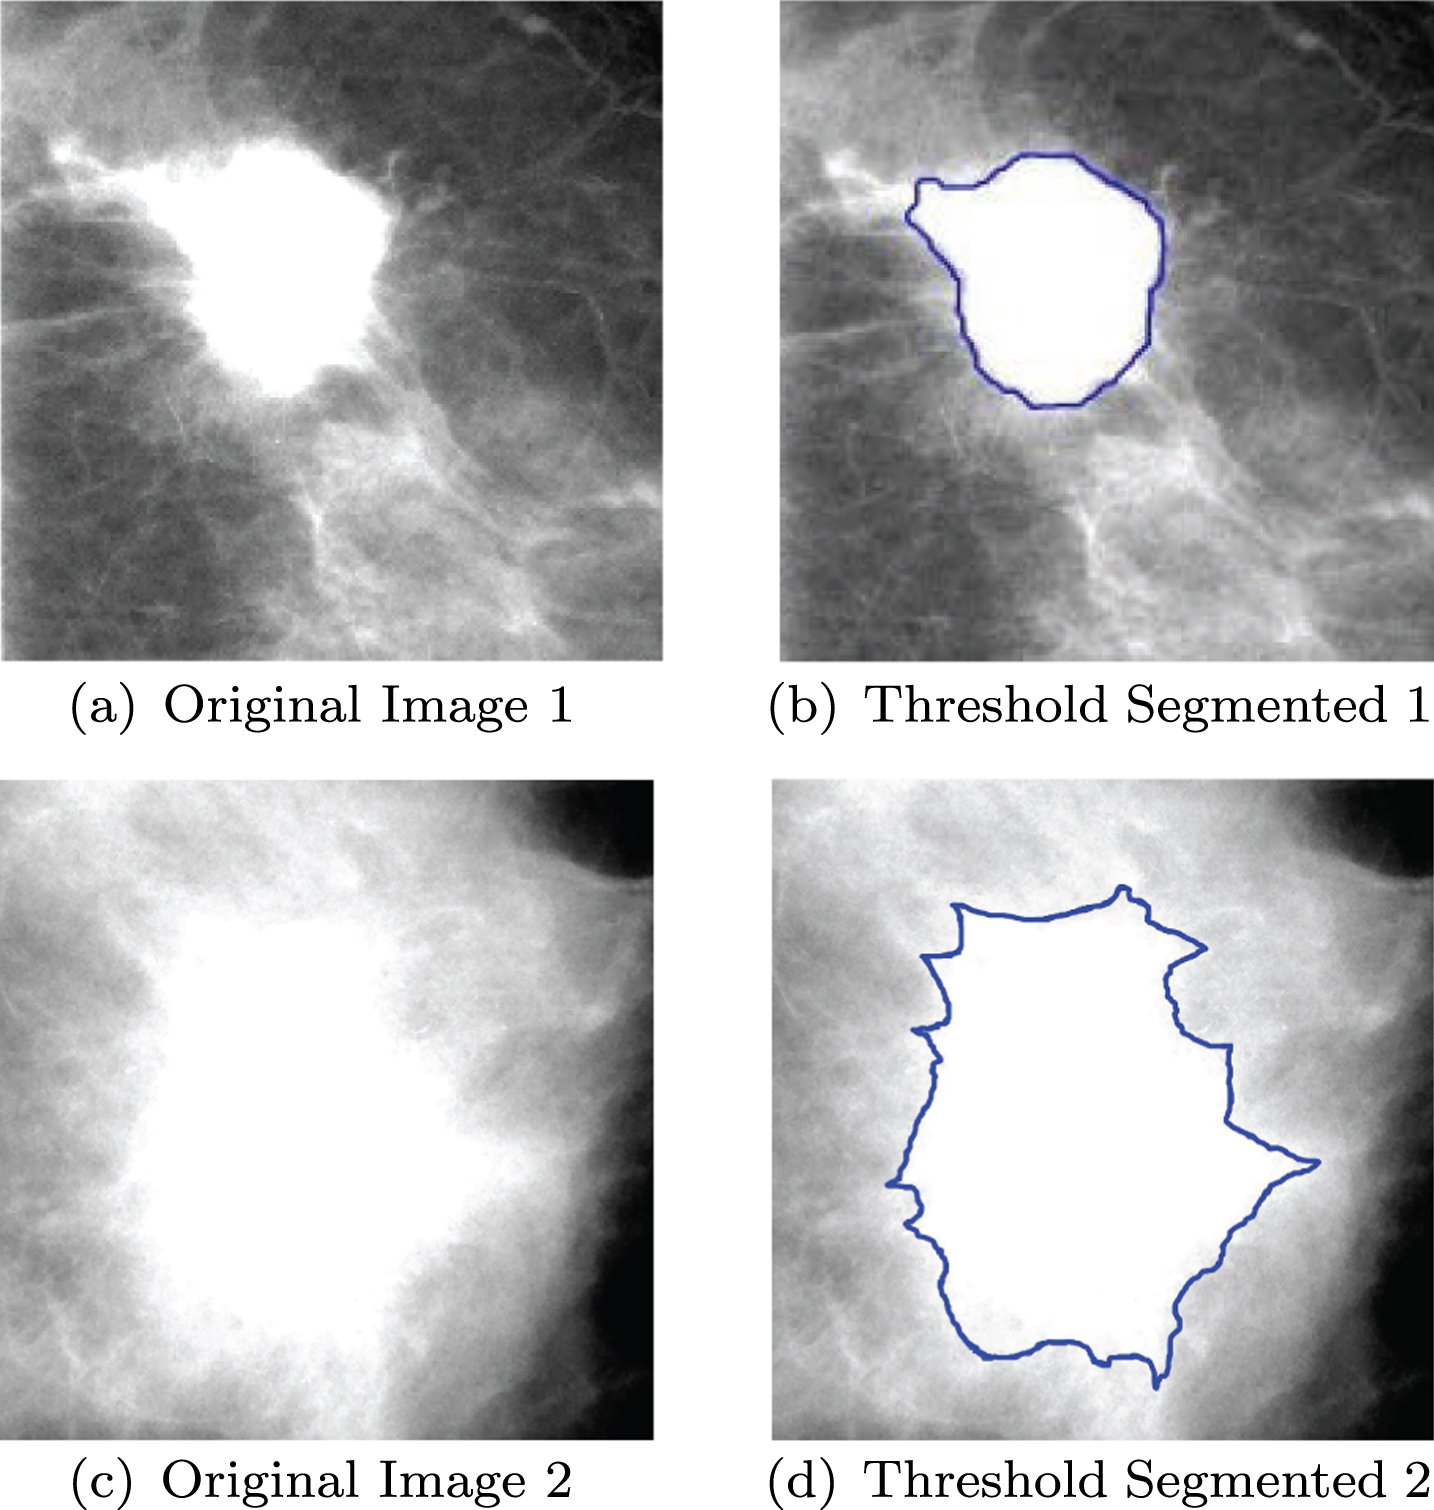
Demonstration for Lesion Segmentation.
Because of the difference in size, development and fertility of each patient, the shape, size, tissue distribution and density of the breast are different. Therefore, before extracting feature, it is necessary to retrieve the query image and dataset images in order to reduce the error. As standard breast images, suitable breast size is required and the shape is normal. This paper selects the Craniocaudal (CC) and Mediolateral Oblique (MLO) images as the standard breast image. The query image and dataset images are registered to the standard image by CPD method. After registration, the registration transformation matrix T is obtained, which is used to normalize the location feature.
3.1.3.1. Breast Contour Detection. Breast contour is extracted in the query image and the standard image, and two coordinate point sets of breast contour are formed. Firstly, in order to distinguish breast and background clearly, images are binarized according to threshold value. The threshold value is calculated by Otsu method, which is to find the maximum between-cluster variance of the image pixels. Thus, the breast portion is white and the background portion is black. Secondly, a smoother breast contour line is expected during contour registration, so morphological opening and closing algorithm are used to smooth the breast edge. Thirdly, Canny edge detection operator is used to obtain the contour. Also, the inflection point is found in the detected contour to remove the folder muscle.
3.1.3.2 Breast Contour Registration The method, CPD, is a registration algorithm for rigid and non-rigid point sets based on probability estimation [27, 21], which has good robustness on noise and non-overlapping points. CPD algorithm is widely used in the medical field and in 2010, Hu Y, Rijkhorst E J and Manber R propose to use CPD for blood vessels non-rigid registration [12]. In 2013, Sun H et al. propose to use CPD for left atrium shape modeling [16].
The breast contour of the image to be registered is extracted as x n , and the breast contour of standard image is extracted as y m . CPD is used to register these two breast contours and registration transformation matrix T is obtained. This matrix can determine the location of the registered breast lesion center. Fig. 5 is the registration of standard image and image to be registered. Fig. 5 (a) is the standard image and the green line is breast contour. Fig. 5 (b) is the image to be registered and the red line is breast contour. Fig. 5 (c) is demonstration for contour registration, in which green line is breast contour of standard image and red line is breast contour of the image to be registered.
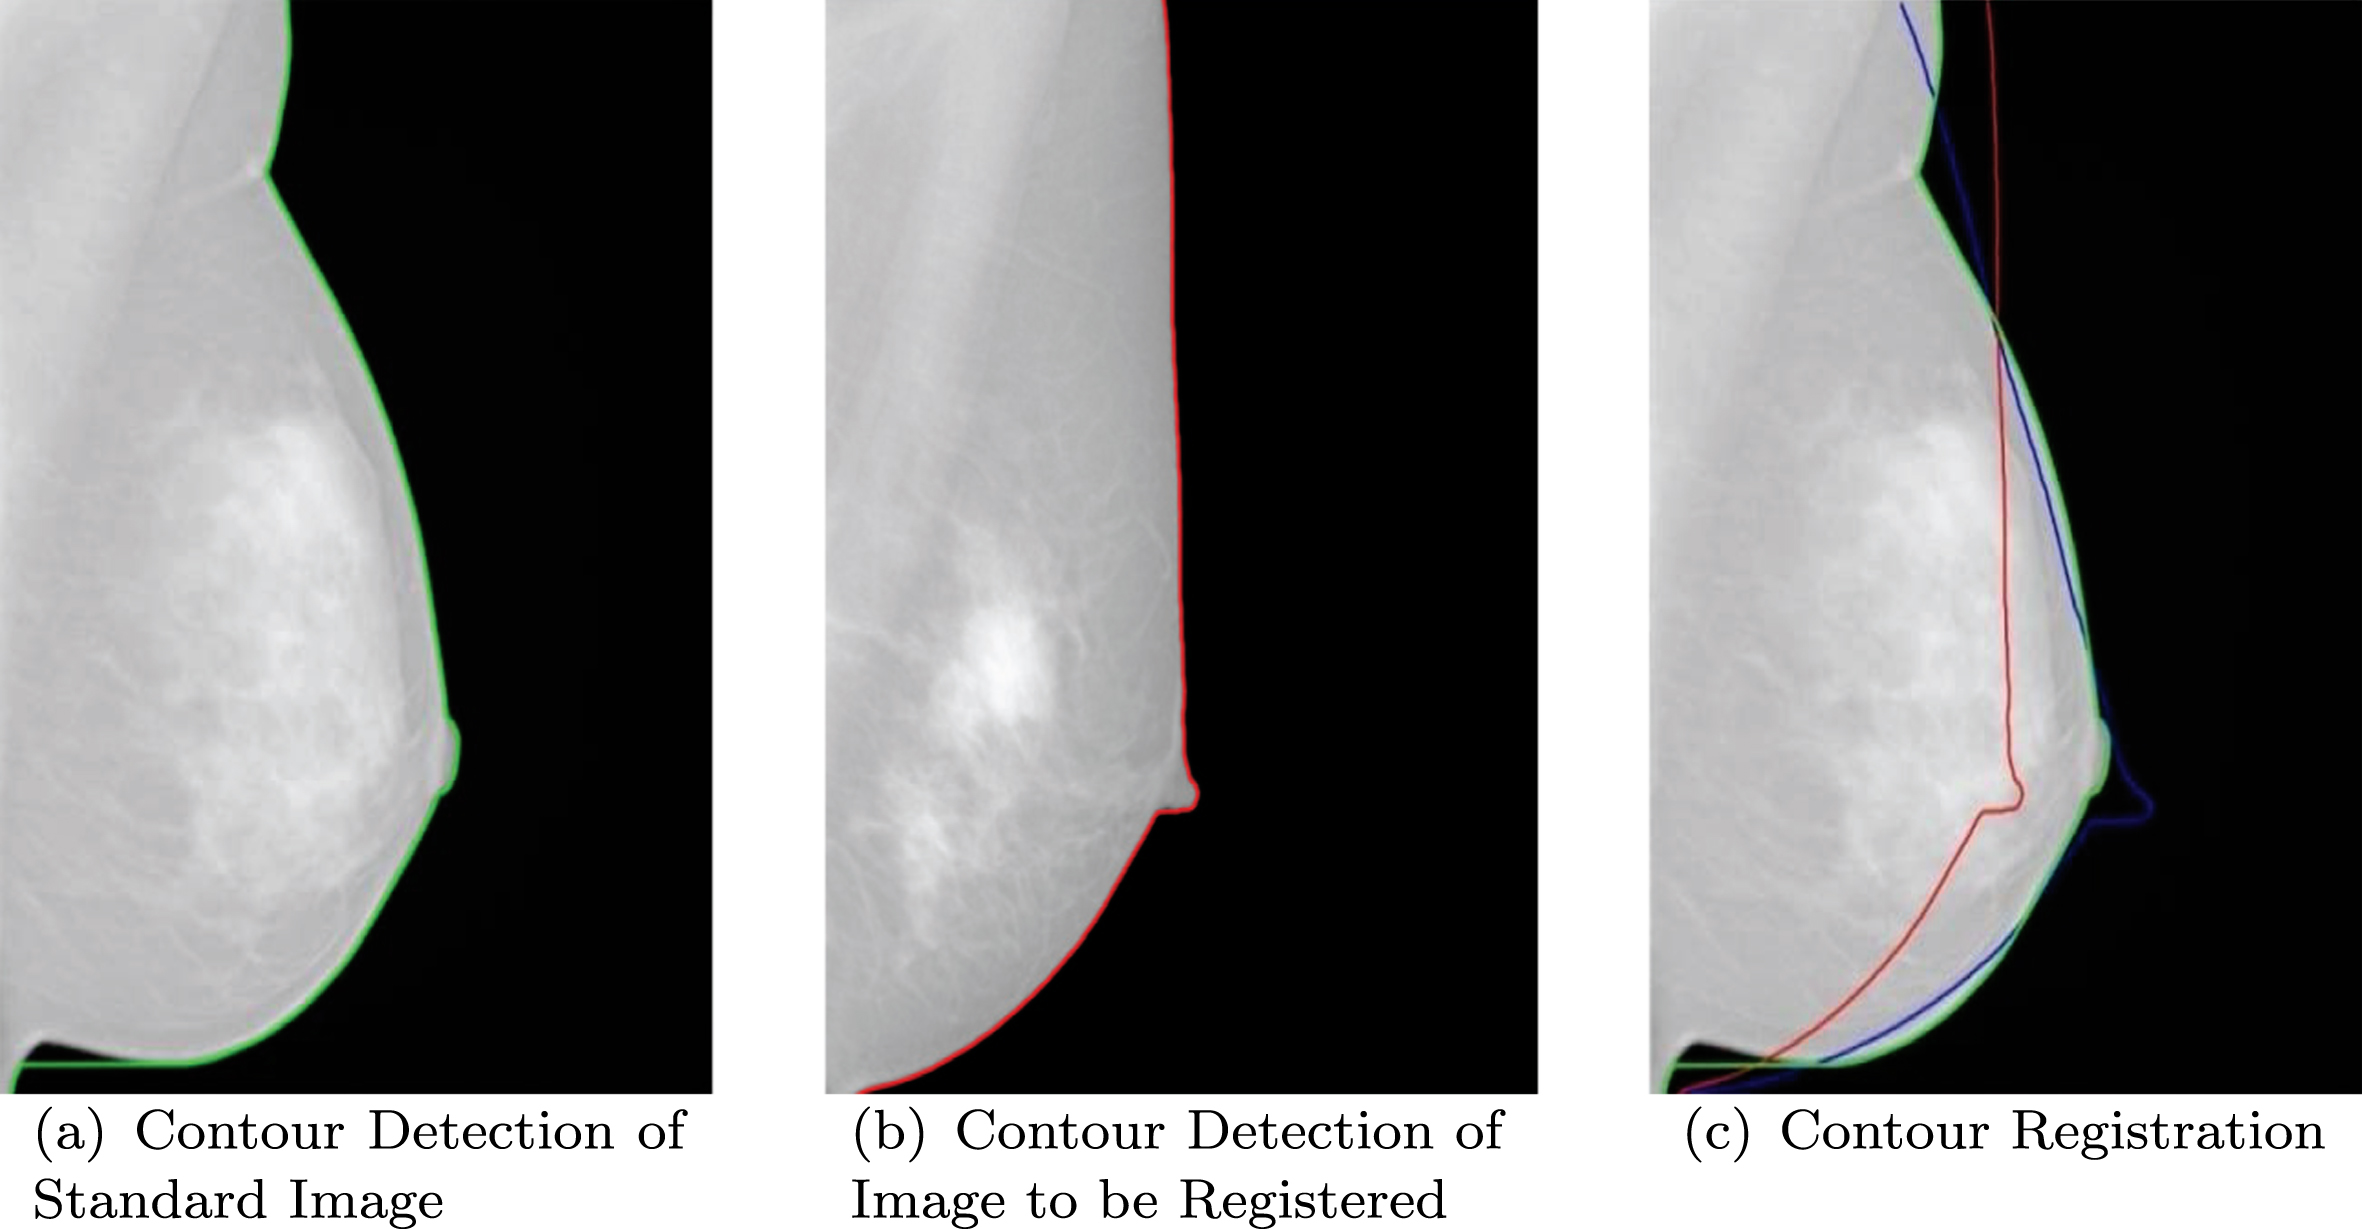
Demonstration for Contour Registration.
The location feature extraction of mammograms includes getting the center and radius of the suspected lesion, obtaining the location features of the image and using the ratio of intersection to union of the area for similarity measure.
Location Feature Modeling
The lesion is rounded approximately and the radius and center of the circle are taken to represent the lesion location. The model of the lesion location feature is shown in Fig. 5 Eq. (1), where L1 is the radius and L2 is the center.
The maximum of the lesion area in X-axis direction is calculated and half of the maximum is the abscissa of lesion center. Then, the ordinate can be determined similarly. Thus, original center coordinate can be obtained in the lesion which is not yet registered. After traversing all pixels in the lesion area and calculating the distance to the lesion center, the maximum distance between pixel points to the center point is the lesion radius, which is the lesion radius feature L1. Finally, calculating the lesion center which is not yet registered by transformation matrix T, a new lesion center can be obtained, which is the standard lesion center feature L2.
Fig. 6 is the demonstration of obtaining the standard lesion center. Fig. 6 (a) is the standard image for this paper. In Fig. 6 (b), this paper extracts the lesion center coordinates before registration, and calculates the lesion radius as the lesion radius location feature, where the blue circular area is the lesion, the red point is the lesion center and the blue line is lesion radius. Fig. 6 (c) is a demonstration of registration, where the green line is the breast contour of standard image, the red line is the contour of breast image to be registered, the red point is the lesion center before registration, the blue line is the registered contour by CPD algorithm, and the blue point is lesion center after registration. In Fig. 6 (d), the blue point is the lesion center after registration and the blue circular area is the new lesion. After getting new lesion area, the similarity measure can be further calculated.
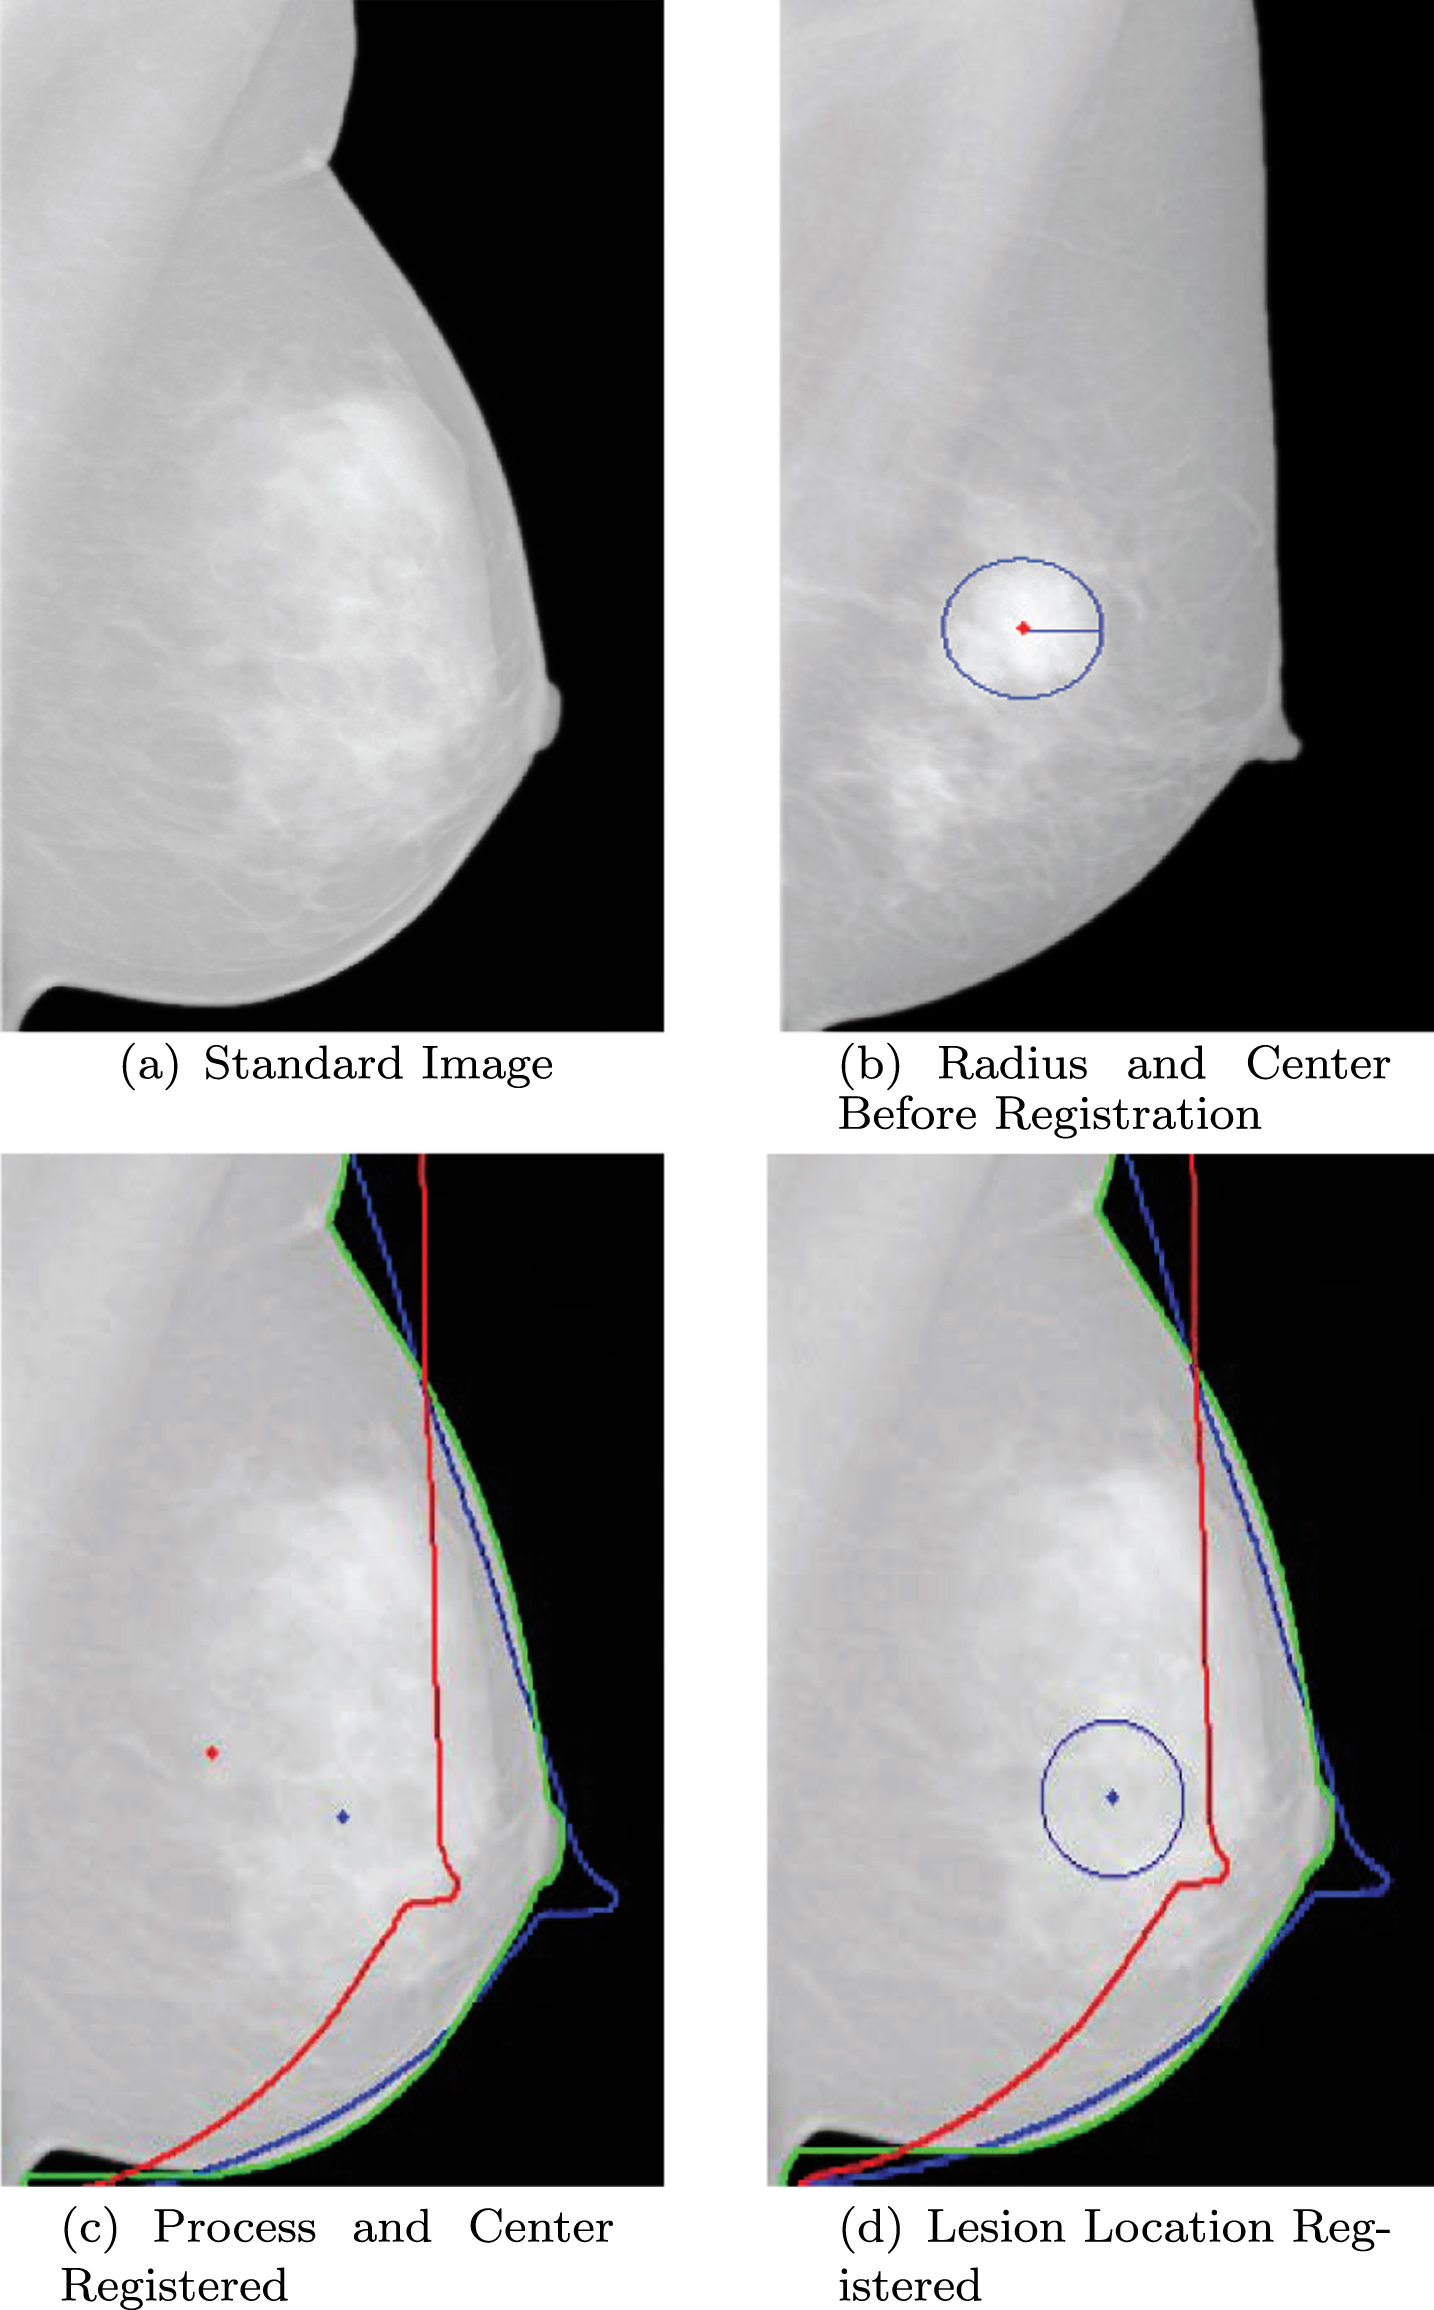
Demonstration for Lesions Location Feature Extraction.
After determining the center and radius of the lesion, a corresponding circular area, lesion registered, can be obtained. The ratio of intersection to union in different images and lesions is the lesion location similarity. The larger the ratio value, the more similar the images are.
Different lesions registered in the standard image are shown in Fig. 7, where the red circular area is one of the two lesions, the red point is the center, and the blue circular and point is another one. The ratio of intersection to union of these two lesions is the lesion location similarity. Assuming that the two images, P and Q, the lesion intersection is C in , the lesion union is C un and lesion location similarity is S. The calculation formula of lesion location similarity is shown in Eq. (2).

Demonstration for Different Lesions in Standard Image.
After extracting the content feature, including HOG [6], EDH [31], LBP [9] and Gray Level Histogram [29], the content feature of dataset images and the query image is obtained. Then, EMD can be used for similarity measure.
Content Feature Modeling
In the content-based image feature retrieval, the histogram is often used to extract the content feature [32]. In this paper, HOG, EDH, LBP and Gray Level Histogram are used to extract the content feature. In Eq. (3), it is content feature model for mammograms, where C1 is HOG feature, C2 is EDH feature, C3 is LBP feature, and C4 is the feature of Gray Level Histogram.
3.3.1.1. Histogram of Oriented Gradients. HOG is mainly used in the field of visual data mining, reflecting the local area texture information of the image [6]. As one of the most popular methods for extracting image feature and scene classification, it has the advantages of high speed and strong ability [32]. According to HOG algorithm, the oriented gradients of each pixel can be obtained, and then a rich histogram feature set with higher dimension is formed.
When calculating the HOG value, the image needs to be divided into blocks first. According to Eq. (4) and Eq. (5), gradient direction and gradient amplitude of each pixel can be calculated. After dividing 360 degrees into 36 equal parts, according to the gradient direction of each pixel, bilinear interpolation method is used to add the amplitude to the histogram in order to form a block-based HOG. Then, all the block gradient histogram are merged into a image whole HOG and this is the feature of the image C1 = {h1, h2, ⋯ h1728}.
In Eq. (4) and (5), M (x, y) is the gradient amplitude and θ (x, y) is the pixel gradient direction. I x is the oriented gradient in X-axis direction and I y is the oriented gradient in Y-axis direction. Algorithm 1 is the process of extracting the HOG feature.
3.3.1.2. Edge Direction Histogram EDH. is one of the general methods of extracting shape feature with a high computational speed [31]. Transforming the high-dimensional eigenvector into the corresponding low-dimensional eigenvector, it can solve the problem of high-dimensional eigenvector pattern recognition and can express the local structure information such as edge direction and gradient intensity jointly [7].
1:
2: Read images.
3: Preprocess images.
4: The image is divided into Cells by 400 × 400 pixel.
5: Calculate gradient direction and gradient amplitude of each cell according to Eq. (4) and (5).
6: Use 2 × 2 Cells to form a Block.
7: The feature vector of the block gradient direction are merged into the eigenvector, C1 = {h1, h2, … h1728}, of the whole image.
8:
9:
First, the edge detection operator, Canny [4], is used to extract the contour edge point set. Then, the gradient direction of contour edge point is calculated. The statistical histogram is accumulated for the pixels in different gradient directions and this histogram is the image feature C2 = {e1, e2, ⋯ e36}. Eq. (6) and (7) are the formula to calculate the amplitude G and direction θ of the edge gradient image, where G x is the gradient in X-axis direction and G y is the gradient in Y-axis direction. Algorithm 2 is the process of extracting the EDH feature.
1:
2: Read images.
3: Preprocess images.
4: Use Canny edge operator to extract image edges.
5: Calculate edge amplitude G and direction θ of each cell according to Eq. (6) and (7), and transform value of π to the angle (–π, π).
6: The histogram is taken for the edge direction. The interval (–π, π) is divided into 36 angle intervals equally, and the number of pixels in each angle interval is calculated according to θ.
7: The histogram is normalized and the result is the feature C2 = {e1, e2, … e36}.
8:
9:
3.3.1.3. Local Binary Pattern. The model, LBP, is a simple and efficient algorithm of texture feature description [9]. The edge detection algorithm, such as Sobel operator, is obtained by binary edge image. The texture feature is obtained by calculating the center pixel and its neighbor pixels and they are often combined with color and shape features to get a complete binary region descriptor [28]. Firstly, LBP value of all pixels except image boundary points is calculated by the eight neighborhood model. Then, LBP value of the pixels in the image is calculated by histogram and the histogram is the feature C3 = {l1, l2, ⋯ l10}. Eq. (8) and (9) is the formula to calculate LBP, where the gray value of the center, g c , is the threshold. In this paper, the surrounding neighborhood is 8 and the radius is 1. Algorithm 3 is the process of extracting the LBP feature.
1:
2: Read images.
3: Preprocess images.
4: Use Canny edge operator to extract image edges.
5: Calculate LBP value of all pixels according to Eq. (8) and (9), and the window size is 3 × 3.
6: LBP is normalized and the result is the feature C3 = {l1, l2, … l10}.
7: The feature vector of the block gradient direction are merged into the eigenvector, C1 = {h1, h2, … h1728}, of the whole image.
8:
9:
3.3.1.4 Gray Level Histogram. The gray level feature is one of the most important features in mammograms, which can reflect the image information. The lesion in mammograms is brighter than other regions, so extracting the feature of Gray Level Histogram is an important basis for image retrieval [29]. Algorithm 4 is the process of extracting Gray Level Histogram feature. Firstly, read the mammograms and pre-process the images. Next, calculate Gray Level Histogram of pixels in the images. Then, loop the process until extracting Gray Level Histogram feature, C4 = {g1, g2, ⋯ g256}, of all images.
1:
2: Read images.
3: Preprocess images.
4: Calculate Gray Level Histogram of the images C4 = {g1, g2, … g256}.
5:
6:
In this paper, EMD is used to calculate the similarity of content feature in mammograms [25]. For image retrieval in different feature space, EMD is an effective measure for the eigenvector.
For two mammograms, P and Q, P = {(P1, ωa1) , (P2, ωa2) , ⋯ , (P t , ω at )} is the content feature of image P, and Q = {(Q1, ωb1) , (Q2, ωb2) , ⋯ , (Q t , ω bt )} is the content feature of image Q. (P1, P2, ⋯ , P t ) and (Q1, Q2, ⋯ , Q t ) are image feature numbers. The eigenvalue, (ωa1, ωa2, ⋯ , ω at ), is the weight for vector P. The eigenvalue, (ωb1, ωb2, ⋯ , ω bt ), is the weight for vector Q. The number of content feature extracted from each image is the same, so the number of features in vector P and Q are both t. The eigenvector, P and Q, are matched to calculate the minimum cost.
Eq. (10) is to calculate the minimum cost, where d mn is the distance from the m th feature of P to the n th feature of Q, f mn is the difference value of eigenvalues, D = [d mn ] is the distance matrix and F = [f mn ] is the traffic matrix. Eq. (11), (12), (13) and (14) are the constraints to calculate EMD. Eq. (11) limits the flow of two features cannot be a negative number, so the absolute value is used when calculating the flow in this paper. Eq. (12) and (13) limit f mn cannot exceed ω at , nor ω bt . Eq. (14) is the maximum flow between the vectors.
In this paper, the formula to calculate content feature similarity is Eq. (15). The cost of the unit flow can be calculated by dividing the minimum cost by the total flow. The less the result, the more similar the content feature is, and the images are more similar.
In this paper, the lesion location similarity and content similarity is assigned with different weights to calculate fusion similarity in the image. Assuming that the weight of the comprehensive similarity is A, then location similarity is A% and content similarity is (100 - A)% of the weight.
About lesion location feature similarity S based on Eq. (2), it is the ratio of intersection to union of different image lesions. The ratio is in the range of 0-1. The larger the ratio value, the more similar the images are. Because S is a normalized value, the weight A% is directly used to calculate fusion feature similarity.
About content feature similarity E based on Eq. (15), it is the cost of the unit flow using EMD method. The smaller the cost, the more similar the images are. To normalize the value, the weight (100 - A)% on
Assuming the fusion similarity is Z, Eq. (16) is the formula to calculate fusion similarity, where S is lesion location similarity and E is content similarity.
Based on the location and content feature of mammogram retrieval, the experiment is designed, the results are discussed, and the experiment data are introduced. The experiment is designed on different value of A, which is the parameter of calculating fusion similarity. One group of the experiments has both lesion location feature similarity and content feature similarity. Another only has lesion location feature similarity or content feature similarity. Then, all retrieval results are compared and discussed with the evaluation standard.
Experimental Data
The experimental data used in this paper are from women in Northeast China and all mammograms are diagnosed by the radiologists. These mammograms are taken by Senographe 2000D full digital mammography camera, and the patient samples are women between 31 to 73 years old from August in 2005 to March in 2007. There are 440 mammograms from 110 patients. Every patient has 4 mammograms, including CC and MLO images of bilateral breasts (R-CC, R-MLO, L-CC and L-MLO).
For every query image, it is important to confirm its gold query standard. To obtain the gold standard for one given query image, 5 radiologists diagnose independently in advance. Every radiologist confirms 15 most similar images and ranks these 15 cases based on similarity. The most similar is top 1 and its score is 1. The last is 15 and its score is 15 (Other mammograms not in the rank has the score 16.). Thus, 75 cases are obtained, but some cases may be repeated and some different cases may have the same score. From these 5 ranks, add the score of the same images. The image with minimum score is admitted as the most similar mammogram of gold query standard. The image with the 2nd less score is admitted as the 2nd similar mammogram of gold query standard. In this way, 15 different mammograms are admitted as gold standard for one given query image. (If the added score is same, 5 radiologists will determine together.)
Parameter Determination
In this paper, when calculating image fusion similarity Z, the weight of comprehensive similarity is set to A. And then, location similarity S is A% of the weight and content similarity E is (100 - A)% of the weight. During the image retrieval experiment, A is set to different value to obtain different retrieval results. The results are compared and analyzed to get the best conclusion.
Evaluation Standard
In this paper, the retrieval results are evaluated by results scoring, precision, recall and comprehensive indicators. Precision, Recall and Comprehensive Indicator Assuming the retrieval result is S, that dataset images result which are similar to the query image is T, then the intersection of retrieval result and dataset similar images result is S ∩ T. In Eq. (17), P is precision. In Eq. (18), R is recall. In Eq. (19), F is comprehensive indicator.
Retrieval Results Scoring Evaluation Five individuals score the retrieval results of different parameter A and evaluate retrieval results. The score is the satisfaction of retrieval results, and the higher score means more satisfactory. Return Position Evaluation Gold standard images consist of 15 mammograms evaluated by radiologists. According to the degree of similarity, the position scores are set for these 15 images. The most similar is 1, the second similar is 2, and then, the last one is 15. Except for gold standard, other images are set to 16. After retrieving, 15 most similar images will be returned. According to the return order, position score is set. The first return is 1 and the last is 15. Position score between return images and gold standard images is subtracted and its absolute value is calculated. If the return image is in gold standard images, its position score is subtracted with gold standard images directly and absolute value is calculated. If the return image is not in gold standard images, its position score is subtracted with 16. The mean and variance are calculated for these 15 position scores and they are used to evaluate the results. Position evaluation is the difference in return position between retrieval results and gold standard images. The difference constitutes a sequence, using the mean and variance to describe it. Mean is the average of a set of data, and the smaller the average, the smaller the sequence is, which means the difference between retrieval results and gold standard images is small. Variance is used to describe the fluctuation of a set of data, and the smaller the variance, the smaller the fluctuation is, which means the return image and the gold standard image of the same position is more possible to be the same image.
In the experiment, 100 different mammograms are selected randomly to be the query images. For every query image, the most 15 similar images will be returned as the retrieval result.
Based on lesion location retrieval, the value of parameter A is set to 100. The lesion location feature similarity S accounts for 100% of fusion feature similarity Z, and content feature similarity E is 0%. Based on content retrieval, the value of parameter A is set to 0. The lesion location feature similarity S accounts for 0% of fusion feature similarity Z, and content feature similarity E is 100%.
The lesion location feature and content feature are fused, setting A to 20, 30, 40 and 50. Lesion location feature similarity S accounts for 20%, 30%, 40% and 50% of fusion feature similarity Z. Content feature similarity E accounts for 80%, 70%, 60% and 50%. Table 1 is the experimental parameters.
Weight Parameter Setting
Weight Parameter Setting
Table 2 shows only location similarity for image retrieval. When A = 100, the average precision of image retrieval is 0.68, recall is 0.70, comprehensive indicator is 0.60, the average satisfaction is 91.8%, mean is 4.7, and variance is 18.7. Table 2 also shows only content similarity for image retrieval. When A = 0, the average precision of image retrieval is 0.71, recall is 0.67, comprehensive indicator is 0.69, the average satisfaction is 92.0%, mean is 4.6, and variance is 18.5. Thus, the result of only location-based retrieval and only content-based retrieval is almost the same in precision, recall, comprehensive indicator, satisfaction, mean and variance.
Results of Evaluation Standard
Results of Evaluation Standard
During retrieval fusing location feature, there is only content feature when A=0, and there is only lesion location feature when A=100. When A = 0, the average precision is 0.72, the average recall is 0.66, comprehensive indicator is 0.69, the average satisfaction is 92.0%, the mean is 4.4 and the variance is 18.6. When A = 100, the average precision is 0.70, the average recall is 0.73, comprehensive indicator is 0.71, the average satisfaction is 93.3%, the mean is 4.7 and the variance is 18.6. When A = 20, 30, 40 and 50, lesion location feature and content feature are fused with relevant proportions. At this time, the average precision is 0.72, 0.76, 0.83 and 0.78, the average recall is 0.67, 0.72, 0.76 and 0.75, comprehensive indicator is 0.69, 0.74, 0.79 and 0.76, the average satisfaction is 92.1%, 94.3%, 96.0% and 94.8%, the mean is 4.3, 4.4, 4.2 and 4.5, and the variance is 18.3, 18.0, 17.7 and 17.9. Compared fusion cases (A = 20, 30, 40, 50) and non-fusion cases (A = 0, 100), fusion results are improved in precision, recall, comprehensive indicator and satisfaction. Thus, location-based image retrieval can improve image retrieval method in precision, recall, comprehensive indicator, satisfaction, mean and variance.
Figs. 8, 9 and 10 show obviously that when A = 40 (location feature similarity 40% and content feature similarity 60%), the mean and variance is smaller than other situations and the other four indicators are larger than other situations. Thus, fusing location feature similarity has obvious advantages in precision, recall, comprehensive indicator, satisfaction, mean and variance. Also, when lesion location feature similarity accounts for 40%, it has the best result.
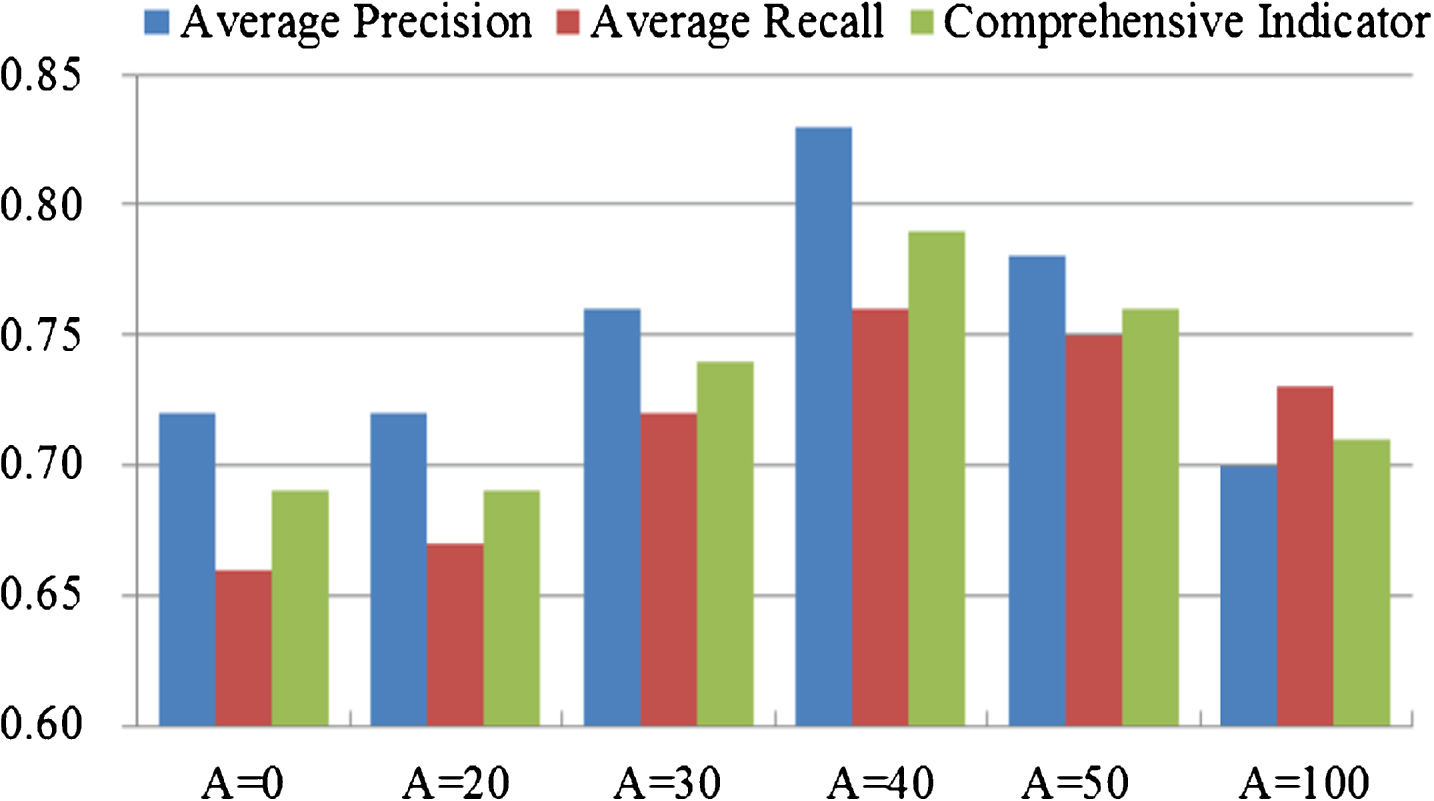
Comparison of Precision, Recall and Comprehensive Indicator.
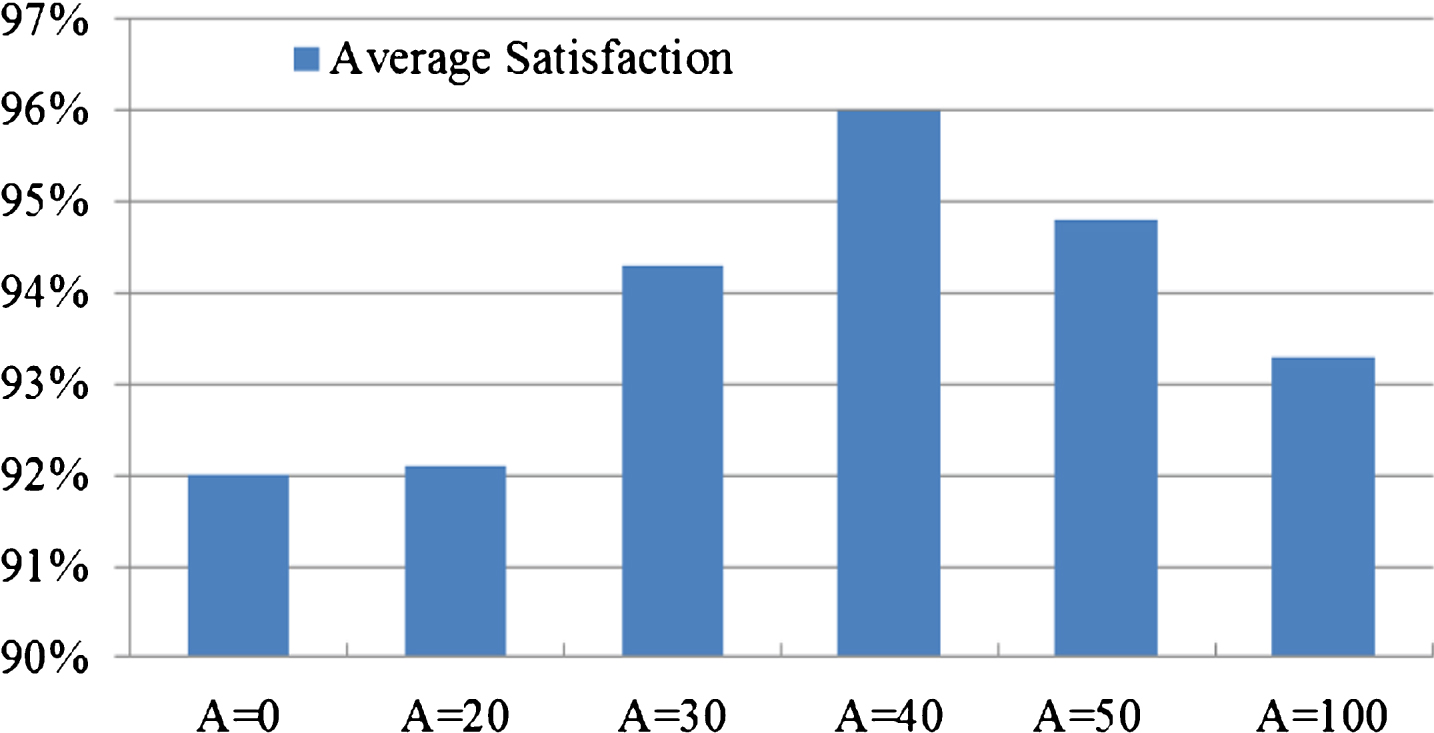
Comparison of Satisfaction.
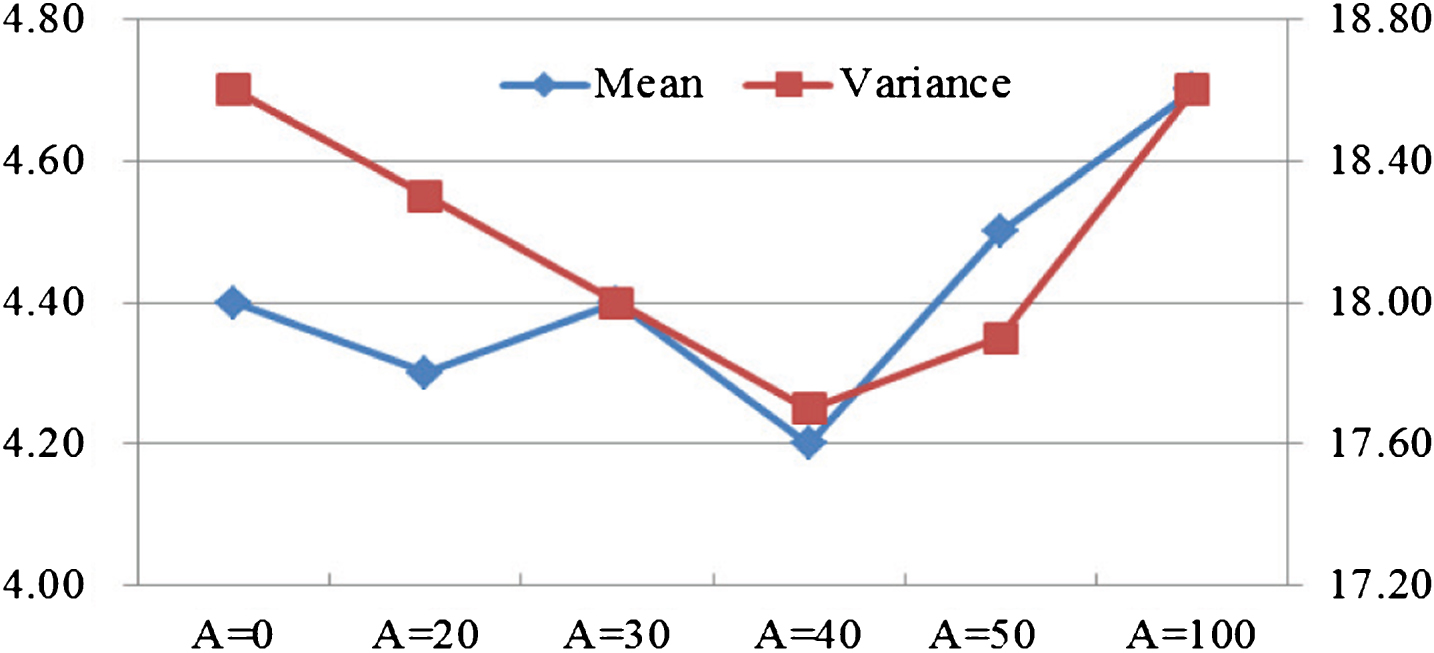
Comparison of Mean and Variance.
Breast cancer screening is an important means of early detection, and it can reduce the mortality of breast cancer patients. Molybdenum Target Mammography is an important basis for early detection and diagnosis of breast cancer. Different manifestations of breast lesions become the only standard for early diagnosis, but diagnosis is difficult. Image retrieval can assist doctors to carry out disease diagnosis effectively.
In this paper, a method of breast image retrieval fusing lesion location feature is proposed. After the image is enhanced and denoised, the region of interest is extracted and the lesion area is segmented. The center and radius of the lesion is obtained using CPD algorithm and then, location similarity is obtained by calculating the intersection and union in lesion area. Also, HOG, EDH, LBP histogram and Gray Level Histogram are extracted using EMD algorithm for content similarity measure. Finally, the similarity is fused and the first n images which are similar to the query image are obtained. About different weight parameters A and fusing location feature or not, the experiments are designed, and after discussing results, fusing lesion location feature can improve image retrieval.
Disclosure statement
The work described has not been published previously in any form. All authors declare that they have no competing interests. There are no financial or personal relationships with other people or organisations that could inappropriately influence our work.
Funding
This research is partially supported by the following foundations: the national Natural Science Foundation of China [grant numbers 61402089 and 61472069], the Fundamental Research Funds for the Central Universities [grant numbers N161904001 and N161602003], the China Postdoctoral Science Foundation [grant number 2016M591447] and the Postdoctoral Science Foundation of Northeastern University [grant number 20160203].