
Abstract
PURPOSE:
This retrospective study is designed to develop a Radiomics-based strategy for preoperatively predicting lymph node (LN) status in the resectable pancreatic ductal adenocarcinoma (PDAC) patients.
METHODS:
Eighty-five patients with histopathological confirmed PDAC are included, of which 35 are LN metastasis positive and 50 are LN metastasis negative. Initially, 1,124 radiomics features are computed from CT images of each patient. After a series of feature selection, a Radiomics logistic regression (LOG) model is developed. Subsequently, the predictive efficiency of the model is validated using a leave-one-out cross-validation method. The model performance is evaluated on discrimination and compared with the conventional CT evaluation method based on subjective CT image features.
RESULTS:
Radiomics LOG model is developed based on eight most related radiomics features. Remarkable differences are demonstrated between patients with LN metastasis positive and LN metastasis negative in Radiomics LOG scores namely, 0.535±1.307 (mean±standard deviation) vs. −1.514±1.800 (mean±standard deviation) with p < 0.001. Radiomics LOG model shows significantly higher predictive efficiency compared to the conventional evaluation method of LN status in which areas under ROC curves are AUC = 0.841 with 95% confidence interval (CI: 0.758∼0.925) vs. AUC = 0.682 with (95% CI: 0.566∼0.798). Leave-one-out cross validation indicates that the Radiomics LOG model correctly classifies 70.3% cases, while the conventional CT evaluation method only correctly classifies 57.0% cases.
CONCLUSION:
A radiomics-based strategy provides an individualized LN status evaluation in PDAC patients, which may help clinicians implement an optimal personalized patient treatment.
Keywords
Introduction
Pancreatic cancer is the deadliest malignancy, and pancreatic ductal adenocarcinoma (PDAC) is the main type of pancreatic cancer [1, 2]. Over the past few decades, many types of cancers showed a stable or decreasing trends of incidence and mortality rates. However, the incidence of PDAC continues to rise and the prognosis is still poor [3, 4]. Radical pancreatic resection is the only potentially curative therapy for PDAC. However, the patients who suitable for radical resection only account for 10–15%, and the majority of patients are un-resectable or already have metastatic disease [5]. Lymph node status is one of the factors affecting whether to undergo radical treatment. Previous studies showed that lymph node metastases can be found in 70–80% of surgically resected patients with PDAC [6–9] and is strongly correlated with poor prognosis [10]. The Evaluation of lymph node status has been regarded as a significant factor when determining personalized therapy method for cancer patients [11–14].
Surgical staging at the time of pancreatic resection is the gold standard for the accurate N staging of PDAC. However, it is invasive and can only be obtained after surgery. Currently, computed tomography (CT) is the most common imaging modality for PDAC therapy guidance and tumor monitor. However, previous studies have shown that examination of peri-pancreatic lymph nodes by conventional CT cannot predict the presence of metastatic deposits [15]. Other noninvasive strategies include MRI and positron emission tomography (PET), but the previous studies have also showed that none of them can accurately preoperative identification of LN metastases [16].
Radiomics is an emerging field focused on extracting quantitative information from medical images through advanced imaging processing and analysis tools [17]. Research studies have demonstrated that radiomics can be used to evaluate LN metastases in bladder cancer, biliary tract cancer and Lung cancer [18–20]. However, few studies have used radiomics to predict PDAC LN metastases. Therefore, this study intends to develop and validate a predictive model based on the radiomics strategy to predict PDAC LN metastases non-invasively, enabling a better personalized evaluation and treatment.
Materials and methods
Patient data
In total, 85 patients underwent curative intent surgical resection for PDAC were collected. The inclusion criteria were: (1) Histologically confirmed diagnosis of PDAC with primary tumor resection and standard lymphadenectomy [21]; (2) availability of contrast-enhanced CT images for analysis, 2 weeks before surgery; (3) not received any treatment (chemotherapy, radiotherapy, or chemoradiotherapy) before their CT scan. The exclusion criteria were: (1) patients with other concurrent primary malignant tumors (2) those CT images with an unclear pancreatic mass. (3) incomplete clinical data. Finally, a total of 85 patients were included, of which 35 patients were LN metastasis positive (LN+) and 50 patients were LN metastasis negative (LN−). Our institutional ethics board approved this retrospective study and waived the requirement for informed consent.
Image acquisitions
The CT examinations were performed using quadruple-phase on Philips iCT 256 (Philips, Amsterdam, Netherlands), which consisted of unenhanced, arterial phases, venous phases and equilibrium phases. The scanning parameters were as follows: the tube voltage 120 kV, tube current modulation 200–380 mA, field of view 380–500mm, and reconstructed section thickness 5 mm. About per 1.2–1.5 mL of iodinated contrast (Omnipaque 300, GE Healthcare) per kilogram of body weight was administered using a power injector at 3.0 mL/s after unenhanced scan. Arterial phase images were obtained 25–35s after the trigger threshold, 60–70s for the venous phase and 3min for the equilibrium phase.
CT subjective image features evaluation and establishment of conventional CT evaluation model
According to the related literature [22–24], we evaluated several conventional CT features which may be useful for predicting LN metastasis. These features including primary tumor location, pancreatic duct dilatation, bile duct dilatation, ovoid LN, non-uniform density LN and LN short diameter. LN short diameter was measured on the trans-axial image of CT, an LN with a short diameter larger than 1 cm in the short axis was predicted as positive (LN+); otherwise, it was predicted as negative (LN−). All these measurements were done by two experienced radiologists (with 5 and 9 years of clinical experience in abdomen CT interpretation, respectively, and blinded to patient LN metastasis status). Their disagreement on measurement was resolved by consensus. The positive result was recorded as 1, the negative result was recorded as o. Finally, all these features were run through a logistic regression (LOG) and a conventional LOG model was built.
ROI segmentation and Radiomics features extraction
This study used the manual segmentation function of 3D-slicer (Version 4.11.0, https://www.slicer.org/) to segment the region of interest (ROI). To evaluate the inter-observer reproducibility, 2 radiologists performed the ROI segmentation in a blinded fashion, respectively. Both knew the PDAC diagnosis but did not know the clinical and LN metastasis status. To assess the intra-observer reproducibility, reader 1 repeated the feature extraction twice in a 2-week period. Both two readers were aware of contouring the ROI on the slice with the largest visible cross section of the tumor on the venous phase (the phase during which pancreatic cancer boundaries were most consistently seen). The ROI was within the tumor and close to the tumor margin [25].
The radiomics features were automatically extracted from the ROIs by using the SlicerRadiomics (an extension in 3D-slicer). which include 93 original texture features, 8 morphology features, and 1023 high-order features (279 Gaussian filter transform features and 744 Wavelet transform features). In total, 1124 radiomic features were extracted in this study. A detailed description of the radiomics features can be found in previous studies [26, 27]. The reproducibility of radiomics features in inter/intra-observer was reflected according to the intra-class correlation coefficients (ICCs) and we chose 50 random ROI segmentations for calculating ICCs.
Statistics analysis
The workflow of radiomics analysis is summarized in Fig. 1. All analyses were performed on SPSS 20.0 (IBM, Armonk, NY, USA) or R software (V3.5.0, https://www.R-project.org/). Independent sample t-test or χ2 test was used to assess the differences of clinical characteristics between LN+ and LN− group. The following four steps were implemented to identify significant radiomics features. First, the Mann-Whitney U-test was applied to select radiomics features that significantly different between LN+ and LN− group (p < 0.05). Second, we excluded features with ICC <0.3 to eliminate unstable features [28]. Third, we filtered features based on their independence from others by using spearman correlation test. Finally, feature selection was done by using the least absolute shrinkage and selection operator (LASSO) method. The remaining non-zero coefficient features were run through a logistic regression (LOG) model (“glmnet” package in R software). Then, performance was validated by a leave-one-out cross-validation method. Receiver operating characteristic (ROC) curve was used to evaluate the diagnostic performance of LOG model. Corresponding areas under the curve (AUCs) were calculated. The DeLong test was used to ROC comparison between LOG model and conventional evaluation method. All with P value <0.05 considered as statistically significant.
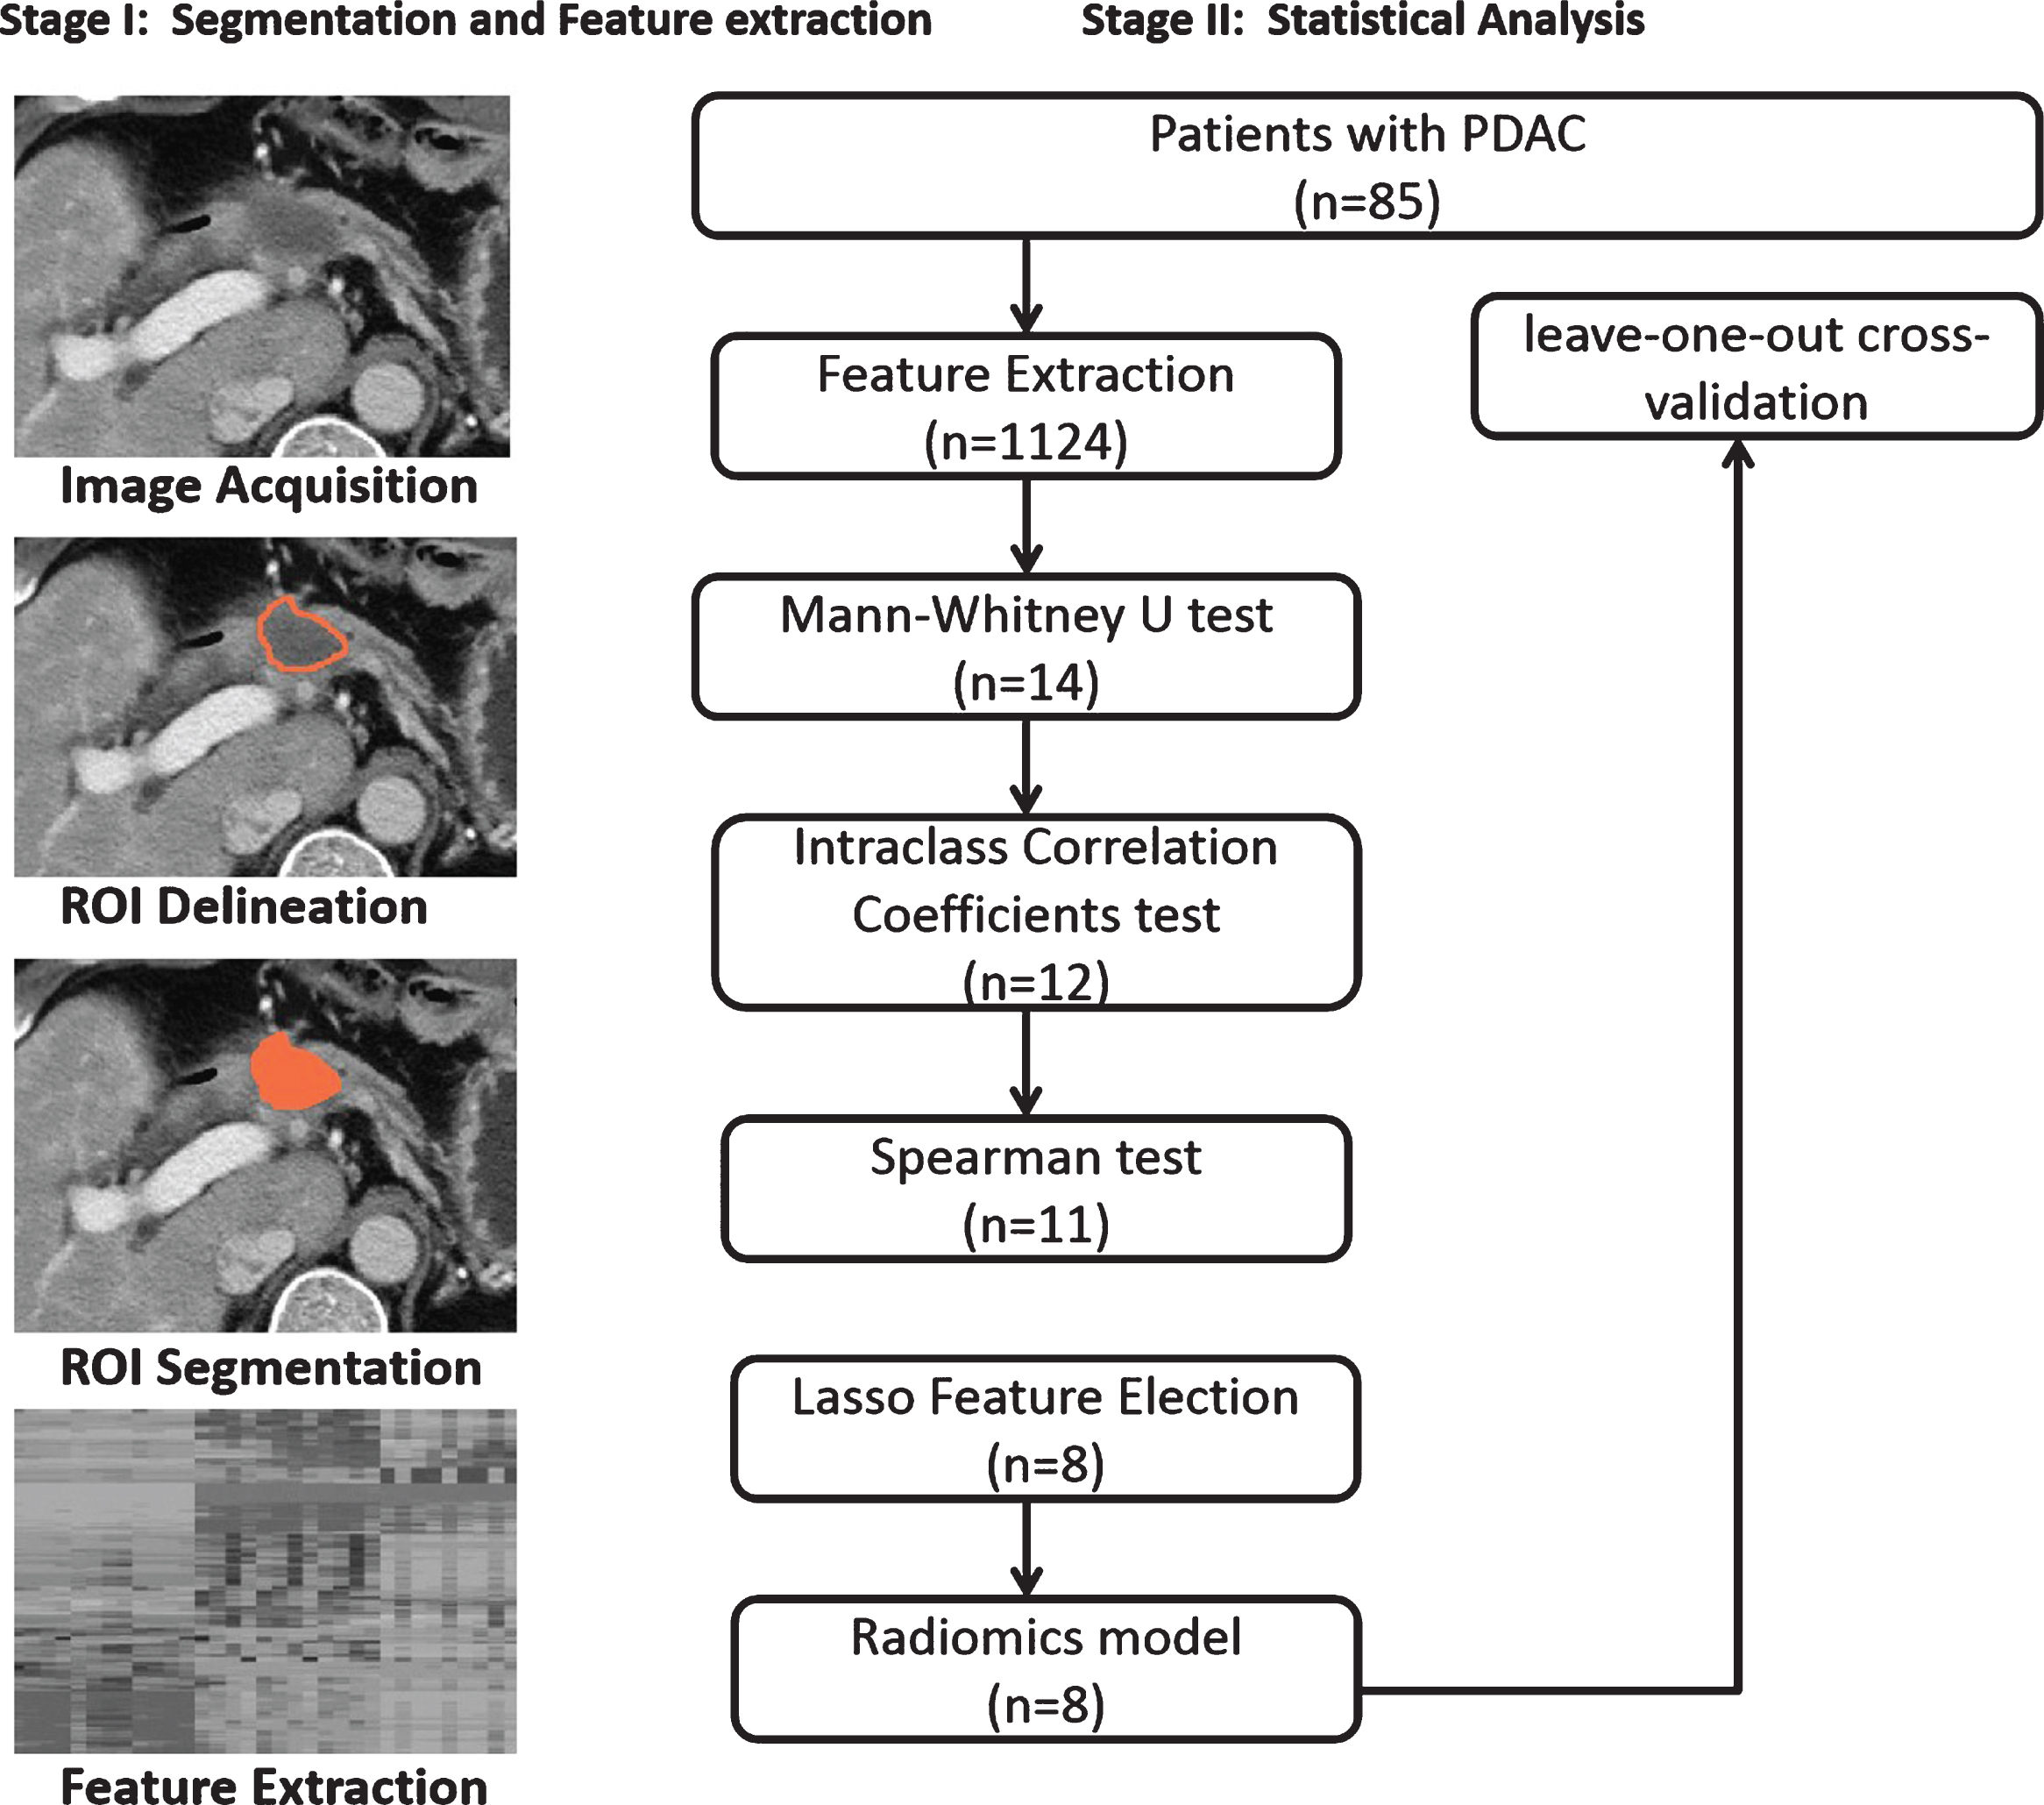
Radiomics analysis workflow of this study.
Clinical features
Table 1 listed the clinical characteristics of patients. In total, 85 patients were included. (median age: 60 years, age range: 37–80 years) In univariate analyses, the results showed that there were no significant differences between LN+ and LN− groups in clinical characteristics (P > 0.05).
Characteristics of the study population
Characteristics of the study population
LN, lymph nodes; LN+, lymph nodes metastasis positive; LN−, lymph nodes metastasis negative; PDD, pancreatic duct dilatation; BD, bile duct dilatation; CT, computed tomography; SD, standard deviation.
In univariate analyses, the result showed that no conventional features could be used to discriminate the LN+ group and LN− group with an AUC ranging from 0.506 to 0.552. Putting these features into the logistic regression analysis, the conventional LOG model was constructed and the calculation formula for the conventional LOG model scores was
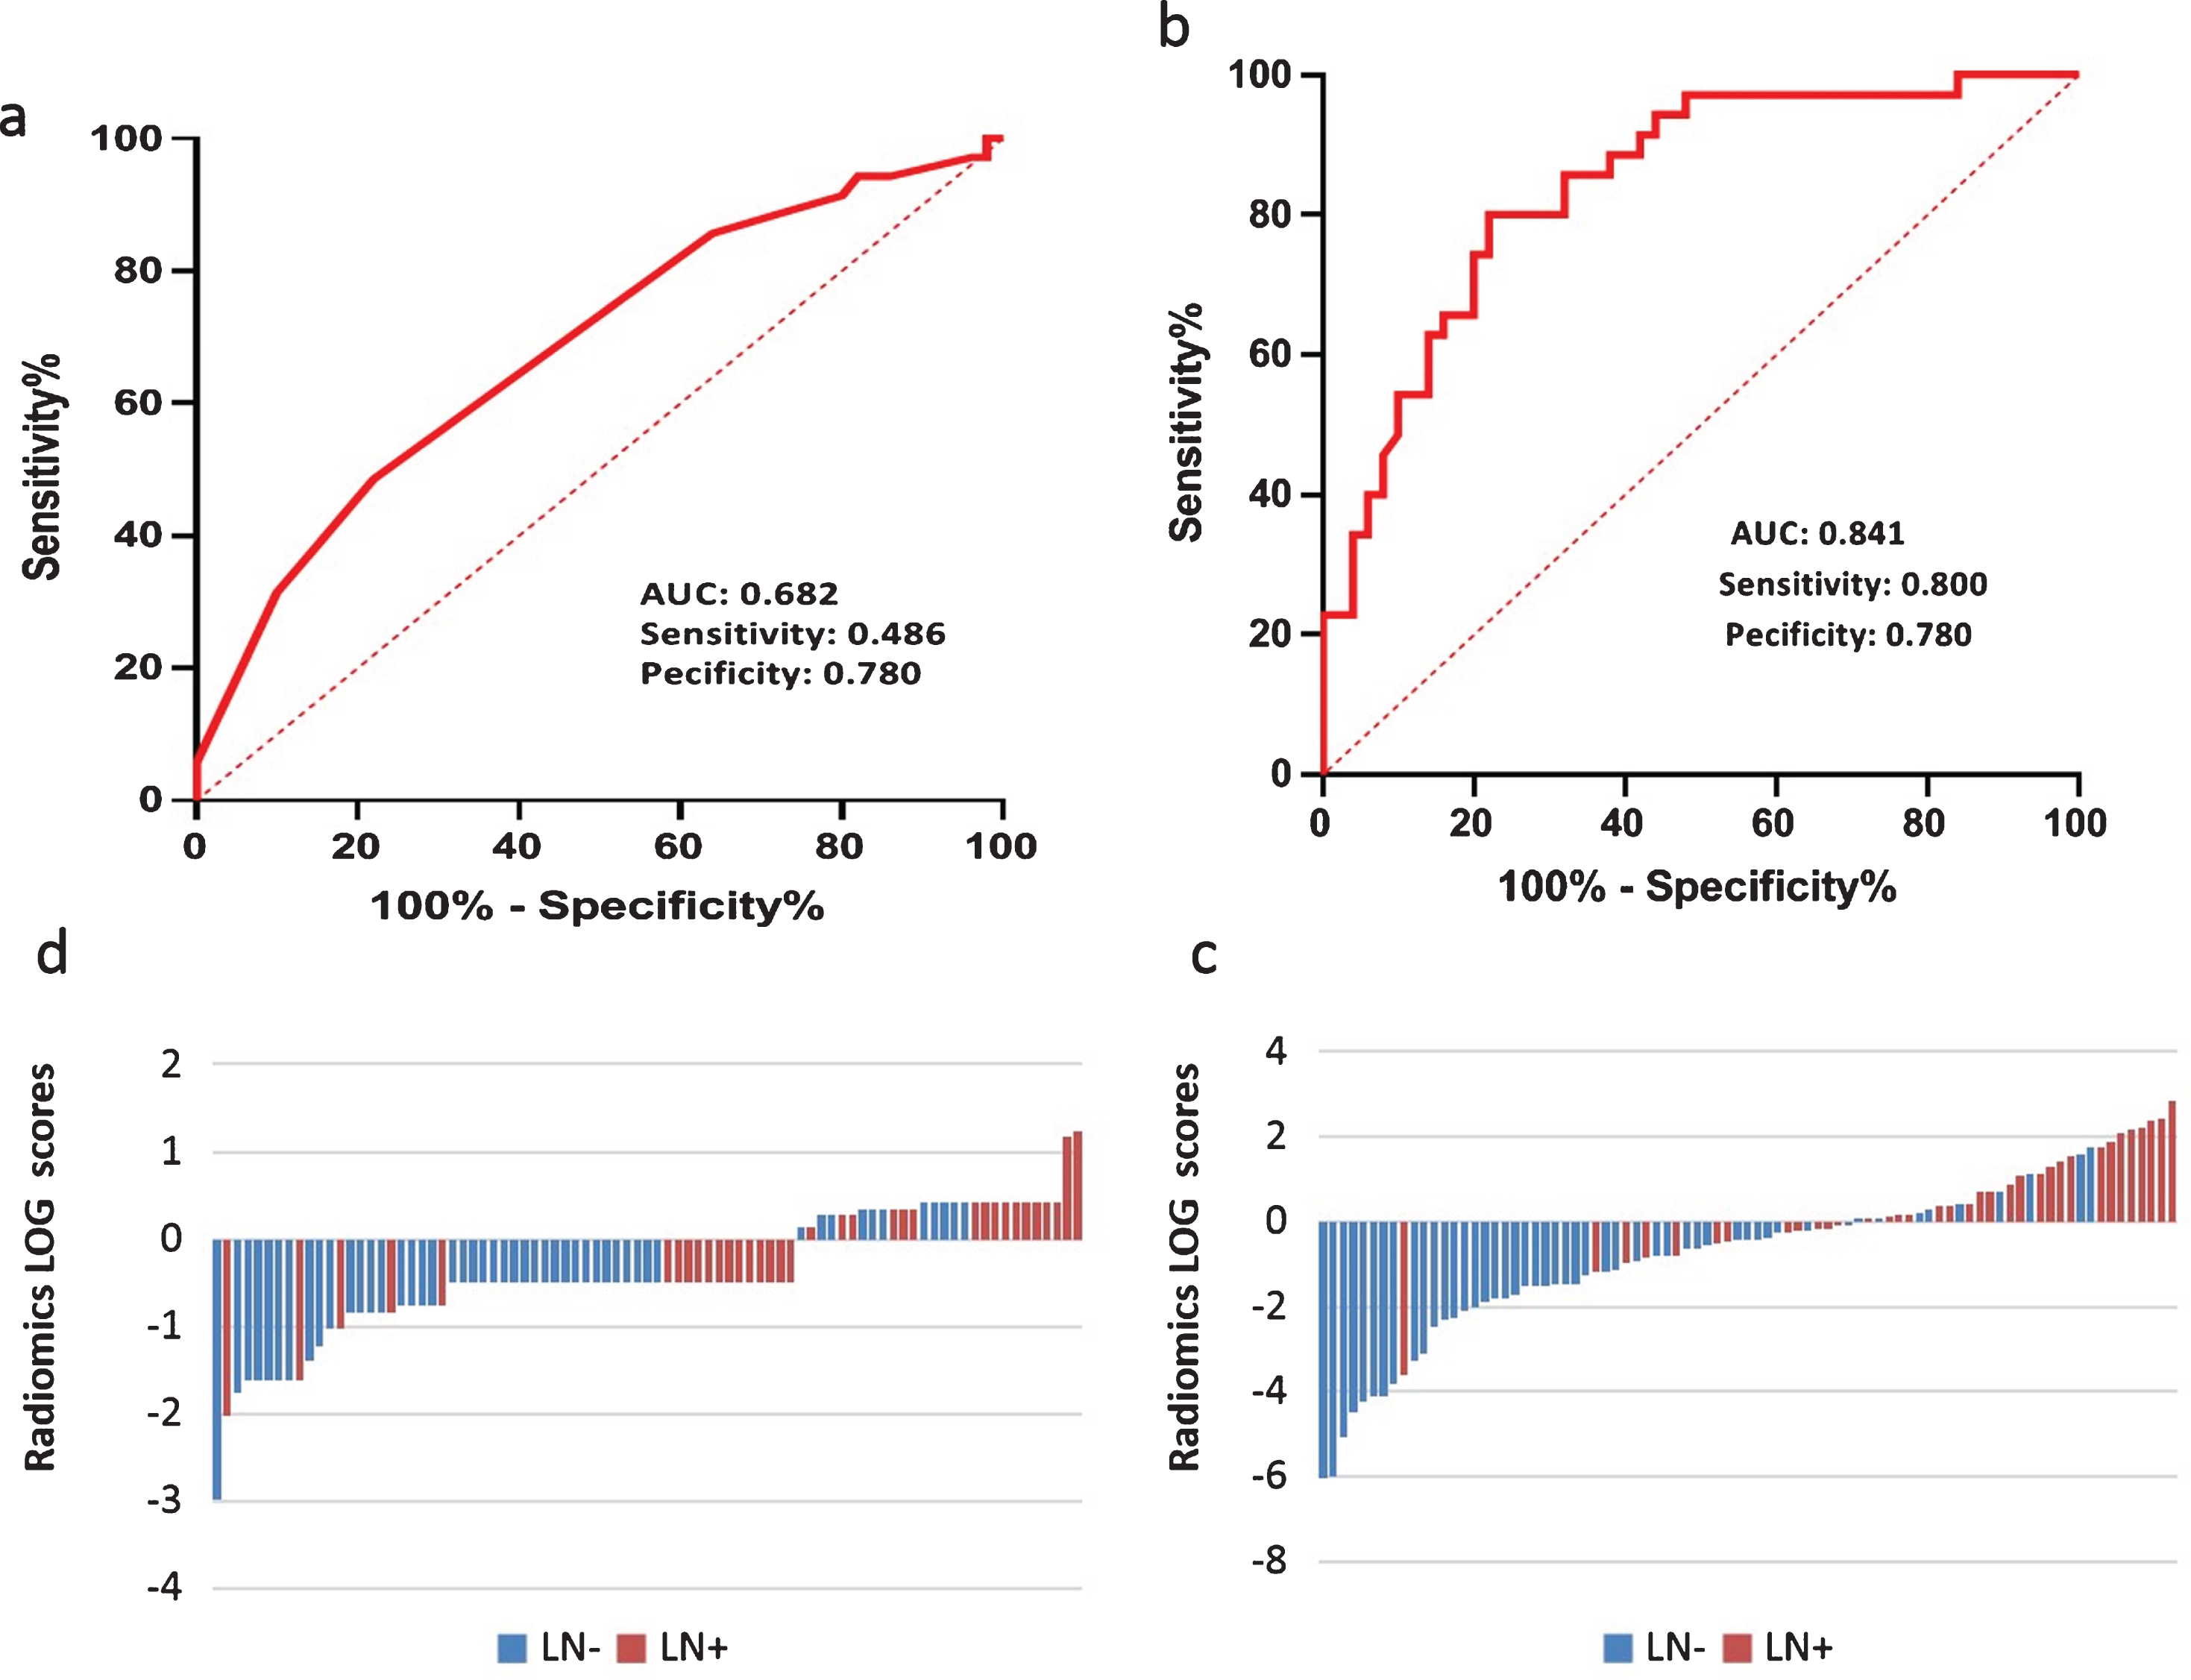
The comparison of Conventional logistic regression (LOG) model and Radiomics logistic regression (LOG) model. (a) ROC curve of the Conventional LOG model, (b) ROC curve of the Radiomics LOG model, (c) Radiomcs LOG model scores for each patient, (d) Conventional LOG model scores for each patient.
Among the 1124 radiomics features, 14 features were retained through the Mann-Whitney U-test. Feature stability was evaluated by using the ICC. A total of 12 features with ICC >0.3 were retained; the result of ICC test is shown in Table 2. After that, 1 feature was excluded because of significant correlation with another by Spearman test. Then, 11 radiomics features were used for LASSO feature selection. Finally, 8 radiomics features with non-zero coefficients in LASSO analysis were selected and the Radiomics LOG model was subsequently constructed based on the logistic regression. The calculation formula for the Radiomics LOG model scores was (
Evaluation for intra-observer agreement of the extracted radiomics feature by intra-class correlation coefficients (ICCs)
Evaluation for intra-observer agreement of the extracted radiomics feature by intra-class correlation coefficients (ICCs)
Significant differences were found between patients with LN+ and LN− in Radiomics LOG model scores (0.535±1.307 (mean±standard deviation) vs. −1.514±1.800 (mean±standard deviation), p < 0.001). The optimal threshold of 0.439 was selected by using the Youden Index in the ROC analysis. Patients with the Radiomics LOG model scores greater than 0.439 were predicted as LN+, while patients with the scores lower than 0.439 were predicted as LN−. The AUC value was 0.841, (95% CI, 0.758∼0.925), with sensitivity and specificity of 0.800 and 0.780. 70.3% cases were correctly classified using leave-one-out cross-validation (Fig. 2).
Delong test was performed on the ROC curves of Radiomics LOG model and conventional LOG model. The results showed that there was a statistically significant difference between these two models (AUC, 0.841 vs. 06825; sensitivity, 0.800 vs. 0.486; specificity, 0.780 vs. 0.780; accuracy, 70.3% vs. 57.0%). It showed that Radiomics LOG model can significantly improve the prediction accuracy.
Discussion
In this study, we sought to identify a new method to predict LN metastasis in patients with PDAC based on pathologically confirmed results. Finally, a radiomics-based model was built and achieved a good performance.
Precise identification of pancreatic cancer LN metastasis before surgery can help guide individualized diagnosis and treatment of pancreatic cancer. The gold standard for LN status evaluation is pathology. However, it is invasive and expensive. CT is the most used method for LN evaluation and an LN diameter of more than 10 mm is considered as LN+. However, it has a very low accuracy, especially in poor sensitivity (20% –38%) [16, 30]. The other criteria for metastatic LN such as nonuniform density, shape, BD, PD et al. also yield low diagnostic accuracy and sensitivity. In concordance with prior studies, we found that there were no conventional CT features could be used to discriminate the LN+ group and LN− group. When all those conventional features were put into model analysis, the result was still poor (AUC, 0.682; sensitivity, 0.486; specificity, 0.780, accuracy, 57%). This result reflected the limitation ability of conventional CT features to predict LN status.
Thus, we attempted to adopt a radiomics strategy to predict LN metastasis in patients with PADC. The important implication of our results is that the radiomics-based strategy (Radiomics LOG model) showed great performance in predicting the statue of LN metastasis in patients with PDAC. Radiomics is a novel medical imaging analysis technology, which can yield tissue-specific information using radiomics features that analyze the change in image pixels and grey-scale spatial distribution [31]. A previous study by Bian Y et al. [32]. explored the relationship between the radiomics score and LN metastasis in PDAC. In contrast to the study by Bian Y et al., our study focused on developing a prediction model. The model showed good discrimination and validated by a leave-one-out cross-validation method.
The strength of this study is that the Radiomics LOG model was superior to conventional LOG model. In the previous studies, various modalities including CT, PET/CT, and MRI were used to distinguish malignant and benign LNs. However, all of them were trying to directly image metastatic lymph nodes. Actually, because of resolution, it is hard to detect LN. Studies showed that there is high lymphatic vessel density (LVD) in PDAC tumors or peri-tumors [33, 34]. Many studies also agree that PDAC invades lymph nodes frequently through the lymphatic vasculature in the tumour rather than through direct/contiguous extension of the primary tumor to the lymph node [35, 36]. So, we presume that predicting LN metastasis by analyzing primary tumor maybe better than imaging LN. Many radiomics-based strategies had been successful in predicting LN metastasis by directly analyzing primary tumor.
The present study also has its limitations, First, we included a relatively small number of patients and lacked an external validation. Multicenter validation with a larger sample size is needed before universal application of these results. In addition, adding more clinical information and multi-phase CT information may improve the performance of the prediction model.
Conclusion
In conclusion, this study showed that a radiomics-based strategy may provide a novel non-invasive strategy that preoperatively predicts LN metastasis in PDAC patients.
Conflict of interest statement
The authors have no conflict of interest to report.