
Abstract
Reducing X-ray radiation is beneficial for reducing the risk of cancer in patients. There are two main approaches for achieving this goal namely, one is to reduce the X-ray current, and another is to apply sparse-view protocols to do image scanning and projections. However, these techniques usually lead to degradation of the reconstructed image quality, resulting in excessive noise and severe edge artifacts, which seriously affect the diagnosis result. In order to overcome such limitation, this study proposes and tests an algorithm based on guided kernel filtering. The algorithm combines the characteristics of anisotropic edges between adjacent image voxels, expresses the relevant weights with an exponential function, and adjusts the weights adaptively through local gray gradients to better preserve the image structure while suppressing noise information. Experiments show that the proposed method can effectively suppress noise and preserve the image structure. Comparing with similar algorithms, the proposed algorithm greatly improves the peak signal-to-noise ratio (PSNR), structural similarity (SSIM), and root mean square error (RMSE) of the reconstructed image. The proposed algorithm has the best effect in quantitative analysis, which verifies the effectiveness of the proposed method and good image reconstruction performance. Overall, this study demonstrates that the proposed method can reduce the number of projections required for repeated CT scans and has potential for medical applications in reducing radiation doses.
Keywords
Introduction
Because radiation exposure can cause cancer, genetic diseases and other diseases, computed tomography (CT) requires ultralow-dose CT imaging. Many studies have been conducted to reduce radiation doses [1–3]. Low-dose CT imaging can be achieved by reducing the X-ray tube current and using sparse-projection data [4–6]. However, in the process of image reconstruction, if data noise is not well controlled, it will inevitably lead to insufficient measurements, resulting in poor image quality. Various CT image reconstruction methods have been proposed to reduce the current of the X-ray tube or to sparse-projection data [7, 8]. In terms of reducing the X-ray current, sinusoidal image restoration and image reconstruction algorithms based on statistics can reduce noise. The idea of this strategy is to preserve the benefits of statistical modeling within the target function. Usually, the related objective function contains two items, namely, the data fidelity developed in conjunction with the statistical measurement model and a penalty that usually considers the characteristics of the image to be estimated.
In 2006, Wang et al. analyzed a large quantity of experimental data and found that measured data after logarithmic processing approximately obey a Gaussian distribution [9]. They proposed a penalized weighted least squares (PWLS) projection domain denoising method [10]. For sparse-view image reconstruction, Sidky et al. proposed an algebraic iterative algorithm based on total variation (TV) minimization that can perfectly reconstruct the Shepp-Logan phantom from 20 perspectives [11]. In 2008, they improved this algorithm, proposed the ADS-POCS algorithm, and applied it to 3D cone beam projections [12]. The expected TV minimization-constrained image is not the optimal sparse representation of the actual image. Therefore, to further improve the reconstruction quality of sparse-view projection data, weighted TV is applied to CT image reconstruction [13–16]. Although these algorithms produce better reconstruction results, to the best of the authors’ knowledge, few studies on the combination of reducing the X-ray current and applying the sparse-view protocol [17–20] have been conducted to effectively eliminate noise in the reconstructed image and improve image quality. Therefore, the aim of this study is to combine reducing the X-ray current and applying sparse-view protocols to reconstruct high-quality CT images under the PWLS standard. Then, we focus on reconstructing CT images from the sparse-view projection data for comparison with other existing algorithms.
TV minimization of an image assumes that image slices are smooth. However, a better way to improve the performance of sparse-projection data reconstruction may exist. In response to this problem, this work presents an in-depth study. In image processing, filters are widely used for image denoising, restoration, and reconstruction [21–23]. Many image filters have been introduced for CT image denoising, including bilateral filters (BFs), wavelet denoising, anisotropic diffusion filters (ADFs), and guide filters [24–27]. These filters can detect and preserve the image edge while smoothing the noise fluctuation. However, these methods rely on the user to control the level of smoothness and target intensity based on multiple specified parameters. In addition, these filters can often lead to misdiagnosis of details. The guided filtering algorithm can maintain edges [28], but the algorithm needs a guiding image when filtering. The guiding image can be a separate image or the input image itself. When the guiding image is the input image, guided filtering becomes an edge-preserving filtering operation. Guided filtering can be used for noise reduction, detail smoothing, etc.
To improve image quality resulting from reducing the X-ray current or applying sparse-view reconstruction, we propose a new method. First, the PWLS-based sinogram recovery method is used to recover the sinogram data by reducing the X-ray current and applying sparse-view protocols. Second, the PWLS-based total variation (PWLS-TV) method is used to reconstruct the image using the recovered sinogram data. Finally, the image obtained in the two previous steps is used as a priori information, and the PWLS-TV-reconstructed image is guided by guided kernel (GK) filtering [29, 30]. This method can effectively improve the reconstruction quality of low-dose and sparse-projection data and obtain reconstructed images with a higher peak signal-to-noise ratio (PSNR) and fewer artifacts. In this study, simulation experiments are performed to qualitatively and quantitatively evaluate CT images reconstructed from sparse-projection data. Compared with other methods, this approach can reduce noise and artifacts and improve the signal-to-noise ratio of the image and the quality of the reconstructed image.
The remainder of this paper is organized as follows. Section 2 describes the proposed method, and Section 3 describes the experiment. Section 4 discusses the experimental results. Finally, conclusions and a discussion are presented in Section 5.
Methods
Related work
Because the projection data of the detector channel are statistically independent [31], based on first-order and second-order noise moment analyses, the value function of the weighted least squares method can be obtained [32]:
where y is the system projection data, q = Px is the ideal projection data, P is the system matrix, x is the attenuation coefficient of the image to be reconstructed, and ith is the diagonal matrix with variance
Since (1) the weight least squares (WLS) value function minimization process often produces unsatisfactory results, a penalty term βR(x) is added to ensure the convergence of the algorithm [10, 32]:
The TV-based penalty term can be written as follows:
where the diagonal matrix, as a weighting effect, is ∑, s and t are indices, and δ is a small constant.
In image filtering, the estimated value of voxel
where I is the neighborhood window centered on voxel i, the weight ki,j is a function of the spatial position of the voxel and j represents the strength of the neighborhood around the two voxels. The weight in the filtering operation is expressed as ki,j, which can be regarded as a parameter of the denoising method. In an ideal situation, people can obtain these weights from noise-free real images, but this approach is not feasible in clinical data applications; therefore, in practice, many denoising algorithms are calculated by prefiltering images or guiding them. The weight of the image is used to improve the estimation accuracy.
Assuming that the guided image has a higher signal-to-noise ratio than the CT image, this work uses the following simple and effective kernel function [33, 34]:
where the intensity of the first voxel is x
i
, which corresponds to the spatial position of x
i
in the CT image, and h is the smoothing parameter of the filter. We call this method guided kernel (GK) filtering [35, 36]:
Let G be a positive semidefinite matrix with a symmetric size of I×I (a complete kernel matrix is usually too large to use in practice). Applying GK to image x is equivalent to multiplying the row normalization kernel matrix by the noisy image:
where
Reconstruction involves the following three main steps: PWLS reconstruction: Only corrected projection data y are reconstructed via the PWLS algorithm. Although the result of this reconstruction step results in considerable noise, most CT images contain structural information of x
PWLS
.
PWLS-TV reconstruction: y is used from PWLS-TV reconstruction and smoothed from the update to obtain x
TV
. Although noise and fringe artifacts are significantly reduced as a result of this reconstruction step, most of the structural information of CT images is lost.
Guided kernel filtering: The k-nearest neighbor (kNN) algorithm, which is widely implemented in machine learning, is used to construct graphs to obtain a sparse matrix. When voxel j is located in the neighborhood of voxel i (I identified), the value ki,j corresponds to the weight of the GK algorithm; otherwise, it is set to zero. The kNN method finds k similar neighbors for each pixel, defines the (i,j)
th
elements of kernel matrix G through (10), and normalizes matrix G to obtain normalized kernel matrix K.
Then, GK filtering is performed on x
PWLS
and guided by the reconstructed image x
TV
to obtain the final image x:
The reconstruction algorithm pseudocode is as follows.
Require: sonogram y and system matrix P
Output: The final processed image x
1: Initialization: iteration number i; hyperparameter β; initialize image
2: for n = 1 to i = 130
3: PWLS method image update from Equation (8).
4: PWLS-TV method image update from Equation (9).
5: Generate the weight kernel matrix of x TV and x PWLS ; perform GK filtering on x PWLS guided by x TV :
6: End for.
7: Return the image estimation x.
In the simulation experiment, the XCAT phantom, as shown in Fig. 1, is used for imaging simulation and is a practical method for evaluating and determining the best imaging technology. Without loss of generality, we select a geometry that is typical of a monoenergetic fan-beam CT scanner setup with a circular orbit to obtain 360 views over 2π [37]. The source of the rotation center of the rotating shaft is 570 mm, the distance from the X-ray source to the detector is 1040 mm, and the number of detectors is 672. The size of each pixel of the phantom is 0.85 mm×0.85 mm, with an intensity value between 0 and 130, consisting of 512×512 square pixels. The projection data along the direction by which the X-ray passes through the cross-sectional image are calculated based on the known density and intersection area of the geometric shape of the object in the cross-sectional image and the ray.
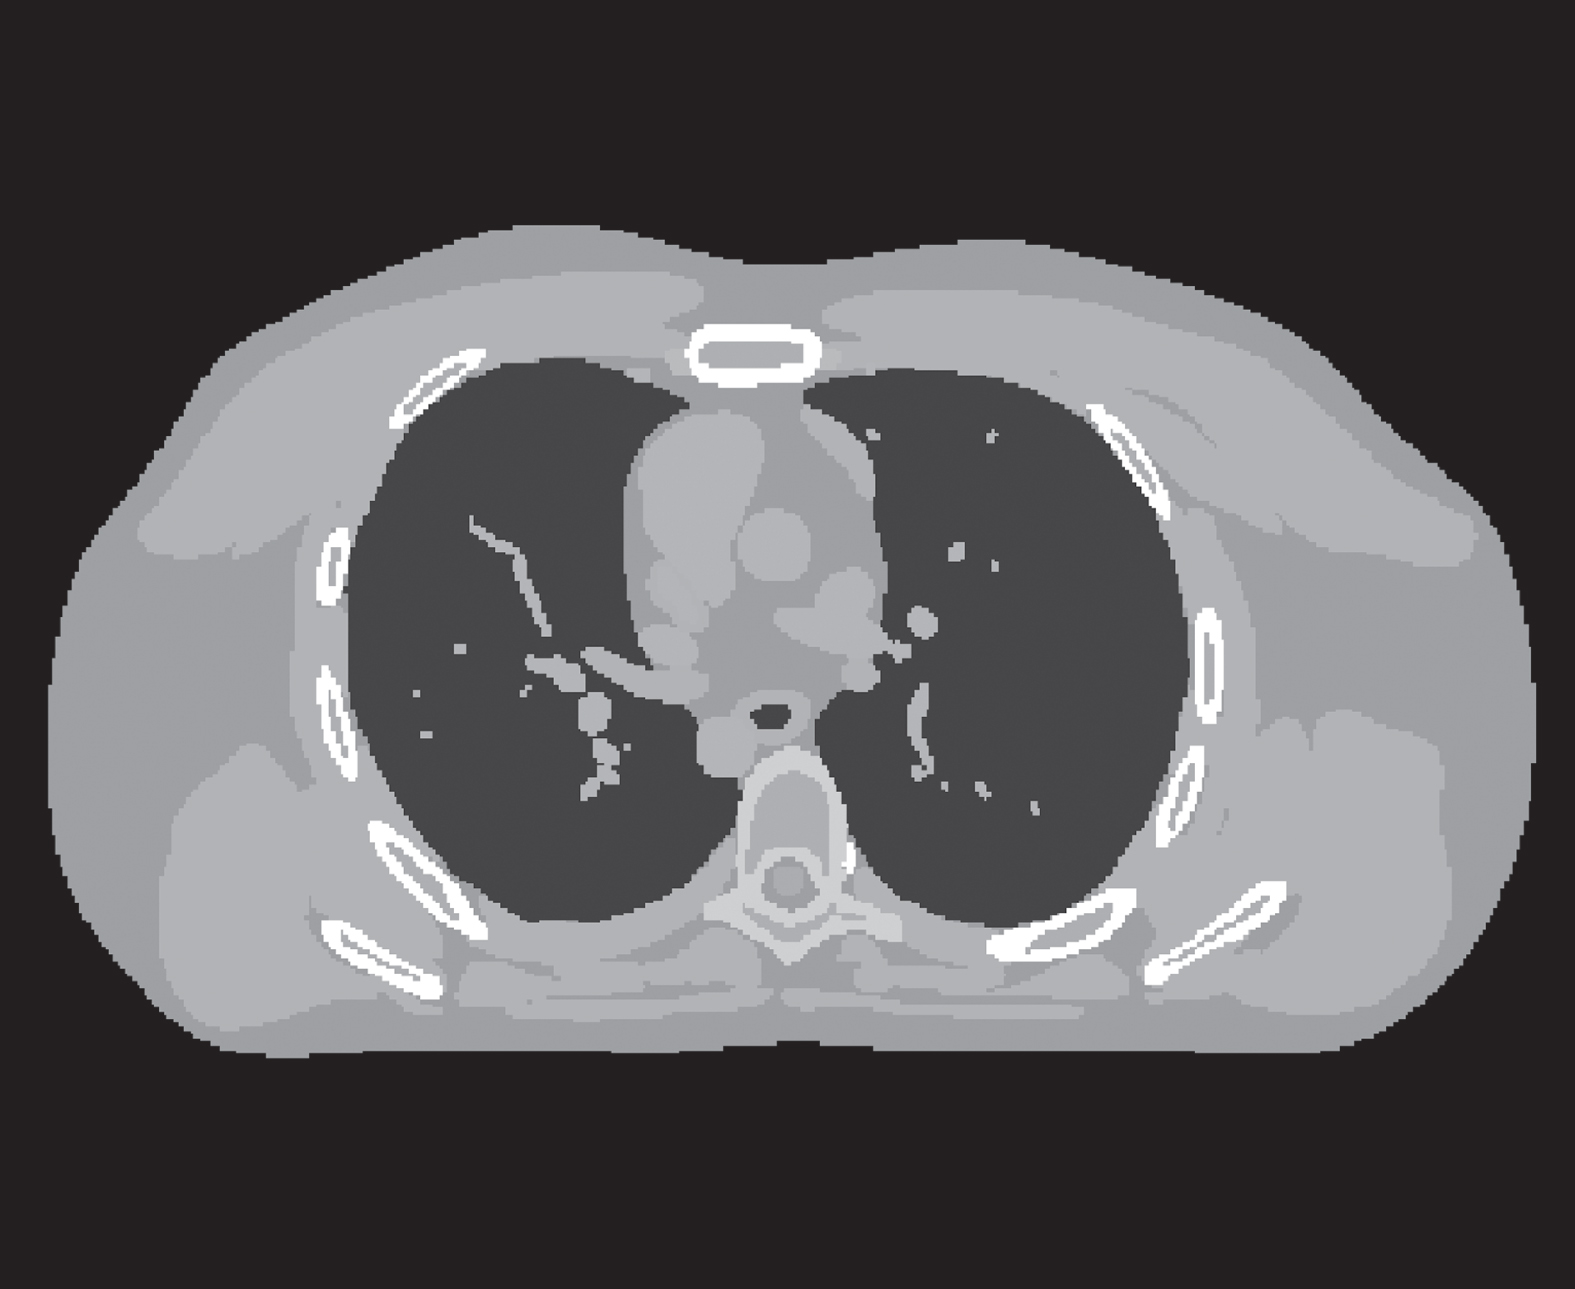
XCAT phantom.
The simulation experiment simulated low-dose CT images with different X-ray current levels and different sparse-projection views. The simulation of sparse-projection data is similar to that in reference [9]. After calculating the noise-free line integral y as a direct projection operation based on the model, the noisy measurement b
i
at each bin i was generated according to the statistical model of prelogarithm projection data:
where I0 denotes the incident X-ray intensity and
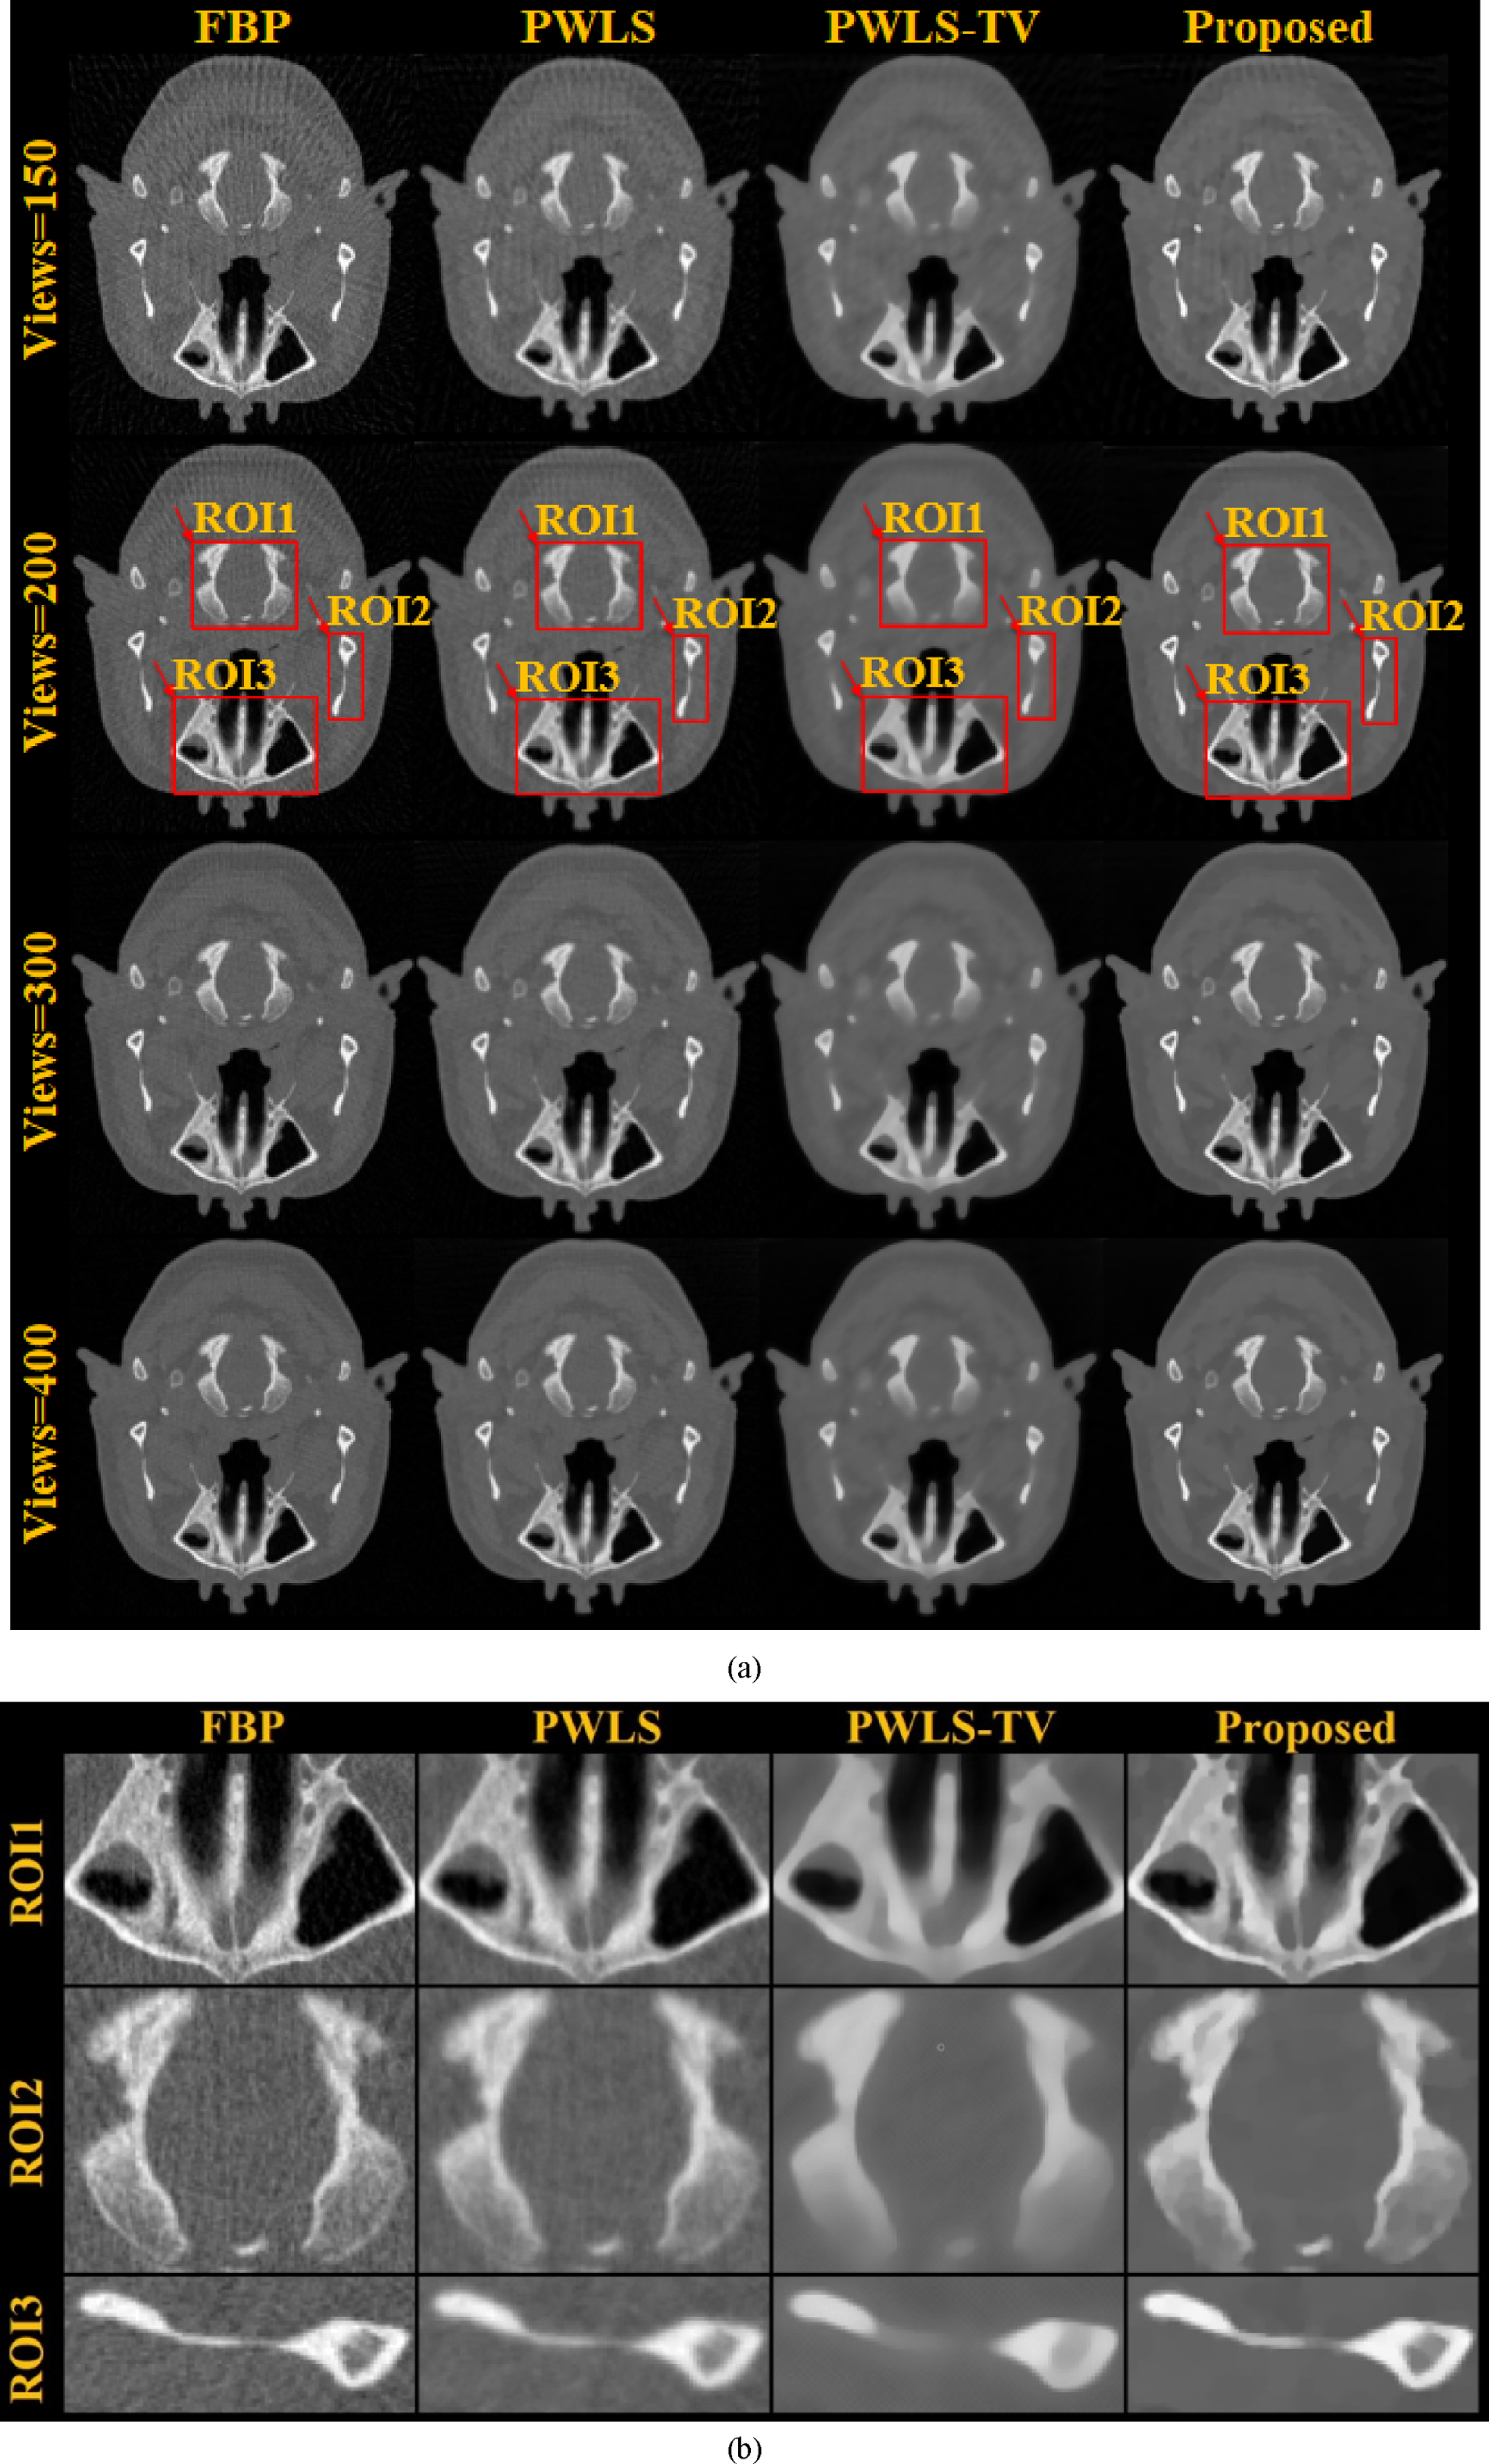
The projection data are the clinical head data provided by United Imaging Healthcare (uCT 760). Fixing the patient’s head, the peak potential applied to the X-ray tube is 120 kV. The scanning geometric parameters are as follows: (1) the number of detectors is 936×40, the distance from the X-ray source to the detector is 1060 mm, the distance from the X-ray source to patient’s head is 570 mm, and the size of each pixel is 0.915 mm×0.915 mm. (2) The CT scanner consists of a monoenergetic fan beam with circular orbits that can yield 4800 views over 2π. The patient’s head is divided into 8 slices, and the first slice is taken in the physical experiment. (3) We extract the twentieth and twenty-first layers of the reorganized 3D projection data and use the average of these two layers as the 2D projection data. In the physical sparse-projection perspective experiment, the original 4800 views are under-sampled to four sparse-view levels: views = 150, views = 200, views = 300, views = 400 views.
In this work, to quantitatively evaluate the impact of the improved algorithm and the algorithm proposed in this work on the quality of the reconstructed image, we use a scanned image collected with United Imaging CT equipment and the XCAT phantom. The PSNR, the root mean square error (RMSE), and the structural similarity (SSIM) [38] are used as the image quality metrics to evaluate the quality of the reconstructed image, and their definitions are as follows:
The PSNR can be calculated as follows:
where x
recon
n
and x
true
n
are the pixel values of the denoised image and the original image, respectively, and N is the total number of pixels in the reconstructed image.
The RMSE can be calculated as follows:
Since human vision is able to extract structural information from images, we introduced a structural similarity indicator to evaluate the structural information in images; this indicator was defined as follows:
where
Here, c1 and c2 are constants set according to [38].
In this section, we discuss the reconstruction results of the proposed algorithm by subjectively observing the ability of reducing the X-ray current to reduce noise, remove artifacts, and preserve edge structures of CT images. Additionally, we compare the objective evaluation results of the proposed algorithm and the control algorithm. The objective image quality metrics include RMSE, PSNR, and SSIM.
In the evaluation, the clinical projection data obtained from United Imaging Healthcare equipment and the XCAT phantom are selected as the initial input. United Imaging Healthcare data are used for the physical input, the XCAT phantom is used as the input for the simulation experiment, which is divided into sparse-view reconstruction and low-dose reconstruction, and different sparse-view levels are employed to reconstruct the CT image.
Image reconstruction with different sparse views
Figure 2(a) shows that the image reconstructed by the proposed algorithm is less noisy, and the effect of removing artifacts is better. Figure 2(b) is a magnified image of the red area corresponding to Fig. 2(a), which shows that the quality of image reconstructed by the proposed method is higher. In summary, the method proposed in the sparse-view simulation experiment has better performance in terms of noise reduction, artifact removal, and edge detail structure preservation. In the simulation experiment, the display window of all reconstructed images is [0, 0.0024].
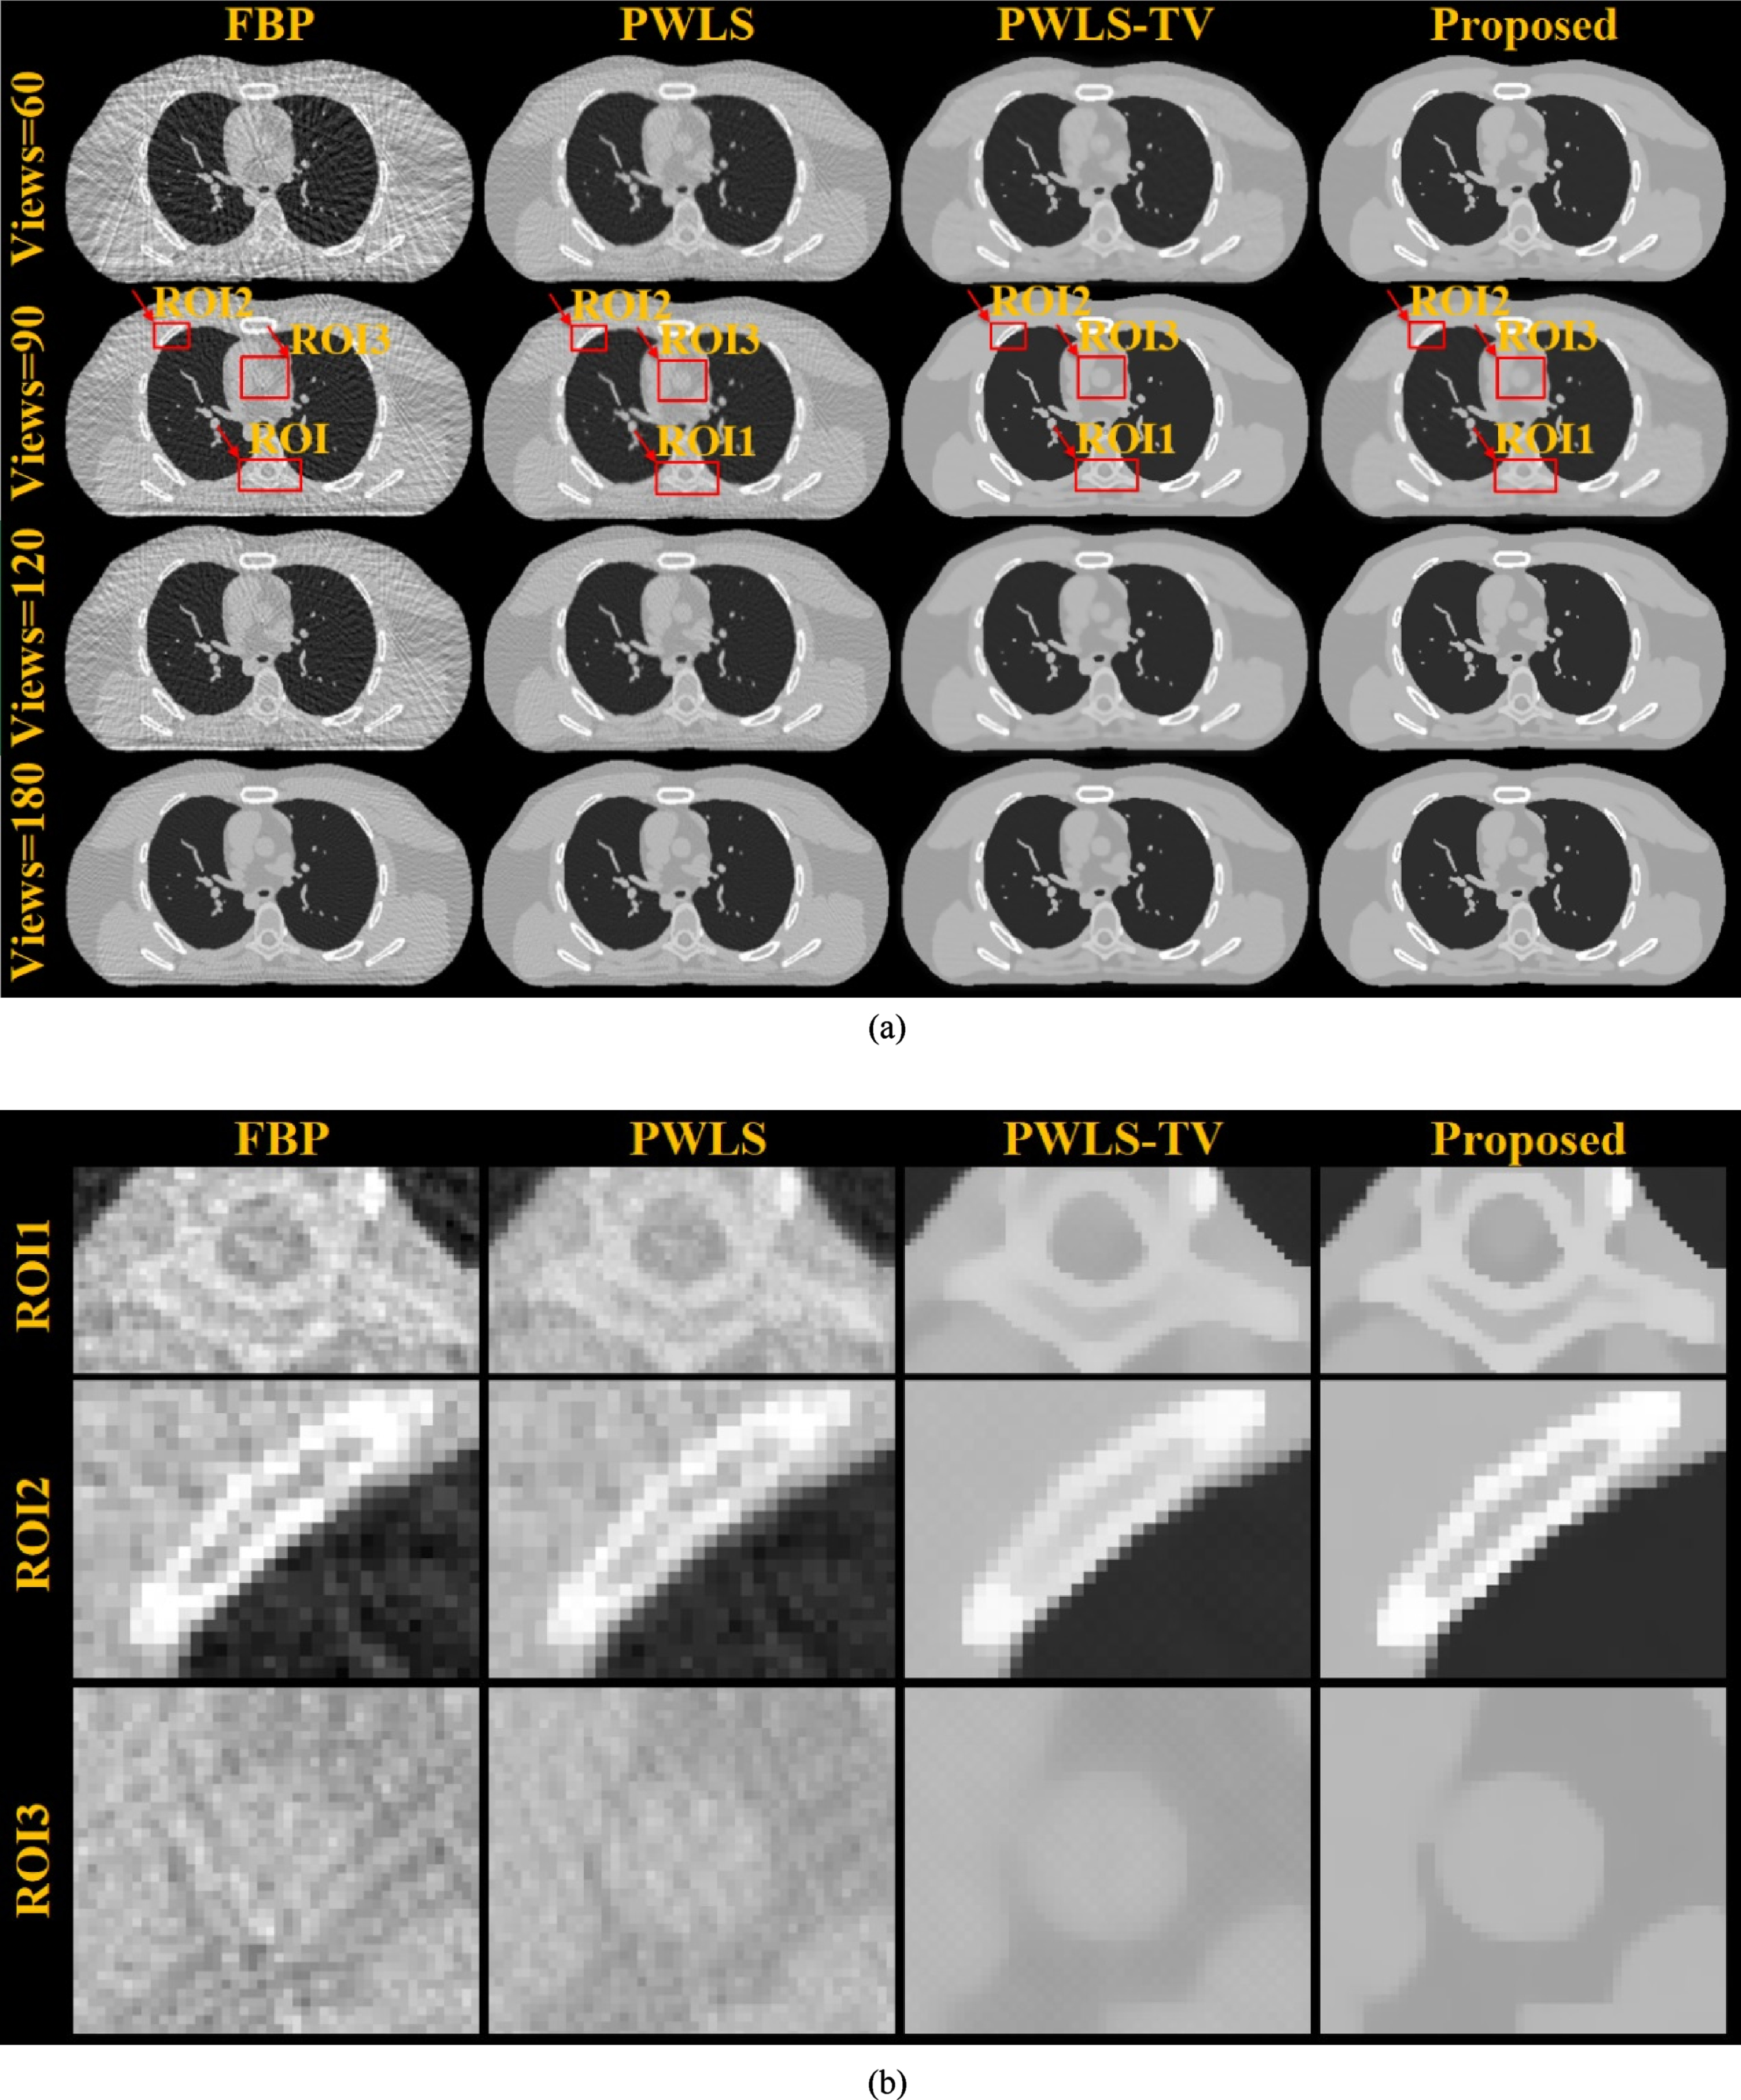
(a) CT images reconstructed by four different approaches at four different sparse views. (b) Magnified regions of interest (ROIs), as indicated by the three red boxes (ROIs 1, 2, and 3) in (a).
Tables 1 and 2 are the whole reconstructed images of sparse-view data and the quantitative value of the ROI in the case of a standard X-ray dose. For the proposed algorithm, the PSNR and SSIM values are the highest, and the RMSE value is the lowest. According to the objective quantitative value, the reconstruction effect of the proposed algorithm is better.
PSNR, RMSE, and SSIM values of reconstruction images obtained with different view levels at I0 = 5e6
PSNR, RMSE, and SSIM values of reconstruction images obtained with different ROIs, 90 views and I0 = 5e6
In general, the FBP algorithm has the worst effect among the four algorithms. The PWLS algorithm yields slightly more noise than the PWLS-TV algorithm, and the proposed algorithm yields less noise and fewer artifacts. When the number of viewing angles is very small, serious noise and artifacts occur. The difference between the FBP results and the reconstruction results of PWLS, PWLS-TV, and the proposed method agrees with the evaluation based on the quantitative and qualitative indicators.
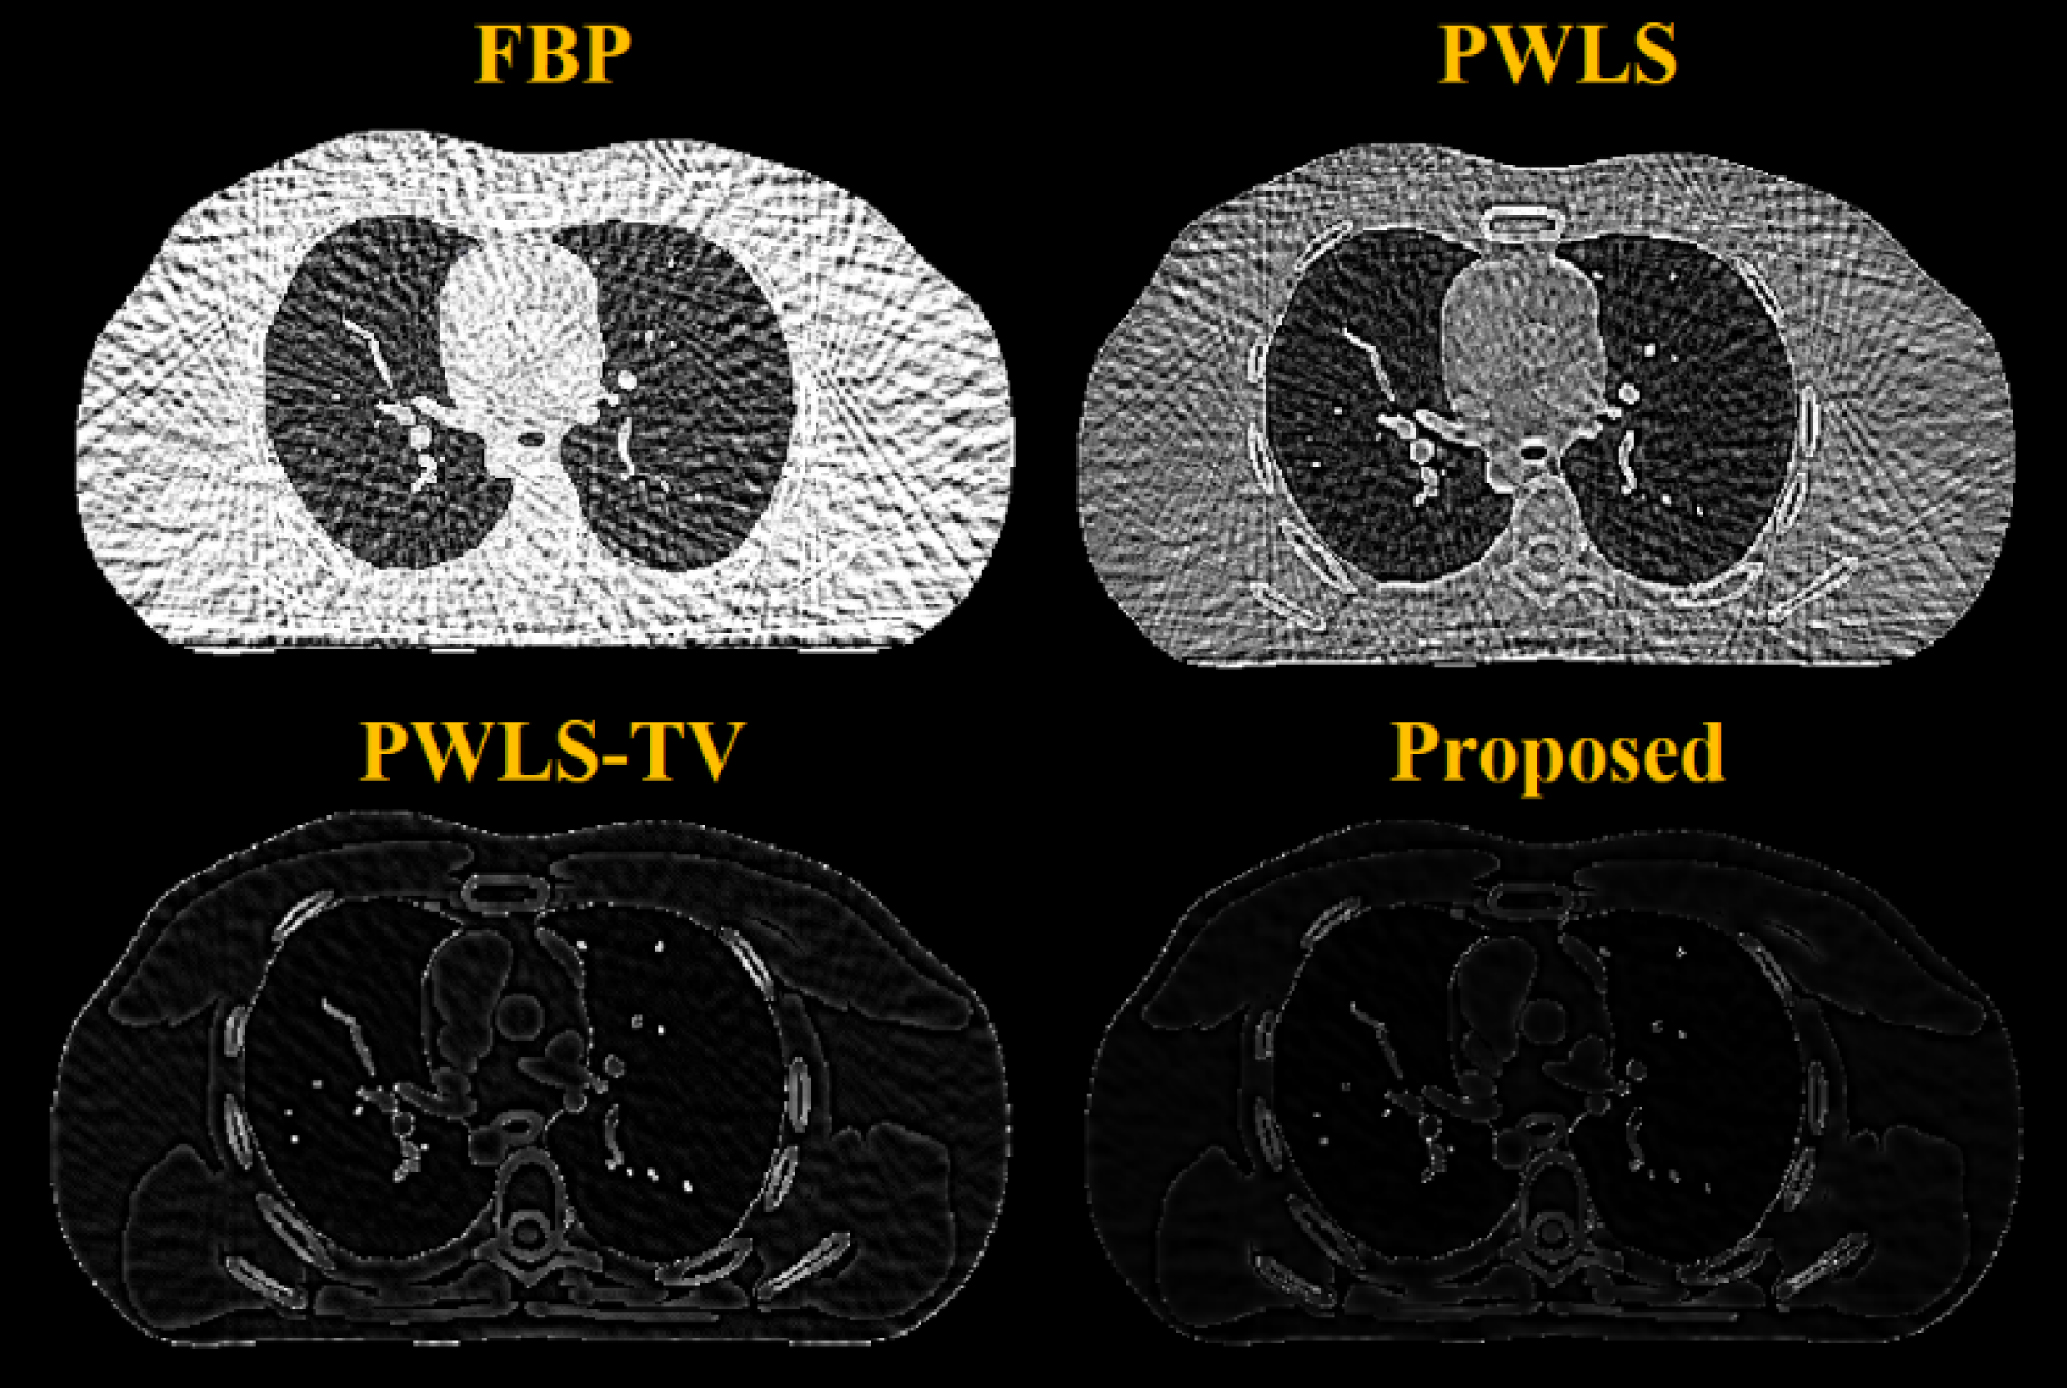
FBP, PWLS, PWLS-TV, and the proposed method were used to reconstruct low-dose simulation projection data with four different viewing angles. For the proposed method, the guided image is the PWLS result of sparse-projection data, and the guiding image is the reconstruction result of PWLS-TV. All reconstruction results are shown in Fig. 3(a) and (b). Better reconstruction results cannot be obtained, even if the TV minimization constraint is used, and the reconstructed image can easily be too smooth; the algorithm proposed in this work achieves the best image quality.
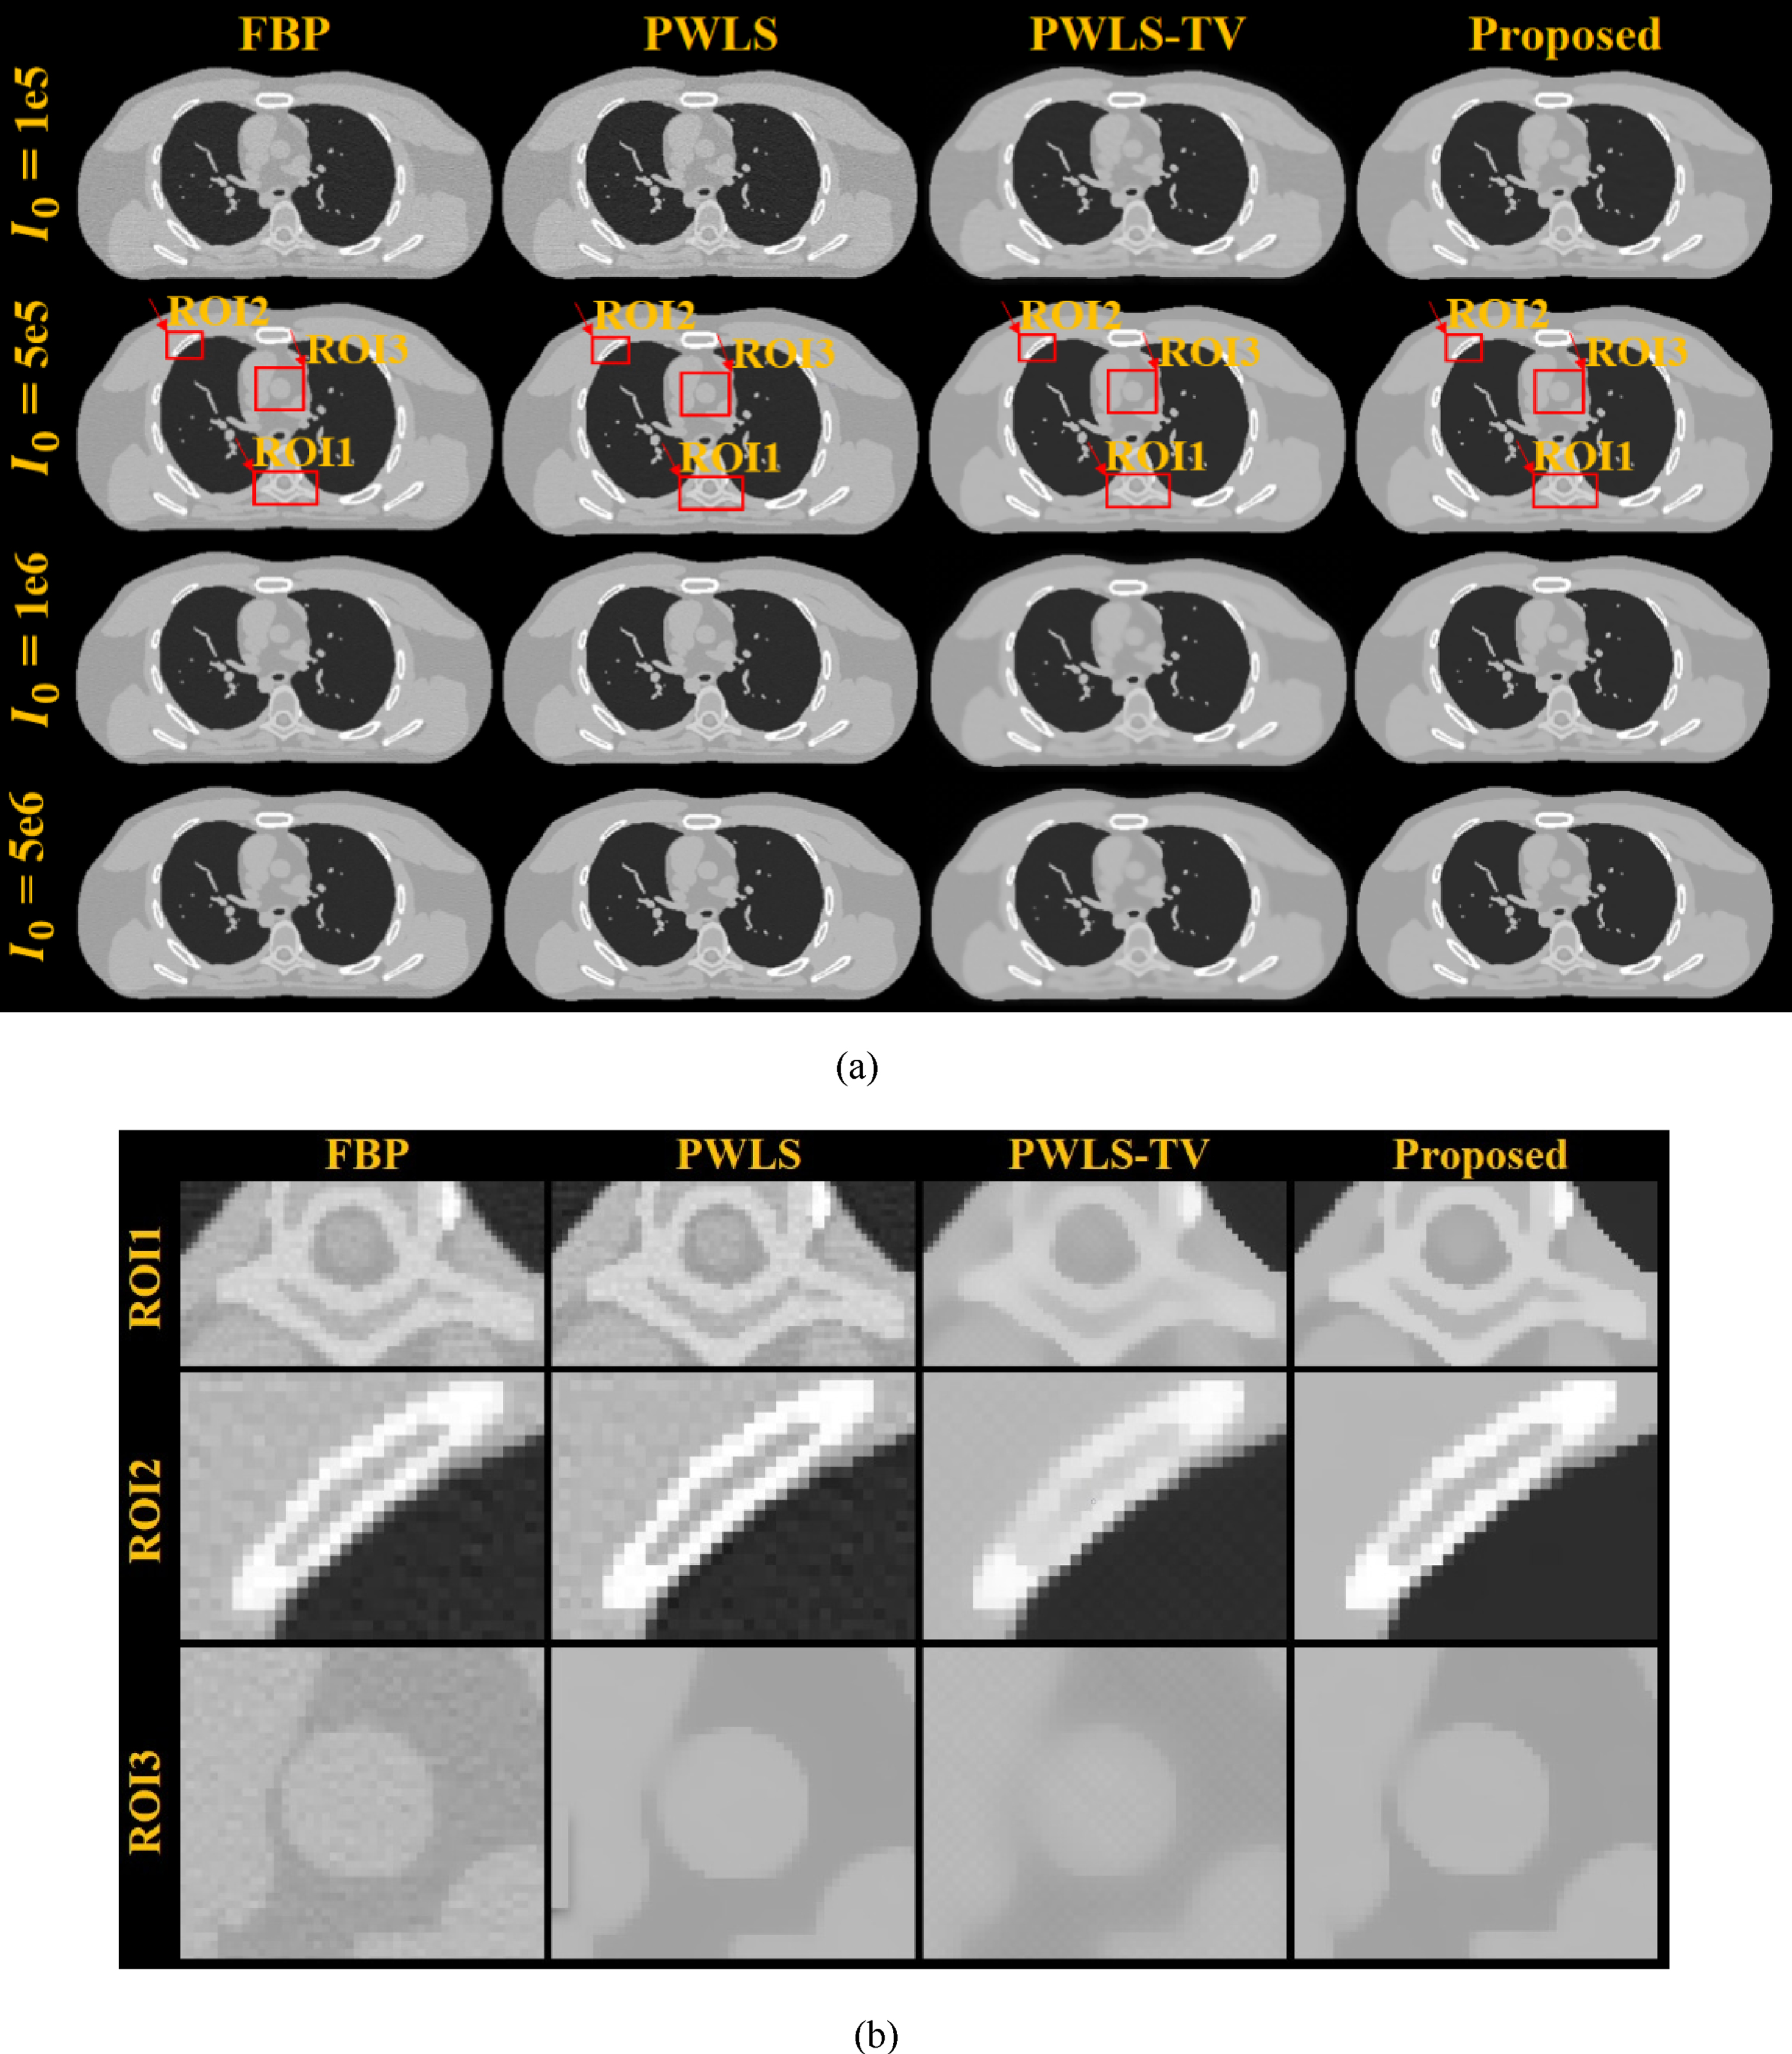
(a) CT images reconstructed by four different approaches at four different X-ray current levels with 360 views. (b) Magnified ROIs, as indicated by the three red boxes (ROIs 1, 2, and 3) in (a).
The PSNR, SSIM, and RMSE of these reconstruction results are shown in Table 3. PWLS-TV and the proposed algorithm outperform PWLS, and all three outperform FBP. Both PWLS-TV and the proposed method effectively reduce noise and remove artifacts, but the proposed method yields less noise and retains more of the structure than PWLS-TV. Figure 4 shows the reconstruction values of various reconstruction methods along the 60th line, and Fig. 5 shows residual images resulting from the different approaches with 90 views. It can be concluded from Fig. 4 that the proposed method can better preserve the edge structure.
PSNR, RMSE and SSIM values of reconstruction images obtained with different X-ray current levels and 360 views
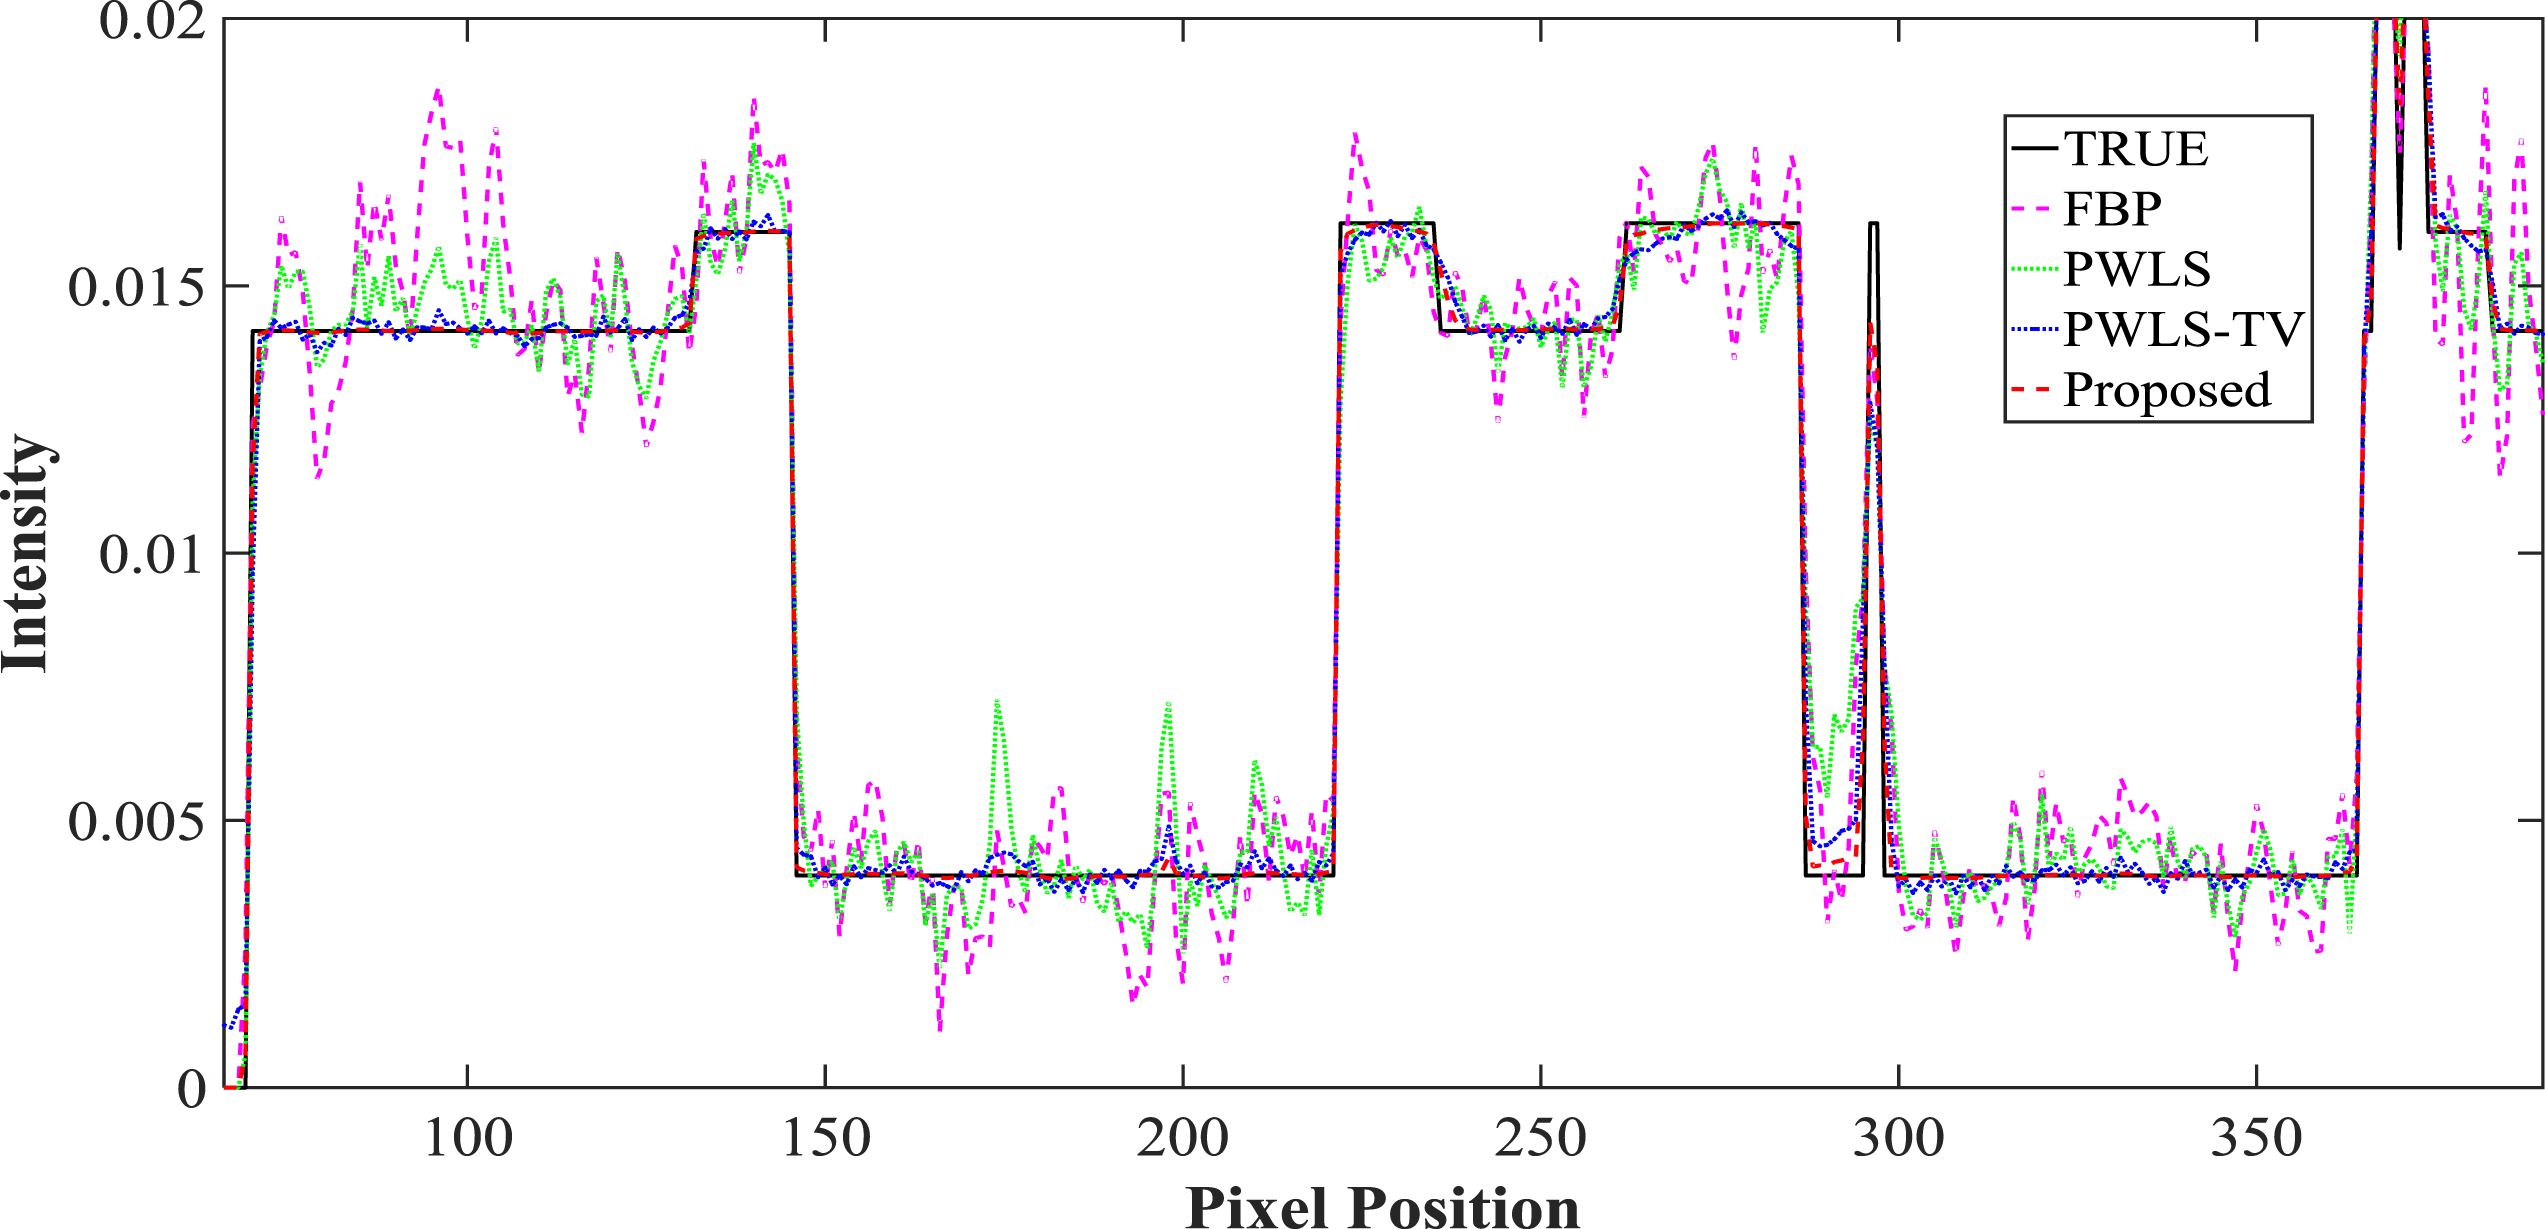
Reconstructed value along the 60th line of the reconstructed image.
Residual images obtained by the different approaches with 90 views.
The above experimental results show that (1) the simulation experiment verifies the effectiveness of the proposed algorithm. (2) Using the proposed method in CT reconstruction can better preserve the edge structure of the image and produce more accurate reconstruction results. (3) The reconstruction effect under low-dose conditions, such as sparse viewing angles, is verified, laying the foundation for the practical application of sparse reconstruction.
To further verify the effectiveness of the proposed reconstruction algorithm, the following physical experiments were carried out. Figure 6 shows that the FBP algorithm has the worst effect among the four algorithms. When the number of viewing angles is very small, severe noise and artifacts will appear. The PWLS algorithm yields slightly more noise than the PWLS-TV algorithm, and the proposed algorithm yields less noise. The difference between the reconstructed images of FBP, PWLS and PWLS-TV and the reconstructed image of the proposed method is consistent with the evaluation in quantitative and qualitative analyses. In general, the proposed algorithm has a better effect on sparse-projection reconstruction.
(a) Real CT images reconstructed by four different approaches at four different sparse-view levels. (b) Magnified ROIs, as indicated by the three red boxes (ROIs 1, 2, and 3) in (a).
The reference image shown in Fig. 7 is the image reconstructed by FBP with 4800 views. To quantitatively compare the performances of PWLS, PWLS-TV and the proposed algorithm, we calculated the PSNE, SSIM and RMSE values of the reconstructed images of these three algorithms. The results are shown in Table 4. Table 5 shows the quantitative results of the three ROIs marked by the red square in Fig. 6(a) and more clearly compares the differences between the three algorithms.
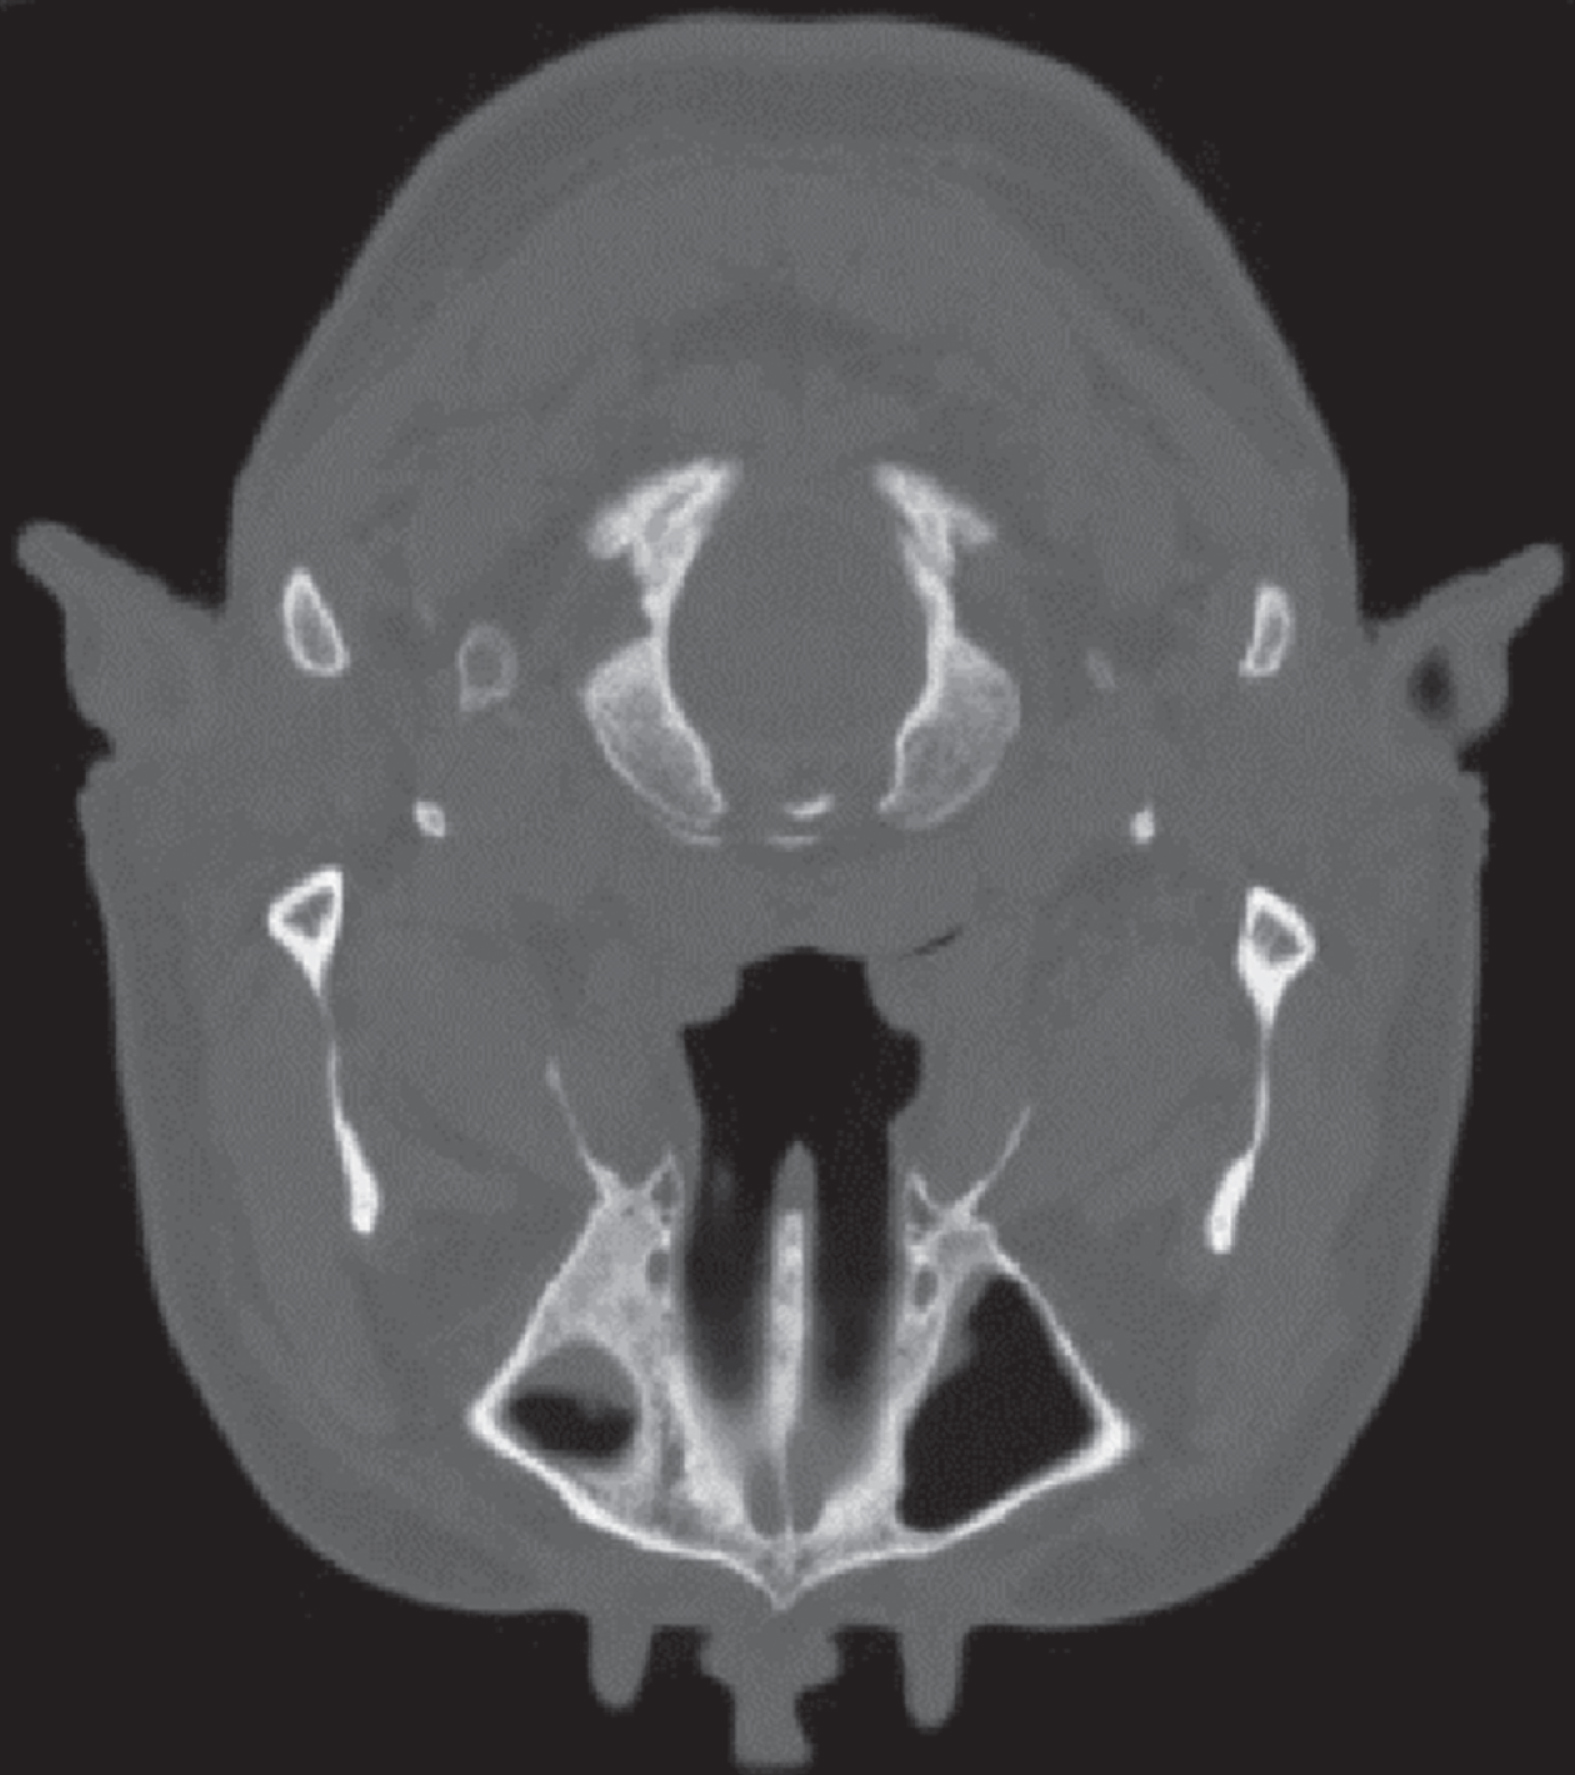
Real CT images reconstructed by the FBP algorithm with 4800 views.
PSNR, RMSE, and SSIM values of reconstruction images obtained with different view levels
PSNR, RMSE, and SSIM values of reconstruction images obtained with different ROIs and 200 views
Table 4 shows that compared with those of the PWLS algorithm and the PWLS-TV algorithm, the PSNR and SSIM values of the proposed algorithm are higher and the RMSE is lower. To further compare the differences between the three algorithms, the PSNR, RMSE and SSIM of the ROI marked in Fig. 6(a) are also calculated. The results are shown in Table 5. The proposed algorithm is also better than the PWLS and PWLS-TV algorithms in terms of quantitative analysis. In terms of image quality evaluation, a lower RMSE value and a higher PSNR value indicate better image quality.
In summary, the proposed method is better than other comparative methods in terms of quantitative evaluation in physical experiments and simulation experiments. The experimental results verify the advantages and feasibility of the algorithm proposed in this study.
As people have given increasing attention to the problem of X-ray radiation, research on low-dose CT reconstruction has become increasingly concerning. In this work, when the X-ray current level is not very low, the PWLS method seems to preserve the image structure and considerable noise. However, the proposed method can suppress the noise of the reconstructed image while preserving the detailed features of the image. The image reconstructed with the PWLS-TV algorithm appears to be subject to over-smoothing, which will damage important information, such as the contours and edges of the reconstructed image. The quality of image reconstructed with the proposed algorithm is better, which helps to perform experiments and improve performance. Compared with that of the images reconstructed by the PWLS and PWLS-TV methods, the quality of the image reconstructed by the proposed method is significantly improved. Computer simulation and physical experiments prove that the performance of this method is obviously better than that of PWLS and PWLS-TV. When performing repeated CT scans, the proposed method has the potential to reduce the radiation dose by reducing the amount of projection data needed to reconstruct the image.
Overall, comparing with PWLS and PWLS-TV, the proposed algorithm has higher PSNR and SSIM values, indicating that the reconstructed image is more similar in structure and perception to the reference image. The RMSE value resulting from the proposed algorithm is lower, and the reconstructed image is closer to the real image. Therefore, the quality of images reconstructed by the proposed algorithm is higher, which is more conducive to clinical diagnosis. To evaluate the method more thoroughly, many experiments are required. In the future, we will try to evaluate and verify the proposed method on various clinical-related tasks, which will be a useful and interesting research topic.
Footnotes
Acknowledgments
This work was supported by the Natural Science Foundation of Guangdong Province in China (2020A1515010733), Shenzhen International Cooperation Research Project of China (GJHZ20180928115824168), and Guangdong International Science and Technology Cooperation Project of China (2018A050506064).