



Abstract
X-ray optics with good focusing ability and high spectral resolution are required in X-ray spectroscopy for the diagnosis of high temperature and density plasmas. In our study, a novel X-ray spectrometer is developed to provide the ability to record spectra with excellent focusing performance and high energy resolution. It is accomplished by using a continuously conical crystal (CCC) that is formed by circles with different curvatures. In this paper, we present the foundational work of the design and development of continuously conical crystal spectrometer (CCCS) along with initial results obtained with a titanium (Ti) target as the object source. First, the spectrometer based on such a continuously conical crystal is used to measure X-ray spectra on Ti target X-ray Tube device. The spectral resolution (λ/Δλ) is around 615 with the source size of 1 mm. Then, we test the capability of the spectrometer on Xingguang-III Laser Facility with Ti target. He-like and Li-like Ti lines are recorded based on which the spectrometer performance is evaluated. The experiment result shows that the spectrometer provides a high spectral resolving power up to 1000, while acquiring a one-dimensional image of the source.
Introduction
The evolution of the plasma in inertial confinement fusion (ICF) experiments is extremely complicated because of the interactions between the laser, the plasma and the fuel capsule [1–3]. X-ray spectroscopy is one of the most powerful tools to diagnose the plasma conditions in ICF because the great amount of information can be extracted from the X-ray spectra of plasmas [4, 5]. The information can be used to analyze the temperature and density distribution in the plasma [6–8]. X-ray spectrometry using the Bragg diffractions of crystal has the advantage of high energy resolution, which provides us with an easier approach to perform quantitative analysis as it is possible to distinguish fine structures in the spectra. Increasing the luminosity and achieving high spectral and spatial resolution are always the main goals of X-ray crystal spectrometer development [9–11]. The focusing spectrometer with cylindrically bent crystal is widely used in X-ray spectroscopic test [12–14]. However, this configuration is seldom used in large laser facilities due to the lack of flexibility in the relative positions of the source, the crystal, and the detector. It is difficulty for the designers to control the focal position as desired [15]. A focusing scheme with a conically bent crystal was proposed by Hall which is described as a modification of the cylindrically bent crystal spectrometer [16]. But Hall’s design produces aberrations due to the absence of rotational symmetry for imaging.
Thus, in order to overcome these difficulties, a special crystal surface is needed. We solved this problem by defining continuous cones to achieve focalization in the perpendicular plane for detecting. In this work, the new method for measuring X-ray lines is developed. A smooth surface is obtained that fulfills Bragg’s condition for photons in each point in such a way as to allow for energy focalization. The concept of a continuously conical crystal analyzer is described, and the spectrometer based on such a crystal is used to measure X-ray spectra with high resolution in a wide energy region on X-ray Tube device and Xingguang-III Laser Facility. The detection system can also meet technical requirements such as testing X-ray fluorescence, X-ray emission spectroscopy, X-ray absorption spectroscopy in fluorescent mode and resonant inelastic X-ray scattering because of good focusing ability, high energy resolution and its continuously conical surface.
Methods
The concept of integrated conical crystal analyzer with a discontinuously conical surface has been proposed by Kohei Morishita [15]. Figure 1 shows the schematic configuration of the discontinuously conical surface. It consists of a set of conical rings with different radii, A, B, and C cones with their surfaces located on the nodal line passing through the crystal surface. The tilt angle of the ring plane gradually increases closer to the detector. The shape of the crystal is produced by many of these cones. They were respectively designed and converge X-rays with wavelengths of λ1, λ2, and λ3. Under these conditions, it is possible to focus X-rays of different wavelengths to different positions on the detector plane which is perpendicular to the nodal line. In this structure, the width of the cone rings makes the surface discontinuous, which will lead to aberrations.

Principle diagram of the spectrometer with discontinuously conical crystal.
This paper presents a novel crystal spectrometer with continuously conical surface which can eliminate the aberrations of the X- ray imaging. The analysis of its principle is shown in Fig. 2. Point O is the origin of coordinates, the source S is located on the Z-axis, AP is located on the detector plane which is parallel to the Z-axis, and M is the midpoint of ON. The X rays are emitted from the point S and reflected at the point M. The reflected rays are focused on the detector plane. Under the condition OM = MN, HM is perpendicular to ON. The H point is placed as the center circle of the crystal and HM is the corresponding radius. It is proved that all the X-rays, which are emitted from the point S and are reflected from the inner surface, are focused on AP. In other words, the rays involved in the imaging have rotational symmetry in theory.
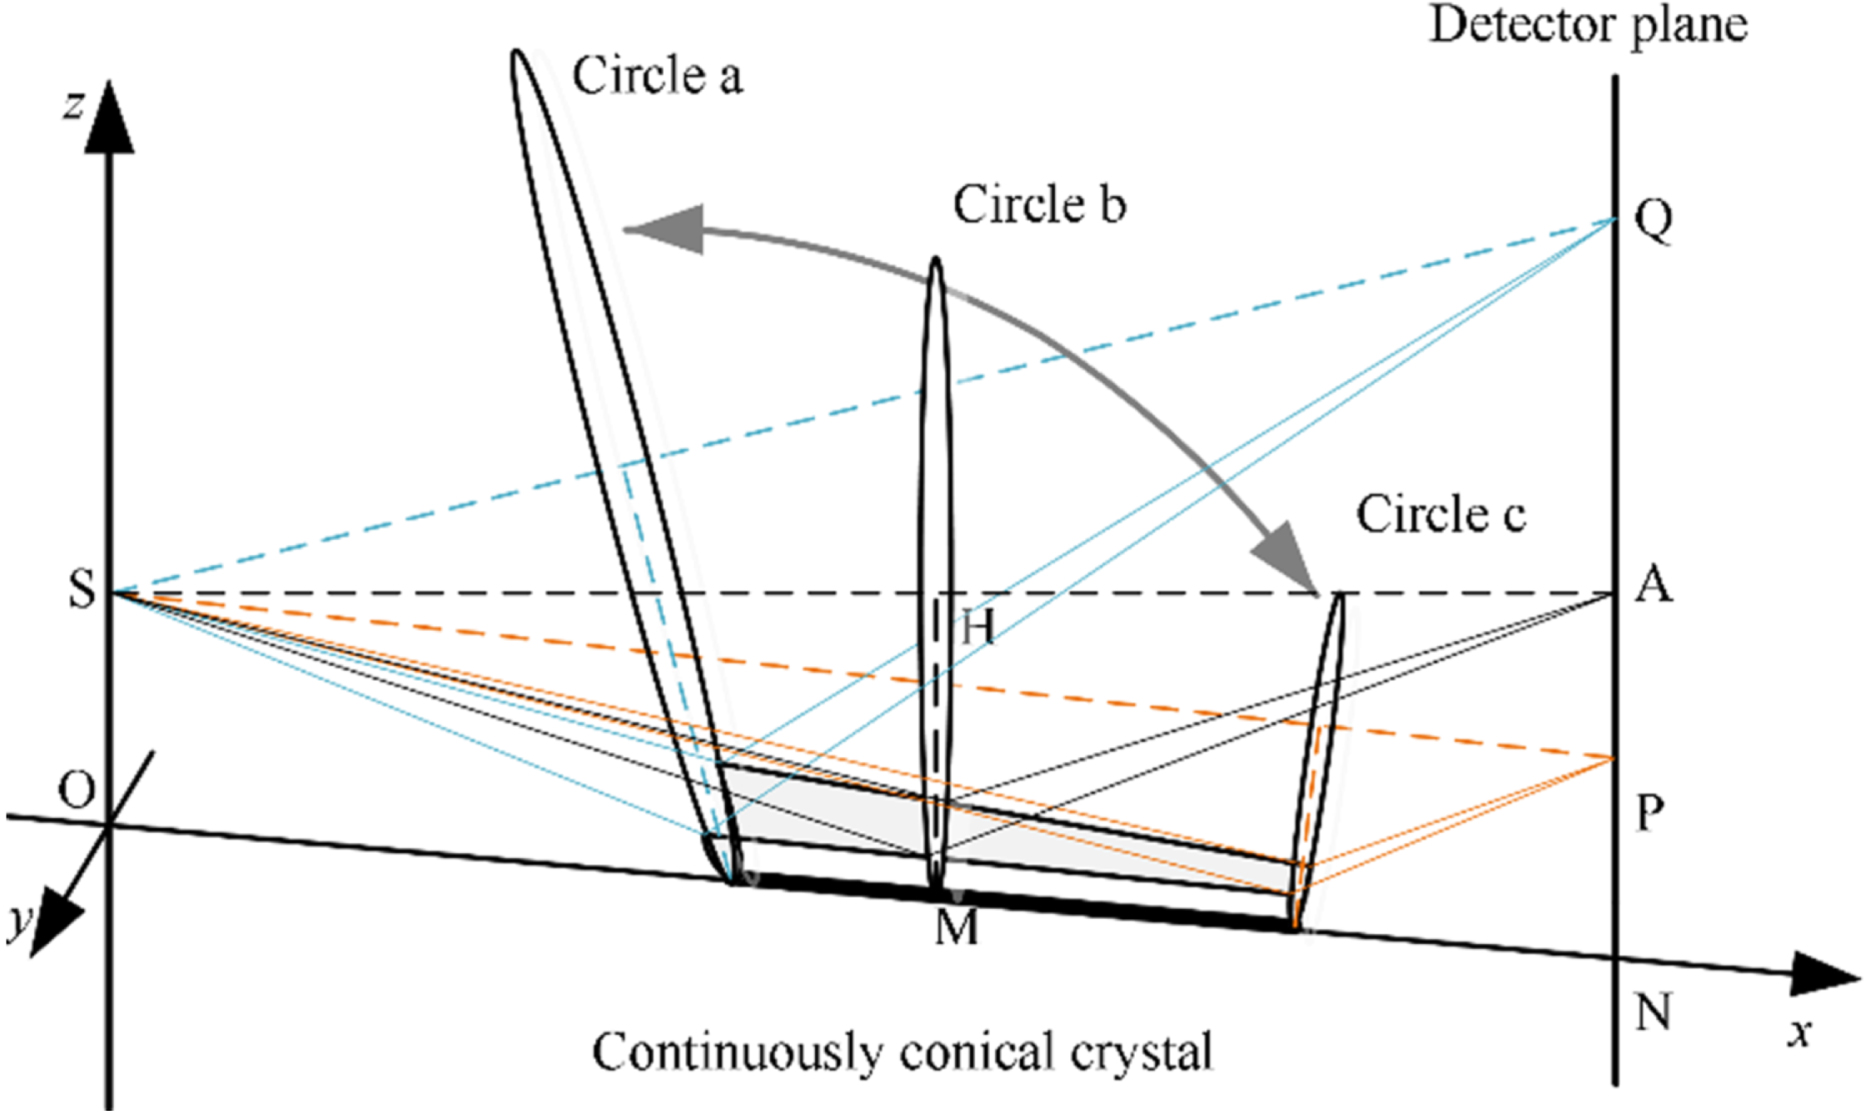
Principle diagram of the spectrometer with continuously conical crystal.
The geometry of continuously conical surface is sketched in Fig. 3. In order to understand this construction, two conical segments HM and EF are shown. The horizontal distance between the source and the detector is 2L0. HM is the radius of the circle at the center position. The angle between incident ray SM and reflecting surface is the Bragg angle. On the premise of determining the location of the center circle, the position of any circle can be inferred through the following formula.
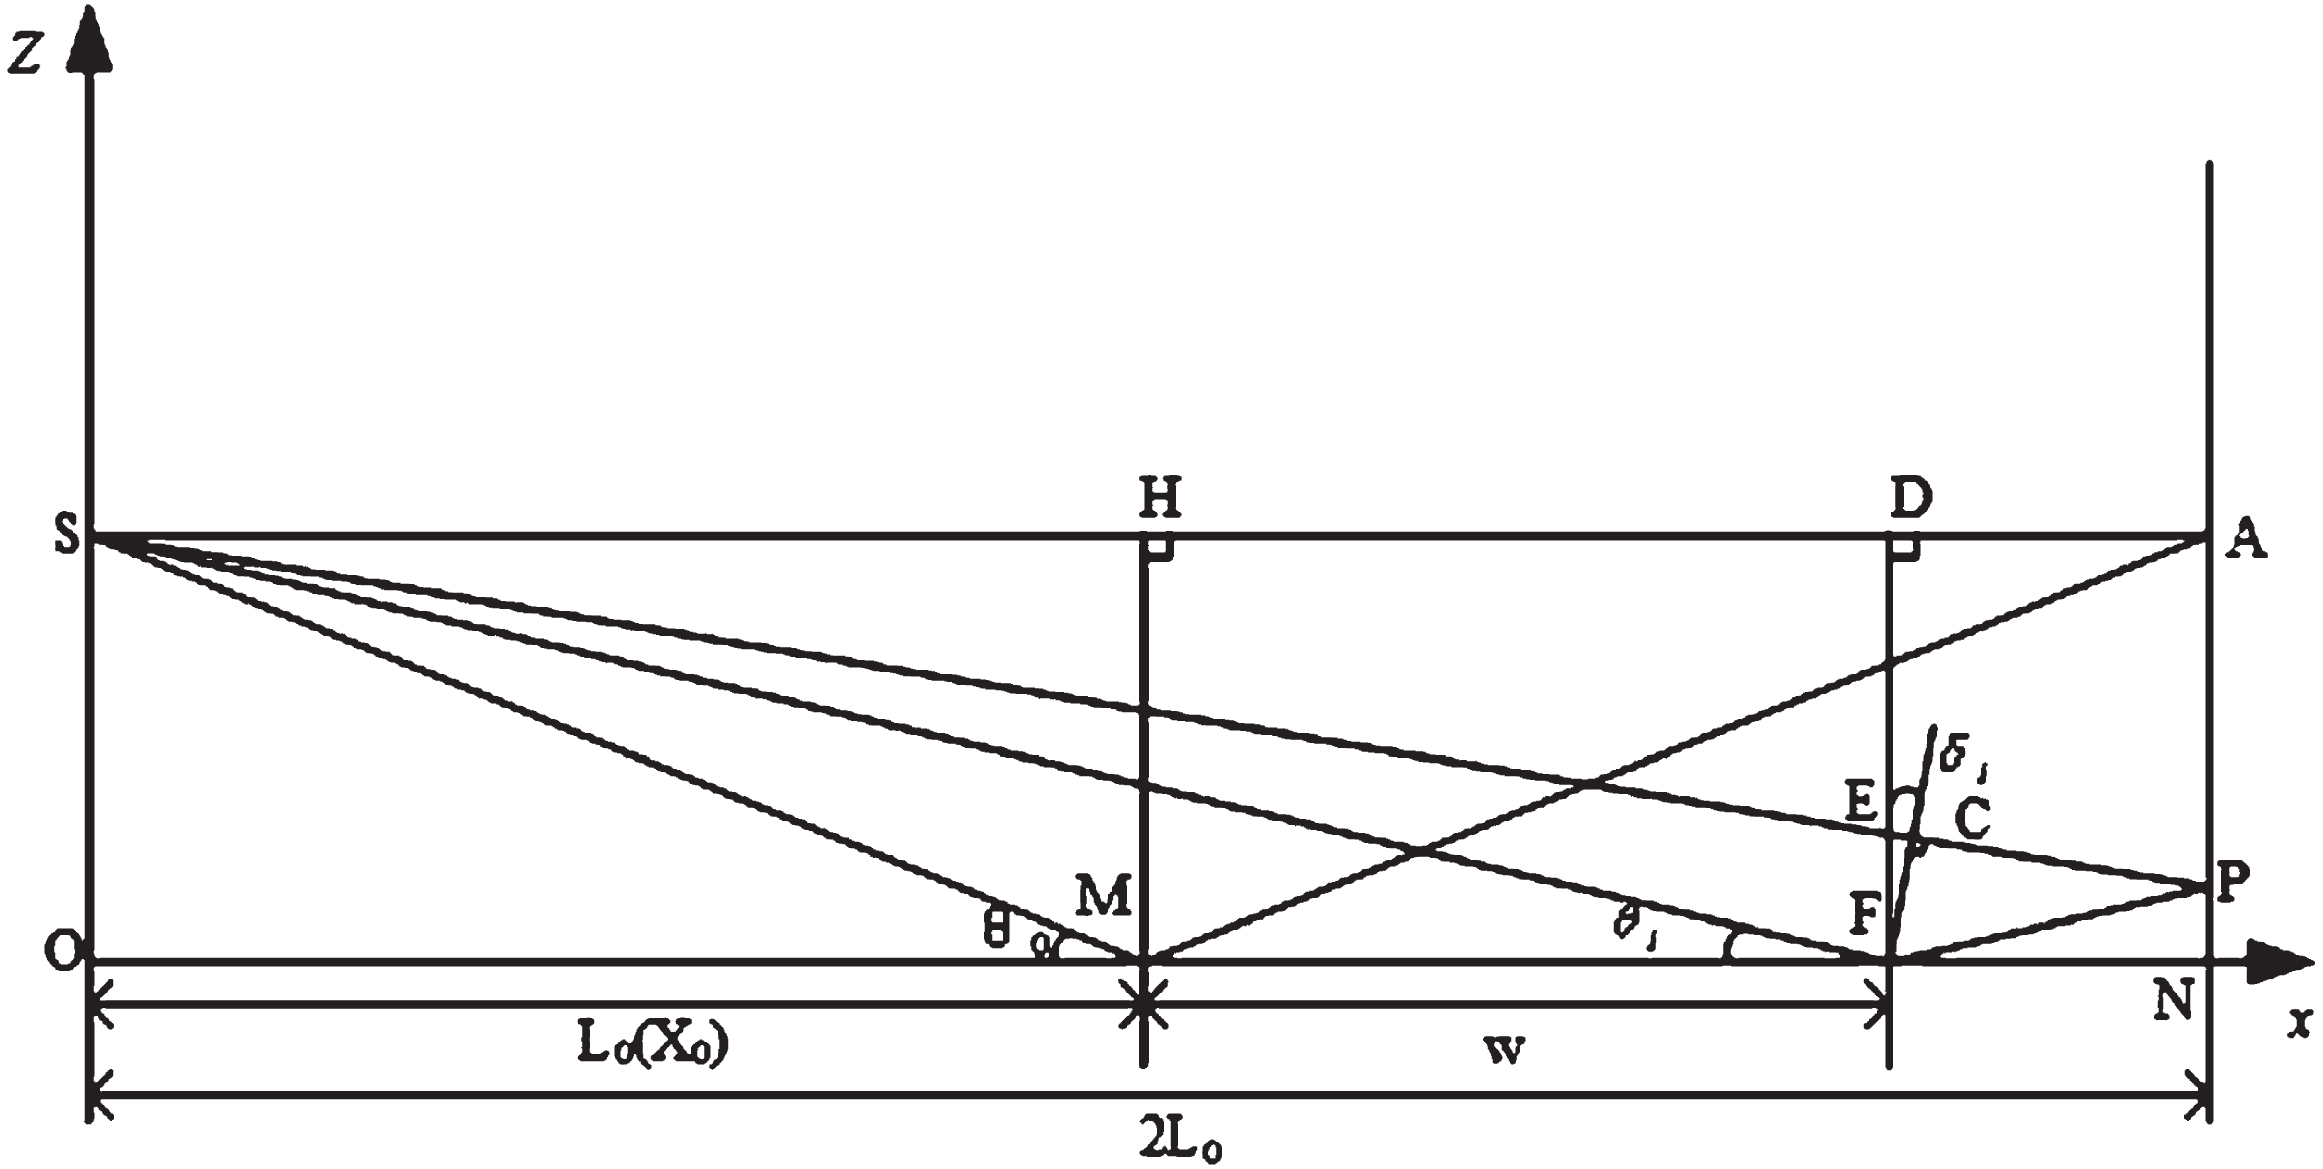
The geometric relation of the parameters.
The radius of the circle R
i
can be obtained in right angled triangle CSF according to the tilt angle and Bragg angle.
The position, Bragg angle, tilt angle and other parameters of any circle can be obtained by Equation (1)–(4). The distance between the source and the receiver should be as small as possible to reduce the energy attenuation in the air during the diagnosis process. In this design, the distance 2L0 is 283.4 mm and the height of the source SO is 110 mm. The wavelength dispersion is defined as dλ/ds, where λ is the wavelength and s is the length of the image points distributed on the detector plane.
Figure 4 shows the function y i (s) and x i ( λ) on enlarged scales and demonstrates that, for the parameters of our present design, these functions are well approximated by straight line with the slopeds/dλ= 0.106 (mm/mÅ), then we get
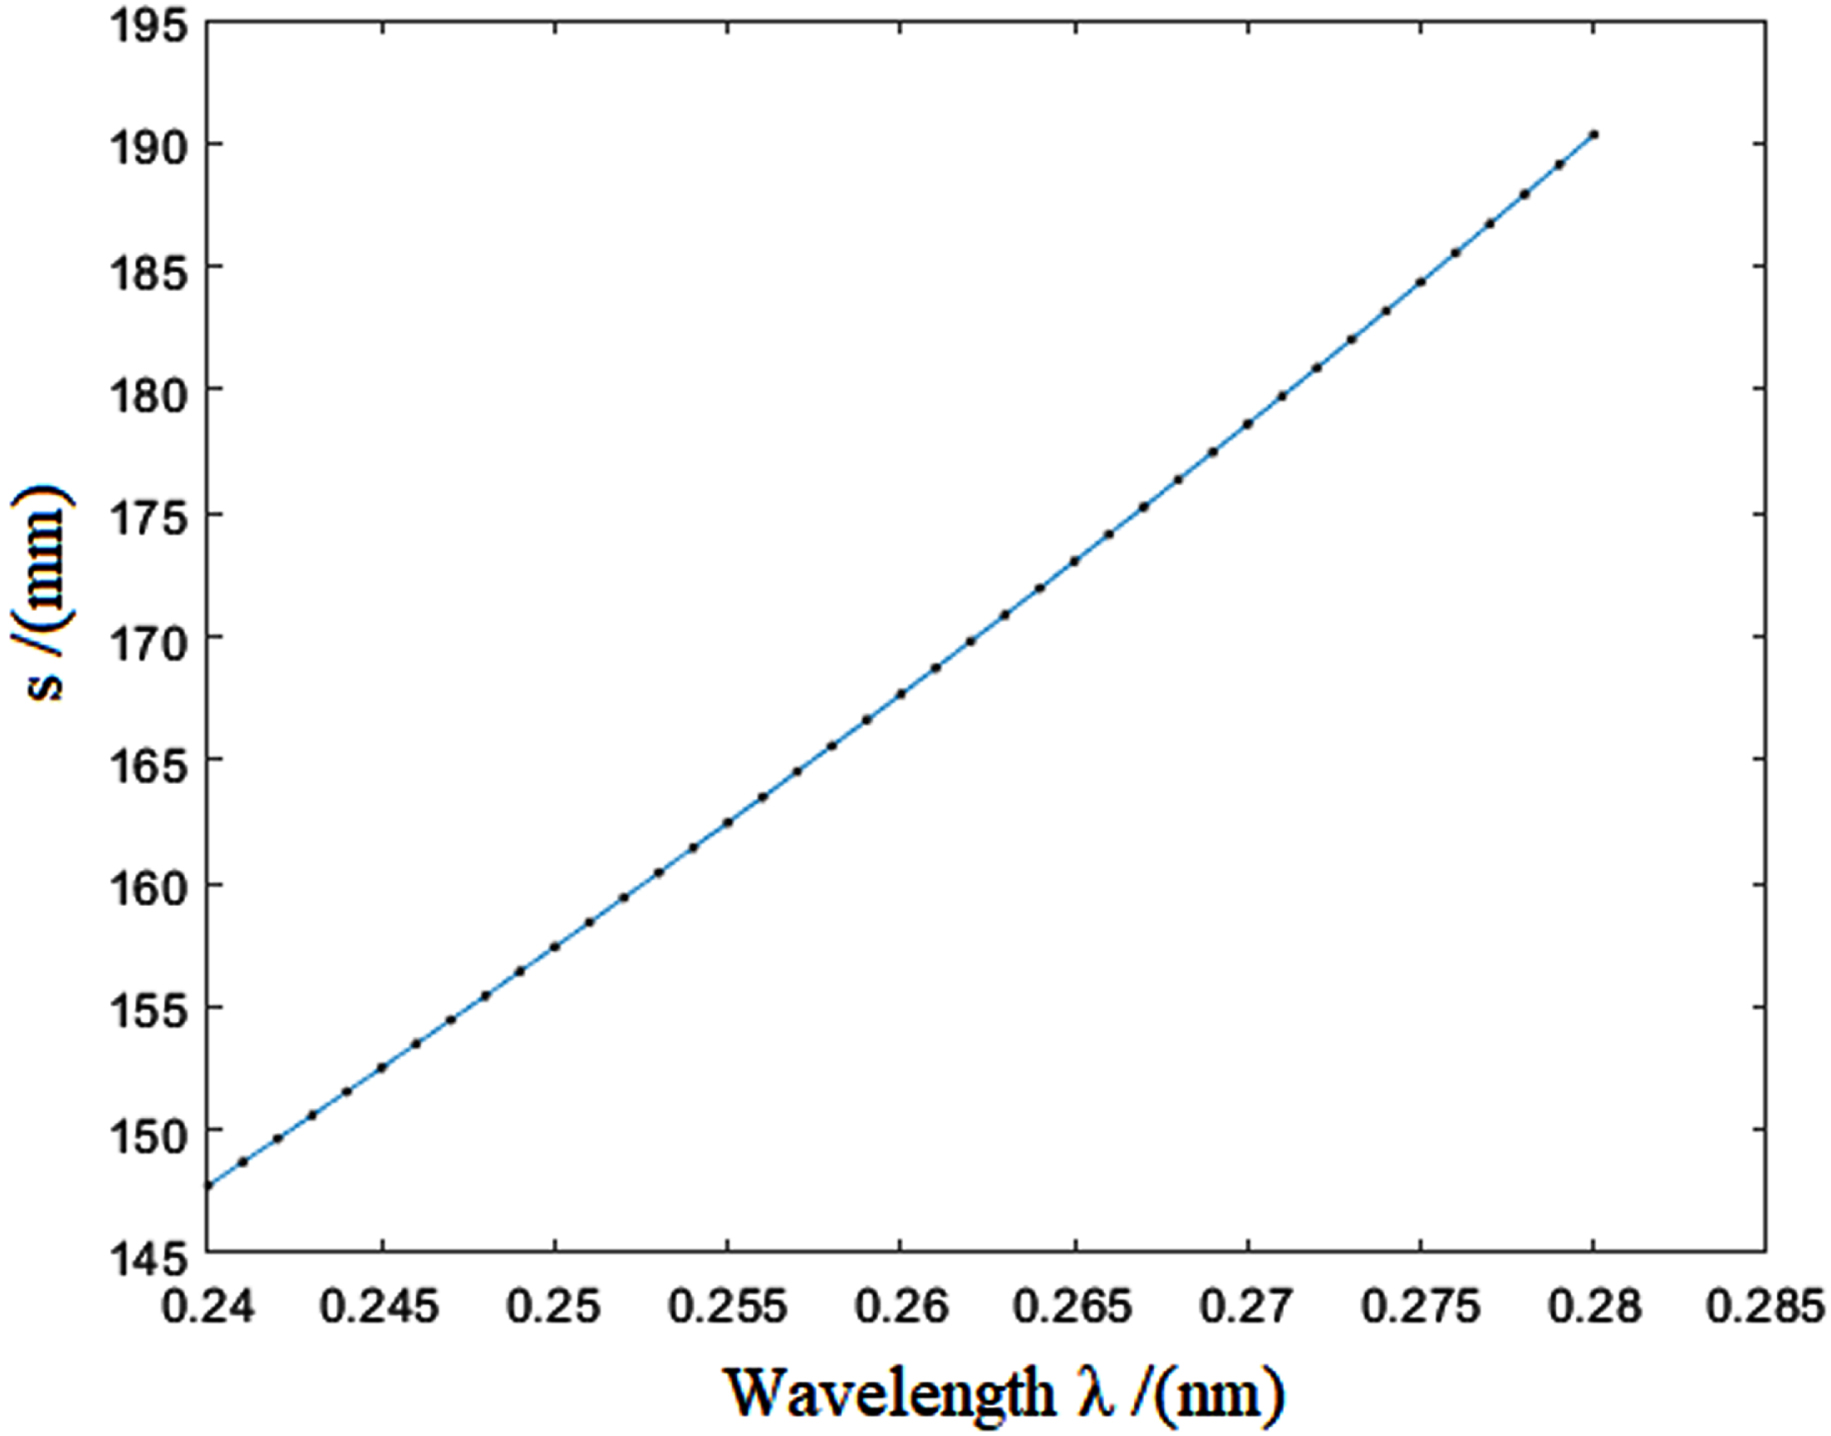
Abscissa s of image points (black) as a function of λ and straight line (blue) connecting the endpoints.
The resolving power derived from Equation (5) for the case that the detector is an image plate, assuming a 50μm detector resolution, is 5532, which should be enough to accurately measure. In the following, we describe our design of CCCS for the X-ray energies 4.355≤E≤5.169 keV which include the energy of the Kα and Kβ lines of Ti at 4.511 keV and 4.932 keV.
The measurement of the X-ray lines with CCCS was carried out on the Ti X-ray tube device. A CMOS camera is used to be X-ray spectra detection device. The measurement of the K α and K β lines of Ti is the target in the experiment.
Due to the difficulty of CCC machining, α-quartz (2020) was finally selected as the diffraction crystal owing to its excellent bending property. Optical scheme of the test experiment with CCCS is shown in Fig. 5a. The X-rays radiated to crystal plane from the source. After reflection from the crystal, X-rays of different wavelengths are focused by CCC on the detector plane. The positions of X-ray source (X-ray tube), crystal and CMOS detector are as shown in Fig. 5b. The voltage parameters of the X-ray tube are 20 kV, the current parameters are 25 mA, and the irradiation time of the light source is set as 10 seconds. The optical path contour calibration should be carried out before the experiment.
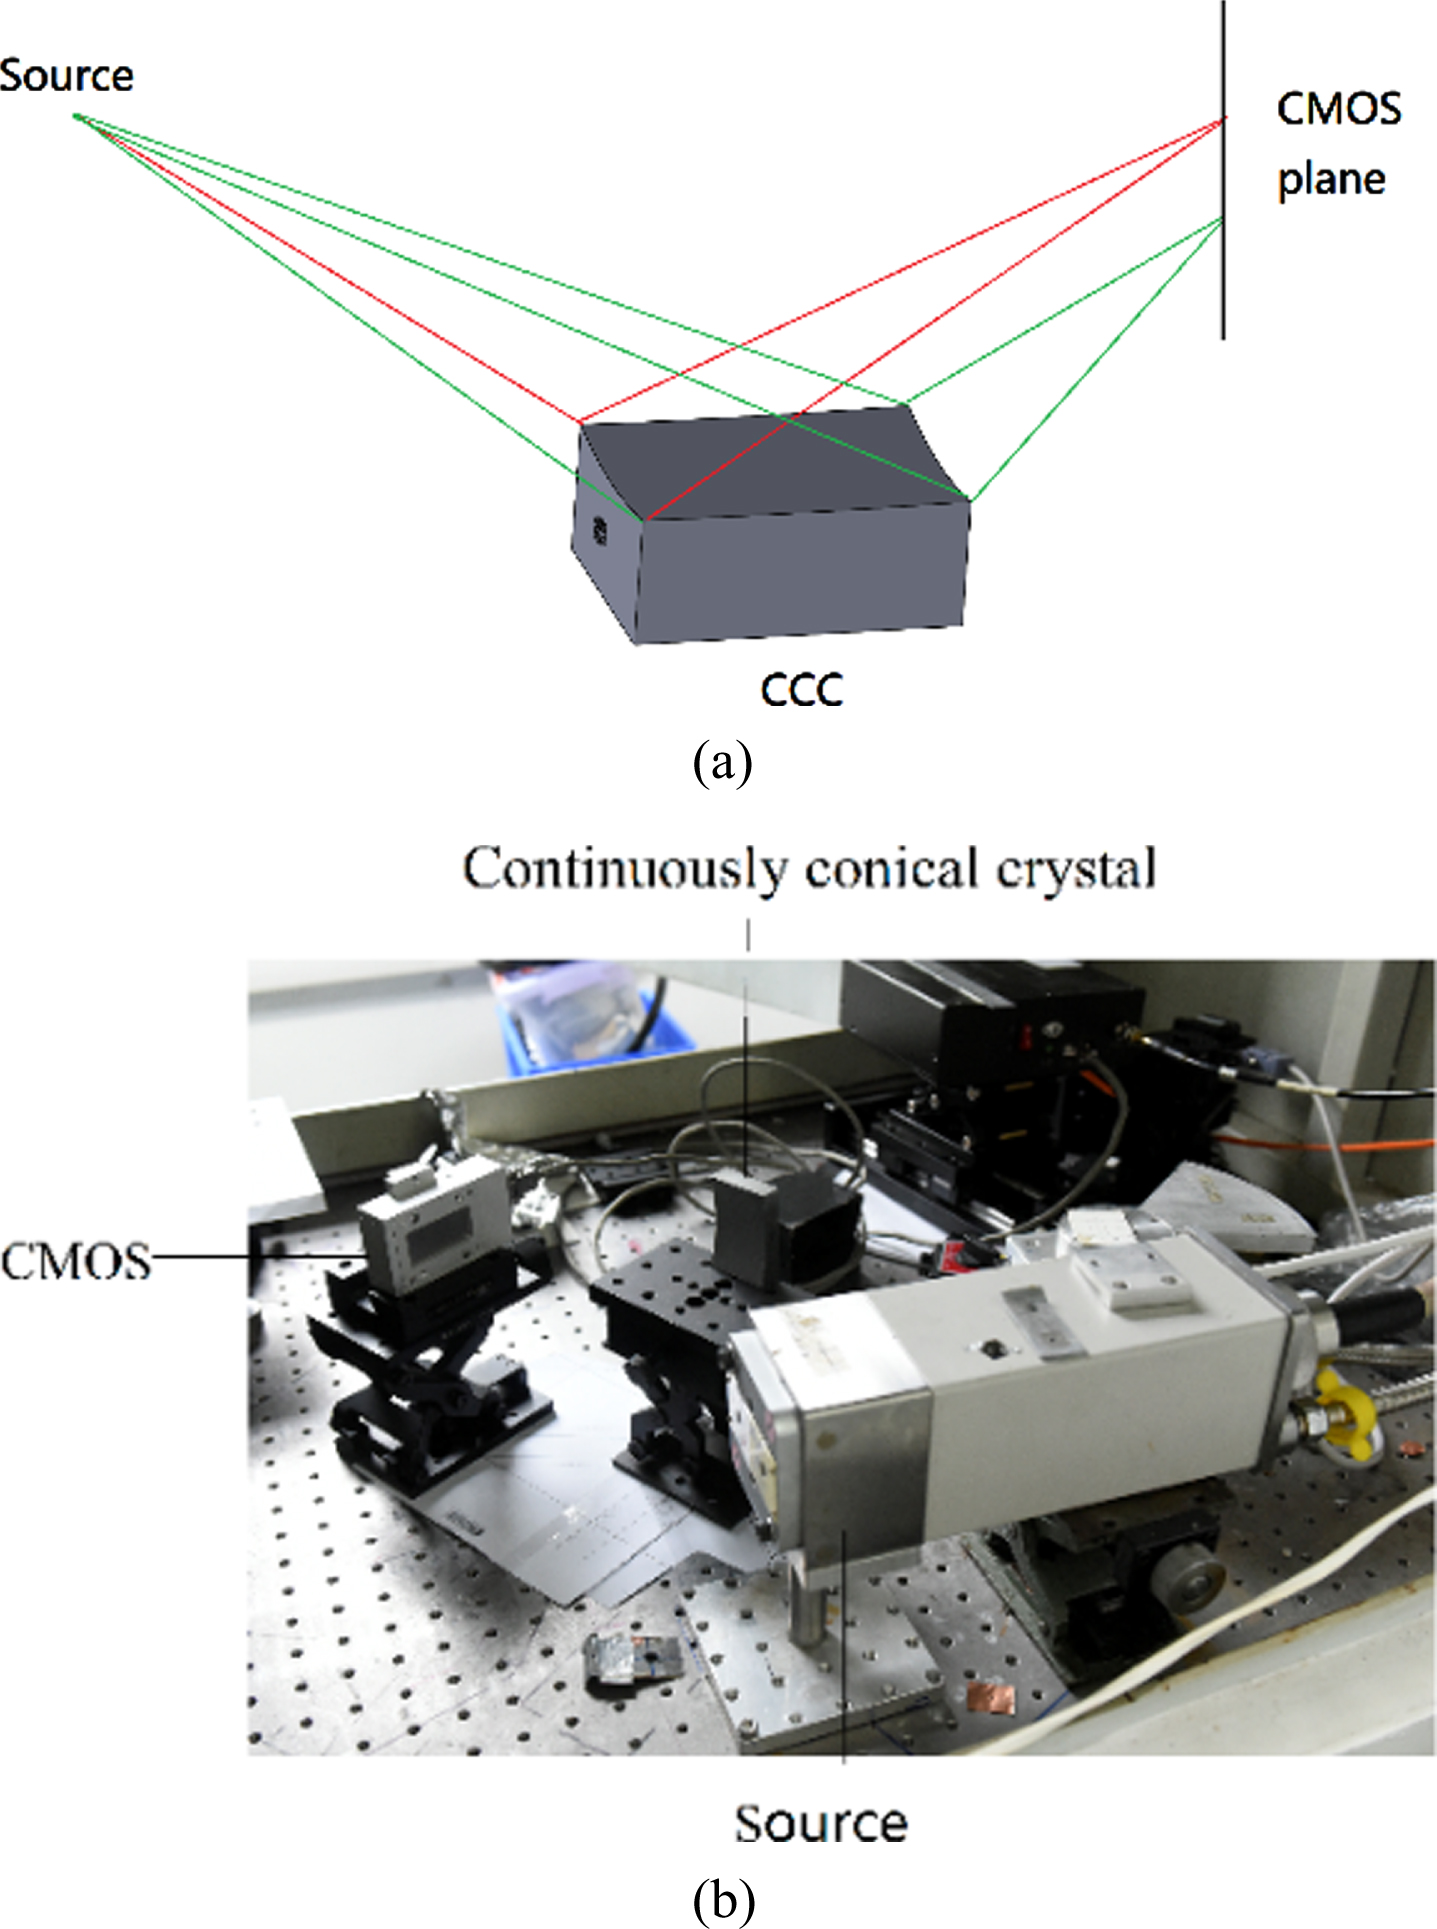
Overview of X-ray detection system with CCC. (a) Schematic description of the detection system, (b) Layout of experimental devices.
The spectral image captured by CMOS is shown in Fig. 6a. In the figure, the upper and lower bright spots are the focal spots of K β rays and K α rays, respectively. It should be noted that the bright white line in Fig. 6 is the influence of the CMOS camera itself, and this phenomenon also exists without X-ray input. In order to verify the focusing ability of the CCCS, the experiment result using a planar crystal was obtained as shown in Fig. 6b. The diffraction spectra were obtained under the same condition by using a plane α-quartz crystal. As can be seen from the Figure, the spectral lines obtained by the plane crystal is very weak due to the lack of focusing ability.

X-ray spectra obtained by CMOS camera crystal with (a) CCC, (b) plane crystal.
In Fig. 7, we show the distribution of spectral intensity, which is obtained by analyzing the image recorded with the CMOS camera. In our experiment, the K α and K β energy of the Ti are 4.511 keV and 4.932 keV. The spectral energy resolution ΔE (full width at half maximum values, FWHM) of the Kα X-ray can be calculated from Fig. 7. The spectral resolutions obtained from CCCS are around 615. The size of the Ti X-ray source is larger (about 1 mm), and the excessive size of the source limits the spectral resolution of the crystal spectrometer.
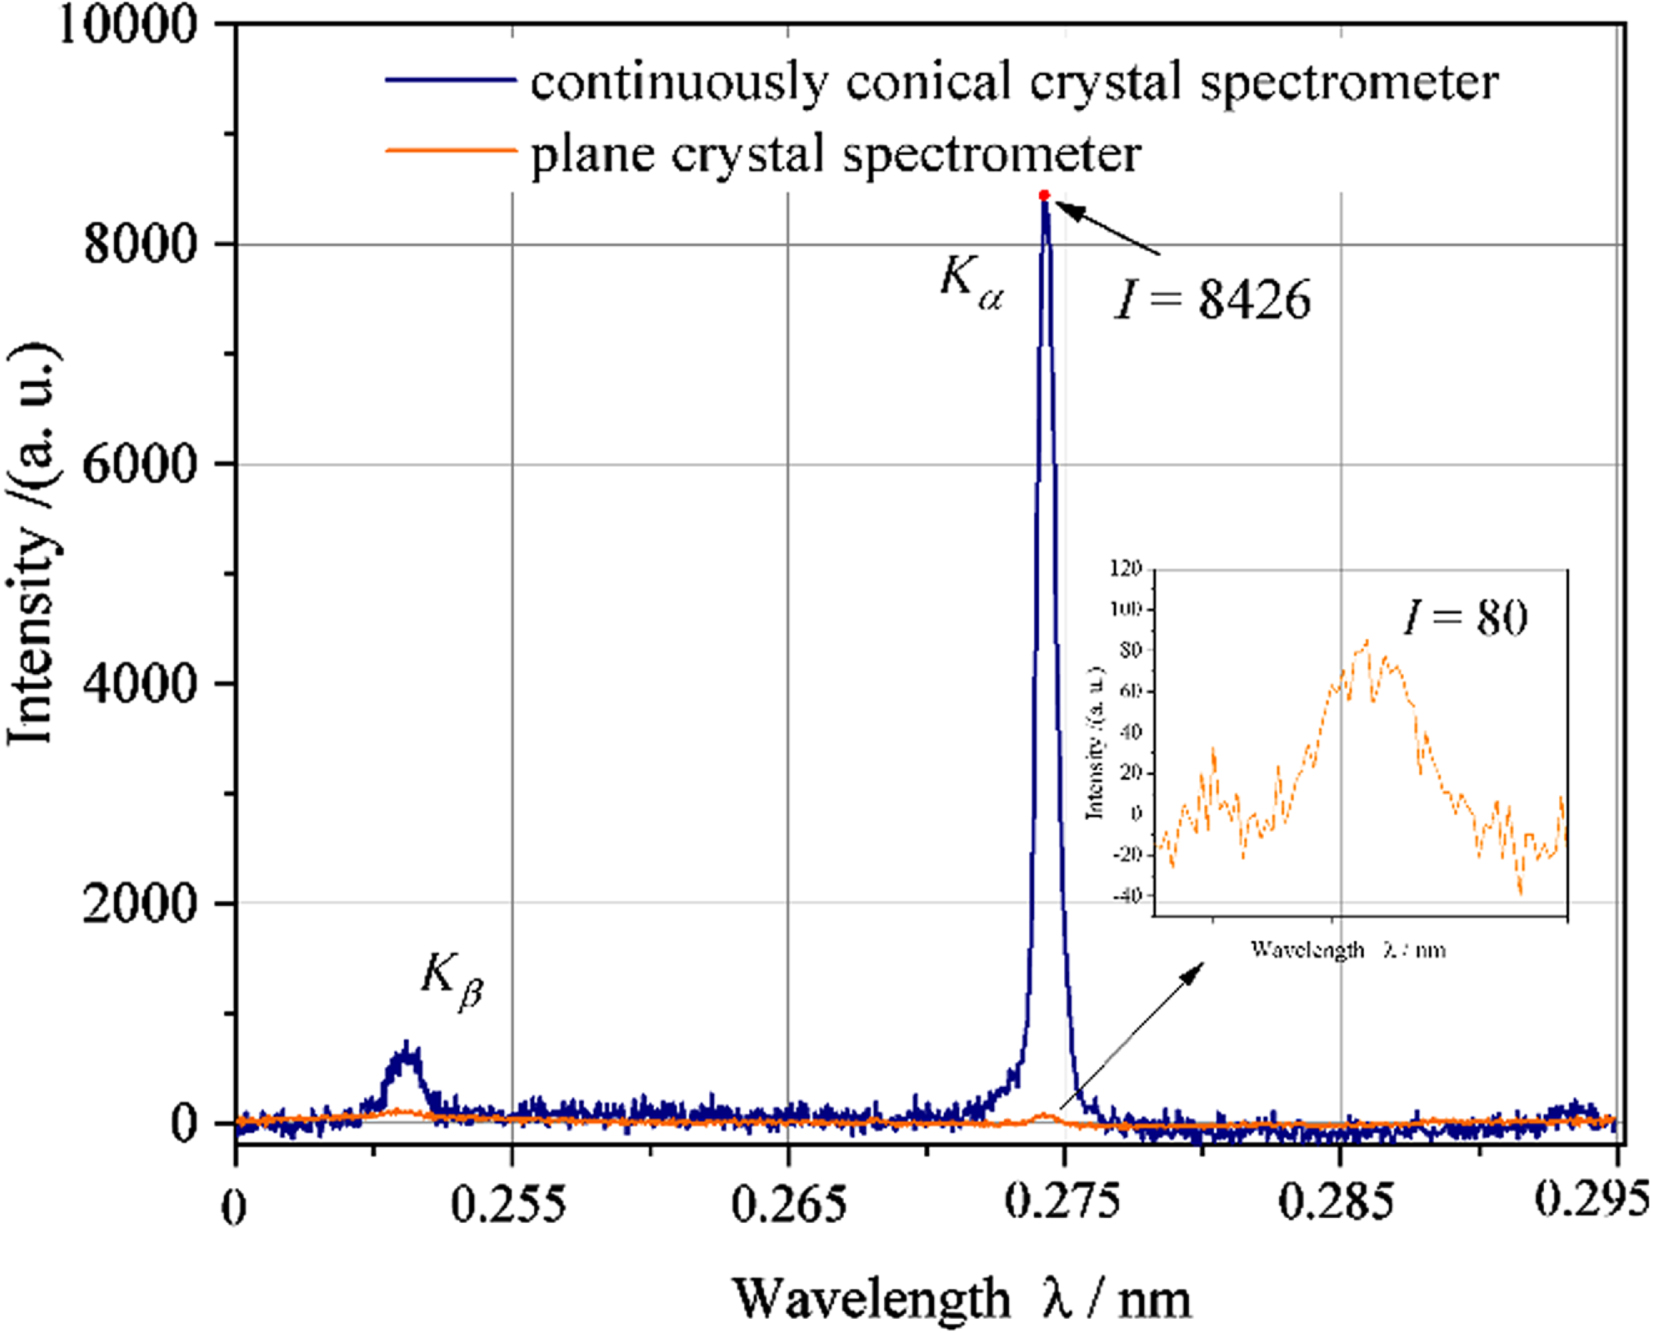
The distribution of spectral intensity from Ti X-ray tube device.
Another experiment was carried out on Xingguang-III Laser facility with the aim of measuring X-ray spectra from Ti plasmas. A 2 ns, 532 nm beam size, and flattop pulse was used to irradiate the target top at 45°incidence angle with laser intensities of 230J. In the experiment, the high spectral resolution of the CCCS is verified with the source size of 200μm.
The typical Ti spectra recorded by imaging plate are presented in Fig. 8. They include the He-like resonance line He α(w), the inter combination He-like line (y), and the Li-like satellite line peak. The observable transitions and the corresponding energies are identified in Table 1 [17, 18]. Then the FWHM could be evaluated as 4.5 eV within the Heα resonance line (4750 eV). The corresponding E/ΔE is about 1000. Compared with ΔE of 9–13 eV in literature [2], CCCS has obvious advantages.
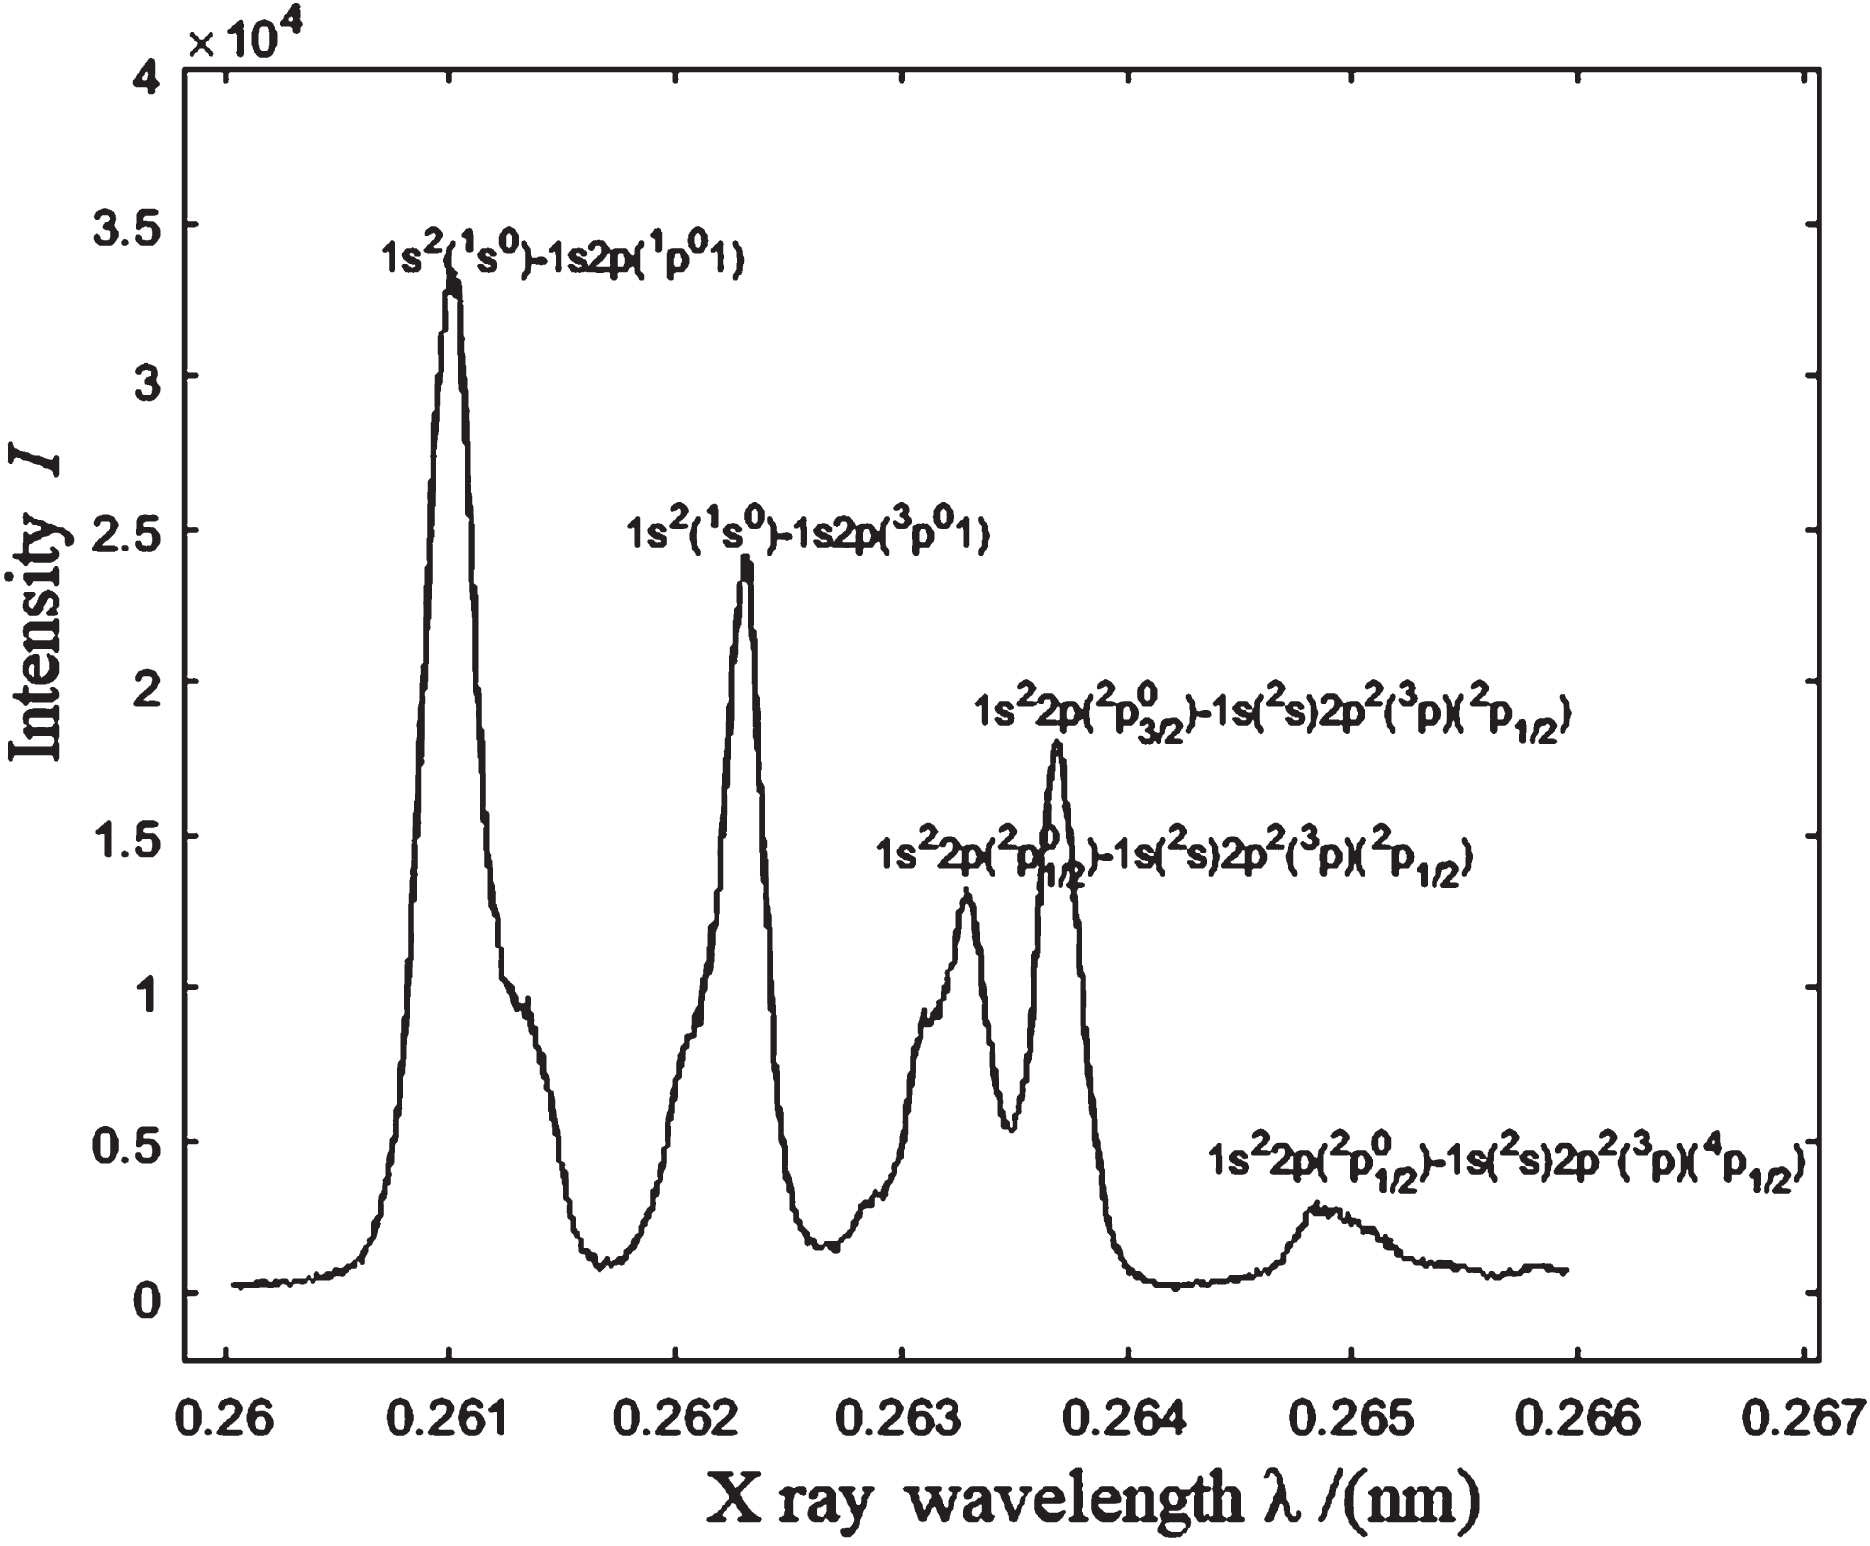
The lineout of the spectrum from a Ti target on the Xingguang-III facility.
Typical operation parameters
A new X-ray spectrometer based on CCC has been developed to obtain high resolution and the detector plane is perpendicular to a nodal line on the crystal surface. It can acquire intensity X-ray spectra in a wide wavelength range by selecting appropriate crystal. The experiments with CCCS and planar crystal were carried on Ti target X-ray Tube device separately. The excellent focusing performance of CCCS was demonstrated by using a CMOS camera. CCCS was also used to test X-ray spectroscopy on Xingguang-III laser facility. Distinct He-like Ti spectra were observed with high brightness. This system can be used for time-resolved measurements of X-ray line spectra at the National Ignition Facility (USA) and other high power laser facilities. It is also used to test X-ray tube in any conventional X-ray laboratory.
Footnotes
Acknowledgment
This work was supported in part by Natural Science Foundation of China, under Grant 12275035, in part by the Venture & Innovation Support Program for Chongqing Overseas Returnees (No.cx2018023), in part by the Science and Technology on Plasmas Physics Laboratory (No. 6142A04180207).