
Abstract
BACKGROUND:
Computed tomography (CT) plays an important role in the field of non-destructive testing. However, conventional CT images often have blurred edge and unclear texture, which is not conducive to the follow-up medical diagnosis and industrial testing work.
OBJECTIVE:
This study aims to generate high-resolution CT images using a new CT super-resolution reconstruction method combining with the sparsity regularization and deep learning prior.
METHODS:
The new method reconstructs CT images through a reconstruction model incorporating image gradient L0-norm minimization and deep image priors using a plug-and-play super-resolution framework. The deep learning priors are learned from a deep residual network and then plugged into the proposed new framework, and alternating direction method of multipliers is utilized to optimize the iterative solution of the model.
RESULTS:
The simulation data analysis results show that the new method improves the signal-to-noise ratio (PSNR) by 7% and the modulation transfer function (MTF) curves show that the value of MTF50 increases by 0.02 factors compared with the result of deep plug-and-play super-resolution. Additionally, the real CT image data analysis results show that the new method improves the PSNR by 5.1% and MTF50 by 0.11 factors.
CONCLUSION:
Both simulation and real data experiments prove that the proposed new CT super-resolution method using deep learning priors can reconstruct CT images with lower noise and better detail recovery. This method is flexible, effective and extensive for low-resolution CT image super-resolution.
Keywords
Introduction
During the process of medical computed tomography (CT) imaging, the resolution of CT images is affected by various factors such as the imaging resolution of CT imaging equipment, the radiation dose that patients can bear [1, 2]. Low-resolution CT images bring difficulties to subsequent diagnosis. Image resolution is an important indicator to measure the quality of CT images. The higher the image resolution, the more information can be obtained from the image [3, 4]. CT imaging quality can be improved by using more sophisticated hardware. However, manufacturing costs are often very high and delicate artifacts have a short life. Therefore, super-resolution (SR) reconstruction algorithms that transform low-resolution CT images (LRCT) into high-resolution CT images (HRCT) based on existing hardware facilities have become a research hotspot [5–7].
At present, the mainstream super-resolution reconstruction algorithms for CT images can be divided into two types: the super-resolution technology based on optimization model and the super-resolution technology based on deep learning. Super-resolution algorithm based on the optimization model constrains the solution space of the super-resolution reconstruction problem by adding the prior knowledge of the image into the super-resolution reconstruction model as a constraint condition [8–10]. However, when the prior information is insufficient, the reconstruction results of these super-resolution methods using regularization terms based on mathematical expressions are not satisfactory [11]. It is mentioned in the literature [12] that Total Variation (TV) Regularization will result in excessive smoothness of reconstruction results. The selection of wave base in the super-resolution technology based on wavelet transform has the problems of limited adaptability and insufficient ability to maintain high frequency details [13].
Recently, deep learning networks are widely used in image super-resolution [14, 15]. Ren proposed two advanced CNN-based models to reconstruct CT images using two advanced CTSR models [16] based on convolutional neural network (CNN) and residual learning: single-slice CTSR network (S-CTSRN) and multi-slice CTSR Network (MCTSRN). In 2018, Park [17] used the classic U-Net for CT image SR for super-resolution. In 2019, You [18] used an unsupervised residual learning method based on Cycle-GAN network to train the mapping of high-resolution CT images and low-resolution CT images. Recently, some super-resolution reconstruction methods combining sparse regularization and deep learning prior have been applied to natural images [19, 20]. Compared with sparse regularization terms based on mathematical expression, deep learning networks can learn deeper feature information of images by training data sets [21], thus improving the quality of super-resolution results. It is believed that the combination of deep learning and optimization model is a technical method that meets the actual demand. CT imaging has a high requirement for reliability, which is controversial in deep learning [22]. Therefore, the method based on optimization model can improve its reliability to a certain extent and make it practical. In this paper, a CT image super-resolution reconstruction model is designed based on low-resolution projection data. A CT super-resolution method based on deep learning prior (DIP-CTSR) is proposed, which combines sparse regularization and deep learning priors. The proposed method utilizes a deep plug-and-play framework and alternating direction method of multipliers (ADMM) [11] to introduce super-resolution networks into iterative optimization algorithms. Theoretical studies have shown that a suitable degradation model is the key to the success of super-resolution algorithms [23, 24]. Different from the super-resolution reconstruction algorithm in the natural image field, which starts from the image domain, CT imaging needs to go through CT image scanning, projection acquisition and reconstruction, and the CT super-resolution model takes the projection data as the initial value input. Therefore, how to design a reasonable super-resolution reconstruction model of CT image is an important challenge for proposed method.
The rest of the paper is organized as follows. Section 2 presents the CT super-resolution reconstruction model and implementation details. The simulated and real data and experimental results are described in Section 3, and the discussion and conclusions are given in Sections 4 and 5.
Method
Super-resolution reconstruction framework
In this work, a CT super-resolution reconstruction algorithm combining L0-regularization terms and deep learning priors is proposed. This method is a model-driven super-resolution method. In the process of projection data generation, due to the insufficient number of photons, there will be additional noise interference. And the degradation process is represented by the following formula, where u ∈ R
N
(N = N
w
× N
h
) represents a vectorized 2D CT image, g ∈ R
M
(M = M1 × M2) stands for projection dataset, M1 and M2 are respectively the numbers of views and detector elements. The matrix H ∈ RM×N represents the system matrix, and δ ∈ R
M
represents the noise of sensing and random noise
In Model-Based Iterative CT Reconstruction, the image u is reconstructed by solving the problem:
For such multi-variable optimization problems, this paper uses the ADMM [23, 25] algorithm to decompose the optimization model into several sub-problems and solve them respectively. In order to facilitate the solution of the optimized reconstruction model, auxiliary variable z was added to the optimization model. Then, Equation (4) was reformulated as a constrained optimization problem:
Meanwhile, the augmented Lagrangian function L of Equation (5) is as follows
The u sub-problem can be regarded as the minimization of image gradient L0-norm. The u is replaced by the auxiliary variable v, Equation (7) can be transformed into the following constrained optimization problem:
Equation (13) can be solved using the separate parabolic surrogate method, which is expressed as. The expression for iterative update of u is as follows
For the z sub-problem, it can be solved efficiently by Fast Fourier Transform (FFT). Equation (8) has a fast closed-form solution [20, 26]
In order to facilitate further solving the x sub-problem, the x sub-problem is written as the following formula
Let
After solving the first two sub-problems, we get the z after initial de-blurring. Double cubic interpolation was used to enlarge the image twice and take it as the input of the super-resolution network. In the iterative reconstruction process, the super-resolution network maps the input CT image to a clearer HRCT image. After a certain number of alternate iterations, the CT super-resolution reconstructed image with low noise level and high resolution is finally obtained.
The network structure used in this method is an improved VDSR network framework [27]. The basic block in the network is a cascaded convolutional layer and a nonlinear layer, so the cascaded basic block has 30 layers. The network takes the interpolated low-resolution image as the input, and then adds this image with the residual image learned by the network to get the final output of the network. Each convolution layer in the network contains 64 filters, with the convolution kernel size of 3×3 and the Padding set to 1. And the rectifying linear element of nonlinear layer is leakage rectifying linear element (LReLu). Compared with VDSR, the depth of the improved algorithm is increased to 30 layers with more receptive fields. The VDSR+ structure is shown in Fig. 1. The choice of loss function is different from the previous VDSR network. Instead of using L2-norm as loss function, it uses a more robust L1-norm. The L1-norm is more robust than L2-norm because it can handle outliers in the data. The network optimizer uses the Adam optimizer, and the initial learning rate defaults to 0.0001. In order to demonstrate that the improved network can further improve the super-resolution results. In the experimental section, the super-resolution algorithm using the unimproved VDSR network in solving the x sub-problem is named DIP-CTSR, and the super-resolution algorithm using the improved VDSR+ network in solving the x sub-problem is named DIP-CTSR+.
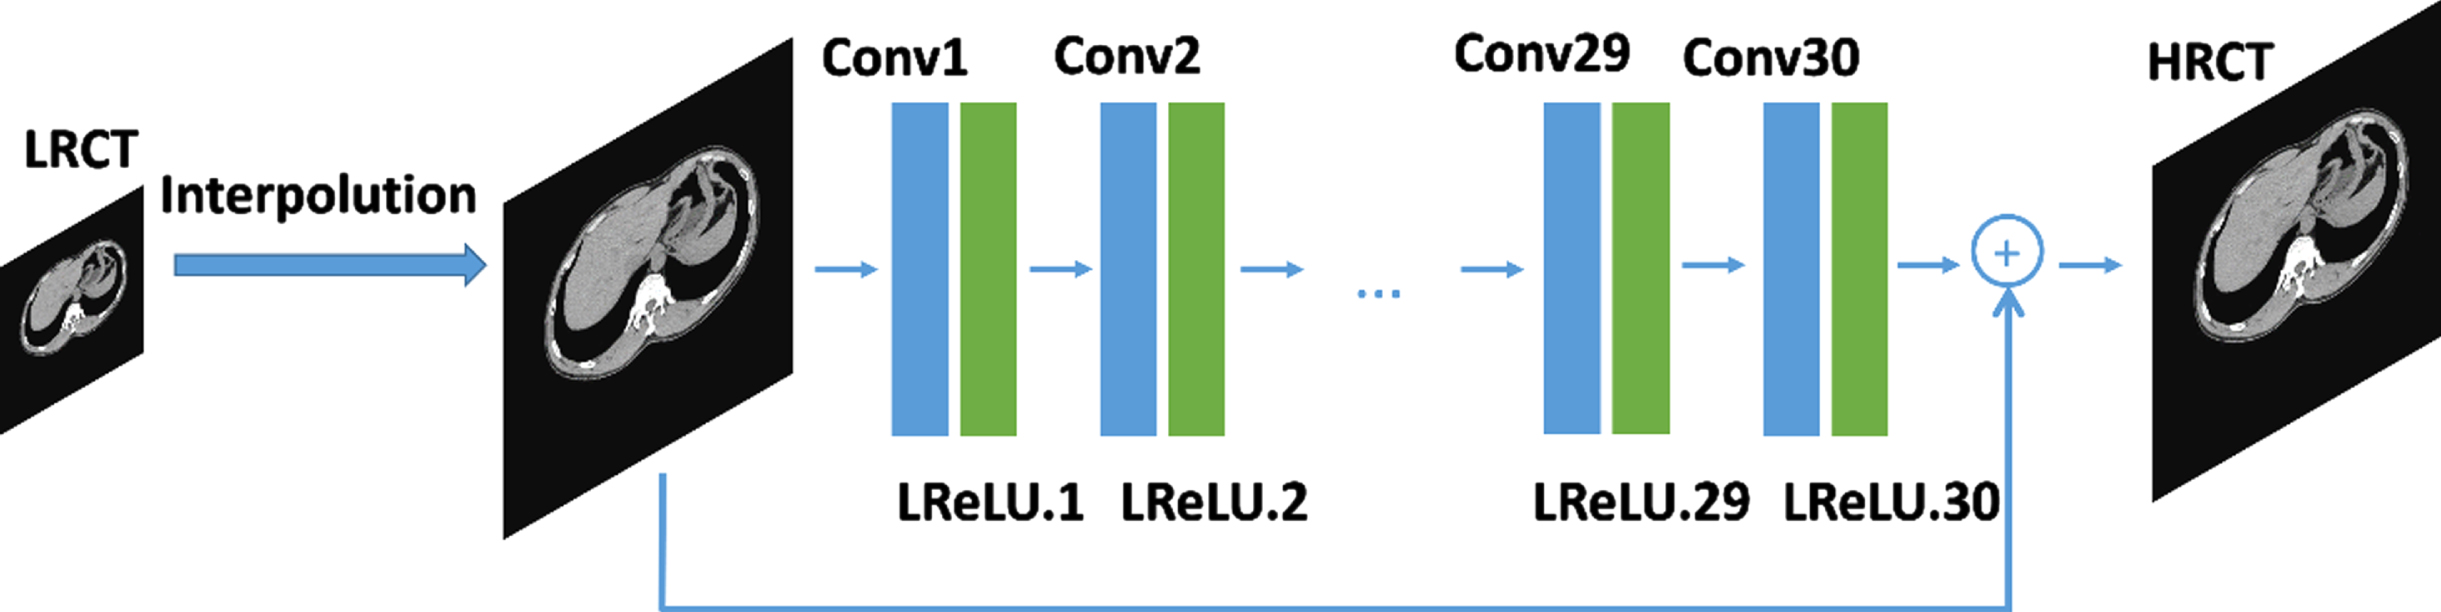
Improved Residual Block and improved network structure.
The network training data set was selected from Henan Provincial People’s Hospital, including 1200 head CT images of 7 patients and 750 abdominal CT images of 5 patients, with the image size of 512×512. In the construction of training data set, we obtained low-resolution projection through simulation and reconstructed 256×256 low-resolution CT images. In the supervised training mode, high resolution and low-resolution CT images were used for the training. The validation dataset included 200 head CT images from the other two patients and 110 abdominal CT images from the third patient, for a total of 310 images. Low-resolution projection data were generated using 100 abdominal section images from a patient in the test data set.
The process of the whole algorithm is presented in Algorithm 1 as follows:
In the simulation data experiment, the initial image of all methods is set to zero, while in the actual data experiment, the initialization step is reconstructed using FBP. All iterative methods stop when convergence is reached, and the ordered subset SART (OS-SART) strategy is adopted in this paper to accelerate the convergence speed (the number of subsets is selected as 10) [28]. And Table 1 lists the parameter values for the proposed method. These values were optimized and chosen through extensive experimentations
The parameter values for the proposed method
Objective evaluation of CT images in super-resolution work includes the complexity of the reconstruction algorithm and the root mean square error (RMSE), peak signal-to-noise ratio (PSNR) [29–31] and structural similarity (SSIM) that can reflect the degree of deviation between images. The RMSE value reflects the deviation between the reconstructed image and the original image, while the PSNR is expressed based on the MSE, which reflects the similarity of the two images. In comparison, the PSNR is applied to the bit information of the image, which can reflect the difference more objectively. However, both quantitative analyses of RMSE and PSNR fail to take into account human visual effects, so the SSIM evaluation criterion [32–34] can evaluate the similarity between images in terms of the structural similarity of visual features, as a useful supplement to PSNR. The PSNR value is usually used to measure whether a processing program is satisfactory. PSNR is inversely proportional to the logarithm of the RMSE of the original HR image and the generated image. SSIM is a measure of the structural similarity between images based on three relatively independent comparisons of brightness, contrast, and structure. The SSIM formula can be expressed as the weighted product of brightness, contrast, and structure comparison. By assuming that both HR and reconstructed image have N pixels, the calculation formula of the three evaluation indicators is as follows
In Equation (21), I (i) represents the reference image,
In addition to the above three common evaluation parameters to evaluate the quality of reconstructed CT images, sharpness refers to the clarity of the boundary between two regions with different tones or colors, and it is also an important evaluation factor for image quality. It can be illustrated by the image quality of bar graphs with progressively increasing spatial frequency. Modulation transfer function (MTF) [35, 36] is a term in optical engineering. In the field of image quality, it can also be used to evaluate image sharpness. The vertical coordinate of MTF curve is the transfer function, and the horizontal coordinate is the resolution. In our work, the slanted edge method is used to calculate the MTF curve. MTF50 is the value of the MTF curve at 50% y-coordinate. Some literature says MTF50%. In the process of calculating MTF value, the average value of more than ten adjacent contour lines at the edge of reconstructed CT image is selected first. After extracting the average edge contour of each boundary, the gradient operation of each edge contour was carried out to obtain the line extension function (LSF). After filling in zero, the Fast Fourier Transform (FFT) of LSF can obtain the MTF value at each frequency. The higher the value of MTF50, the higher the resolution to some extent.
Line pair phantom simulation
In this paper, the FBP reconstruction algorithm, the SART-TV reconstruction algorithm [37, 38], the block matching and TV joint regularization reconstruction algorithm (BMTV) [39], and the deep plug-and-play image super-resolution (DPSR) algorithm [20] were selected for comparison. To verify the good performance of the proposed algorithm. The experiments in this paper were carried out on the AMAX workstation. The workstation has two GeForce RTX2080Ti (NVIDIA Corporation) GPUs. This section presents the experimental results of the proposed CT super-resolution reconstruction method on simulated data. In the comparison of qualitative results, regions of interest (ROI) are marked with red square dashed boxes in the reconstruction results to visually evaluate the ability of different SR methods to recover image details. In the experimental part, RMSE, PSNR and SSIM were selected as quantitative indexes to evaluate the reconstructed images. In addition, the spatial resolution of different reconstruction results is shown by MTF curves. For fair comparison, the image restoration algorithm of the plug-and-play comparison algorithm conducts experimental comparisons based on simulated experimental data and selects its optimal parameters.
The first simulated data experiment used a digital phantom with the reference image shown in Fig. 2. This section uses this digital phantom to generate sinograms. In order to simulate the generation of low-resolution CT projections, a bar detector with size of 256 was constructed by simulation. The scanning angle is set to full angle, and the interval is 1°, and finally a projected chord diagram of size 256×360 is obtained. Furthermore, to illustrate the robustness and practicality of our method, Gaussian noise is added in this paper, the initial intensity of incident photons is set to 1×10⁵, and the variance is set to 25.

Reference image of the phantom 1 used for the simulation data.
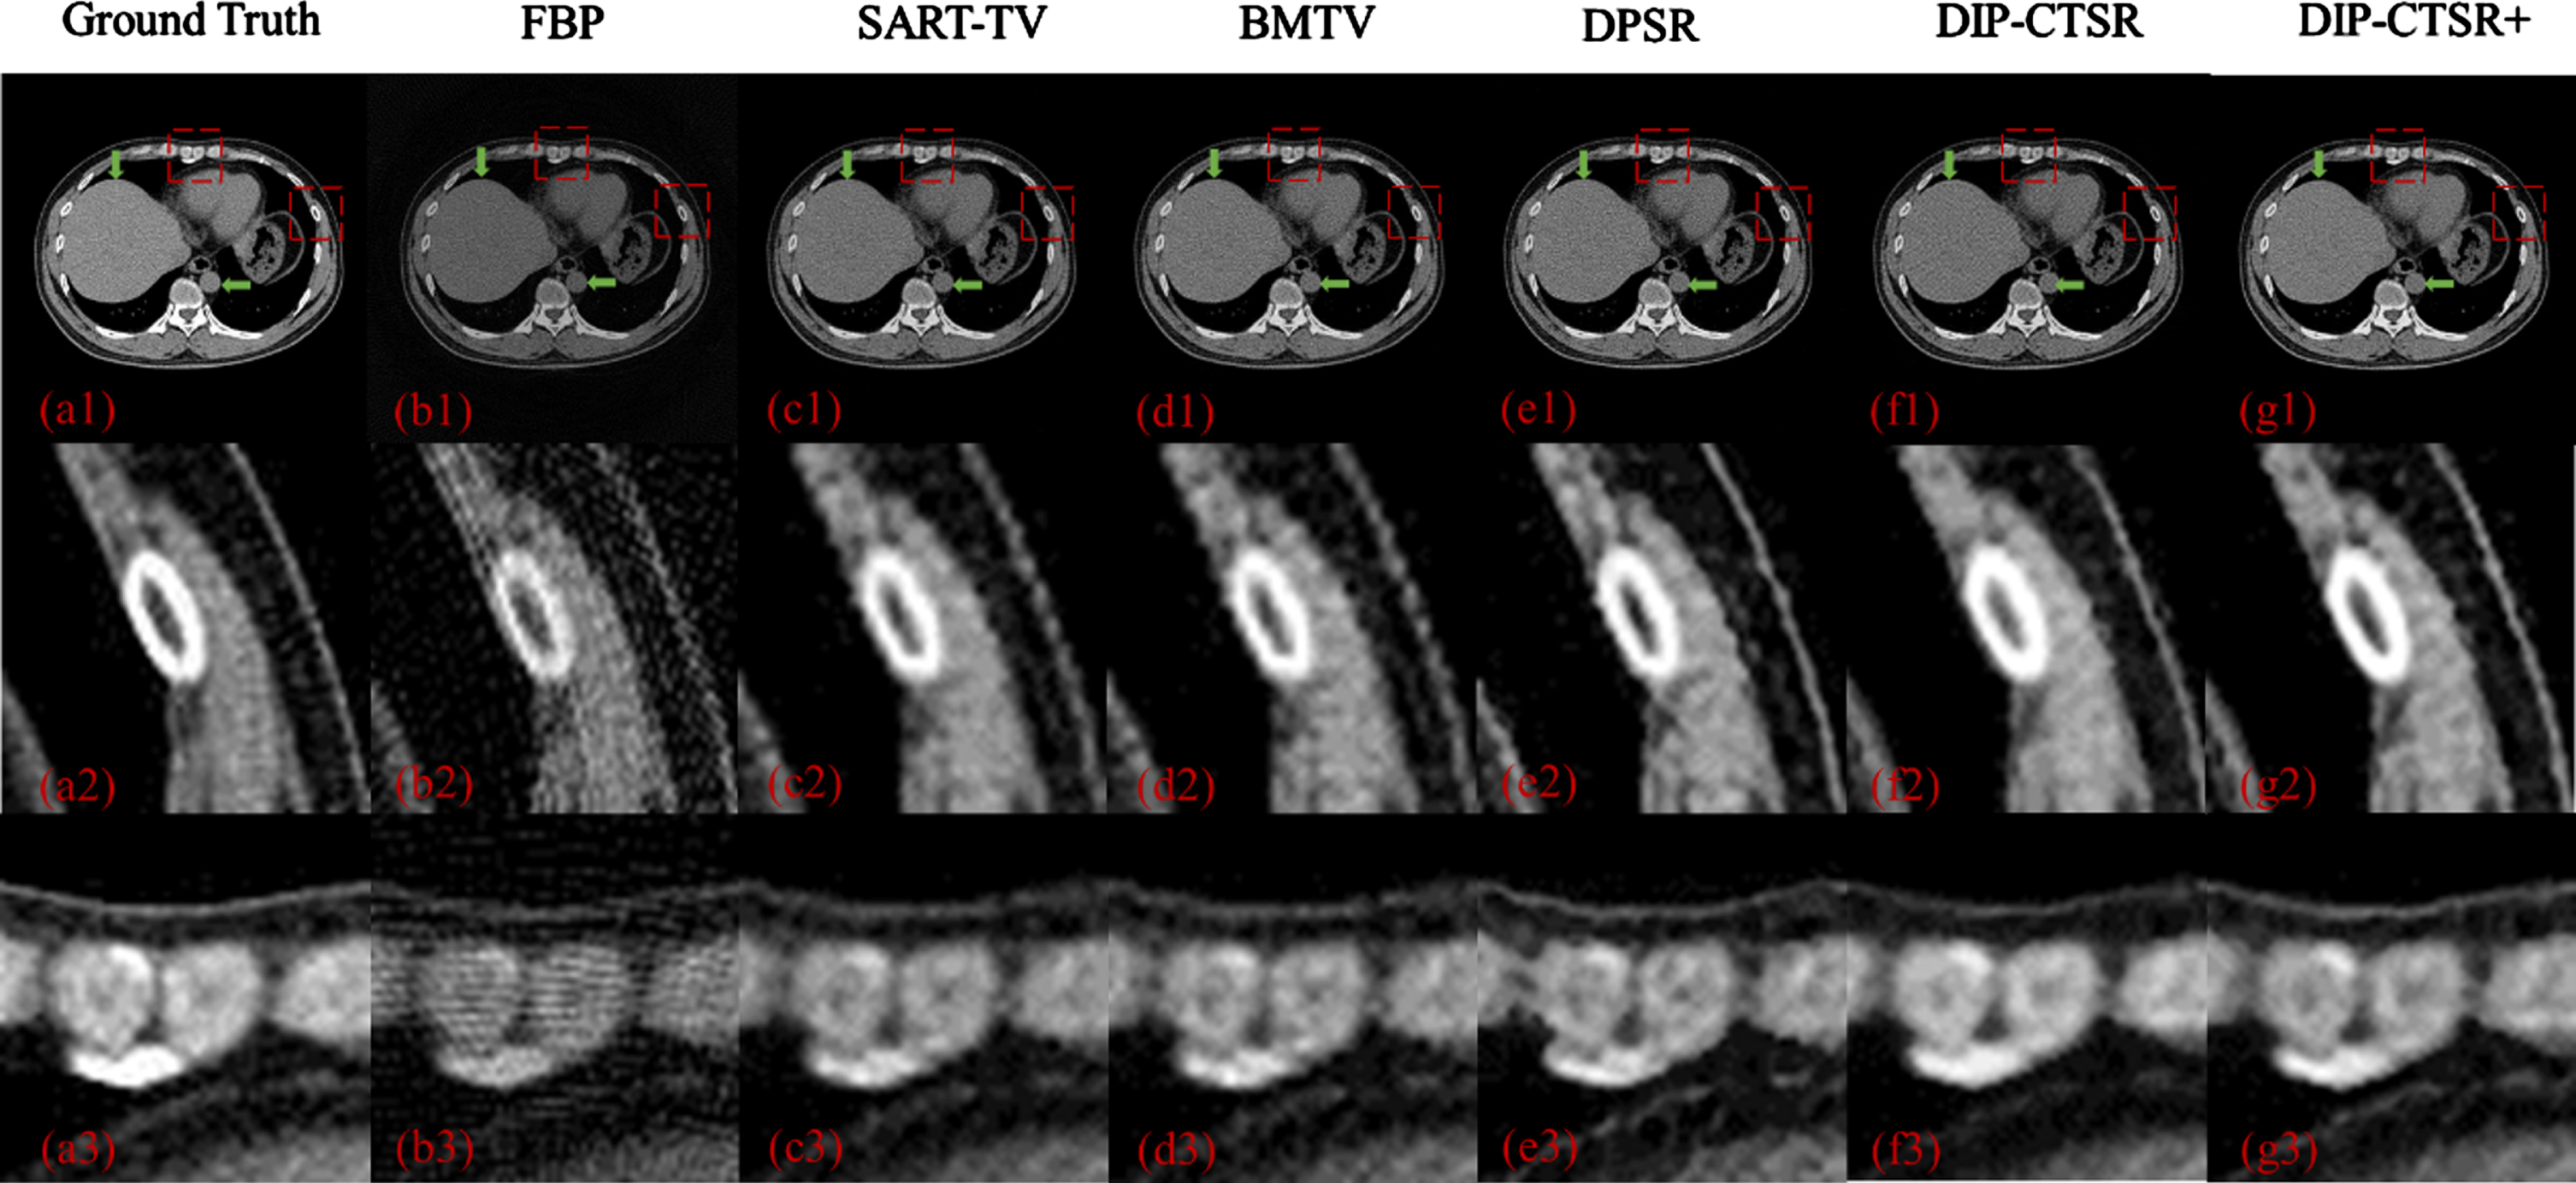
The experimental results are shown in the Fig. 3 below. In Fig. 3, the first row is the reconstruction result, and the second row shows the details of our selected ROI. From left to right in the figure, column (a) represents the original ground-truth image, and columns (b) to (f) are the super-resolution results of different methods, followed by FBP reconstruction algorithm, SART-TV reconstruction algorithm, A joint regularization reconstruction algorithm using block-based matching and TV (BMTV), a deep plug-and-play image super-resolution algorithm (DPSR), the CT super-resolution reconstruction with deep image priors using DIP-CTSR method, and the proposed CT super-resolution reconstruction using DIP-CTSR+ method. As can be seen from Fig. 3, the FBP reconstruction results have obvious ring artifacts. Although the reconstruction results of SART-TV and BMTV have no artifacts, there are obvious noise-like points, and the image details are still not clear enough. Although the DPSR reconstruction results are visually clearer than the SART-TV and BMTV reconstruction results, some details are distorted. Although the DIP-CTSR and DIP-CTSR+ proposed in this paper fails to recover all wire pairs, the detail recovery is significantly better than other algorithms. It can be seen from Table 2 that the CT image generated by DIP-CTSR+ further reduces the noise of the image and improves the SSIM to a certain extent. Compared with the results obtained by DPSR super resolution algorithm, the reconstruction results obtained by this method are 43% higher than PSNR and 7.6% higher than SSIM. MTF curves of each reconstruction result can be observed in Fig. 4. It shows that the value of MFT50 of the reconstruction result of DIP-CTSR and DIP-CTSR+ is higher than that of other comparison algorithms.

CT image reconstruction results and related details of digital phantom 2. (a) Ground truth. (b) FBP (c) SART-TVR (d) BMTV (e) deep plug-and-play image super-resolution (f) Image reconstructed using DIP-CTSR (g) Image reconstructed using DIP-CTSR+. The red dashed rectangle represents the selected noise evaluation ROI. Green arrows point to adjacent boundaries for MTF assessment. The grayscale range of all images in the Figure is [0, 0.12].
Quantitative comparison of reconstructed image results for digital phantom 1

Measured MTF curves of reconstructed CT images for phantom 1.
To verify the effectiveness of the method on CT images, two digital CT images were selected as test body membranes for this simulation experiment. In the second simulation data experiment, two digital chest CT images were used as test phantoms, whose reference images are shown in Fig. 5, marked as (a-1) and (a-2), respectively. Similarly, sinograms were generated by simulating digital CT image slices, and the projected sinograms were twice down-sampled and noise added. The settings of the analog scan parameters are the same as the above-mentioned head digital body membrane. The choice of noise level and reconstruction parameters is consistent with the first digital phantom.

Reference image of the phantom 2 used for the simulation data.
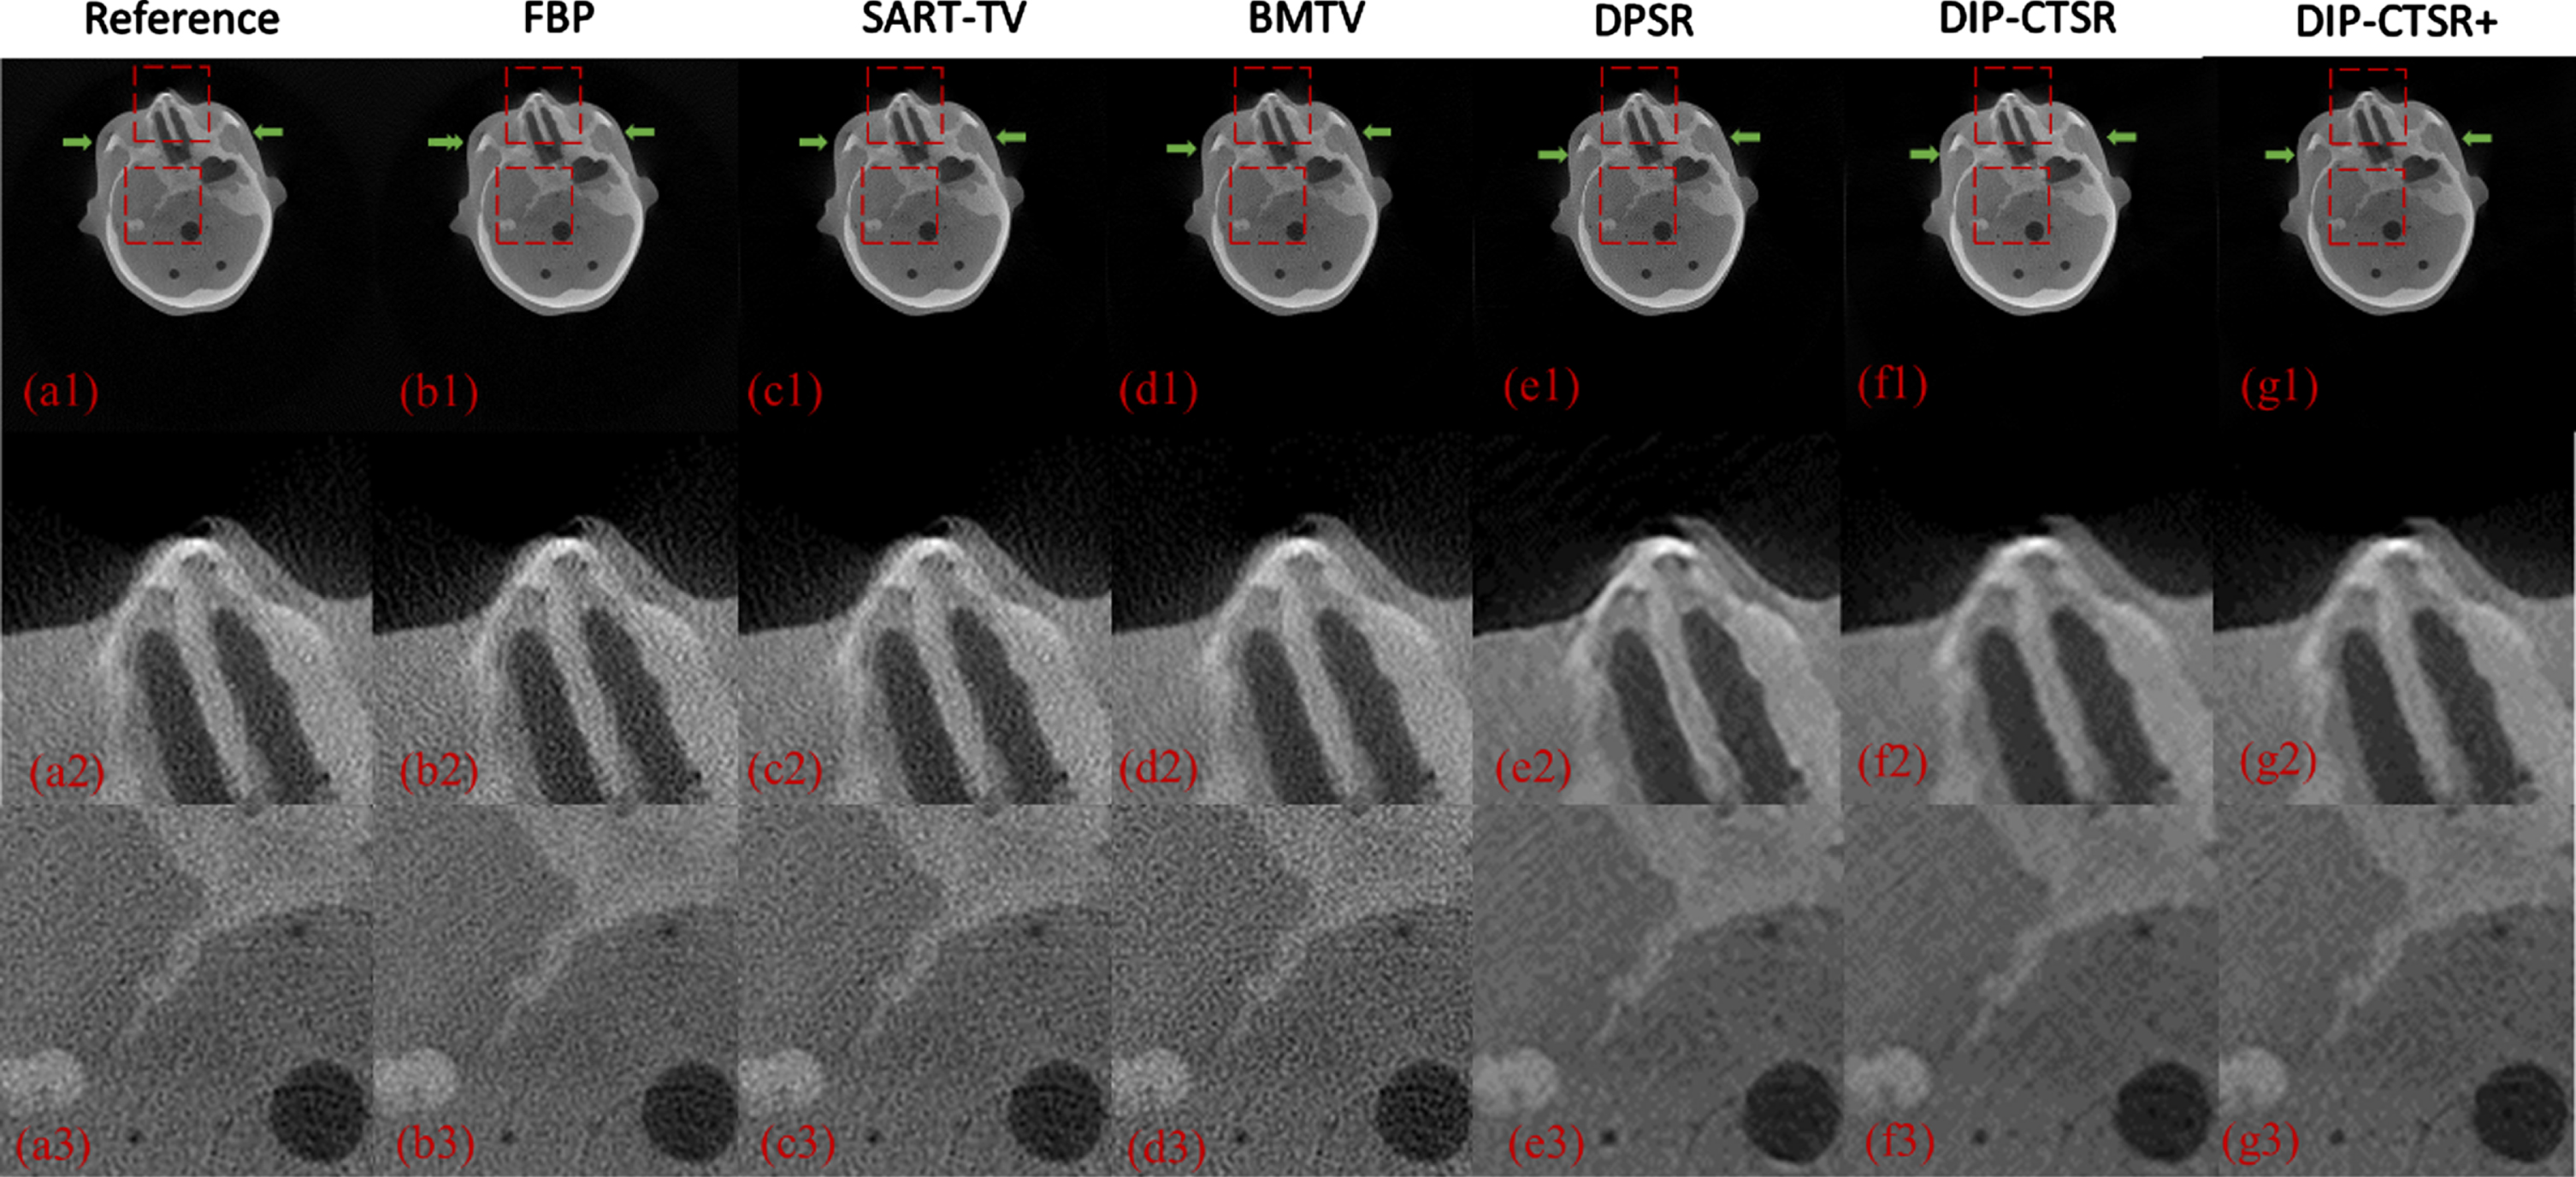
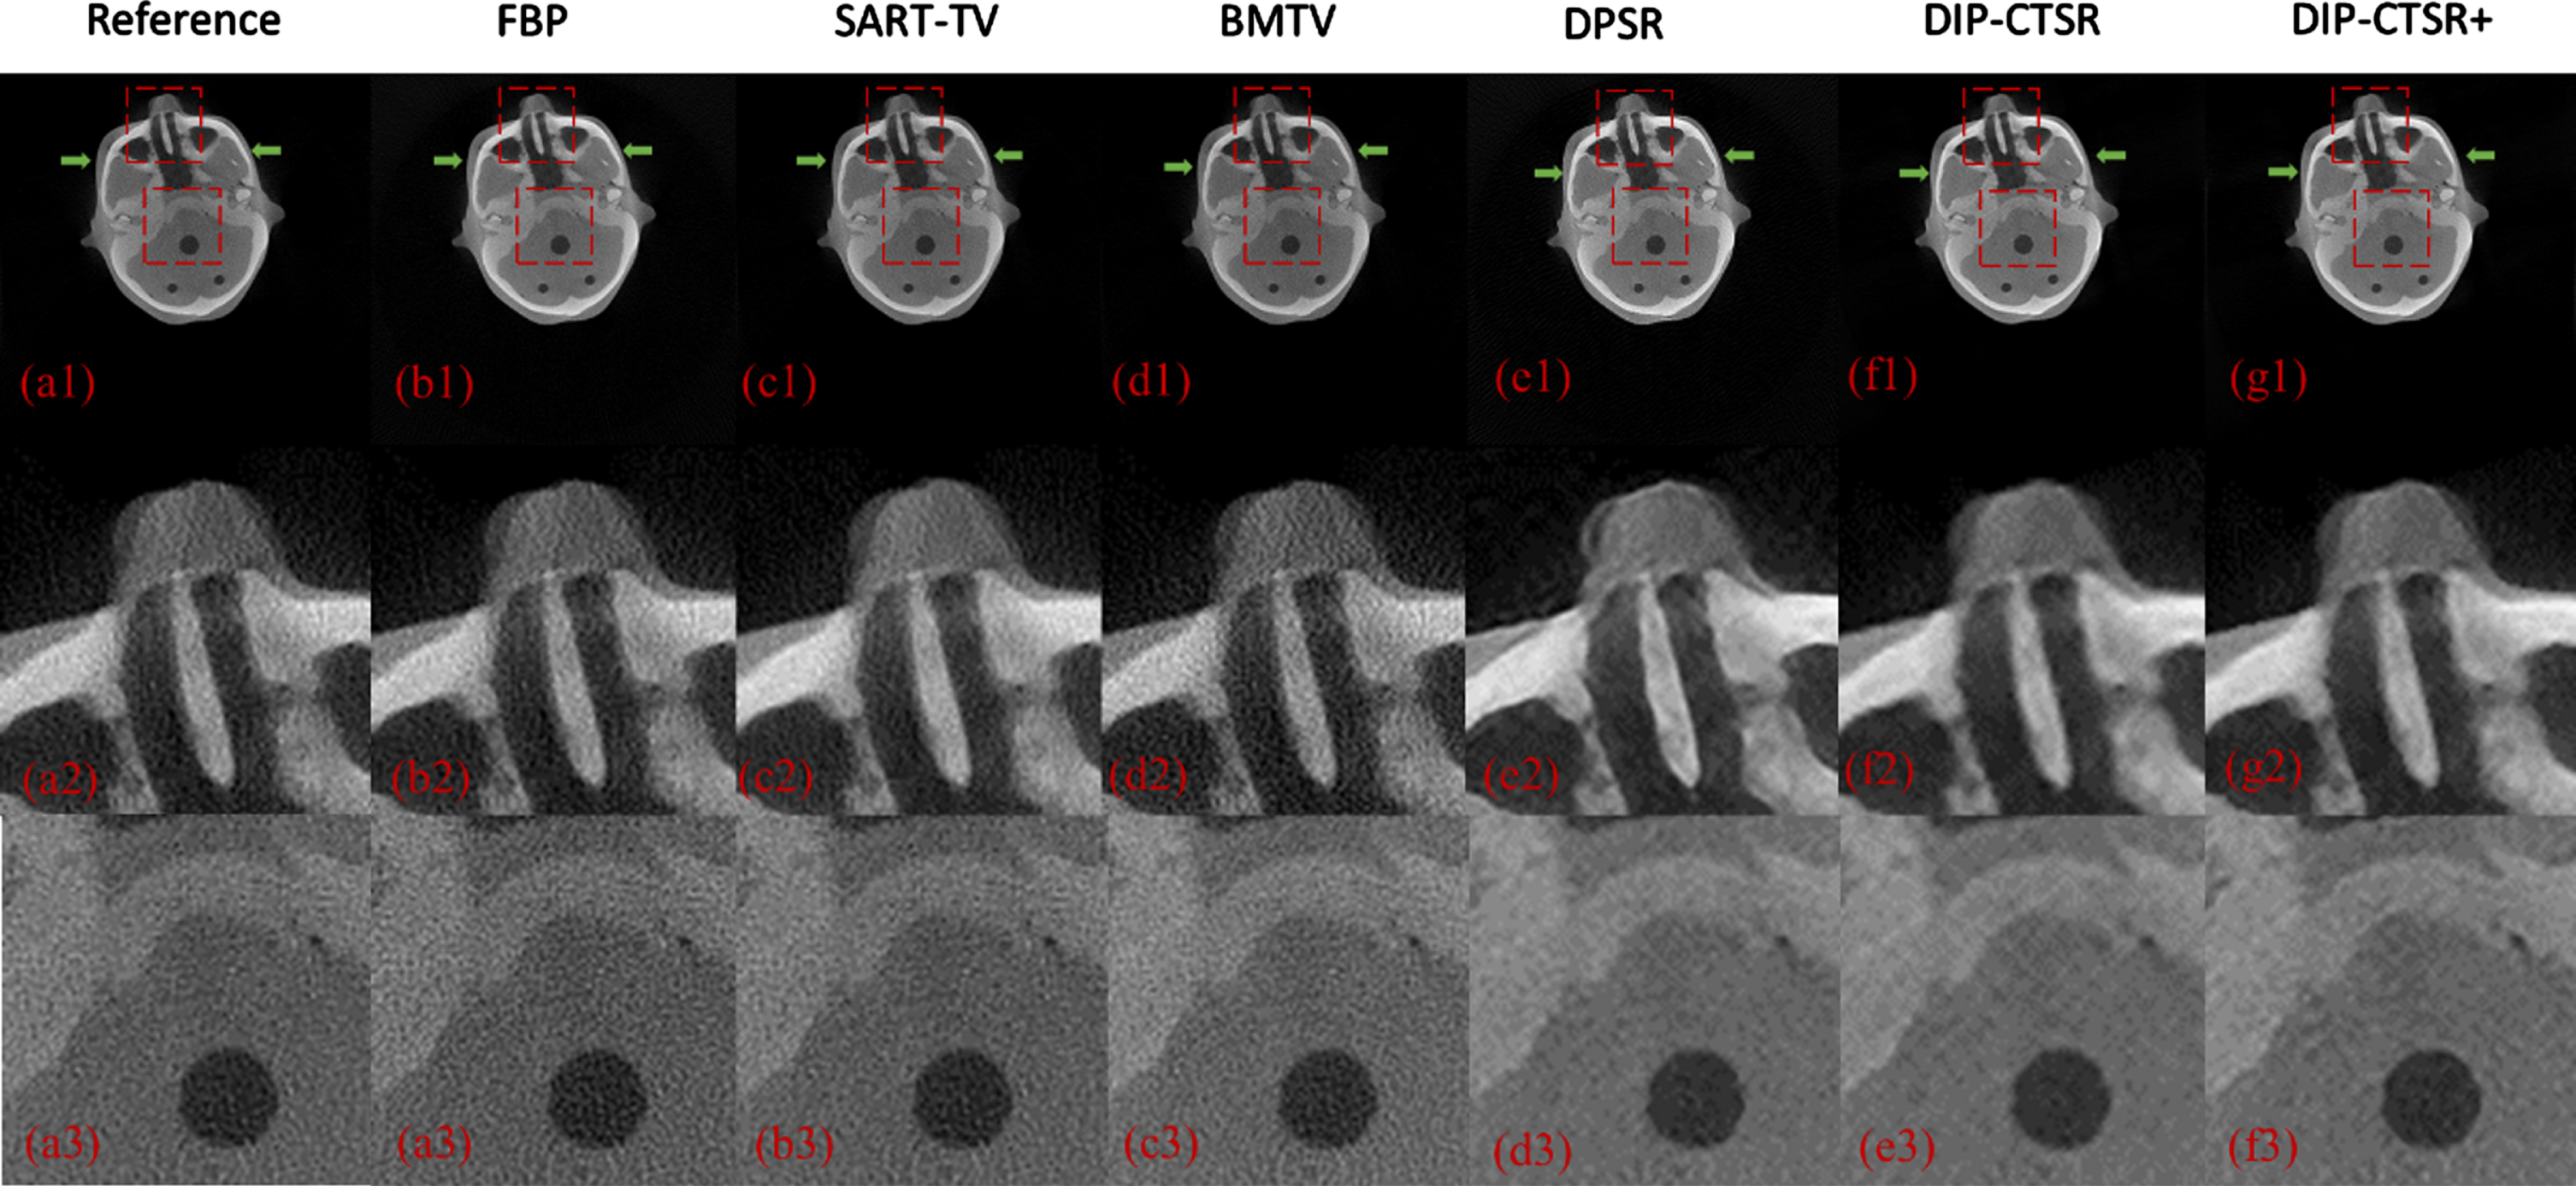
The experimental results are shown in the Figs. 6 7 below. Figures 6 7 are the reconstruction results of slice 1 and slice 2. It can be seen from Figs. 5 6 that the reconstruction results of FBP, SART-TV and BMTV have obvious noise, and the image details are not clear enough. Although the DPSR reconstruction results are visually clearer than the SART-TV and BMTV reconstruction results, some details are distorted. The super-resolution results of DIP-CTSR+ proposed in this paper effectively suppress artifacts and restore image details more clearly, with higher signal-to-noise ratio. In order to quantitatively evaluate the reconstruction accuracy of the DIP-CTSR algorithm, three image evaluation indicators including PSNR, RMSE and SSIM, are used for evaluation. The quantitative results are shown in Tables 3 4 below. Overall, the RMSE of the super-resolution image obtained by the method in this paper is reduced by more than 15% compared with the result obtained by the BMTV algorithm and is reduced by more than 17% compared with the result obtained by the DPSR super-resolution algorithm. The SSIM of the super-resolution image obtained by DIP-CTSR+ also higher than other comparison algorithms. Combining the qualitative and quantitative experimental results, it is found that in the simulation data experiments, the DIP-CTSR+ super-resolution method proposed in this paper has significant advantages and can retain detailed information while suppressing noise.
CT image reconstruction results and related details of slice 1 for digital phantom 1. (a) Ground truth. (b) FBP (c) SART-TVR (d) BMTV (e) deep plug-and-play image super-resolution (f) Image reconstructed using DIP-CTSR (g) Image reconstructed using DIP-CTSR+. The red dashed rectangle represents the selected ROI. Green arrows point to adjacent boundaries for MTF assessment. The grayscale range of all images in the Figure is [0, 0.06].

CT image reconstruction results and related details of slice 2 for digital phantom 1. The content displayed in the row and column is the same as in Fig. 5.
Quantitative comparison of simulated data experiment results for slice 1
Quantitative comparison of simulated data experiment results for slice 2
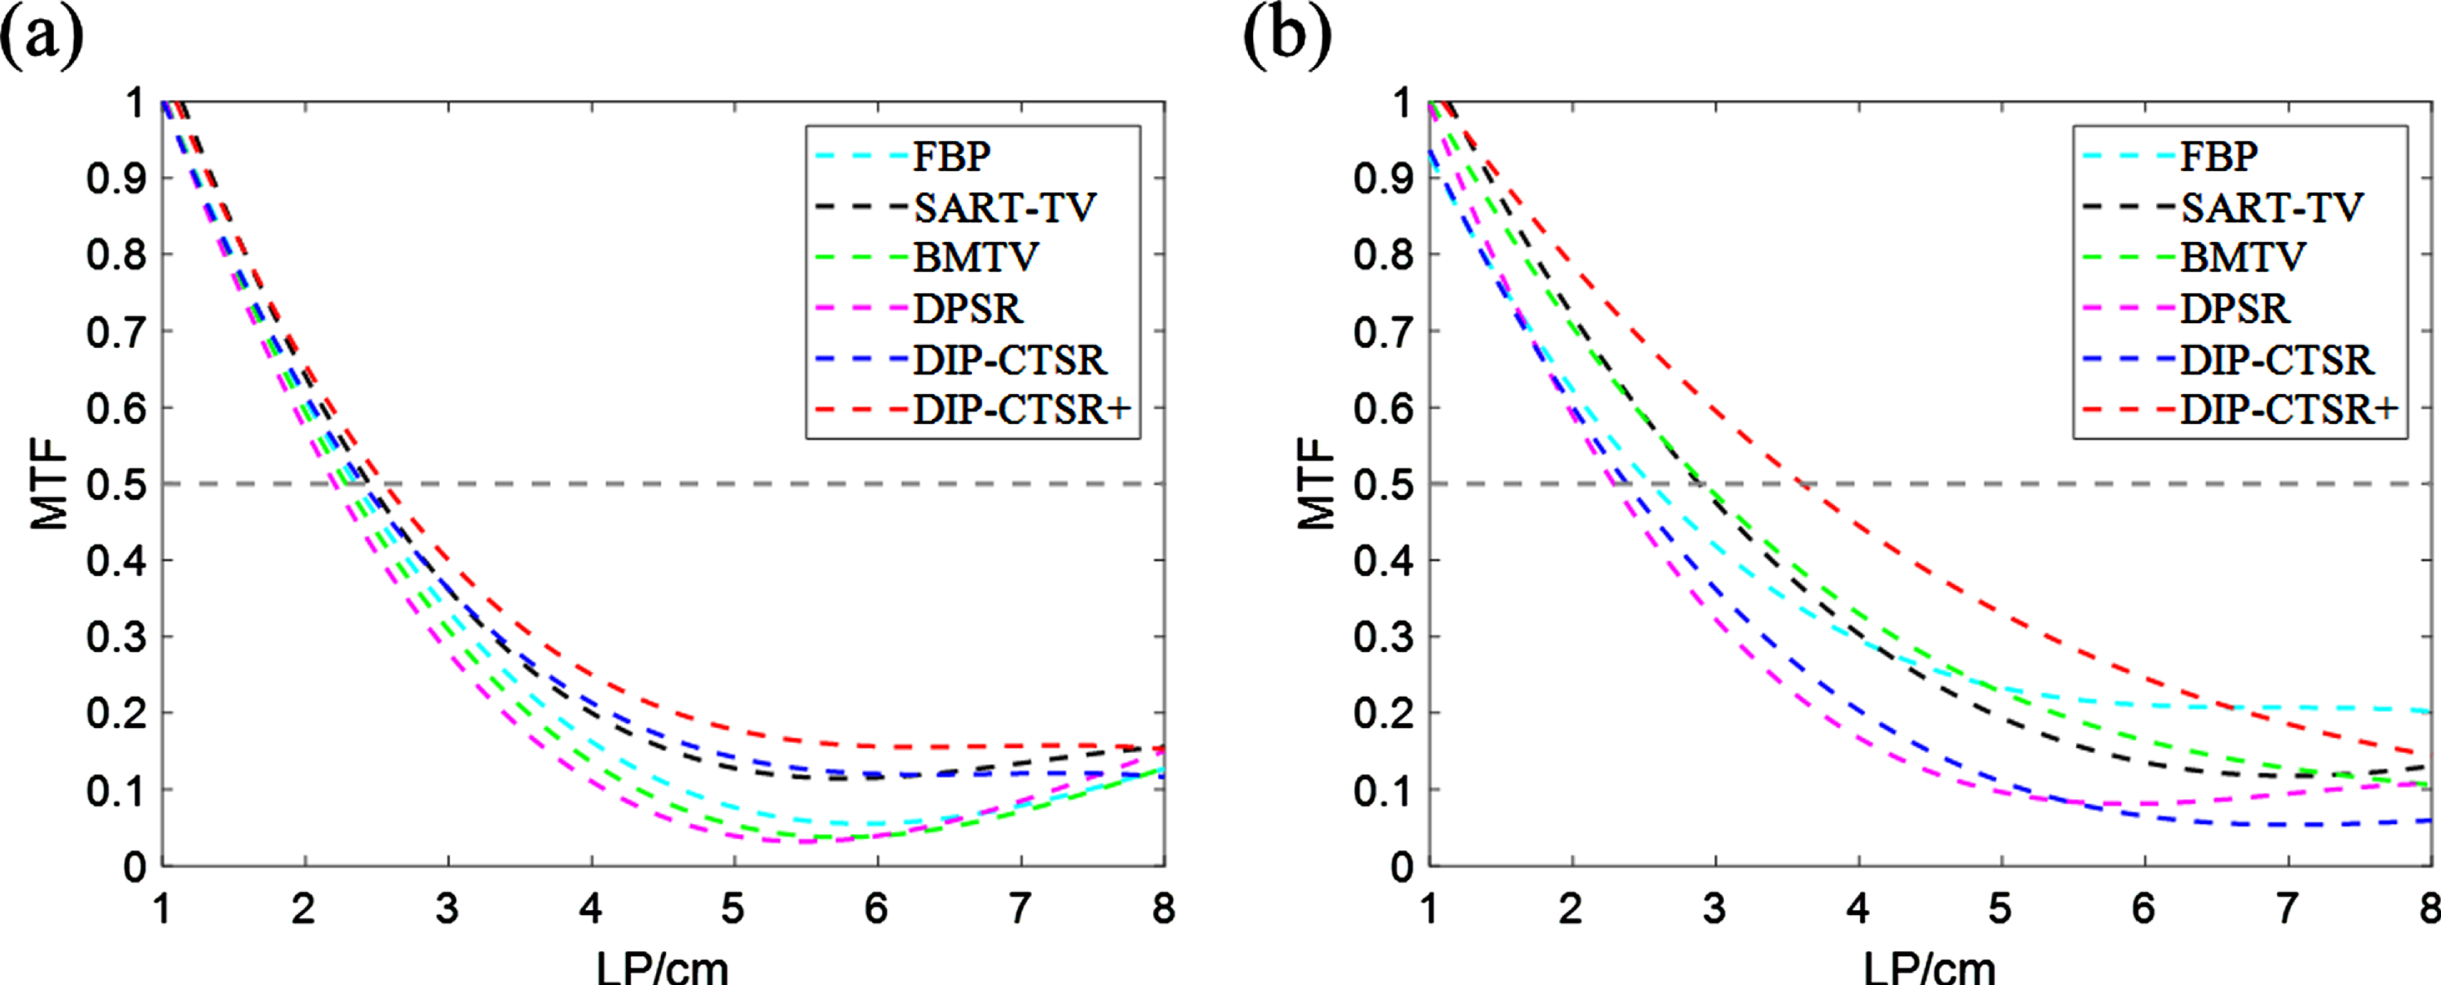
To investigate the spatial resolution of the super-resolution results, we plotted the MTF images. The MTF curve of reconstruction results of abdominal simulation data is shown in Fig. 8. The adjacent boundaries used to evaluate the super-resolution reconstruction results of MTF are indicated by green rectangular arrows in the above reconstruction results. Compared with the BMTV method, as the MTF amplitude is reduced to 50%, the spatial resolution of the CT images reconstructed by DIP-CTSR+ is improved by a factor of 0.21 and 0.02. Compared with the DPSR method, the MTF is increased by a factor of 0.19 and 0.11. Therefore, combining qualitative and quantitative experimental results, it is found that the DIP-CTSR+ super-resolution method proposed in this paper has significant advantages in the simulation data experiments. It can retain details while suppressing noise and generate higher quality CT images.
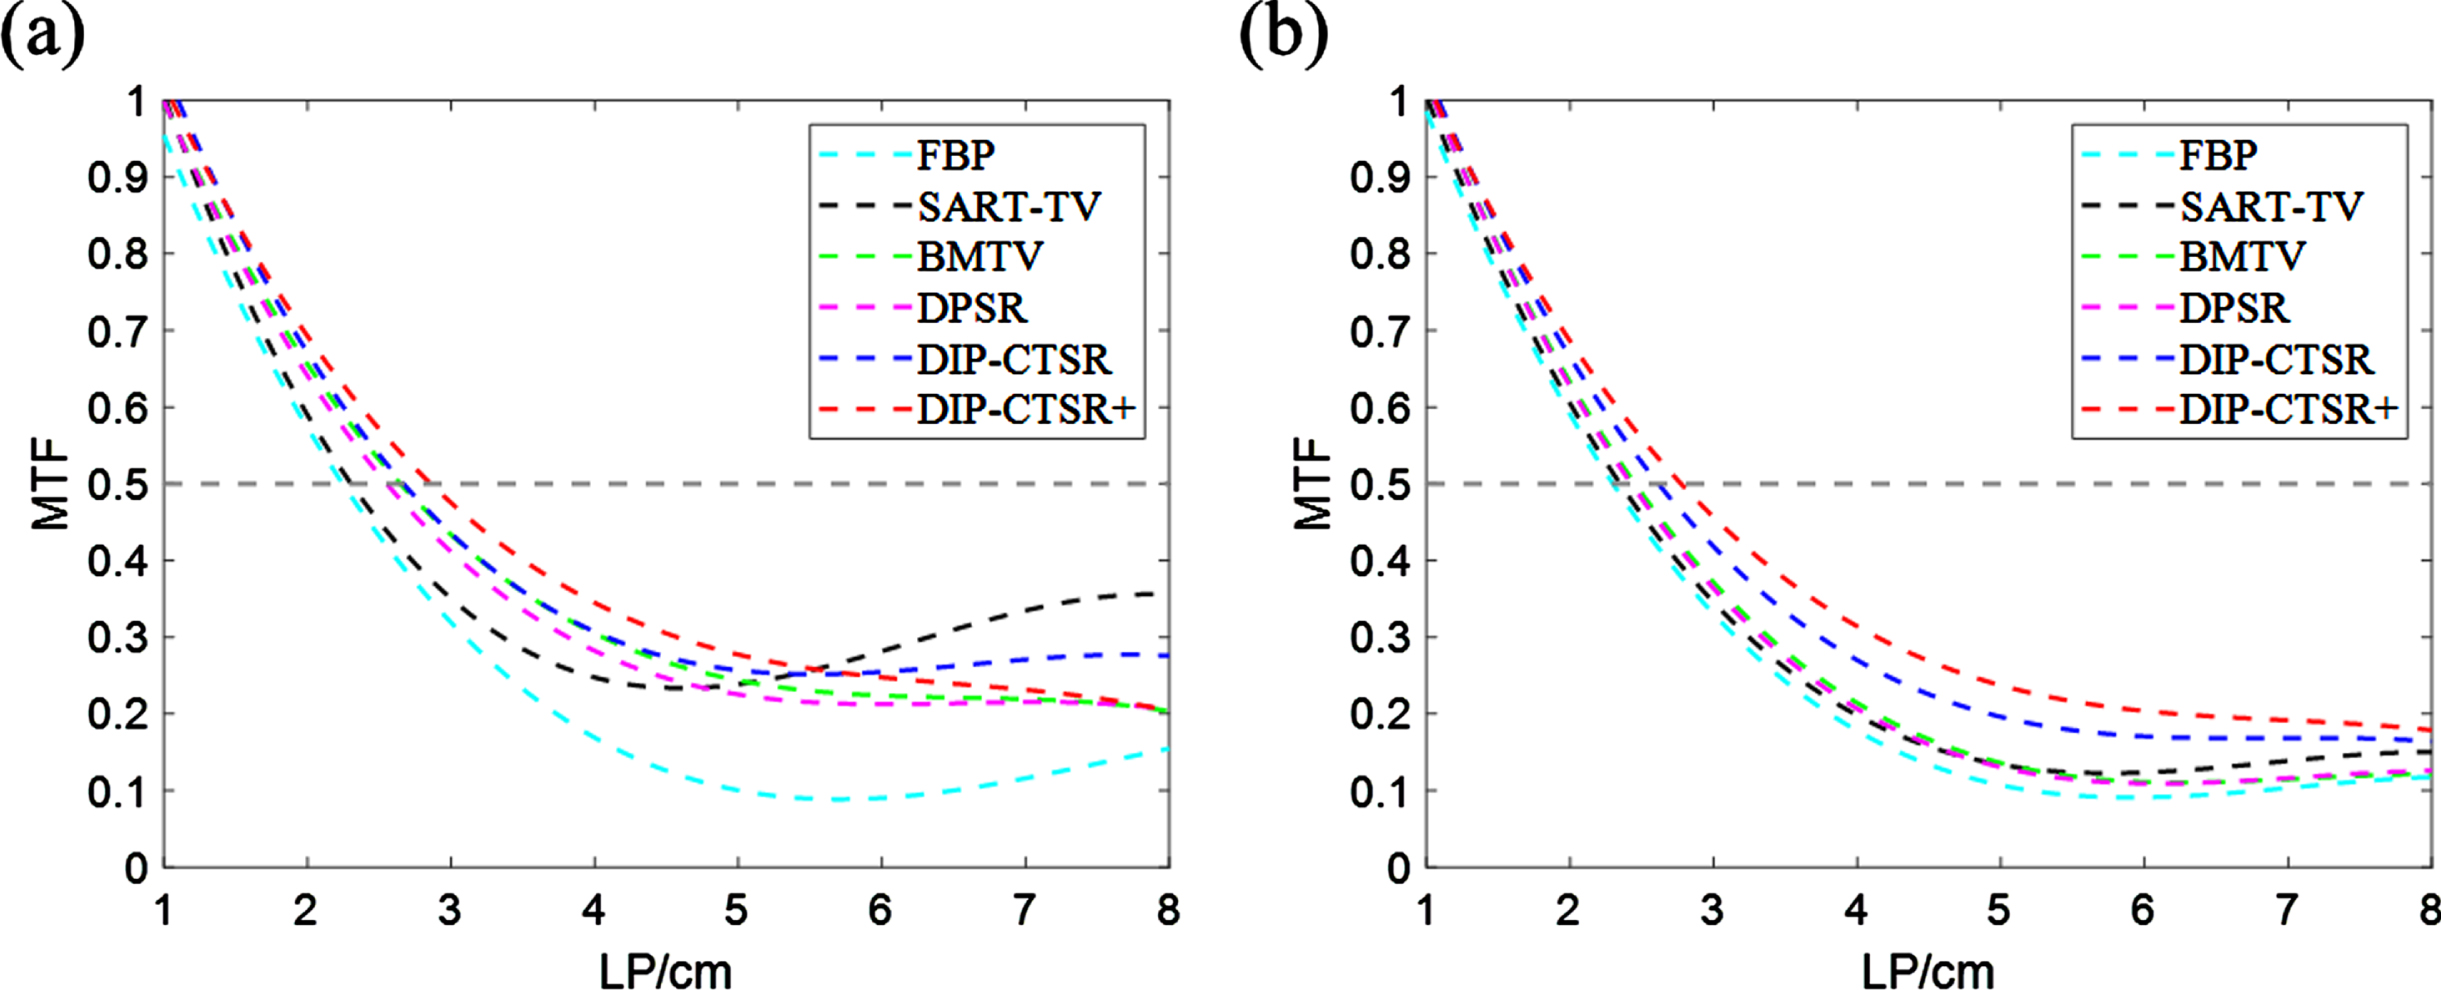
The illustration of (a) MTF curves of the reconstructed results of slice 1 for the simulated data, (b) MTF curves of the reconstructed results of slice 2 for the simulated data.
To verify the SR performance of the proposed network model in an actual CT system, an actual scanning experiment was performed with the Chengdu Dosimetric Phantom (CDP) as the imaging object. The structure of the CDP model is shown in Fig. 9, and its specifications are described in Report No.48 of the International Commission on Radiation Units and Measurements [40]. The phantom is very similar to the human head, and the equivalent error of the attenuation coefficient between its synthetic materials and human tissues and organs does not exceed 5%.

Real data experimental head phantom.
In the CT imaging system for scanning the CDP phantom, the X-ray source is Thales Hawkeye-130 and the flat panel detector is Thales 4343F. In the setting of CDP bulk film scanning parameters, the tube voltage is 120kVp, the tube current is 200μA, the number of projection acquisition frames is 360 frames, the scanning angle is 360°, the distance from the light source to the rotation axis is 529.16 mm, and the distance from the light source to the detector is 998.75 mm, and the reconstructed image size is 512 by 512.
In the real data experiment, the presentation of evaluation results was also based on two representative test slices in the test data set, denoted as Slice 1 and Slice 2 respectively. In order to better display image information, the reconstructed images of two slices are displayed in a 360×360 enlarged field of view in this paper, as shown in (a-1) and (a-2) in Fig. 10. The grayscale range is [0, 0.1]. The image in Fig. 10 is reconstructed from the HR projection chord graph obtained in the 1×1 acquisition mode, which is used as the reference reconstruction image.
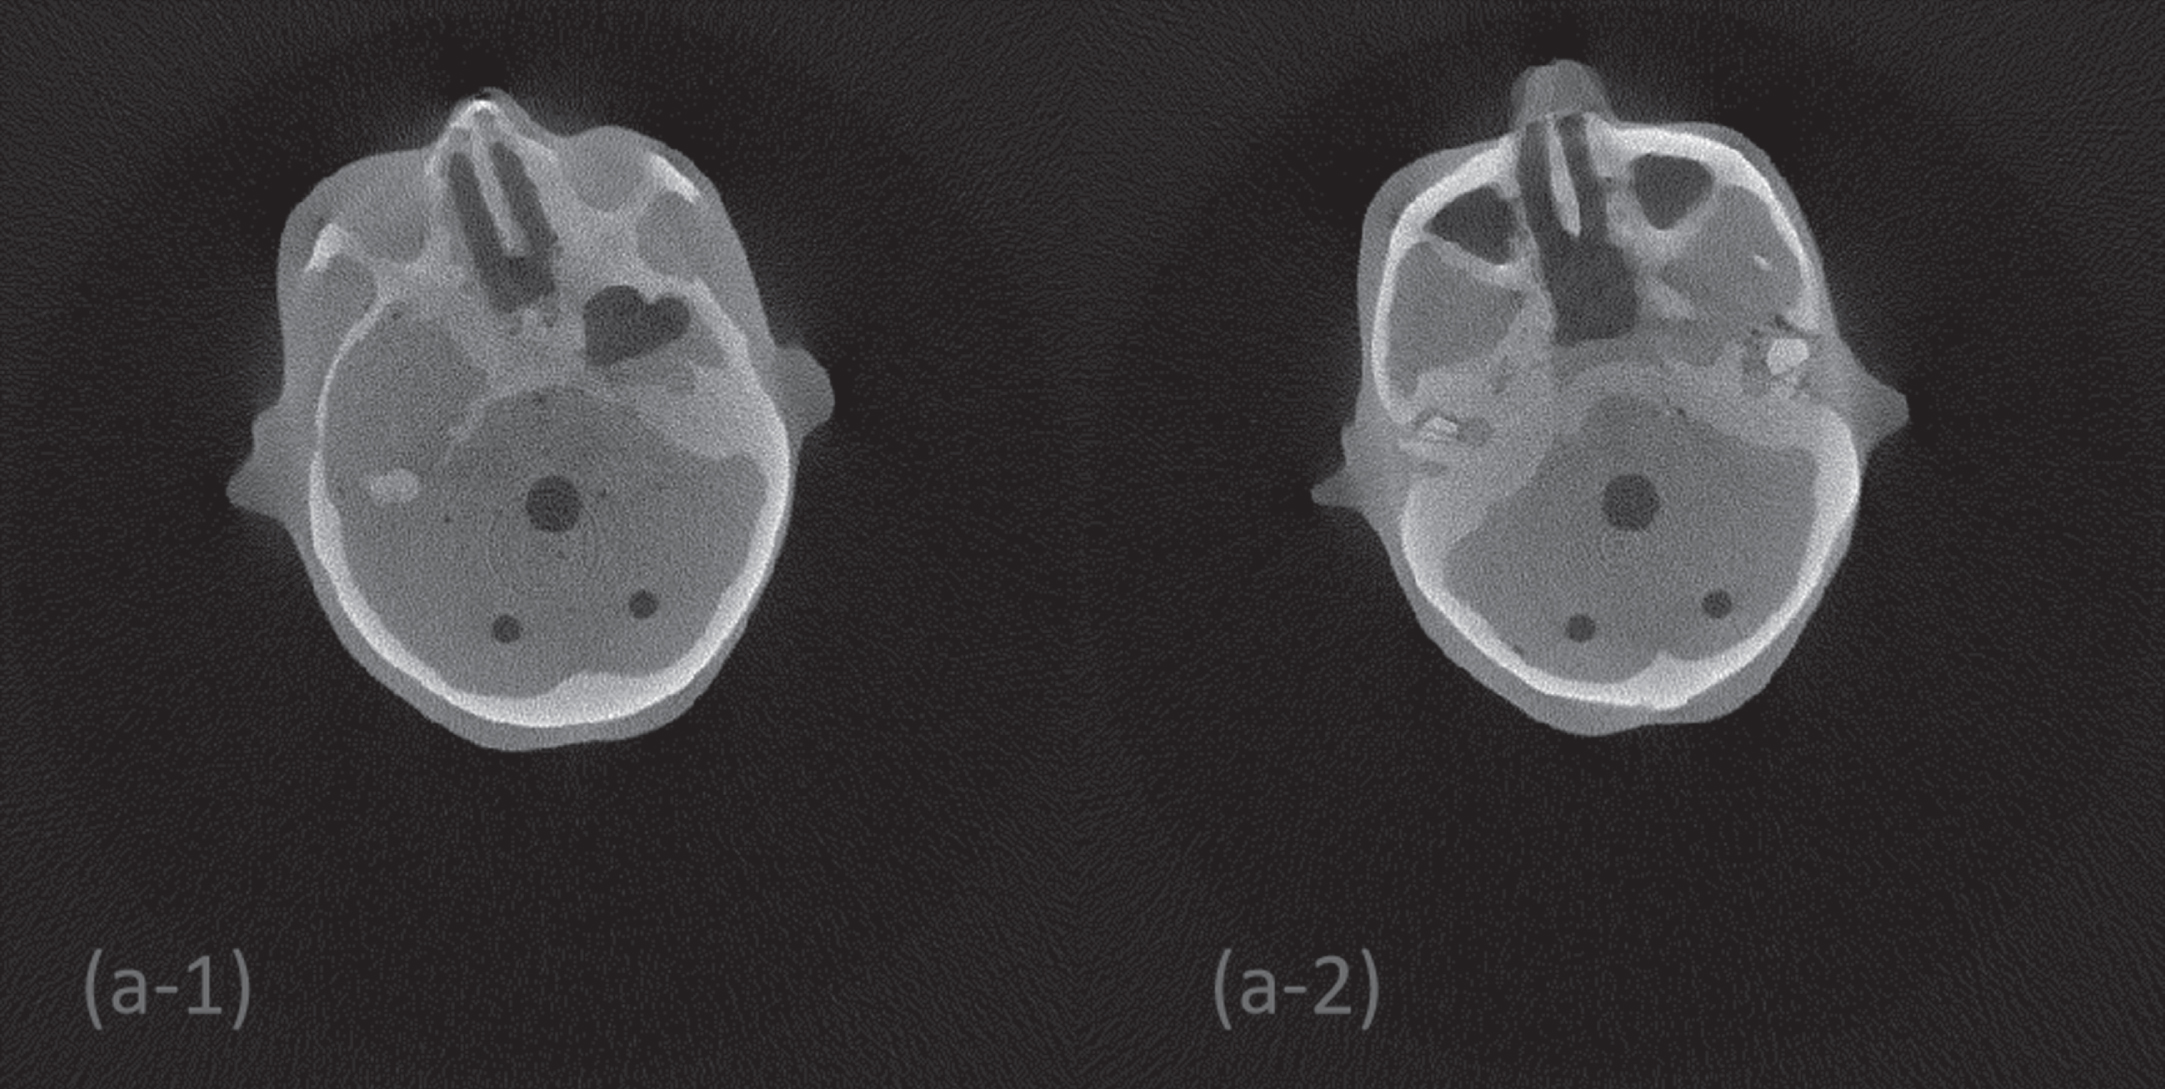
Reference reconstruction images of two representative test slices of CDP.
This section presents the experimental results of the proposed CT super-resolution reconstruction method on real data. Two structurally representative slices were selected for the experiments. Figures 11 12 show the experimental results of the proposed CT super-resolution reconstruction method on real data. It can be observed that the reconstructed result by the FBP algorithm obviously has a lot of noise, and the skull structure in the image is obviously overwhelmed by the noise. Although the SART-TV algorithm and BMTV algorithm can suppress the image noise to a certain extent, the edge part is still not clear enough. The comparison shows that the reconstruction results of the DPSR algorithm and the DIP-CTSR algorithm are obviously clearer, but the reconstruction results of the DPSR algorithm have excessive edge enhancement, which may lose the authenticity of the CT image, and there are some flocculent artifacts in the background of the DPSR reconstruction results. The reconstruction results of DIP-CTSR+ using the improved network are better in detail recovery, and the algorithm generates high-quality images that are closer to human visual perception. From the perspective of MTF images, the error of the reconstructed image by the HL-BMTV algorithm is also the smallest. Therefore, the visual evaluation of the actual data experiments again verifies the effectiveness of the proposed algorithm in practical applications.
CT image reconstruction results and related details of slice 1. (a) Reference image (b) FBP (c) SART-TV (d) BMTV (e) deep plug-and-play image super-resolution (f) Image reconstructed using DIP-CTSR (g) Image reconstructed using DIP-CTSR+. The red dashed rectangle represents the selected ROI. Green arrows point to adjacent boundaries for MTF assessment. The grayscale range is [0, 0.1].
CT image reconstruction results and related details of slice 2. The content displayed in the row and column is the same as in Fig. 11.
The quantitative results of experimental reconstruction of actual data are shown in Tables 5 6 below. The PSNR and SSIM of the super-resolution image obtained by the DIP-CTSR+ algorithm are higher than those of other comparison algorithms, and the signal-to-noise of the reconstructed image of the DIP-CTSR+ algorithm is improved by 5.1% compared with other algorithms. As can be seen from Fig. 13, compared with other comparison algorithms, the proposed method increases the MTF50 value of the reconnection result when the MTF amplitude is reduced to 50%. Compared with DPSR method, the MTF total factor is increased by 0.21 factors. Compared with BMTV algorithm, the MTF total factor is increased by 0.32 factors. Therefore, combined with the results shown and the MTF diagram, it shows that the DIP-CTSR+ super resolution method proposed in this paper has certain advantages in the CT super resolution experiment of real projected data. It preserves detail while suppressing noise and improving image resolution. By combining the qualitative and quantitative experimental results, it is found that the DIP-CTSR+ super-resolution method proposed in this paper has certain advantages in the real data experiment.
Quantitative comparison of real data experiment results for slice 1
Quantitative comparison of real data experiment results for slice 2
The illustration of (a) MTF curves of the reconstructed results of slice 1 for the real data, (b) MTF curves of the reconstructed results of slice 2 for the real data experiment.
In this paper, the advantages of DIP-CTSR in CT super-resolution reconstruction are verified by simulation and actual data experiments. Compared with other model-based super-resolution methods without deep learning priors, namely the reconstruction results of BMTV and ART-TV, the details of the reconstruction results of this method are more real and clear, because the prior terms of TV regularization and L0 regularization rely on mathematical expressions to express some features of the image. However, there are still some deep image features that cannot be expressed mathematically. Deep learning priors can learn depth features of images by training data sets.
Compared with the reconstruction results of DPSR method, the texture details of the CT images reconstructed by DIP-VDSR+ are more realistic, which can be proved by the experimental results of simulated data and actual data. The spatial resolution of reconstructed images can also be improved to some extent. The reconstructed detail display and MTF curve verify that this method can improve the CT image resolution of actual CT data to a certain extent. The experimental results prove that the proposed method is flexible, effective and extensive for the super-resolution of CT images.
Conclusion
This paper proposes a method combining deep learning and iterative model optimization. This method is based on the traditional sparse L0 regularization terms, combined with the plug-and-play framework, and introduces the deep learning priors to further dig the prior information and depth features of CT images through deep learning. Simulation and real data experiments prove that the texture details of the DIP-VDSR+ reconstructed CT images are more realistic, which verifies the advantages of the combination of deep learning prior and super-resolution optimization reconstruction model. This method is flexible, effective and extensive for LRCT image super-resolution.
Footnotes
Acknowledgments
This work was supported by the National Key Research and Development Project of China (Grant No. 2020YFC1522002). This work was also supported by the National Natural Science Foundation of China (Grant No. 62101596) and the China Postdoctoral Science Foundation (Grant No. 2019M663996).