
Abstract
BACKGROUND:
Low-dose CT (LDCT) images usually contain serious noise and artifacts, which weaken the readability of the image.
OBJECTIVE:
To solve this problem, we propose a compound feature attention network with edge enhancement for LDCT denoising (CFAN-Net), which consists of an edge-enhanced module and a proposed compound feature attention block (CFAB).
METHODS:
The edge enhancement module extracts edge details with the trainable Sobel convolution. CFAB consists of an interactive feature learning module (IFLM), a multi-scale feature fusion module (MFFM), and a joint attention module (JAB), which removes noise from LDCT images in a coarse-to-fine manner. First, in IFLM, the noise is initially removed by cross-latitude interactive judgment learning. Second, in MFFM, multi-scale and pixel attention are integrated to explore fine noise removal. Finally, in JAB, we focus on key information, extract useful features, and improve the efficiency of network learning. To construct a high-quality image, we repeat the above operation by cascading CFAB.
RESULTS:
By applying CFAN-Net to process the 2016 NIH AAPM-Mayo LDCT challenge test dataset, experiments show that the peak signal-to-noise ratio value is 33.9692 and the structural similarity value is 0.9198.
CONCLUSIONS:
Compared with several existing LDCT denoising algorithms, CFAN-Net effectively preserves the texture of CT images while removing noise and artifacts.
Introduction
Computed tomography (CT) is a widely used screening and diagnostic tool. It enables clinical medicine to obtain high-resolution, volume images of internal structures in a non-invasive manner and plays a very important role in modern medical diagnosis. However, ionizing radiation during CT imaging has potential health risks to the human body [1, 2]. To reduce the risk, we can achieve lower radiation dose CT imaging by reducing the tube current or shortening the exposure time of the X-ray tube, but the low-dose CT (LDCT) image after imaging will produce serious noise and artifacts, affecting the doctor’s diagnosis.
To solve this problem, many scholars have studied many algorithms to improve the quality of LDCT images. Among them, the classical image post-processing algorithms include the non-local mean algorithm [3–5], block-matching algorithm [6–8] and dictionary learning [9, 10]. Although these algorithms play a certain role in image quality, the denoised image is excessively smooth and may lose key local details. In recent years, with the development of deep learning in computer vision, various deep learning methods have been proposed for LDCT image denoising [11–14], and remarkable results have been achieved. In addition, some methods can simultaneously denoise and deblur [15–17]. At present, the deep neural network has been widely applied to the field of LDCT image denoising and has become the mainstream method with better performance than traditional methods. For CT denoising, convolutional neural networks (CNN) show competitive performance [18–21]. Wang et al. [22] proposed the first low-dose CT denoising framework based on convolution, and then proposed various deep-learning methods [13, 23]. Chen et al. [24] proposed a residual encoder-decoder convolutional neural network (RED-CNN) to suppress noise and artifacts. The directional component of artifacts is extracted by directional wavelet transform. Kang et al. [25] built a residual network in the wavelet domain (WavResNet) based on wavelet transform to completely restore texture. Due to the irregular distribution of noise and artifacts in LDCT images, the wavelet-based network will have blurred image edges and details after denoising. Yang et al. [26] used Wasserstein distance (WGAN) and perceptual loss [27] to improve the quality of denoised images. Due to the excellent performance of WGAN in generating real CT images and the role of perceptual loss in structural fidelity, the model alleviates the excessive smoothing in denoised images. Kulathilake et al. [28] proposed a generative adversarial network (InNetGAN) with initial network modules, which reduces LDCT image noise while preserving its texture and fine structure. However, the unsatisfactory noise description capability and unstable training process still surround the GAN framework [29]. Fan et al. [30] constructed an LDCT image denoising autoencoder based on secondary neurons, which provides a better fitting ability, higher robustness, and efficiency than primary convolution. This is the first autoencoder based on new neurons. Inspired by the successes of the transformer in the image domain, some studies [31, 32] applied the transformer model to the field of video recognition and achieve superior performance. Wang et al. [33] used Transformer for LDCT image denoising for the first time based on the encoder-decoder structure, which effectively eliminated noise and artifacts, but the parameters were too large and the training time was long. Geng et al. [34] proposed a content-noise complementary learning (CNCL) strategy for medical image denoising based on the GAN network, which can effectively remove noise and artifacts and has good generalization ability, but its training time is too long.
Although there are many models and algorithms, the task of low-dose CT image denoising has not been completely solved. The existing models also face some problems, such as the results being too smooth, and losing edge and detailed information. The features extracted by the convolution kernel are limited to small local areas. Even if the neural network can obtain a larger receptive field by stacking the convolution layer of small kernels, the number of irrelevant pixels introduced into the image will increase, resulting in a loss of computational and statistical efficiency. This defect makes the edge information of the image lost, resulting in image quality reduction. Therefore, it is necessary to add the design of edge enhancement to the network. Gou et al. [35] proposed a new gradient regularization method to enhance LDCT images, and achieved good visual and quantitative results in experiments. Yi et al. [36] proposed a definition-aware low-dose CT denoising method based on conditional generative adversarial networks. Experiments on simulated data sets and real data sets show that the results of this method have a small resolution loss. Gholizadeh et al. [37] proposed a low-dose CT denoising method based on perceptual loss and edge detection layer. This method introduces an untrainable edge detection layer to extract edges from horizontal, vertical, and diagonal directions. Liang et al. [38] used the trainable Sobel convolution layer to extract edge details and proposed an EDCNN network based on edge enhancement and dense connection, which significantly improved the quality of the processed image.
Inspired by EDCNN [38], to better preserve the fine structure and details of the image after noise reduction, we propose a compound feature attention network with edge enhancement for LDCT denoising (CFAN-Net). The network applies the residual structure and cascade mode and can effectively realize the denoising of LDCT images by the way of post-processing. The experimental results show that compared with several other noise reduction methods, this method can achieve better output results. The main contributions of this paper are as follows: We propose an interactive feature learning module (IFLM), which uses the long-distance feature correlation in the channel and spatial dimensions to perform cross-latitude interactive judgment learning. It preliminarily removes a large amount of noise and can improve the representation ability of the model. We propose a multi-scale feature fusion module (MFFM), which embeds the proposed residual pixel attention block (RPAB) and explores different levels of image features in a multi-scale manner. It removes fine noise and preserves detailed texture information. We propose an improved joint attention module (JAB), which forces the network to focus on key information, extract useful image features, and improve learning efficiency. Comparative experiments and ablation experiments show that our proposed CFAN-Net is superior to several advanced LDCT denoising methods in terms of accuracy and visual effects, and each improved module has a positive contribution.
The structure of this paper is as follows: Section II describes the related work. Section III introduces the design of CFAN-Net in detail and explains the contribution of each module to this paper. In Section IV, we present the experimental configuration and the corresponding experimental analysis and results. Finally, Section V is the summary of this paper and the direction of future work.
Related work
Noise reduction model
The denoising method proposed in this paper belongs to the image post-processing method in low-dose CT image denoising. Therefore, this experiment only involves CT image denoising in the image domain. Given a standard dose CT (NDCT) image I
ND
∈ Rw×h, the corresponding LDCT image I
LD
∈ Rw×h can be expressed as:
The basic idea of the edge detection operator is generally to represent the brightness change of the image by calculating the differential of the local area of the image, to detect the edge of the image. Edge detection is essentially a filtering algorithm, the difference is the choice of filter. The Sobel operator for extracting the image edge is calculated by the first derivative operator. It contains two 3×3 detection templates. One template is to extract the edge in the horizontal direction of the image, which has a great effect on the edge in the horizontal direction. The other is to extract the edge in the vertical direction of the image, which has a great effect on the edge in the vertical direction. The detection template is shown in Fig. 1.
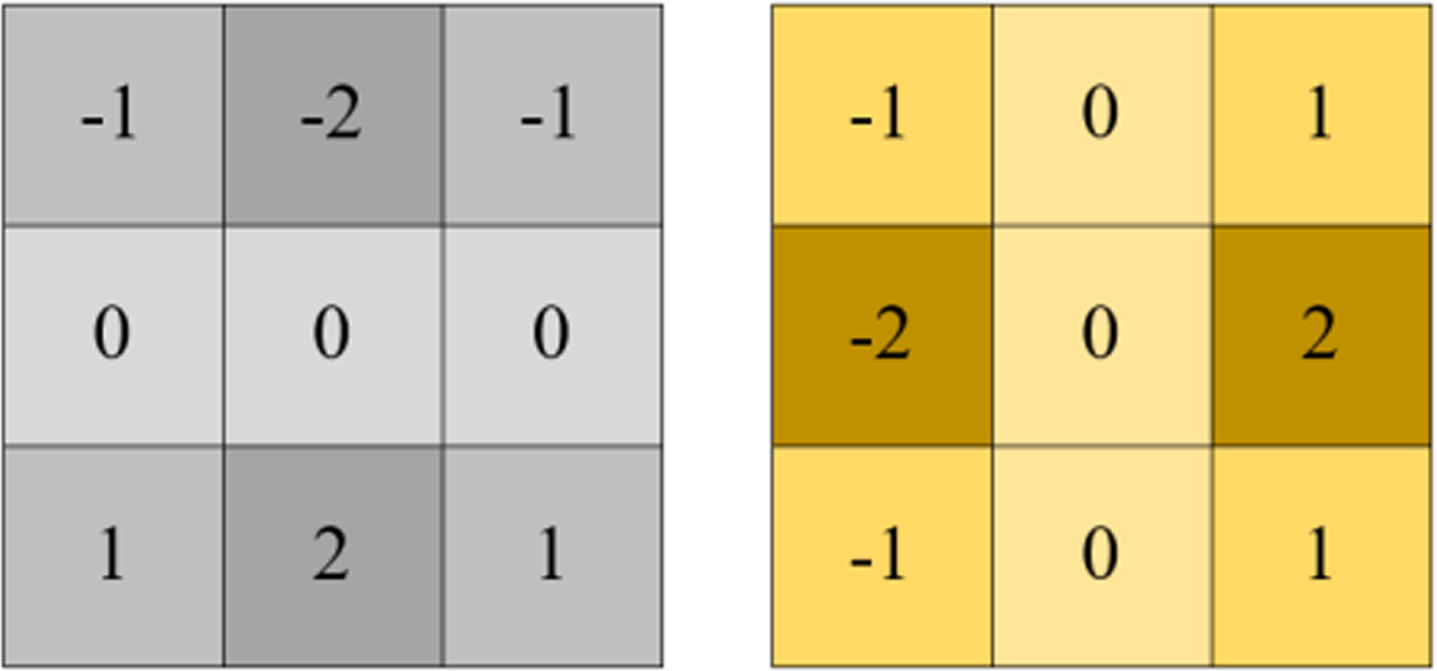
Sobel operator template.
To extract richer image edge feature information, the trainable Sobel operator is designed in EDCNN [38], as shown in Fig. 2. Unlike traditional convolutions, the kernel of the Sobel convolution is predefined by four types of operators: vertical, horizontal, and diagonal. It should be noted that the Sobel operator will be adjusted by multiplying a learnable parameter “

Trainable Sobel convolution.
Channel attention block (CAB) [39] aims to exploit the inter-channel dependence of the convolutional features, as shown in Fig. 3(a). It first performs a squeeze operation to encode the spatial global context, which is then followed by an excitation operation to fully capture channel-wise relationships. The squeeze operation is realized by applying global average pooling (GAP) on feature maps M, thus yielding a descriptor s ∈ R1×1×C. The excitation operator is generated using two convolution layers to recalibrate the descriptor s and then generate the channel attention map S ∈ R1×1×C by sigmoid. Finally, the channel attention feature is obtained by multiplying S and M.
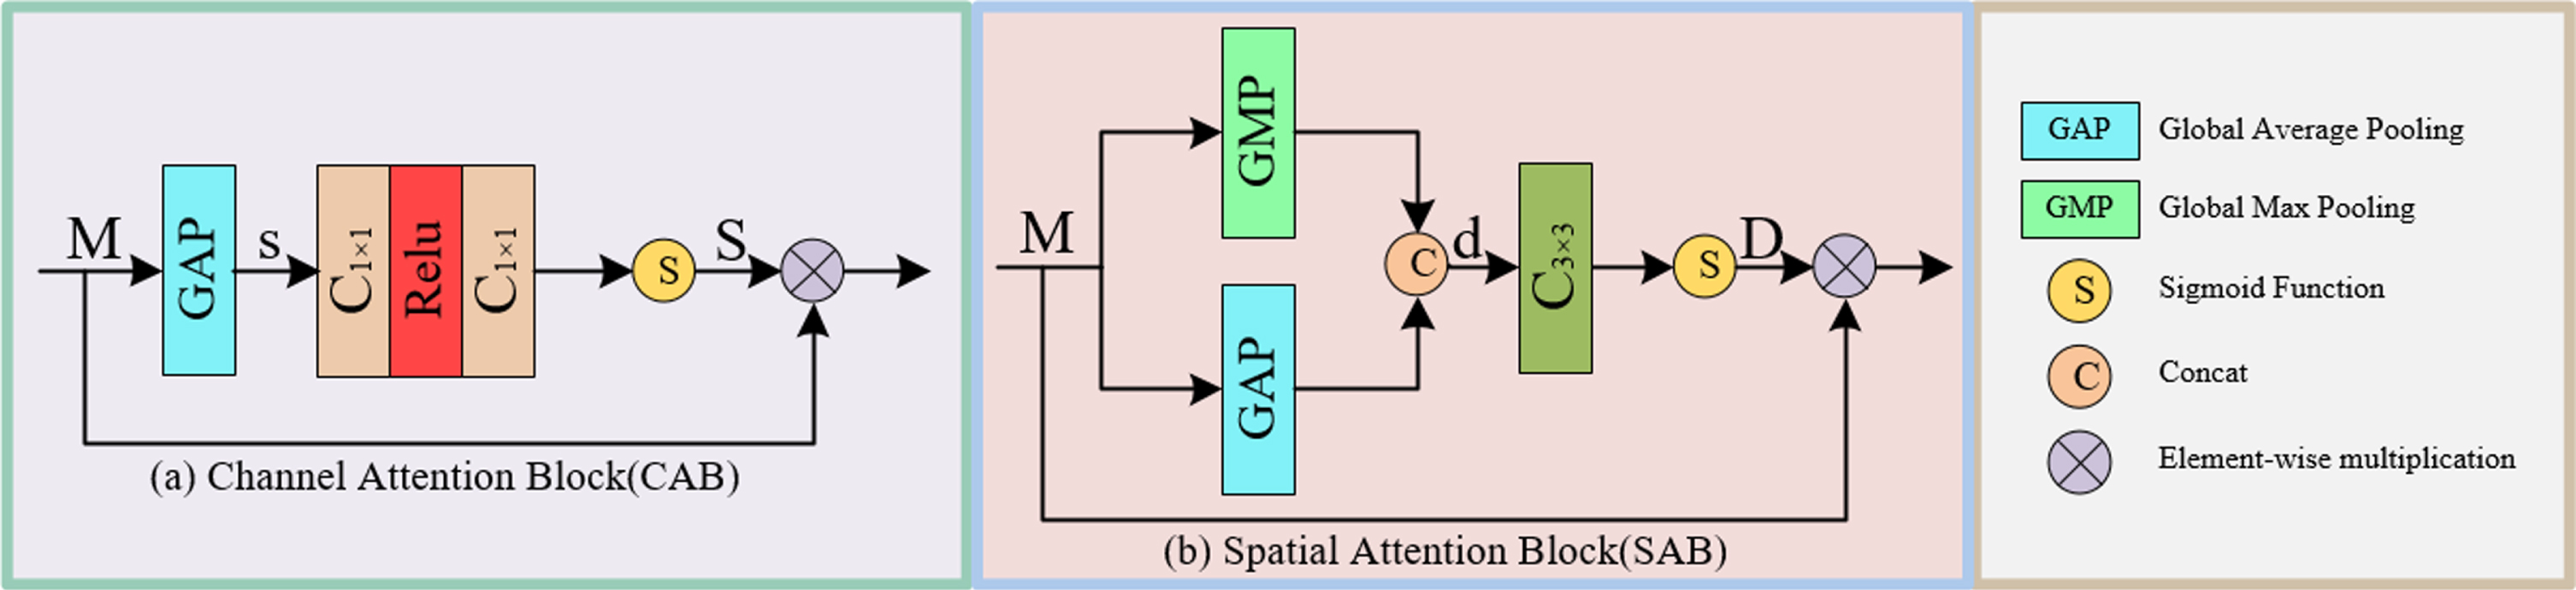
(a) CAB, and (b) SAB.
As shown in Fig. 3(b), the spatial attention block (SAB) [40] uses the relationship between feature Spaces to calculate the spatial attention map D and then uses the map to readjust the incoming feature M. To generate the spatial attention map, we first independently apply global average pooling and max pooling operations on features M along the channel dimensions and concatenate the output maps to form a spatial feature descriptor d ∈ RH×W×2. This is followed by a convolution and sigmoid activation to obtain the spatial attention map D ∈ RH×W×1. Finally, the spatial attention feature is obtained by multiplying D and M.
CFAN-Net architecture
The LDCT image denoising model proposed in this paper is shown in Fig. 4, which is called compound feature attention network with edge enhancement for Low-dose CT denoising (CFAN-Net). The whole model consists of four main modules: the edge enhancement module (Sobel_Edge enhancement), the shallow feature extraction module (SF), the deep feature extraction module (DF) based on the proposed compound feature attention block (CFAB), and the image reconstruction module (RC).
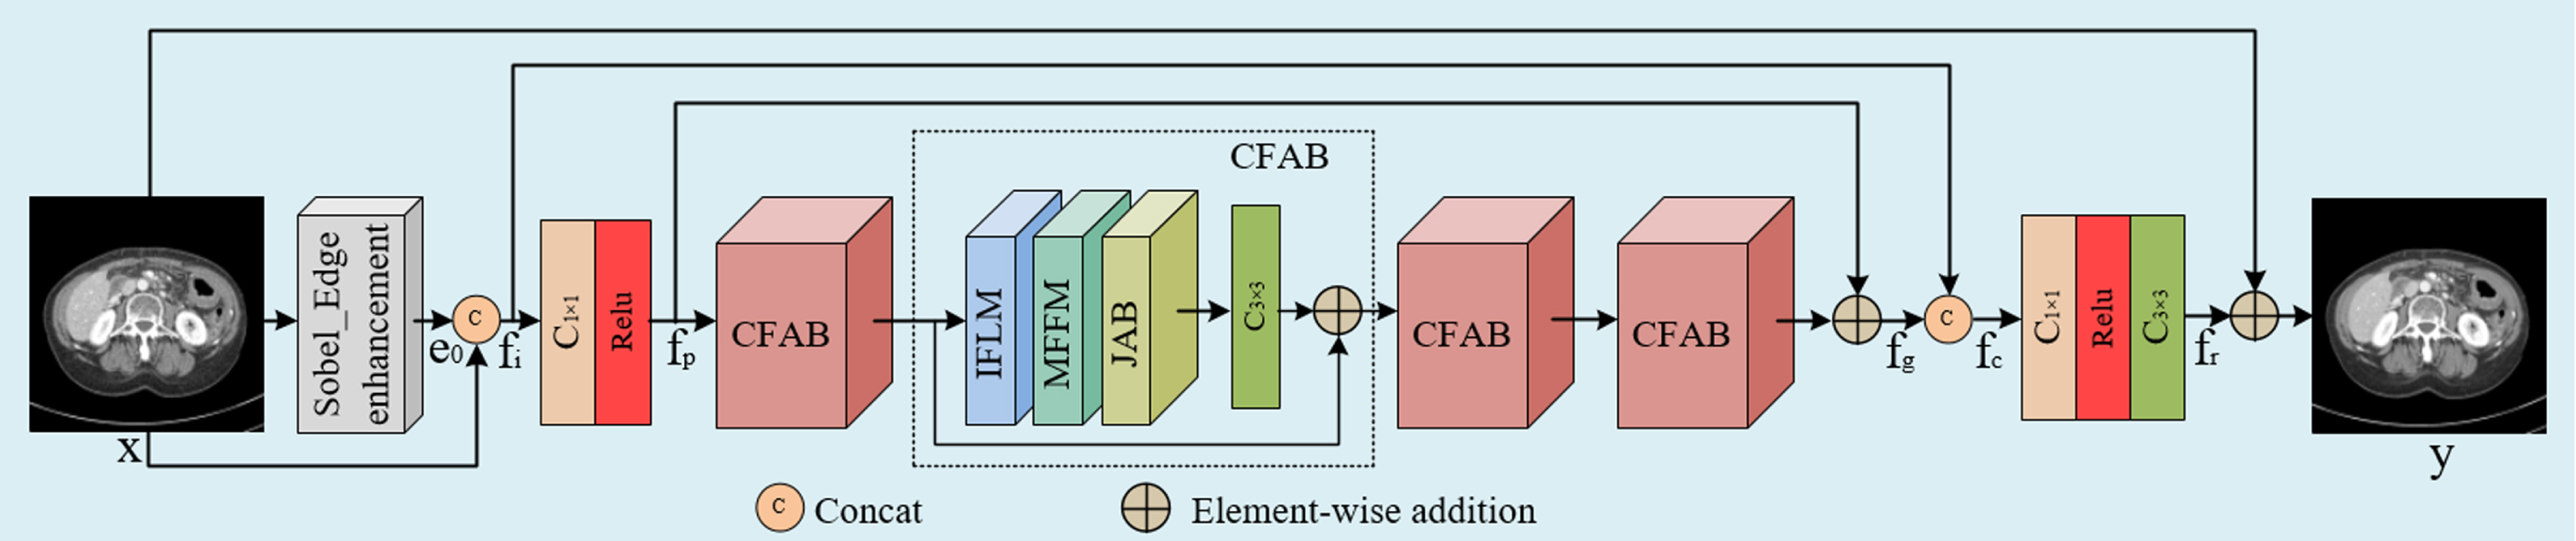
The architecture of CFAN-Net.
Suppose x is the input LDCT image, and y is the denoised output image. Firstly, the edge enhancement module is used to extract the shallow edge feature e0 from the input LDCT image x:
To accelerate the convergence rate of the model and simplify the task of the main structure of the model, we let the model learn the noise distribution directly. Therefore, the output f
r
of the reconstruction module is added to the original LDCT image x to obtain the final denoised image y.
Inspired by [41], we introduce the residual pattern on the residual structure to construct the proposed compound feature attention block (CFAB). This mode can improve the denoising performance by deepening the network depth. However, in this paper, we will only cascade four CFABs, which repeat the coarse-to-fine denoising process to construct a finer image. The residual structure is used to avoid information loss, ensure the smooth flow of information, and enhance the learning ability of the network. Each CFAB is mainly composed of an interactive feature learning module (IFLM), a multi-scale feature fusion module (MFFM), and a joint attention module (JAB). The following sections introduce its components in detail.
Interactive Feature Learning Module (IFLM)
To remove many noise and artifacts in image features, inspired by [42, 43], we design an interactive feature learning module (IFLM), as shown in Fig. 5(d). The module uses the long-distance feature correlation in the channel and spatial dimensions to make the network focus on features with more information. It performs cross-latitude interactive discriminant learning to achieve the initial removal of noise.

(a) 3d_CA, (b) 3d_SA, (c) CARB, and (d) IFLM.
Channel attention Residual block (CARB) is composed of a residual block and a three-dimensional channel attention module (3d_CA), as shown in Fig. 5(c). Convolutional blocks are used to extract features, and 3d_CA is used to enhance the ability of feature learning. 3d_CA take channel-wise attention ((H, W) dimension) as an example. The feature descriptors are first obtained in the (H, W) dimension using the averaging pooling operation. The descriptor is then forwarded to the shared multilayer awareness (MLP) and the Sigmoid functions to generate the channel attention map A c . Finally, the channel attention feature F c is obtained by multiplication between the attention map and the input feature F in . A similar process is used to generate the row-wise attention features F w of the (C, H) dimension and the column-wise attention features F h of the (C, W) dimension. Finally, the convolution and Sigmoid functions are used to generate a three-dimensional channel attention feature map C3d.
The interactive feature learning module (IFLM) is composed of the channel attention residual block (CARB) and the three-dimensional spatial attention module (3d_SA) and applies the same structure as the channel attention residual block (CARB), as shown in Fig. 5(d). The three-dimensional spatial attention module (3d_SA) and the three-dimensional channel attention module (3d_CA) learn the interdependence between features through similar cross-latitude interactions, but 3d_SA can provide different feature information for the discriminative representation of 3d_CA. In 3d_SA, we still take channel-wise attention ((H, W) dimension) as an example. We first apply the average-pooling operation along the channel axis to generate an efficient feature descriptor. The convolutional layer and sigmoid function are then applied to generate a spatial attention map A
cha
of the locations of the emphasized or suppressed feature information. Finally, we perform a multiplication operation between A
cha
and F
in
to obtain spatial-wise attentive features F
cha
. A similar process is applied in the (C, H) and (C, W) dimensions to generate the row-to-row attention features F
row
and the column-to-column attention features F
col
. Then, we add three-dimensional spatial attention features and input F
in
, using 3×3 convolution and Sigmoid function to generate the output S3d of 3d_SA.
The internal structure information of the image, such as the outer contour, lines and curves of the object, is an important factor in evaluating image quality. To improve the quality of the image, we design a multi-scale feature fusion block (MFFM), as shown in Fig. 6(c). Based on retaining the original information, MFFM uses three groups of the proposed residual pixel attention block (RPAB) (as shown in Fig. 6 (b)) to explore multi-scale image feature information. It extracts rich structural texture information, reconstructs image details, and improves image quality. It achieves the removal of fine noise.
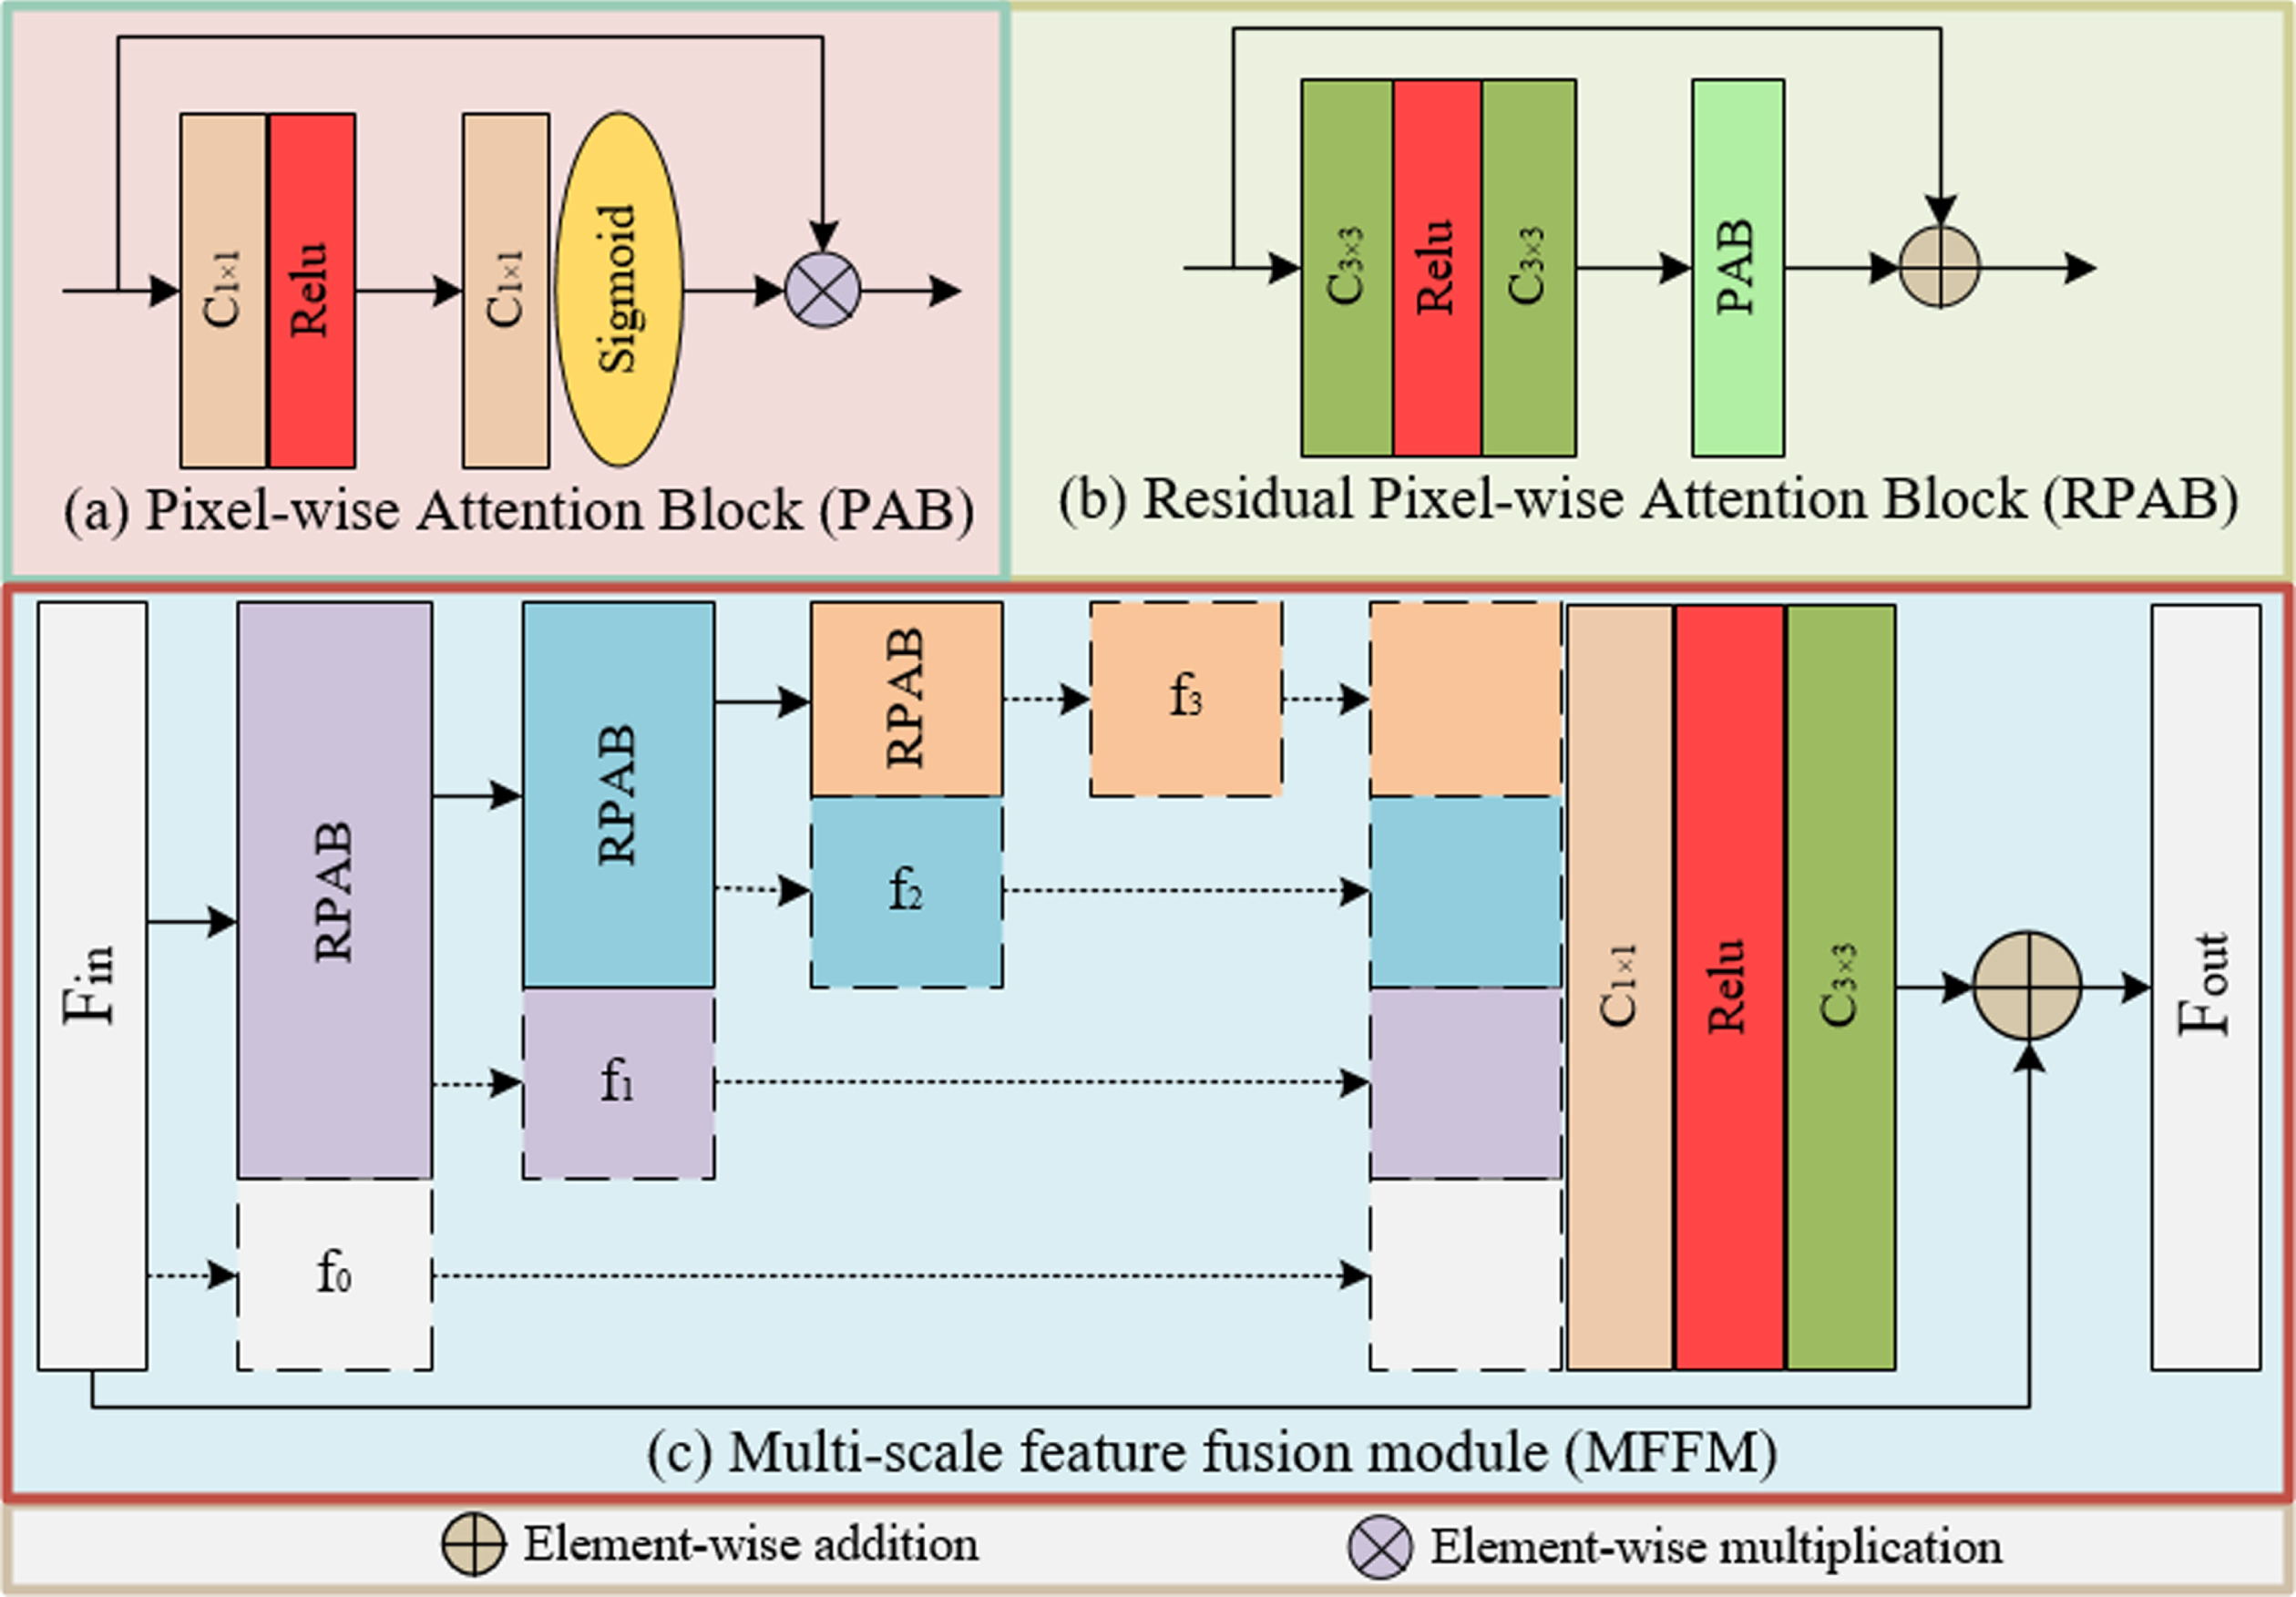
(a) PAB, (b) RPAB, and (c) MFFM.
Assume that the input feature is F
in
and the number of channels is 64. Before each calculation by RPAB, the feature maps with the last 16 channels are reserved in advance on the channels, until there are no additional feature maps, as shown in the dashed box in Fig. 6(c). After that, the feature maps with 16 channels retained previously are combined in series on the channel to form new features, which are fused by 1×1 convolution, activated by the Relu function, and then reconstructed by 3×3 convolution. Finally, it is added with the input feature F
in
for feature compensation to obtain the output F
out
. The whole process can be expressed as:
To quickly extract more useful local details from many denoised image features to construct high-quality images, we propose a joint attention block (JAB), as shown in Fig. 7(b). The goal of JAB is to focus on key information and ignore irrelevant information. It refines useful information and improves learning efficiency. JAB first extracts local features sufficiently and effectively by a residual block consisting of two shift-conv [44] and a simple Relu activation. The shift-conv consists of a set of shift operations and a 1×1 convolution, as shown in Fig. 7(a). Specifically, we divide the input features into five groups. The first four groups of features move along different spatial dimensions, including left, right, top and bottom, with 12 layers in each group. The remaining features are the last group. Next, 1×1 convolution can use the information of adjacent pixels to extract local features more effectively without increasing a lot of calculations. Then, the image features are recalibrated by using CAB and SAB attention mechanisms respectively, and the results are concatenated on the channel. Finally, the calibrated feature maps are fused by 1×1 convolution. so that it is summed with the input features to obtain the final output. The operation process of CAB and SAB is shown in the relevant part of this paper. The overall process of JAB is:
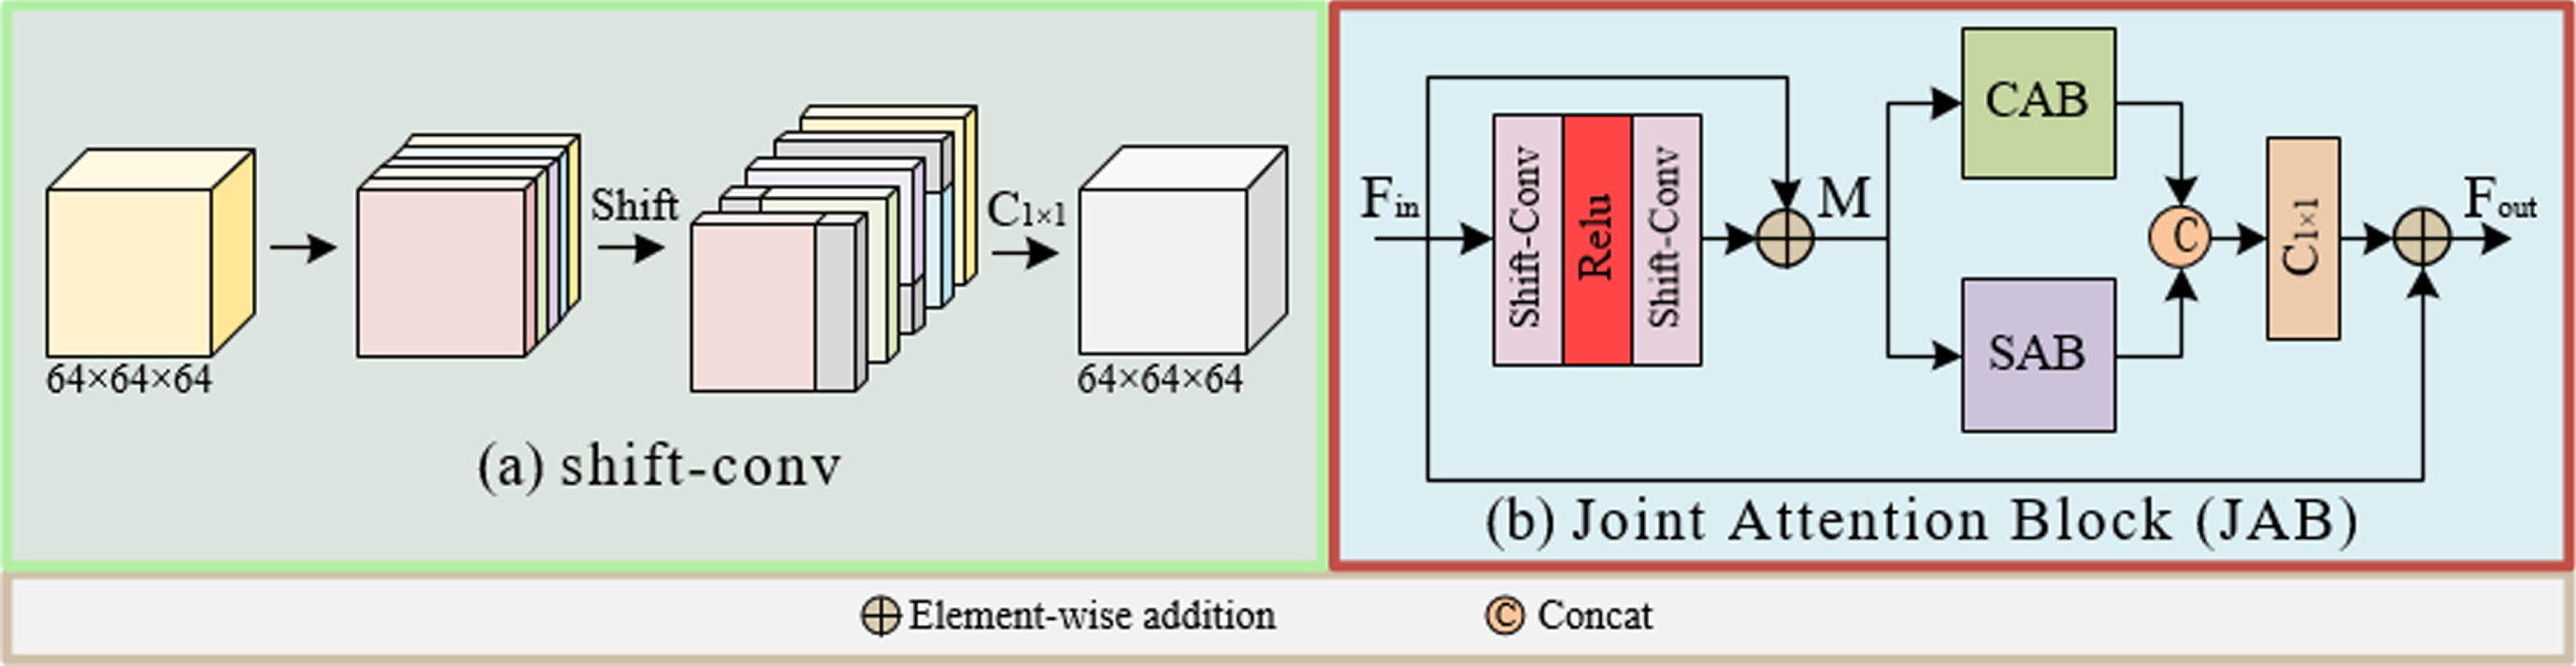
(a)shift-conv, and (b) JAB.
In this paper, we directly refer to the loss function of MS-SSIM+L1 proposed in [45] as the main loss, which is defined as:
The total loss L
total
in this paper is composed of L
Maj
and L
AE
(g):
Experimental settings
In our research experiment, we used the 2016 NIH AAPM-Mayo Clinic Low-Dose CT Grand Challenge dataset [48], which contains paired CT images of 10 anonymous patients. Each LDCT image has a corresponding NDCT image, and each image is 512×512. The dataset was segmented before training, and the CT images of 9 patients (812 pairs) were randomly selected as the training set, and the images of the remaining 1 patient (35 pairs) were used as the test set. During training, patches with a size of 64×64 are randomly cropped for training, and the network is optimized using the default parameter Adam optimizer. In the experiment, the batch size is 4, the learning rate is 0.00004, and the number of iterations is 400. This experiment is based on the Pytorch framework and uses a computer configured as NVIDIA GeForce RTX 2080 SUPER GPU to train and test the network. The parameters of the comparative experiment are set according to the suggestions of the original paper. The dimensions of the variables in Figs. 3–7 are shown in Table 1.
To test the effectiveness of the proposed CFAN-Net, we compare the proposed algorithm with REDCNN [24], EDCNN [38], QAE [30], CTformer [33], and CNCL [34] in terms of visual effects and quantitative indicators. Among them, the objective evaluation indexes in the quantitative analysis include structural similarity (SSIM) based on structural difference, peak signal-to-noise ratio (PSNR) based on pixel gray level difference, gradient magnitude similarity deviation (GMSD) based on gradient value change, feature similarity index Meature (FSIM) based on feature difference and variance information fidelity (VIFs) based on visual perception. Except for GMSD, higher values of the remaining metrics indicate better quality of the denoised CT images.
Visual effect
The processing results of two representative slices (represented as Case 1 and Case 2) in the Mayo test data set through different methods are shown in Figs. 8 and 9. All CT images in the axial view are displayed in the [-160HU, 240HU] window. To show the noise reduction effect more clearly, we enlarged the region of interest (ROI) and marked the artifacts and lesions with red arrows, yellow dotted ellipses and blue circles, as shown in Figs. 10 and 11. There are obvious noise and artifacts in LDCT images (Figs. 8(a) and 9(a)) compared with NDCT images (Figs. 8(b) and 9(b)) where clear damage and tissue structure can be seen. From the overall noise reduction effect and the locally enlarged ROI image, the six comparison methods have a certain removal effect on the noise and artifacts in the LDCT image.
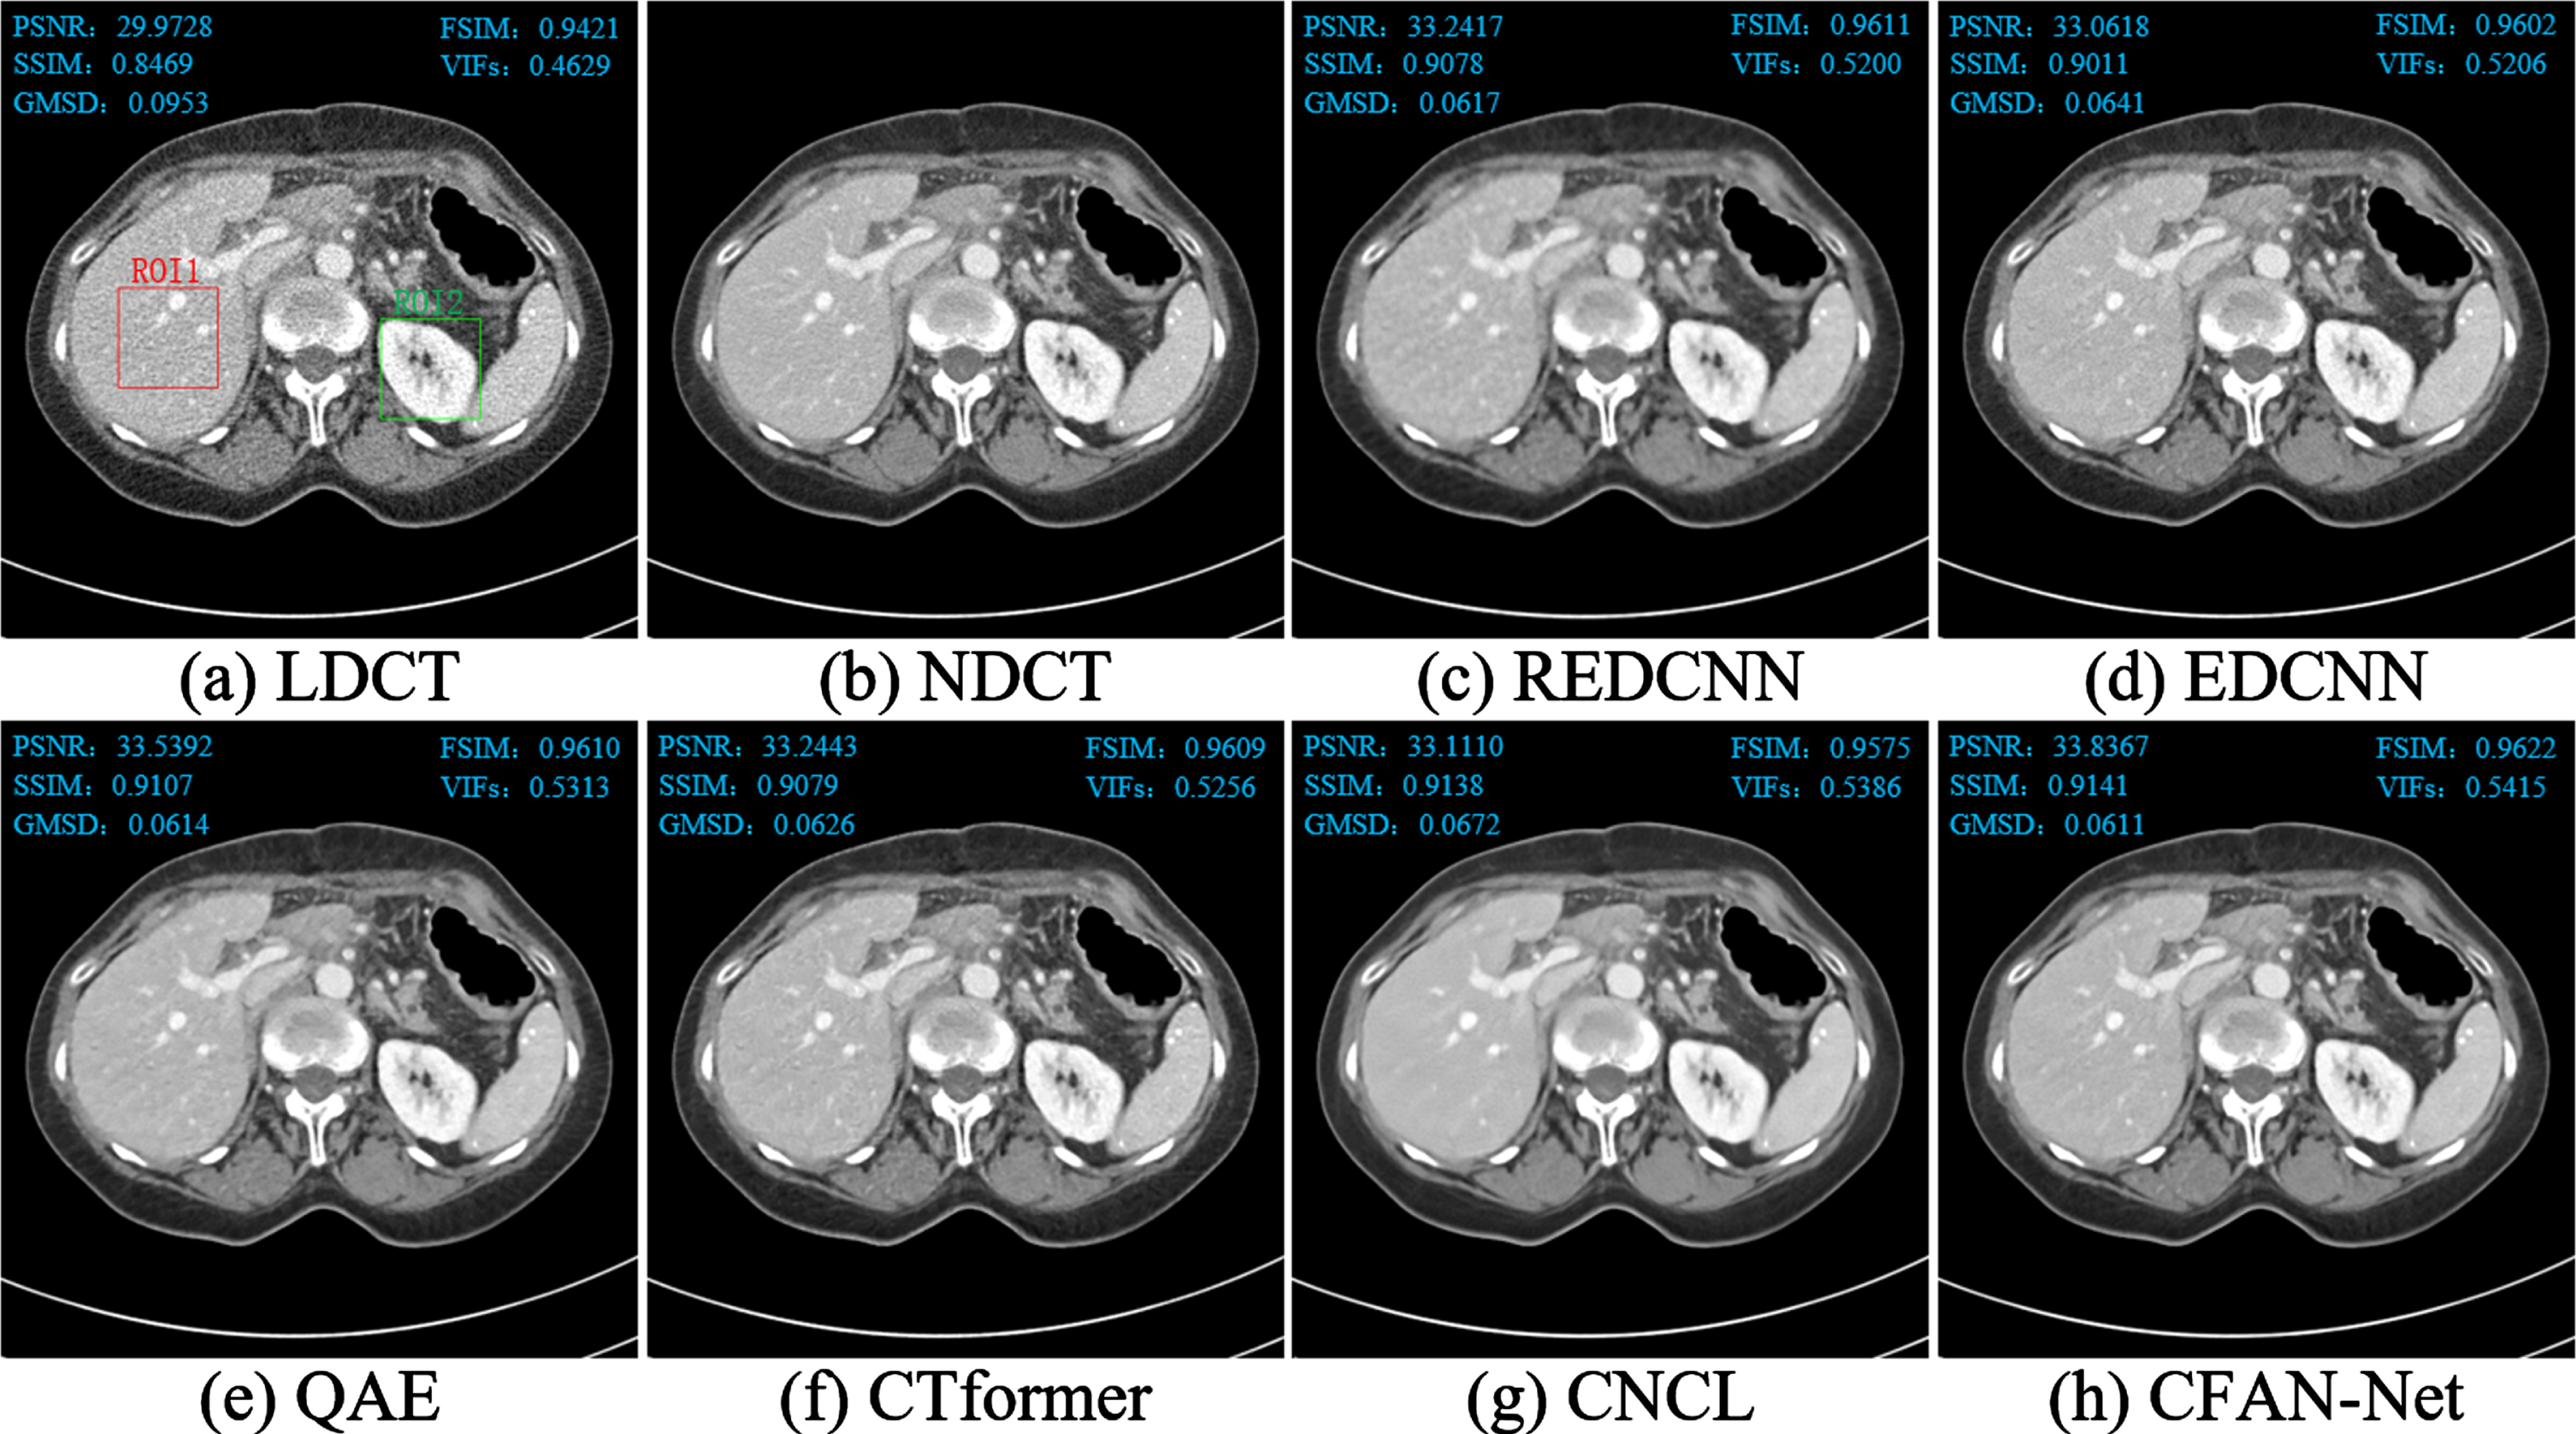
Comparison of Case 1.
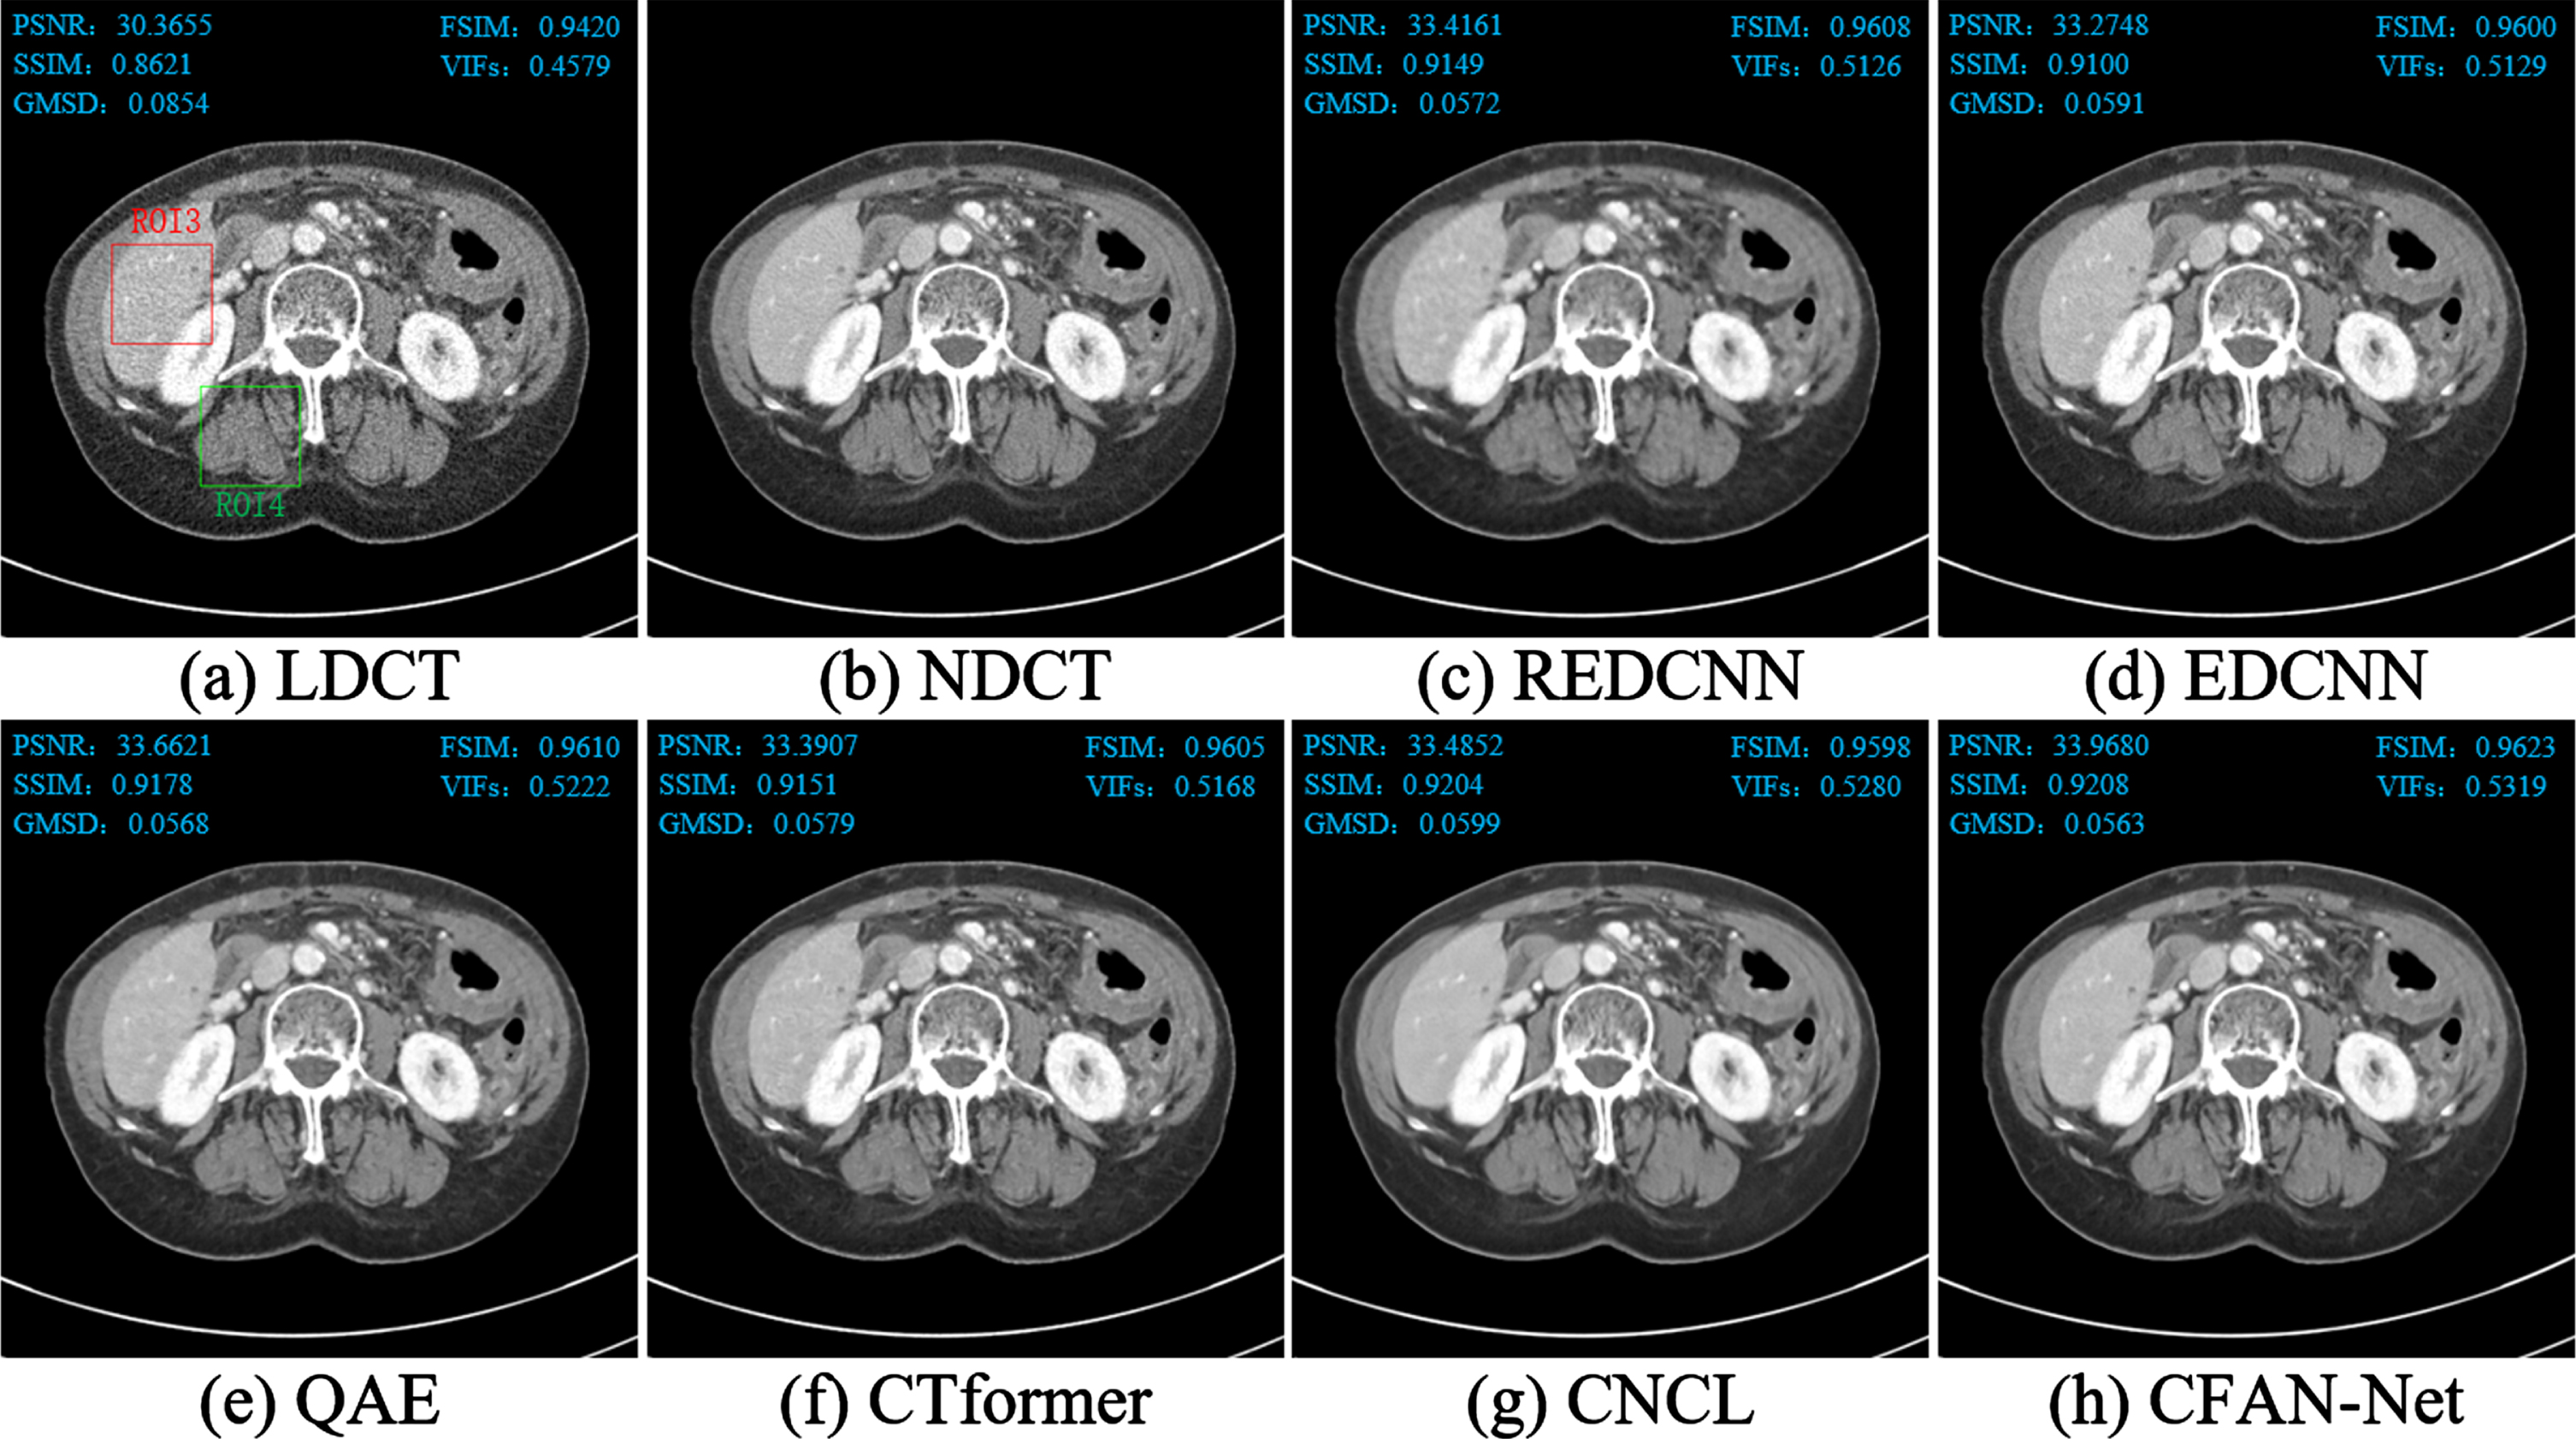
Comparison of Case 2.

The zoomed ROIs in Fig. 8.
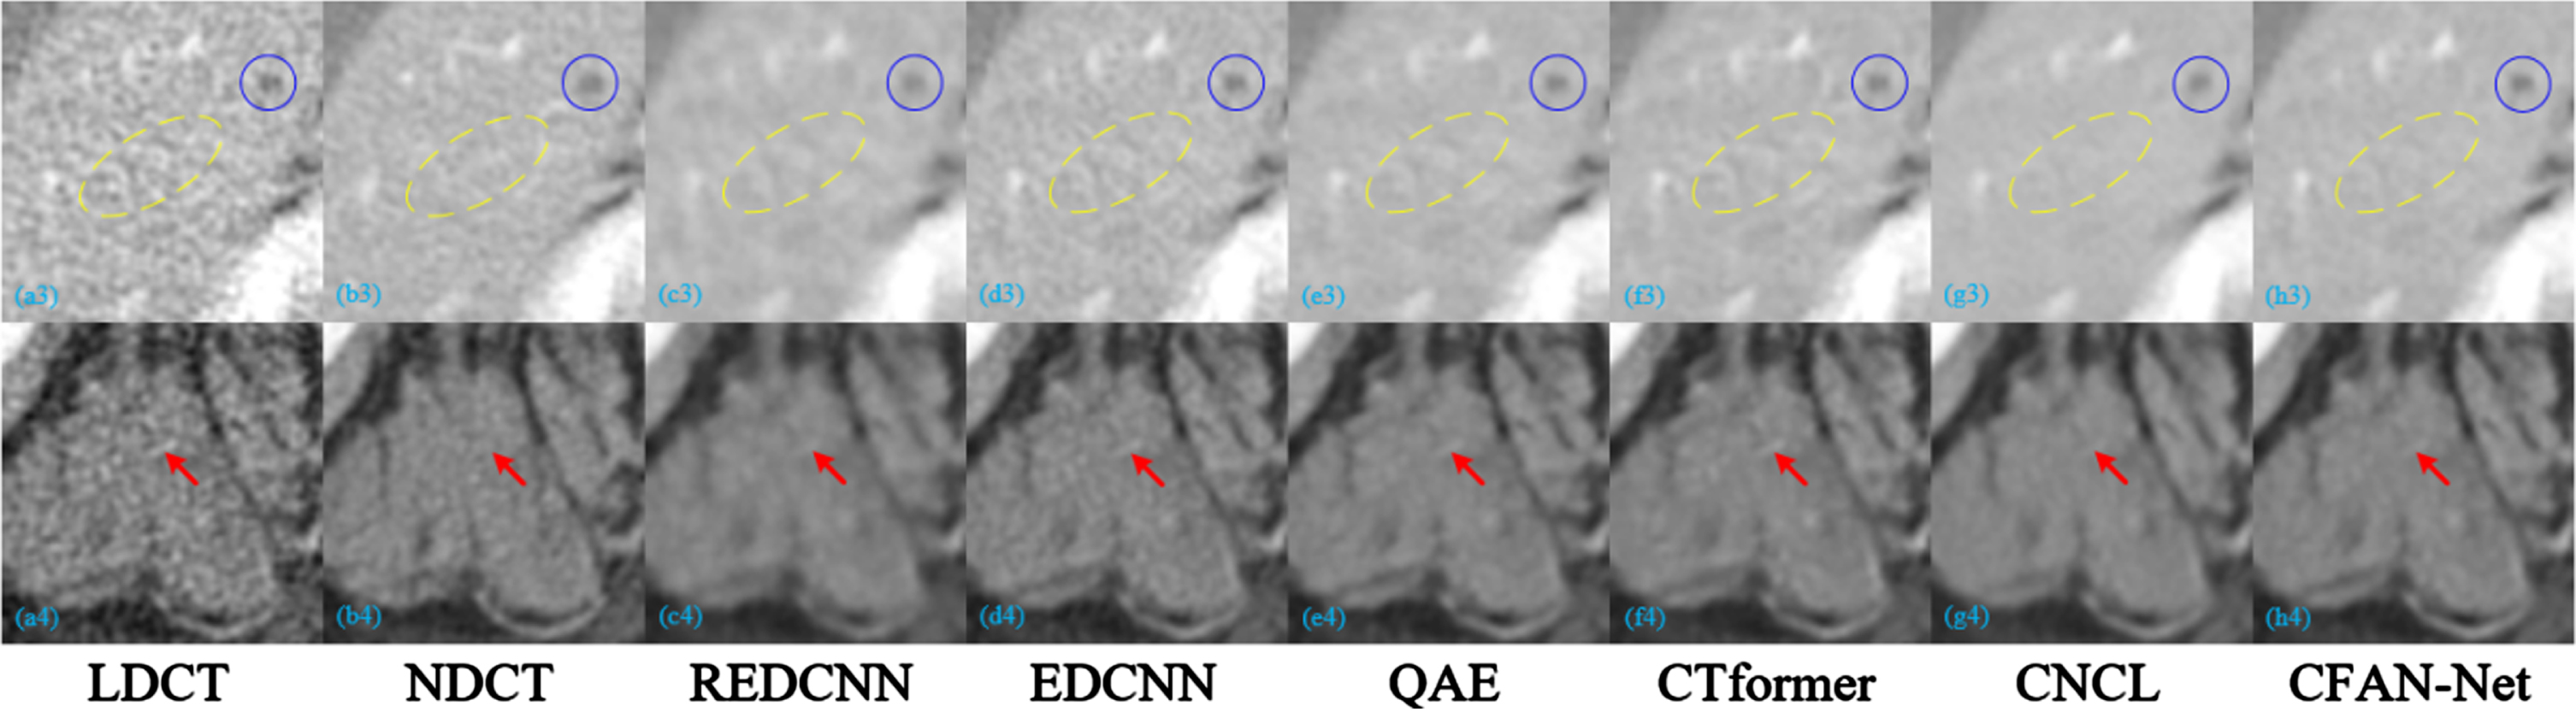
The zoomed ROIs in Fig. 9.
Although REDCNN eliminates some noise, the image is blurred (as shown in Figs. 10(c1) and 11(c4)), which can be attributed to the use of mean square error (MSE) as a loss function. QAE and CTformer remove most of the speckle noise, but still cannot effectively remove artifacts (as shown in Figs. 10(e1) – (f1)). CNCL effectively removes noise and artifacts in LDCT images, but there are problems such as image smoothing and detail loss (as shown in Figs. 10(g1) and 11(g3)). Comparing the small lesions marked by blue circles in Fig. 11, it is found that the lesion contours of EDCNN and CFAN-Net are the clearest, and other methods have obvious blurring. This result confirms the role of the edge enhancement module. From the other markers in Figs. 10 and 11, CNCL and CFAN-Net have the strongest ability to remove noise and artifacts, and other methods have obvious residual artifacts. In contrast, our CFAN-Net achieves better results in noise, artifact removal and tissue detail protection. In the ROI image, it shows that after the noise and artifacts are removed, the overall organizational details (as shown in Figs. 10(h1) and 11(h3)) and texture (as shown in Fig. 11(h4)) are the clearest. This result shows that the compound feature attention module has strong noise and artifact removal capabilities. In summary, CFAN-Net has an excellent ability in removing noise and artifacts and restoring image details and textures.
To illustrate the effectiveness of the proposed algorithm, we use five objective indicators to evaluate and compare six denoising algorithms. The values are marked in the upper-left and upper-right corners of Figs. 8, 9. In addition, Table 2 shows a summary table of the average PSNR, SSIM, GMSD, FSIM, and VIFs values obtained by different methods after processing 35 LDCT images in the test dataset. The optimal and suboptimal values are represented by red and blue, respectively. It can be seen from Table 2 that compared with REDCNN, EDCNN and CTformer, except that PSNR in CTformer is slightly higher and SSIM in EDCNN is the lowest, the score gap of other indicators is very small. QAE achieved sub-optimal in PSNR, GMSD and FSIM, but the scores of GMSD and FSIM were not much different from REDCNN, EDCNN and CTformer. CNCL performed worst on PSNR, GMSD, and FSIM, but its SSIM and VIFs values were suboptimal. The comprehensive comparison shows that the scores of the proposed method are optimal on the five indicators, which indicates that CFAN-Net can achieve good noise and artifact suppression (PSNR), feature information preservation (FSIM and VIFs), and its visual effect is closer to NDCT images (GMSD and SSIM).
Quantitative index values (mean±standard deviation) of noise reduction results of different algorithms on the Mayo testing set
Quantitative index values (mean±standard deviation) of noise reduction results of different algorithms on the Mayo testing set
Through the boxplot of PSNR and SSIM, the distribution characteristics of different methods on the test dataset are compared, as shown in Fig. 12. The boxplot summarizes a set of data through five statistics: maximum, minimum, lower and upper quartiles, and median. By observing the width of the frame in Fig. 12 and the distribution range of PSNR and SSIM, we can conclude that CFAN-Net has good robustness. From the gray line (median) in the boxplots, the order of different denoising methods is as follows: (PSNR) CNCL < REDCNN<EDCNN<CTformer<QAE<CFAN-Net, (SSIM) EDCNN < REDCNN<CTformer<QAE<CNCL<CFAN-Net. The highest median value confirms the average quantization performance of CFAN-Net.

Boxplot of denoised results using different denoising methods on AAPM testing set.
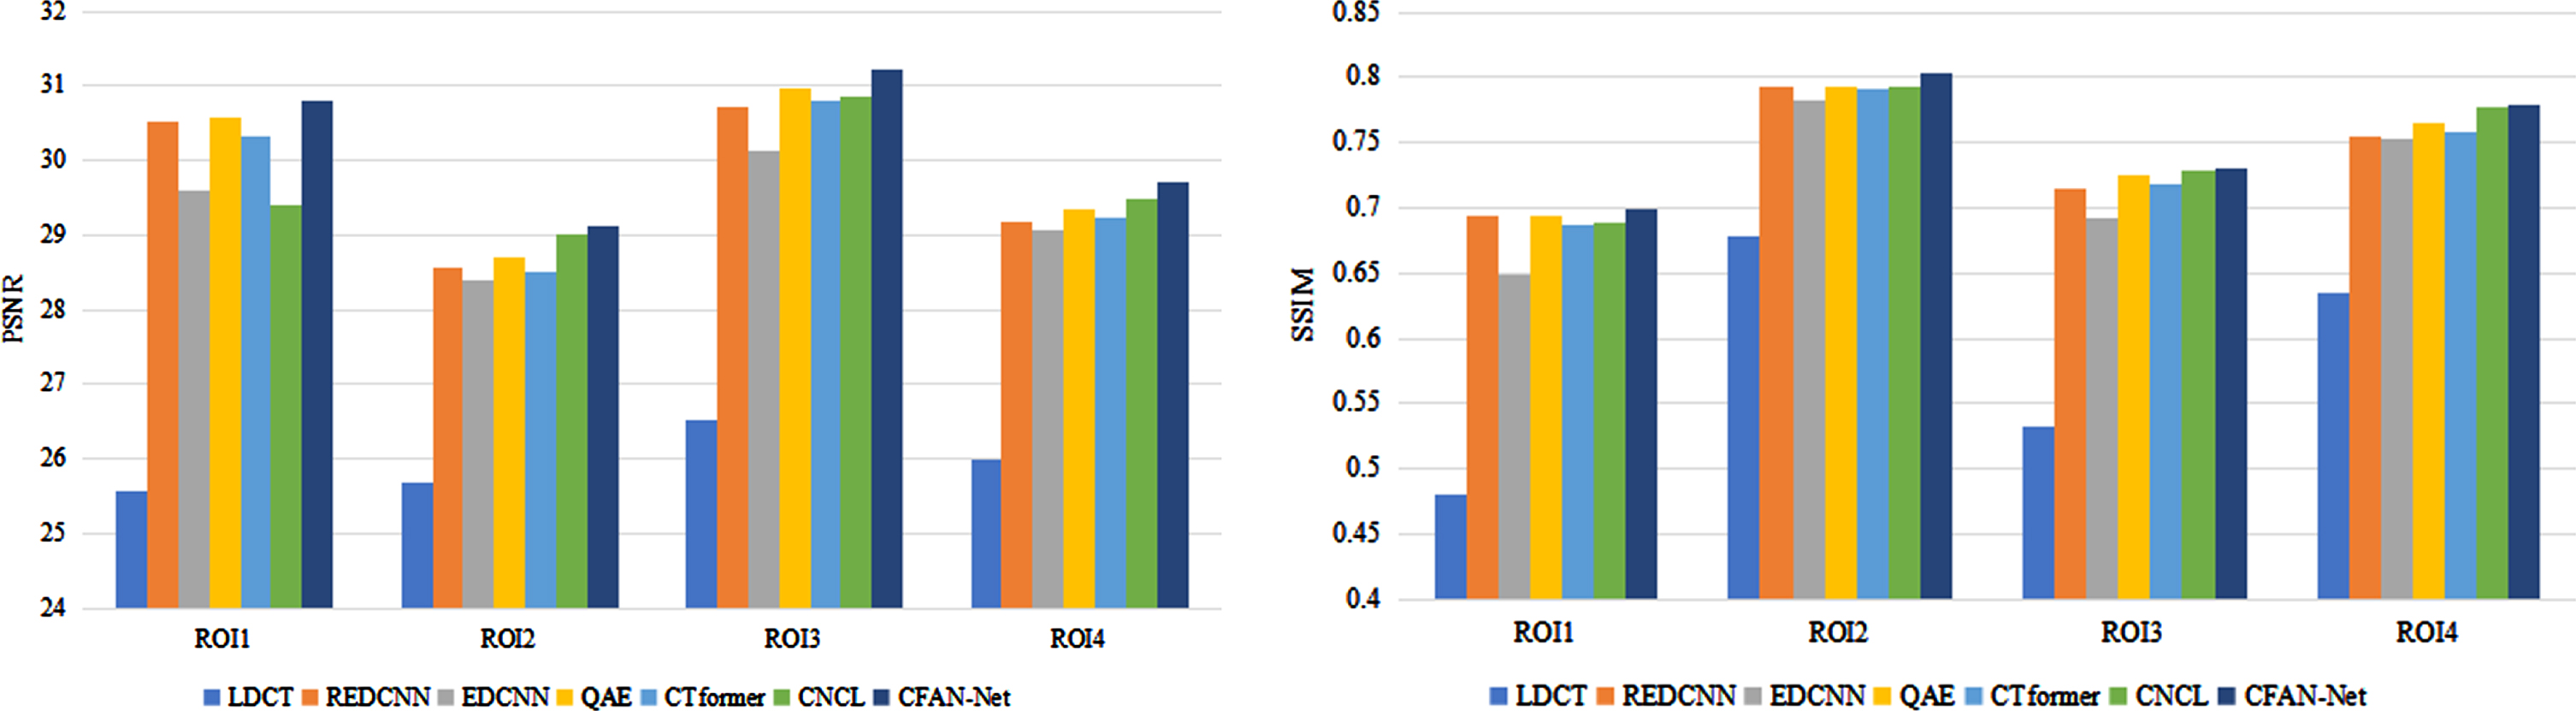
Since doctors are more inclined to focus on ROI in practical clinical applications, we quantify the ROI results obtained by different methods using PSNR and SSIM, as shown in Fig. 13. Comparing the PSNR and SSIM of each method in the same ROI, it can be found that CFAN-Net always has leading quantitative performance. Overall, the quantitative indicators of EDCNN perform poorly, while other methods are not quite different from each other. In comparison of PSNR, CNCL performs worst in ROI1, and CFAN-Net is significantly ahead in all ROIs. In the comparison of SSIM, EDCNN is significantly the worst in ROI1 and ROI3, and CFAN-Net is significantly ahead in ROI1 and ROI2. When evaluating image quality, we consider the performance of different algorithms on various quantitative indicators. In summary, CFAN-Net is superior to other comparison methods in terms of visual effects and quantitative index analysis.
The research in this section is mainly based on the use of real clinical data and has been approved by the ethics committee of our hospital. In this paper, a representative slice (Case 3) is selected to verify the robustness of real clinical CT images. Two ROI regions (marked with the rectangular box in Fig. 14(a)) are selected from the slice for better comparison. They are placed in the upper left and upper right corners of the slice, and the artifacts and lesions are marked with red arrows and blue circles, as shown in Fig. 14. We can find that there are serious noise and artifacts in LDCT images, which have a great impact on the observation of texture and damage. REDCNN and QAE can suppress noise and artifacts to a certain extent, but the processed image is blurred (as shown in Fig. 14(b) and 14(d)). Compared with CTformer, there are more artifacts in the image processed by EDCNN (as shown in Fig. 14(c5)), but the contour of the lesion in the blue circle is clearer (as shown in Fig. 14(c6)). CNCL and CFAN-Net can produce better results, but there are still obvious artifacts in the image processed by CNCL (as shown in Fig. 14 (f5)) and the brightness still needs to be improved. CFAN-Net has the main noise suppression effect, and the lesion and tissue texture are well preserved. In summary, the images processed by CFAN-Net are convenient for doctors to diagnose and have practical application value.

Comparison of Case 3.
In this section, ablation experiments are performed on the Mayo dataset to analyze the impact of all contributions in CFAN-Net. In short, the four ablation experiments are ‘w/o the compound loss’ (the model is obtained by replacing the compound loss with the L1 loss), ‘w/o the interactive feature learning module’ (the model is obtained by subtracting the interactive feature learning module), ‘w/o the multi-scale feature fusion module’ (the model is obtained by subtracting the multi-scale feature fusion module), and ‘w/o the joint attention module’ (the model is obtained by subtracting the joint attention module).
As shown in Fig. 15, we select another representative slice (represented as Case 4) from the Mayo dataset for a better comparison, with a window level of [-160HU, 240HU]. It can be seen from Fig. 15(c) and (d) that if there is no interactive feature learning module or multi-scale feature fusion module, the image processing results are affected by noise residues to varying degrees. If the joint attention module is not used, it can be seen from Fig. 15(e) that the results are blurred and there are artifacts. Although the visual difference between Fig. 15(f) and 15(g) is subtle, CFAN-Net is slightly better in artifact suppression and detail preservation.
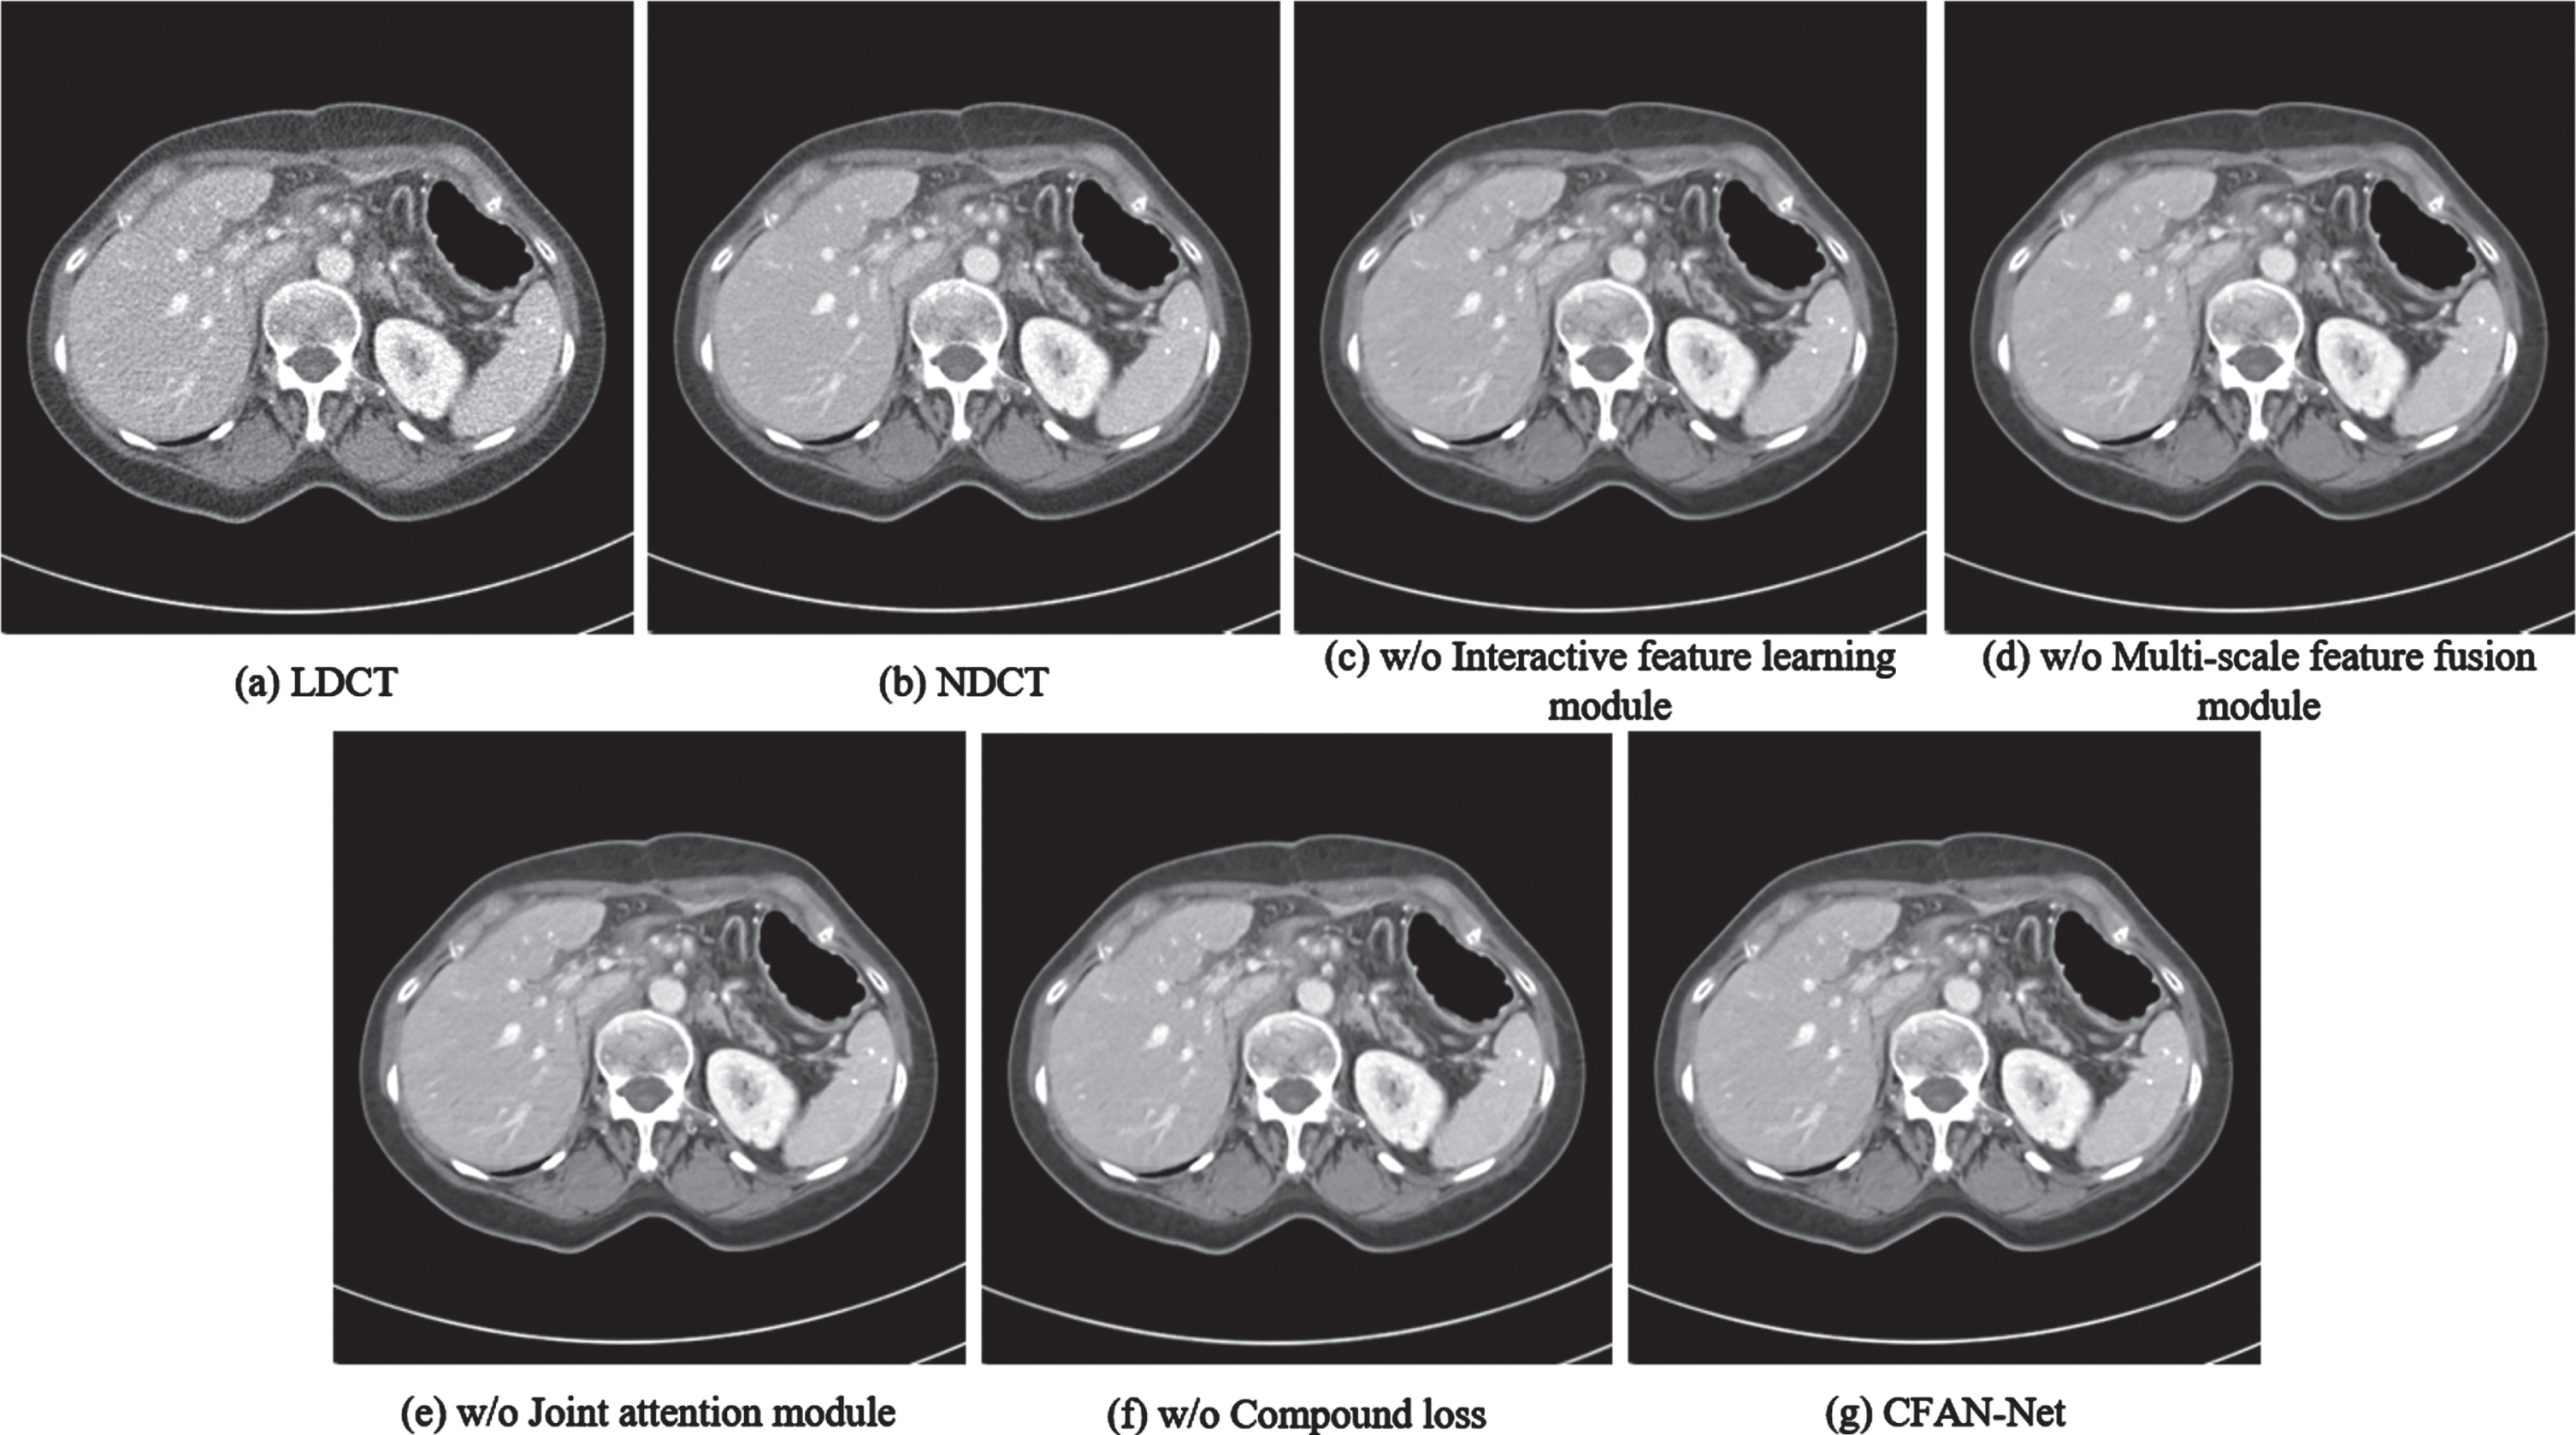
The denoised results obtained by performing the ablation experiments for Case 4 on the Mayo testing set.
Table 3 shows the average index values of each model in the ablation experiment when dealing with 35 pairs of the testing set. The optimal and sub-optimal values are expressed in red and blue, respectively. We can see that the proposed CFAN-Net achieves the best score for each metric. The model without the multi-scale feature fusion module performs the sub-optimal value except for PSNR, while the model without the interactive feature learning module performs the worst score. It shows that the interactive feature learning module has a positive effect on the model. The model with only the L1 loss performs sub-optimal values except for SSIM and VIFs. Compared with CFAN-Net, the PSNR, SSIM, FSIM and VIFs of the model without the joint attention module are lower, and the GMSD value is unchanged, which shows the influence of the joint attention module. In summary, the improved network in this paper is effective and meaningful for improving the quality of LDCT denoising images.
Quantitative performance of ablation studies (mean)
In this paper, we propose a compound feature attention network with edge enhancement for Low-dose CT denoising (CFAN-Net), which solves the problems of texture detail loss and image over-smoothing after LDCT image denoising. Combining the advantages of residual structure and attention, we propose a compound feature attention block (CFAB), which includes an interactive feature learning module (IFLM), a multi-scale feature fusion module (MFFM) and a joint attention module (JAB). It removes image noise from coarse to fine and applies cascade mode to deepen the work. The experimental results show that the proposed CFAN-Net has an obvious removal effect on noise and artifacts in LDCT. In qualitative and quantitative aspects, compared with several other advanced LDCT image denoising networks, it has achieved leading results. However, CFAN-Net does not perfectly restore the organizational details of the image, and its training process requires the participation of paired labels. In the future, we will further improve the performance of the model and make it develop towards the unsupervised or semi-supervised direction.
Footnotes
Acknowledgments
We would like to thank the editors and reviewers for improving the content of this article and thank the Mayo Clinic and the Ethics Committee for providing the data used. This work was supported in part by the National Nature Science Foundation of China (61801438), in part by the Science and Technology Innovation Project of Colleges and Universities of Shanxi Province (2020L0282), in part by the Natural Science Foundation of Shanxi Province of China (201901D111153, 202103021224204).