
Abstract
BACKGROUND:
Recently, X-rays have been widely used to detect complex structural workpieces. Due to the uneven thickness of the workpiece and the high dynamic range of the X-ray image itself, the detailed internal structure of the workpiece cannot be clearly displayed.
OBJECTIVE:
To solve this problem, we propose an image enhancement algorithm based on a multi-scale local edge-preserving filter.
METHODS:
Firstly, the global brightness of the image is enhanced through logarithmic transformation. Then, to enhance the local contrast, we propose utilizing the gradient decay function based on fuzzy entropy to process the gradient and then incorporate the gradient into the energy function of the local edge-preserving filter (LEP) as a constraint term. Finally, multiple base layers and detail layers are obtained through filtering multi-scale decomposition. All detail layers are enhanced and fused using S-curve mapping to improve contrast further.
RESULTS:
This method is competitive in both quantitative indices and visual perception quality.
CONCLUSIONS:
The experimental results demonstrate that the proposed method significantly enhances various complex workpieces and is highly efficient.
Keywords
Introduction
Digital radiography (DR) based on X-rays has been widely used in industrial non-destructive testing (NDT). It can timely and accurately display the internal structure, composition, and defects of the workpiece [1–5]. With the continuous development of X-ray detector manufacturing technology, the dynamic range of image acquisition has evolved from the initial 8 bits to 16 bits or even higher. However, most monitors are only capable of displaying images with an 8-bit dynamic range. When presenting intricately fabricated objects, the non-uniform thickness results in poor X-ray image contrast and inadequate reflection of image defects. It causes significant issues of X-ray detection technology.
To effectively showcase the valuable details in a 16-bit high dynamic range image (HDR) on an 8-bit display, tone mapping methods are commonly employed. These methods consider image sharpness and contrast. They include global tone mapping algorithms, local tone mapping algorithms and tone mapping based on deep learning networks.
Simple global tone mapping algorithms include exponential functions, logarithmic functions, and power functions. Duan [6] used a histogram-based tonal mapping method to construct histograms by equalizing histograms and weighted average linear maps. Husseis [7] realized adaptive weighting in Duan’s method. Lee [8] utilized a cluster-based tone mapping approach, specifically employing the k-means algorithm, to group images into a specified number of clusters based on the similarity of their brightness values. The parameters used in tone mapping were then adaptively determined for each group’s brightness. Oskarsson [9] adopted the dynamic programming method to find the globally optimal solution for solving the clustering problem. Lee [10] estimated the Gaussian distribution of dark and bright areas in HDR by applying the Gaussian mixture model to the brightness histogram. Subsequently, tone mapping and fusion of dark and bright areas were carried out separately to obtain the final image. Khan [11] proposed using a perceptual quantizer (PQ) to convert the real pixel intensity of HDR images into the perceptual domain and construct a histogram to limit the overstretch of contrast. The global tone mapping algorithm is suitable for real-time tone mapping due to its low computational complexity and high efficiency. However, the loss of local contrast is an inevitable drawback of this method.
The local tone mapping algorithm considers the local relationship between the brightness of an individual pixel and the brightness of its neighboring pixels. There are several methods available, including the following:
Tone mapping based on photogrammetry involves controlling the exposure time of different parts of the film to lighten dark areas and darken bright areas. Reinhard [12] increased the contrast of each pixel by reducing the tonal mapping value of dark pixels surrounded by relatively bright pixels. Reinhard [13] proposed an adaptive method to estimate the parameters involved in this tone mapping. Gu [14] introduced a nonlinear gamma correction instead of using a linear function to enhance the performance of tone mapping. Yang [15] enhanced the contrast of the luminance channel in tone mapping by employing Gaussian differential filtering.
Tone mapping based filter: The HDR image can be split into a base layer containing low-frequency brightness information and a detail layer containing high-frequency detail information. This allows the dynamic range of brightness to be reduced in the base layer, while local detail can be better preserved or even enhanced in the detail layer. Subsequently, the two processed layers are recombined to produce a low dynamic range image (LDR). Durand [16] proposed a famous edge-preserving filter, the bilateral filter (BF), which calculates the weight of BF based on spatial distance and intensity distance to better preserve edges. He [17] proposed a guided filter (GF), which has better edge-preserving performance. Gao [18] further used GF in multi-layer decomposition schemes to preserve edges and details at different scales. Kim [19] used a weighted least squares (WLS) filter to decompose the base layer and the detail layer. Subsequently, the dynamic range of the base layer was compressed by employing a nearly linear tone mapping. Cheng [20] also utilizes a WLS filter. The dynamic range of the base layer is compressed through histogram-based tone mapping, while the detail layer is enhanced using S-shaped curves. Liang [21] applied L1 and L0 sparse terms to the base layer and the detail layer, respectively, to preserve the main structural edges from being destroyed and flatten the trivial texture details simultaneously. Tang [22] utilized the benefits of WLS and Total Variation (TV) regularization to enhance the edge and texture pixels, making the details more prominent and smooth. Gu [23] proposed a local edge-preserving (LEP) filter, which constructs a multi-scale base layer and detail layer to obtain more comprehensive image edge information and significantly improve image contrast and clarity.
Tone mapping based on gradient compression: Fattal [24] brought overexposed and underexposed details into the enhanced image by attenuating large gradients and enhancing small ones. Liu [25] utilized the Dense Scale-Invariant Feature Transform method to calculate the local contrast around each pixel instead of a single pixel, which could better preserve the spatial structure of the original image. Liu [26] verified that local fuzzy entropy is more effective than gradient in detecting noisy image edges, and it effectively enhances the details of the workpiece.
In recent years, deep learning has achieved significant success in speech and image recognition, effectively addressing numerous intricate patterns. Tone mapping based on deep learning networks is divided into supervised learning-based tone mapping [27–32], semi-supervised and unsupervised learning-based tone mapping [33–35], and semantic-based tone mapping [36]. Compared with traditional algorithms, the deep learning-based tonal mapping method can generate superior LDR images from HDR images without requiring extensive parameter adjustment. Moreover, the tonal mapping performance of the deep learning-based network improves with the size of the training dataset. It is a time-consuming and tedious task to select the best tonal LDR image from all the candidate HDR images generated through tonal mapping.
Inspired by the research of Gu [23] and Liu [26], for X-ray images enhancement, we propose a multi-scale local edge-preserving filter based on fuzzy entropy for X-ray image enhancement. Firstly, the dynamic range of the image is reduced by logarithmic preprocessing. Secondly, the base layer of the prominent local edge is achieved through iterative filtering of the image using a local edge-preserving filter based on fuzzy entropy. The detail layer is obtained by differentiating the adjacent base layer, all detail layers are enhanced through S-curve mapping and then fused to produce a high contrast and clear image. The structure of this paper is as follows: Section 2 introduces the relevant theories and methods, Section 3 presents the algorithm framework proposed in this paper, Section 4 describes the experiments conducted using the algorithm and various common indicators, and Section 5 we discuss and conclude the relevant issues of the proposed method.
Related work
Local edge-preserving (LEP) filter
The local edge-preserving filter proposed by Gu [23] can effectively compress high dynamic range while preserving small local details.
He first proposed a hypothesis that assuming the base layer maintains the local mean, the detail layer oscillates around zero. A common constraint on this assumption is minimization:
In order to maintain the edge, another constraint is needed that should preserve a locally significant edge in the base layer. The larger the gradient, the more likely it is to be a significant edge. The filtered base layer should be close to the original luminance, with the following constraints:
Through the analysis above, the energy function of Equation (3) is obtained. In order to facilitate the solution, we write the above equation in discrete form:
The above equation can be iteratively minimized to obtain a numerical solution using the normalized steepest descent method. In order to facilitate the solution, this paper intuitively assumes a linear relationship between the input image I and the output base layer B in a local window. The equation is as follows:
Now, the optimization problem transforms into a parameter estimation problem. By setting the partial derivatives of each parameter to zero, the linear least squares solution of Equation (6) can be obtained:
The overall structure of the output image is clear, the contrast is high, and halo artifacts can be avoided. However, the details are not fully displayed, and the defective parts are not obvious.
Liu [26] verified that local fuzzy entropy can effectively detect the edges of noisy images, in image H, the neighborhood pixels of a given pixel at coordinate (x, y) can be regarded as a fuzzy set, and the local fuzzy entropy at (x, y) is defined as:
Framework of this paper
Firstly, considering the high dynamic characteristics of X-ray images and the limitations of the local edge-preserving filter algorithm in displaying workpiece thickness and detail, this paper proposes to logarithm transformation the images initially to compress the dynamic range. Subsequently, then use the local edge-preserving (LEPFE) filter based on fuzzy entropy is employed for multi-scale decomposition to acquire multiple base layers and detail layers, followed by blending all the detail layers. In this paper, the gradient field and local fuzzy entropy are introduced to enhance the LEP filter. This enhancement results in more prominent and clear display of image details, as well as higher contrast. The algorithm flow of this paper is shown in Fig. 1.
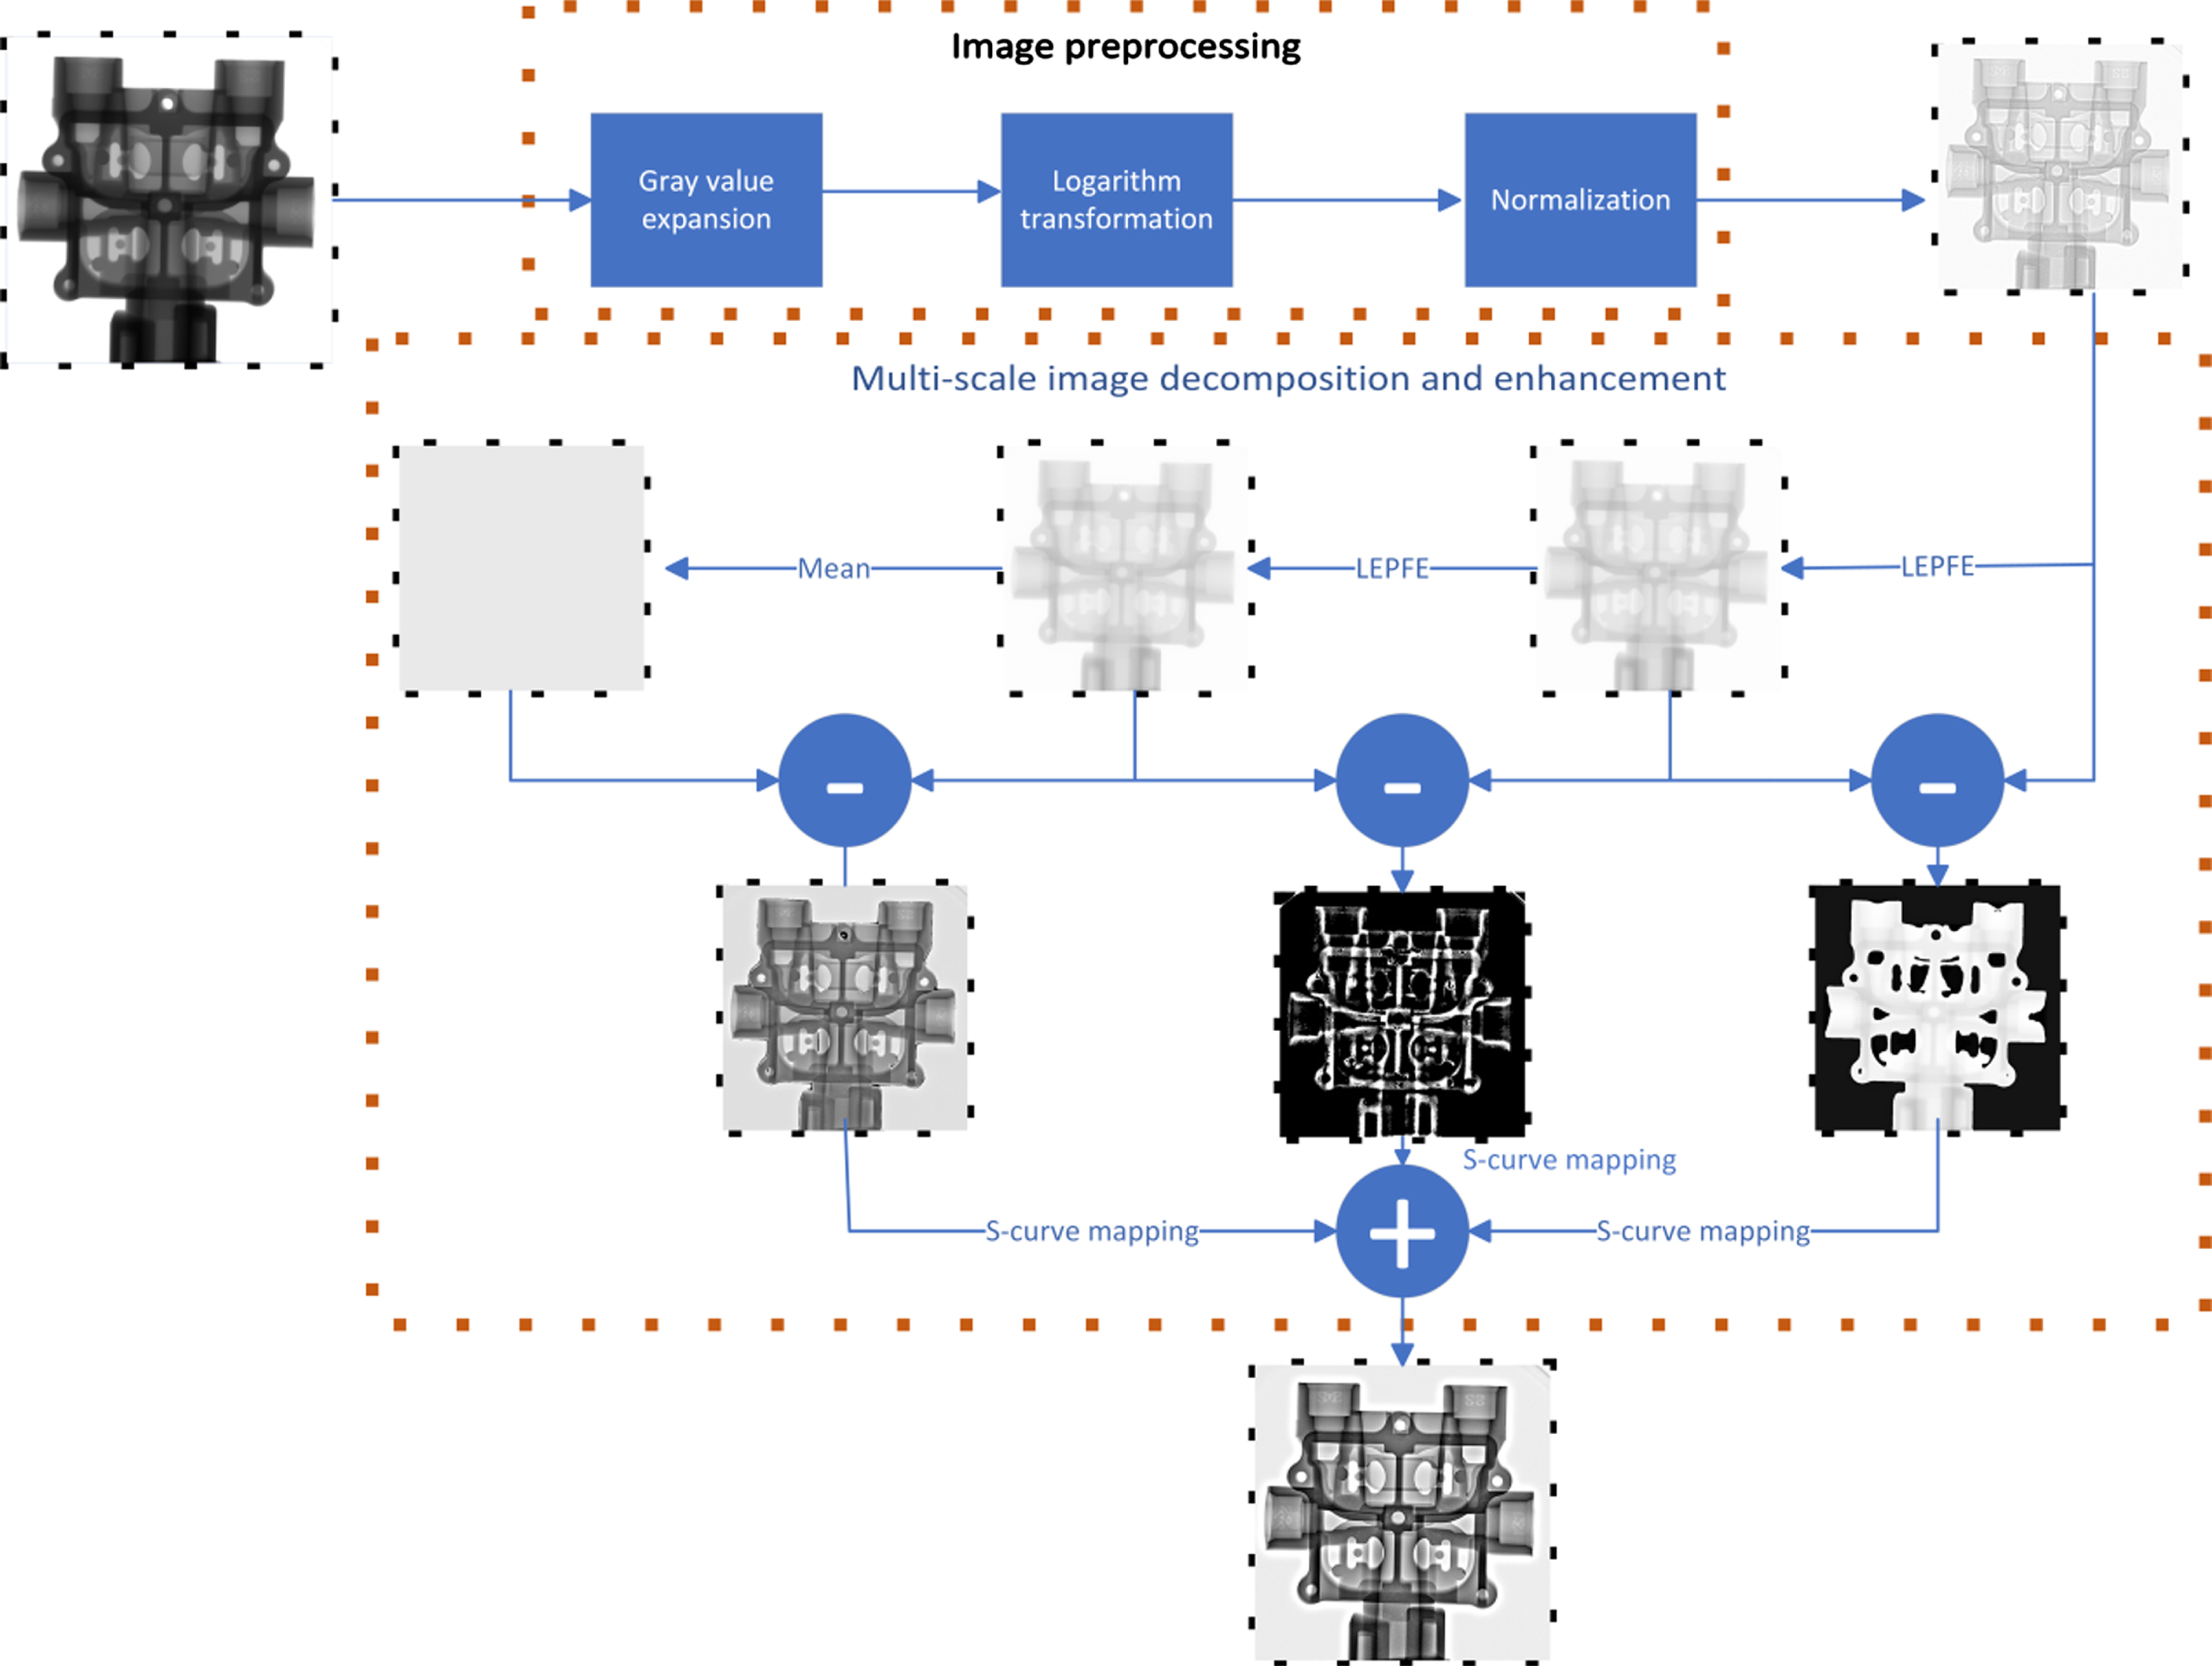
Framework of the proposed method.
Firstly, the grayscale value of the image is expanded to fully utilize the definition domain of the logarithmic transform. At the same time, to prevent the loss of information after logarithmic transformation, the gray value can be enlarged by 106, and then converted to the logarithmic transform, as illustrated below:
The purpose of logarithmic transformation of image gray value is to reduce the range of pixel value in high dynamic image. Next, P is scaled into the range [0,1] as follows:
When the gradient field is used in image processing, it can not only effectively enhance the image contrast but also retain the detailed edge features of the image well. Local fuzzy entropy can effectively identify the edge details of an image. The greater the local fuzzy entropy, the greater the useful information in the corresponding neighborhood. The gradient attenuation function of local fuzzy entropy is constructed by Equations (8) and (9):
When the balance coefficient in the local edge-preserving filter is small, the output image will closely resemble the input image. Here, we introduce a gradient field. In order to minimize the difference between the gradient of the input image and the output image, and to enhance the details, we enhanced the local preserving filter and introduced a new constraint term. At the same time, the gradient attenuation function of local fuzzy entropy is used to attenuate the gradient in the formula, changing the equation is changed from Equations (4) to (13)
Since each window has N pixel, each pixel is associated with N windows, so each window has a set of a
ω and b
ω, thus, N different values of B
i
are obtained. If these different values are averaged, a filtered image is obtained. The output of LEPFE filter is:
LEPFE filtering is applied to the attenuated image processed by the local fuzzy entropy attenuation function to generate the base layer image. This image includes the local mean and information regarding significant gradient changes in the original image, such as the edges of the workpiece in the X-ray image. The detail layer is obtained by calculating the difference between the attenuated image and the base layer image. The filter radius is increased gradually and iterated to decompose the image into base layers and detail layers of various scales. Suppose LEPFE
k
is the filter function, P represents the input image, and B
k
represents the basic layer after filtering. k represents the scale of decomposition, then the decomposition process is as follows:
Next, the detail layer is enhanced. Since the detail layer consists of a small gradient near zero value, we require a function to compress the large deviations far from zero and enhance the small deviations. The enhancement function selected in this paper is the S-curve mapping expressed in Equation (20), as illustrated in Fig. 2.
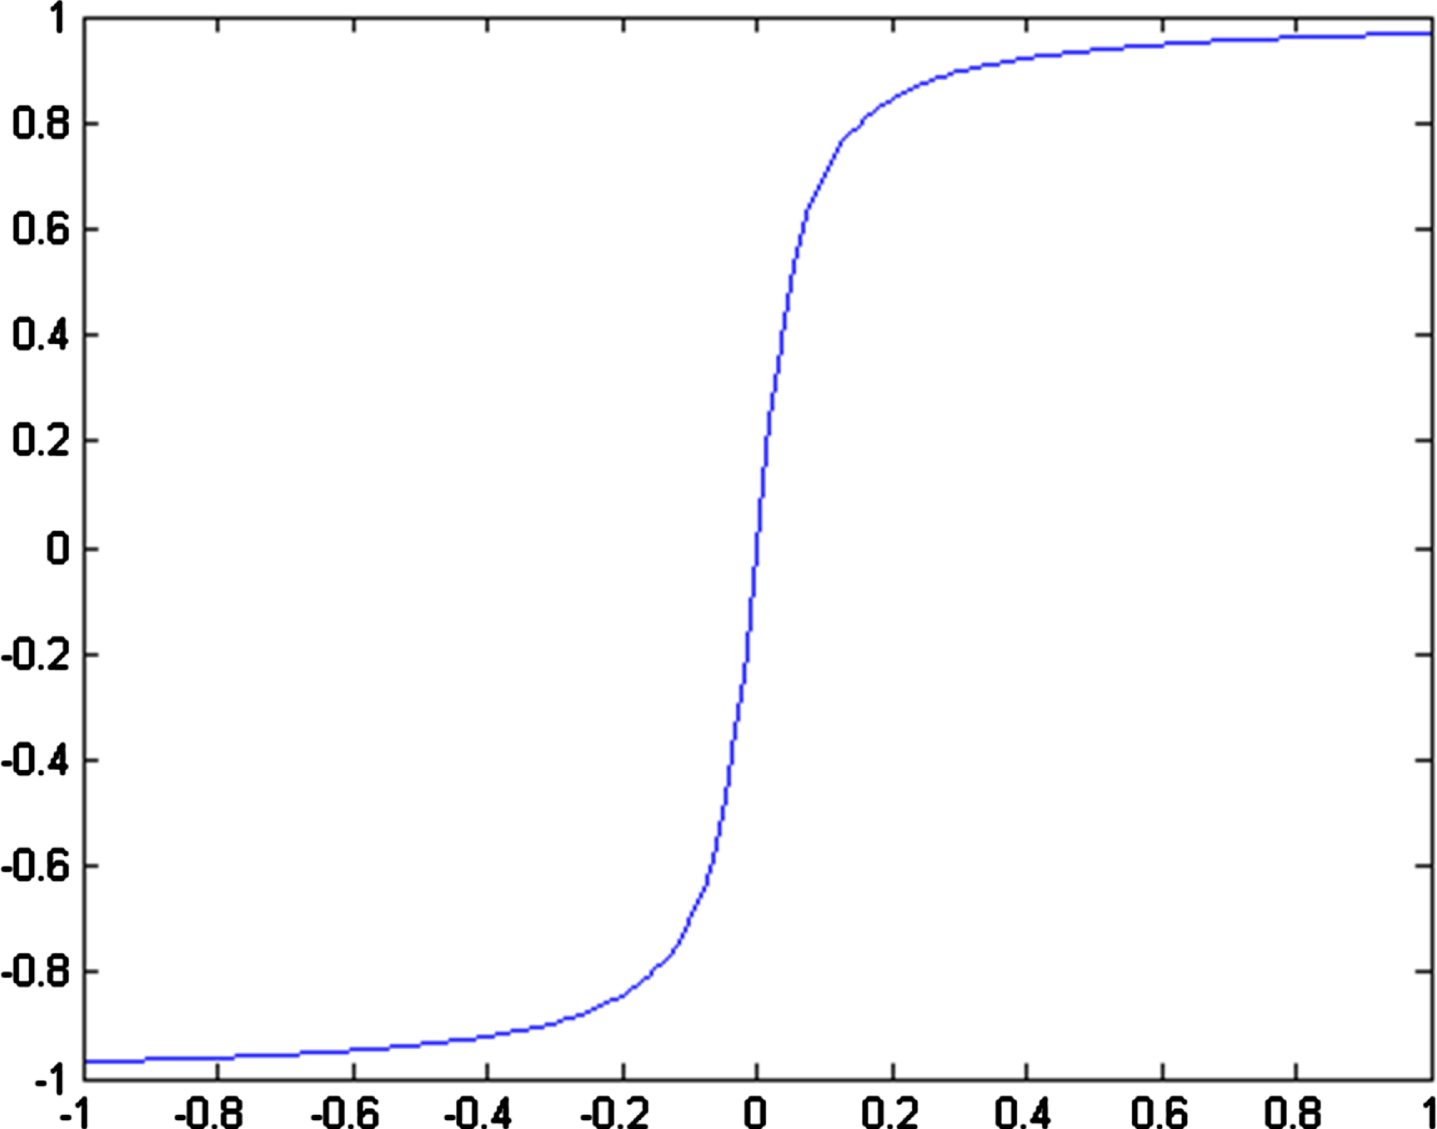
S-curve mapping.
We note that almost all sigmoid functions work well here, but those, whose slopes are too large near zero, may cause artifact enhancement. This function is proposed based on the perceptual changes of the human visual system to the image. It aims to avoid visual artifacts, enhance contrast, and effectively improve the detail layer.
Experimental settings election of filter parameters α′ and β
The selection of α′ and β is related to the sensitivity of the filter to the gradient, when α′ and β are small, more gradients are regarded as significant edges; when both α′ and β are large, only a small part of the larger gradients are regarded as significant edges, and the filtered image is too smooth. The influence of specific parameters is shown in Fig. 3, the original image on the left, and the remaining image changes with the change of parameters, in which α′ changes vertically and β changes horizontally. As α′ or β increases, the image becomes blurred, while as α′ or β decrease, more detail is preserved. We find that when α′=0.01, β=1, we can get a satisfactory result, while preserving the edge, the details are more complete.
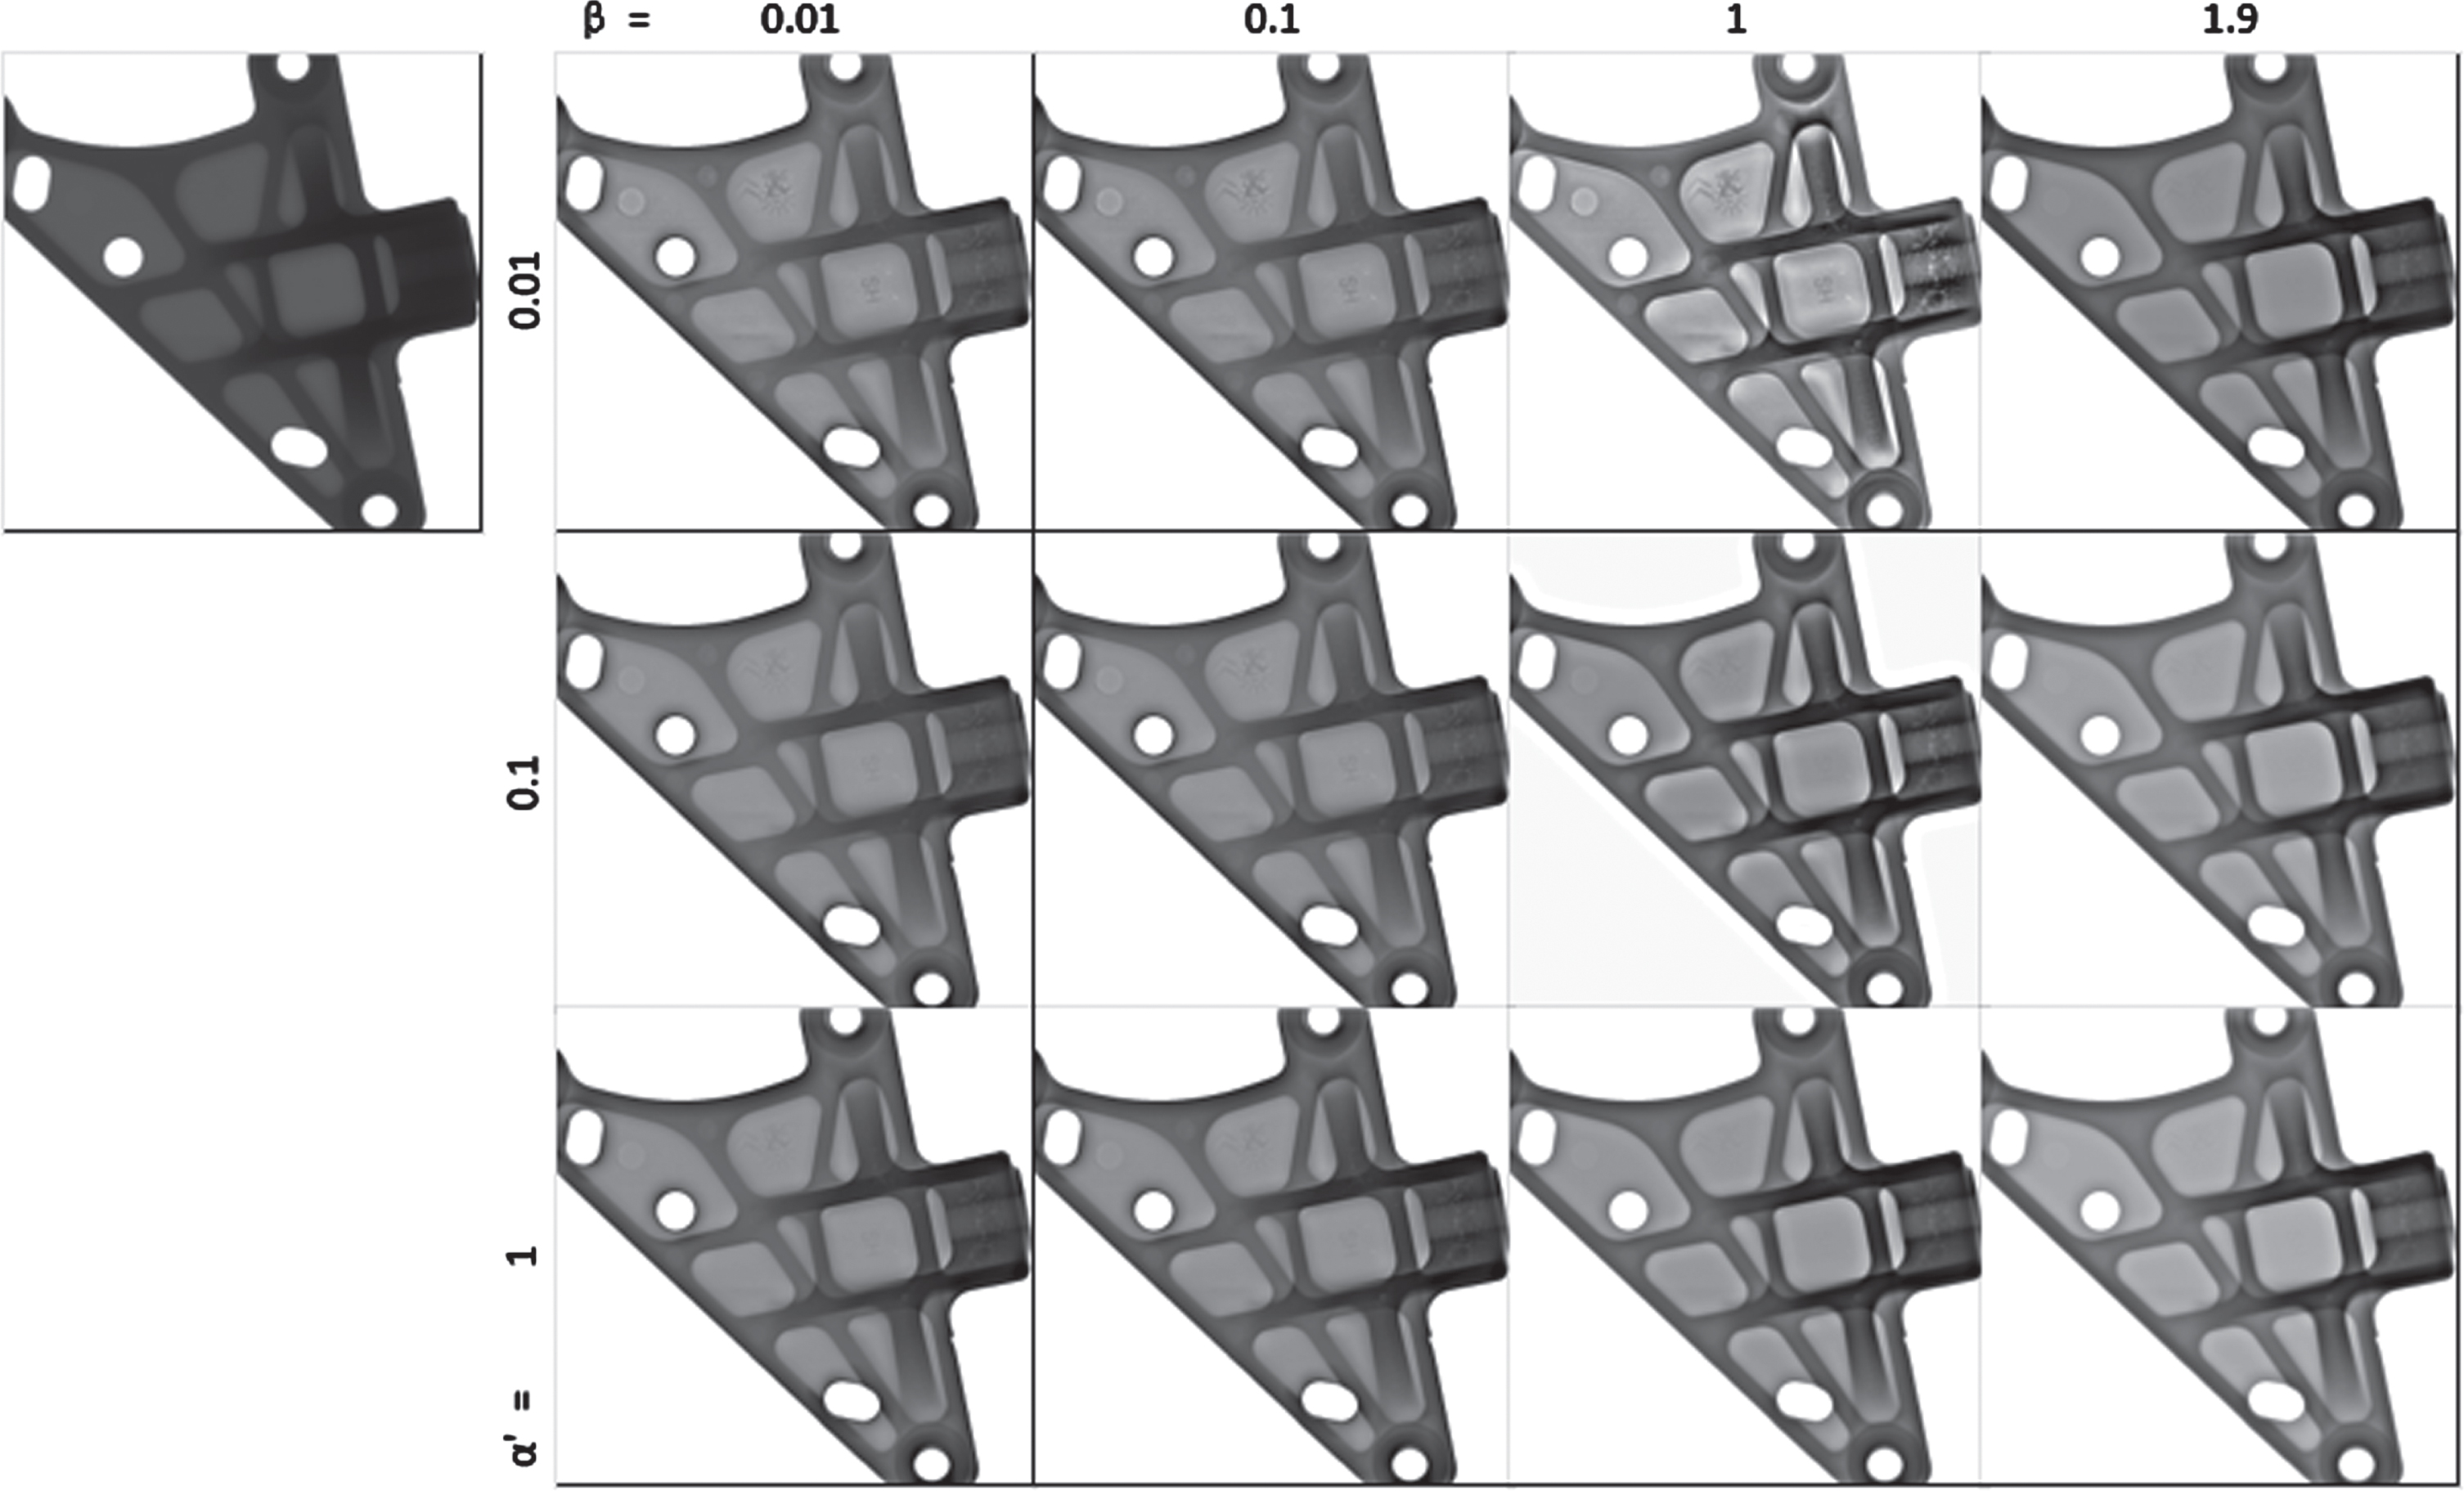
The result of LEPFE filter parameter changes.
In this paper we sets α’ = 0.01 and β = 1, it should be noted that the first window radius used in decomposition should be small enough to retain fine details. The influence of different radius choices is shown in Fig. 4. In this paper, the window radius of the first decomposition r = 2, and the window radius of the second decomposition r = 20, which can yield satisfactory results.

The result of various radius combinations. (a) Original image, (b) the first window radius r = 2, the second window radius r = 20, (c)the first window radius r = 2, the second window radius r = 200, (d)the first window radius r = 20, the second window radius r = 100, (e)the first window radius r = 20, the second window radius r = 200.
The hardware platform of the experiment is Intel(R)Core(TM) i7-9700 CPU @ 3.60 GHz, and the software platform is MATLAB. It has been verified that the selection of experimental parameters is as follows: when α′ ≈ 0.01, β ≈ 1, the filtering radius is selected as 2 and 20 in sequence. For the value of parameter γ, the reference [26] is used to adjust its size according to the different images.
In this paper, four types of aluminum alloy workpieces with different structures are used for experimentation, analysis and evaluation. All four images were made of 16bit high dynamic imaging with a size of 1024×1024, the scanning voltage is adjusted according to the type of workpiece, especially to prevent the voltage from being too high to break down the thinner area, resulting in overexposure of the thinner area.
To verify the effectiveness of the algorithm, the proposed method is compared with Khan’s non-uniform histogram construction method [37], Khan’s histogram construction method using PQ [11], Liang’s WLS filter method [21], Tang’s combined WLS and TV method [22], Yan’s deep learning method [32] and Gu’s LEP filter method [23]. It is evaluated through both qualitative analysis (subjective comparison) and quantitative analysis (objective comparison).
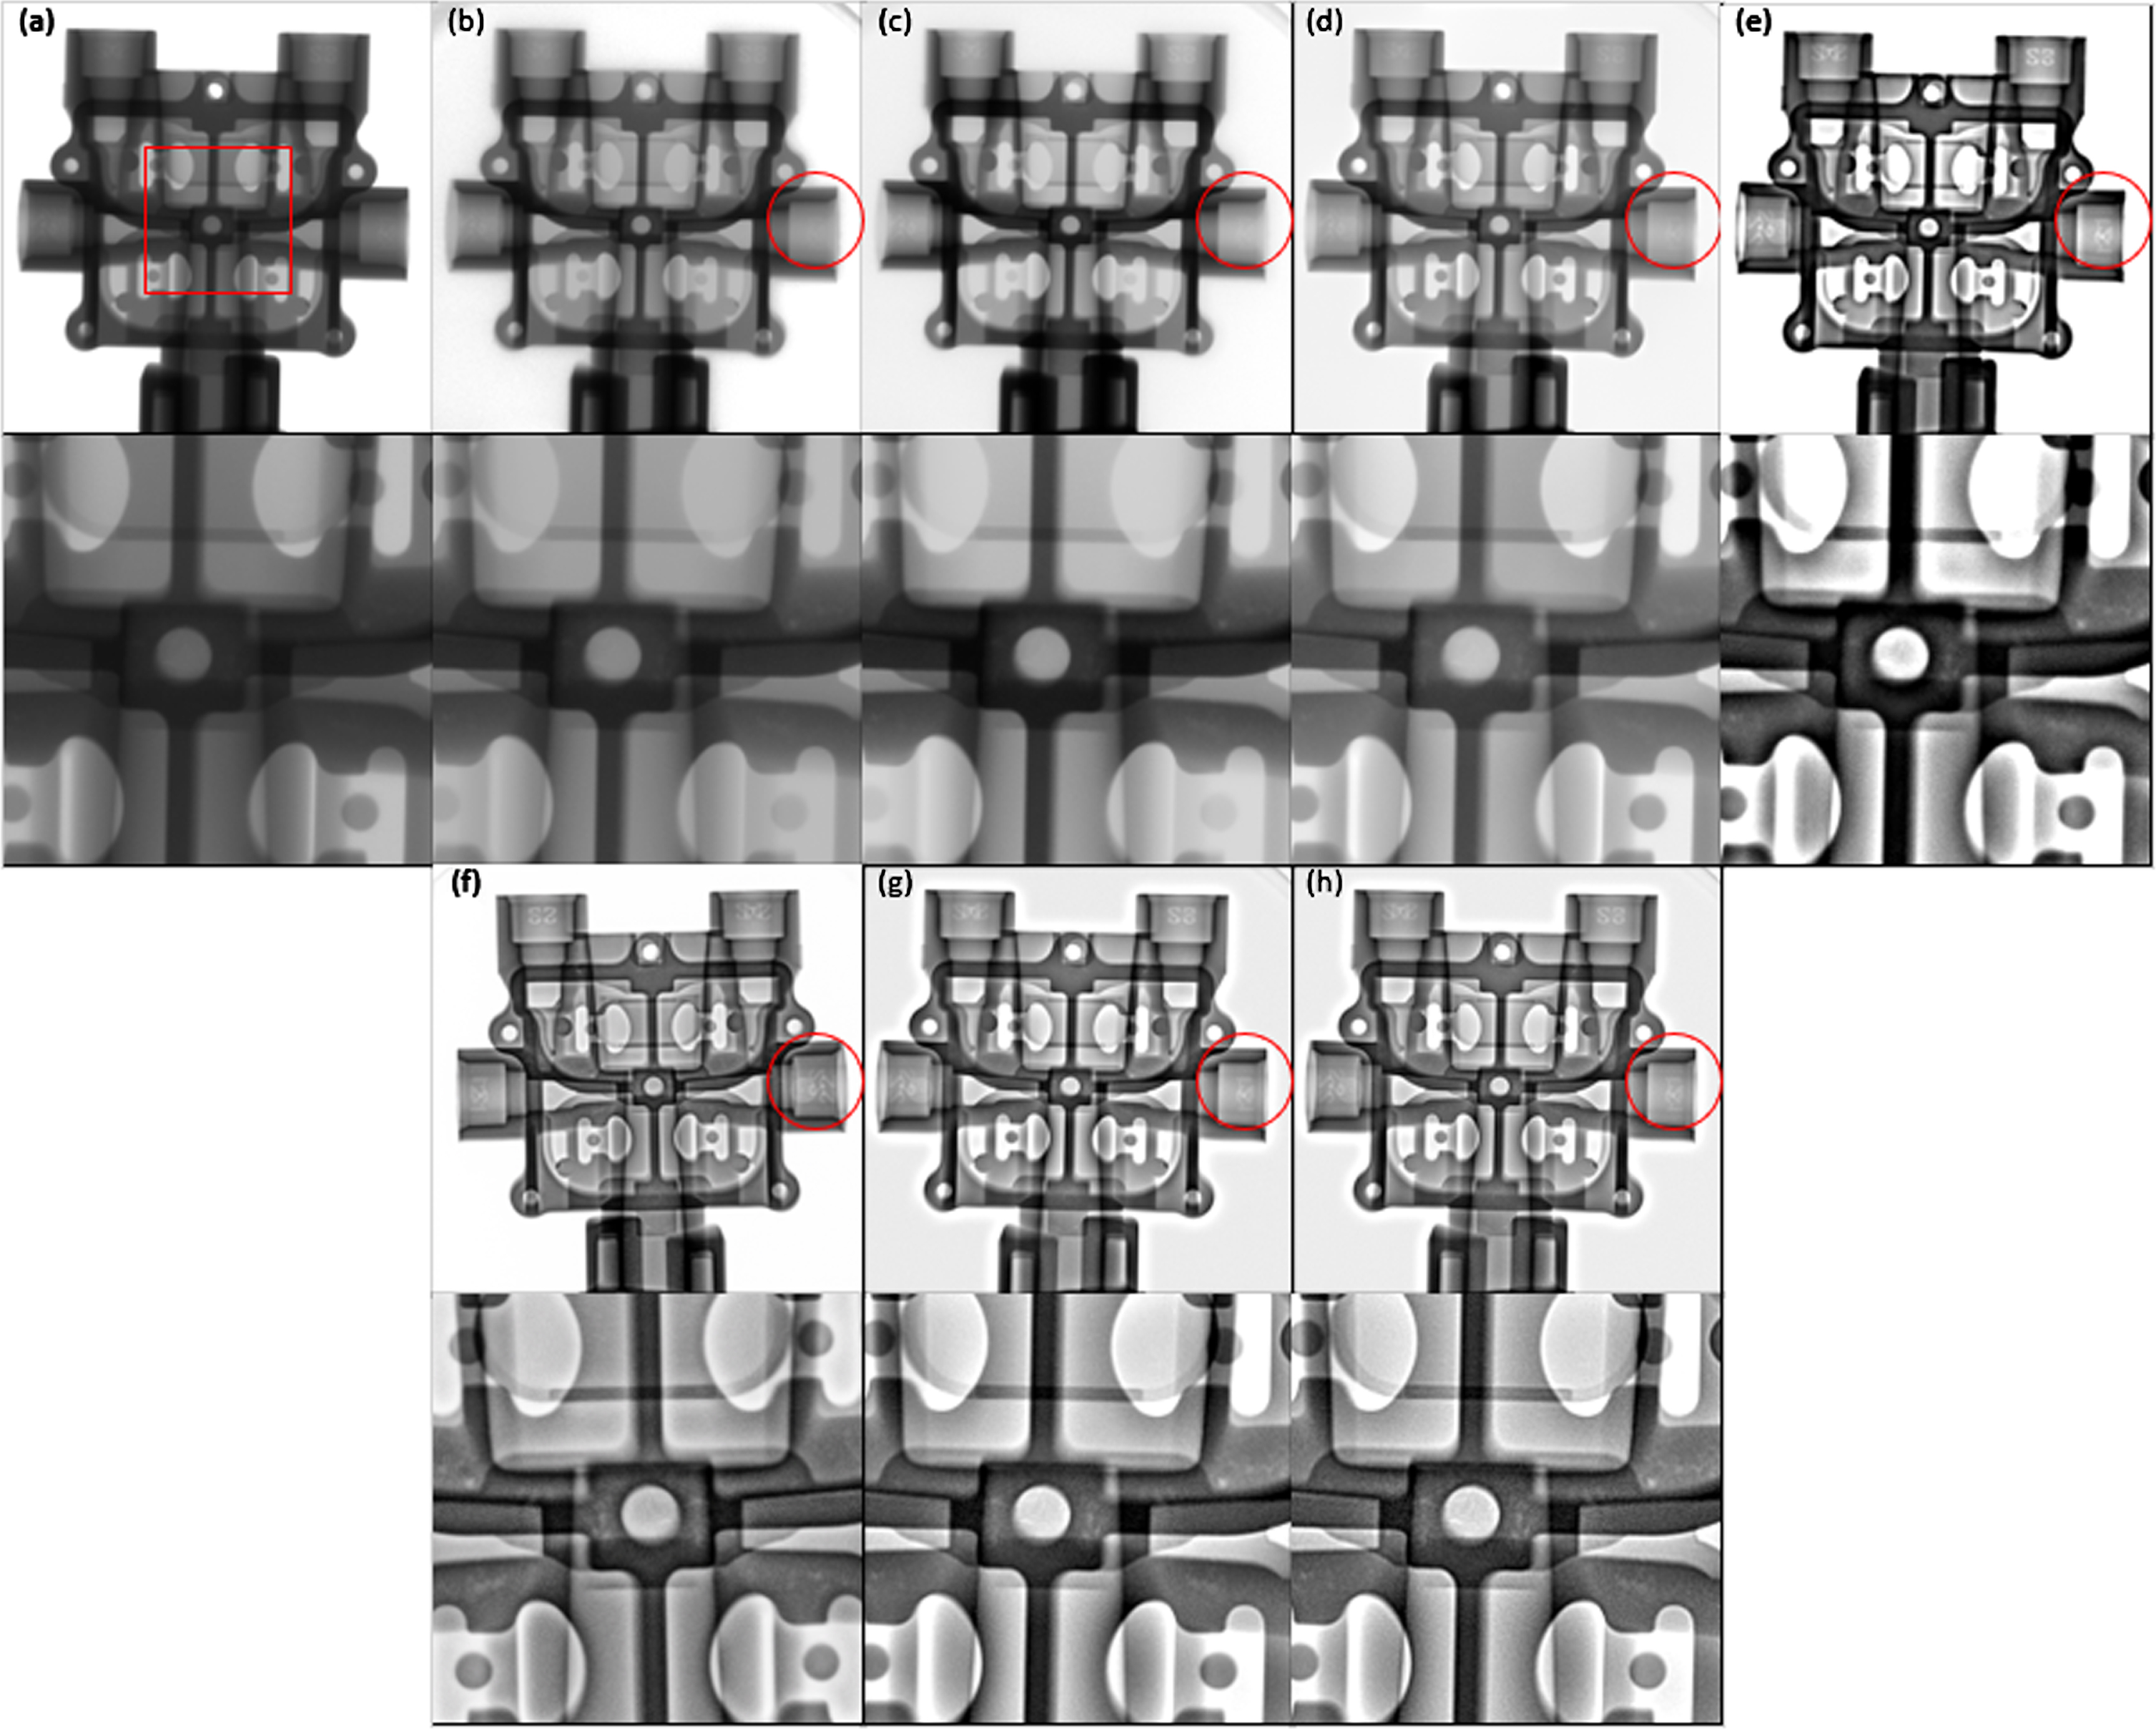
First, we conduct qualitative analysis. In the experiment, the original images of four different workpieces were enhanced by Khan’s non-uniform histogram construction method [37], Khan’s histogram construction method using PQ [11], Liang’s WLS filter method [21], Tang’s WLS and TV combined method [22], Yan’s deep learning method [32], Gu’s LEP filter method [23] and the algorithm proposed in this paper respectively, and the results are shown in Figs. 5–8.
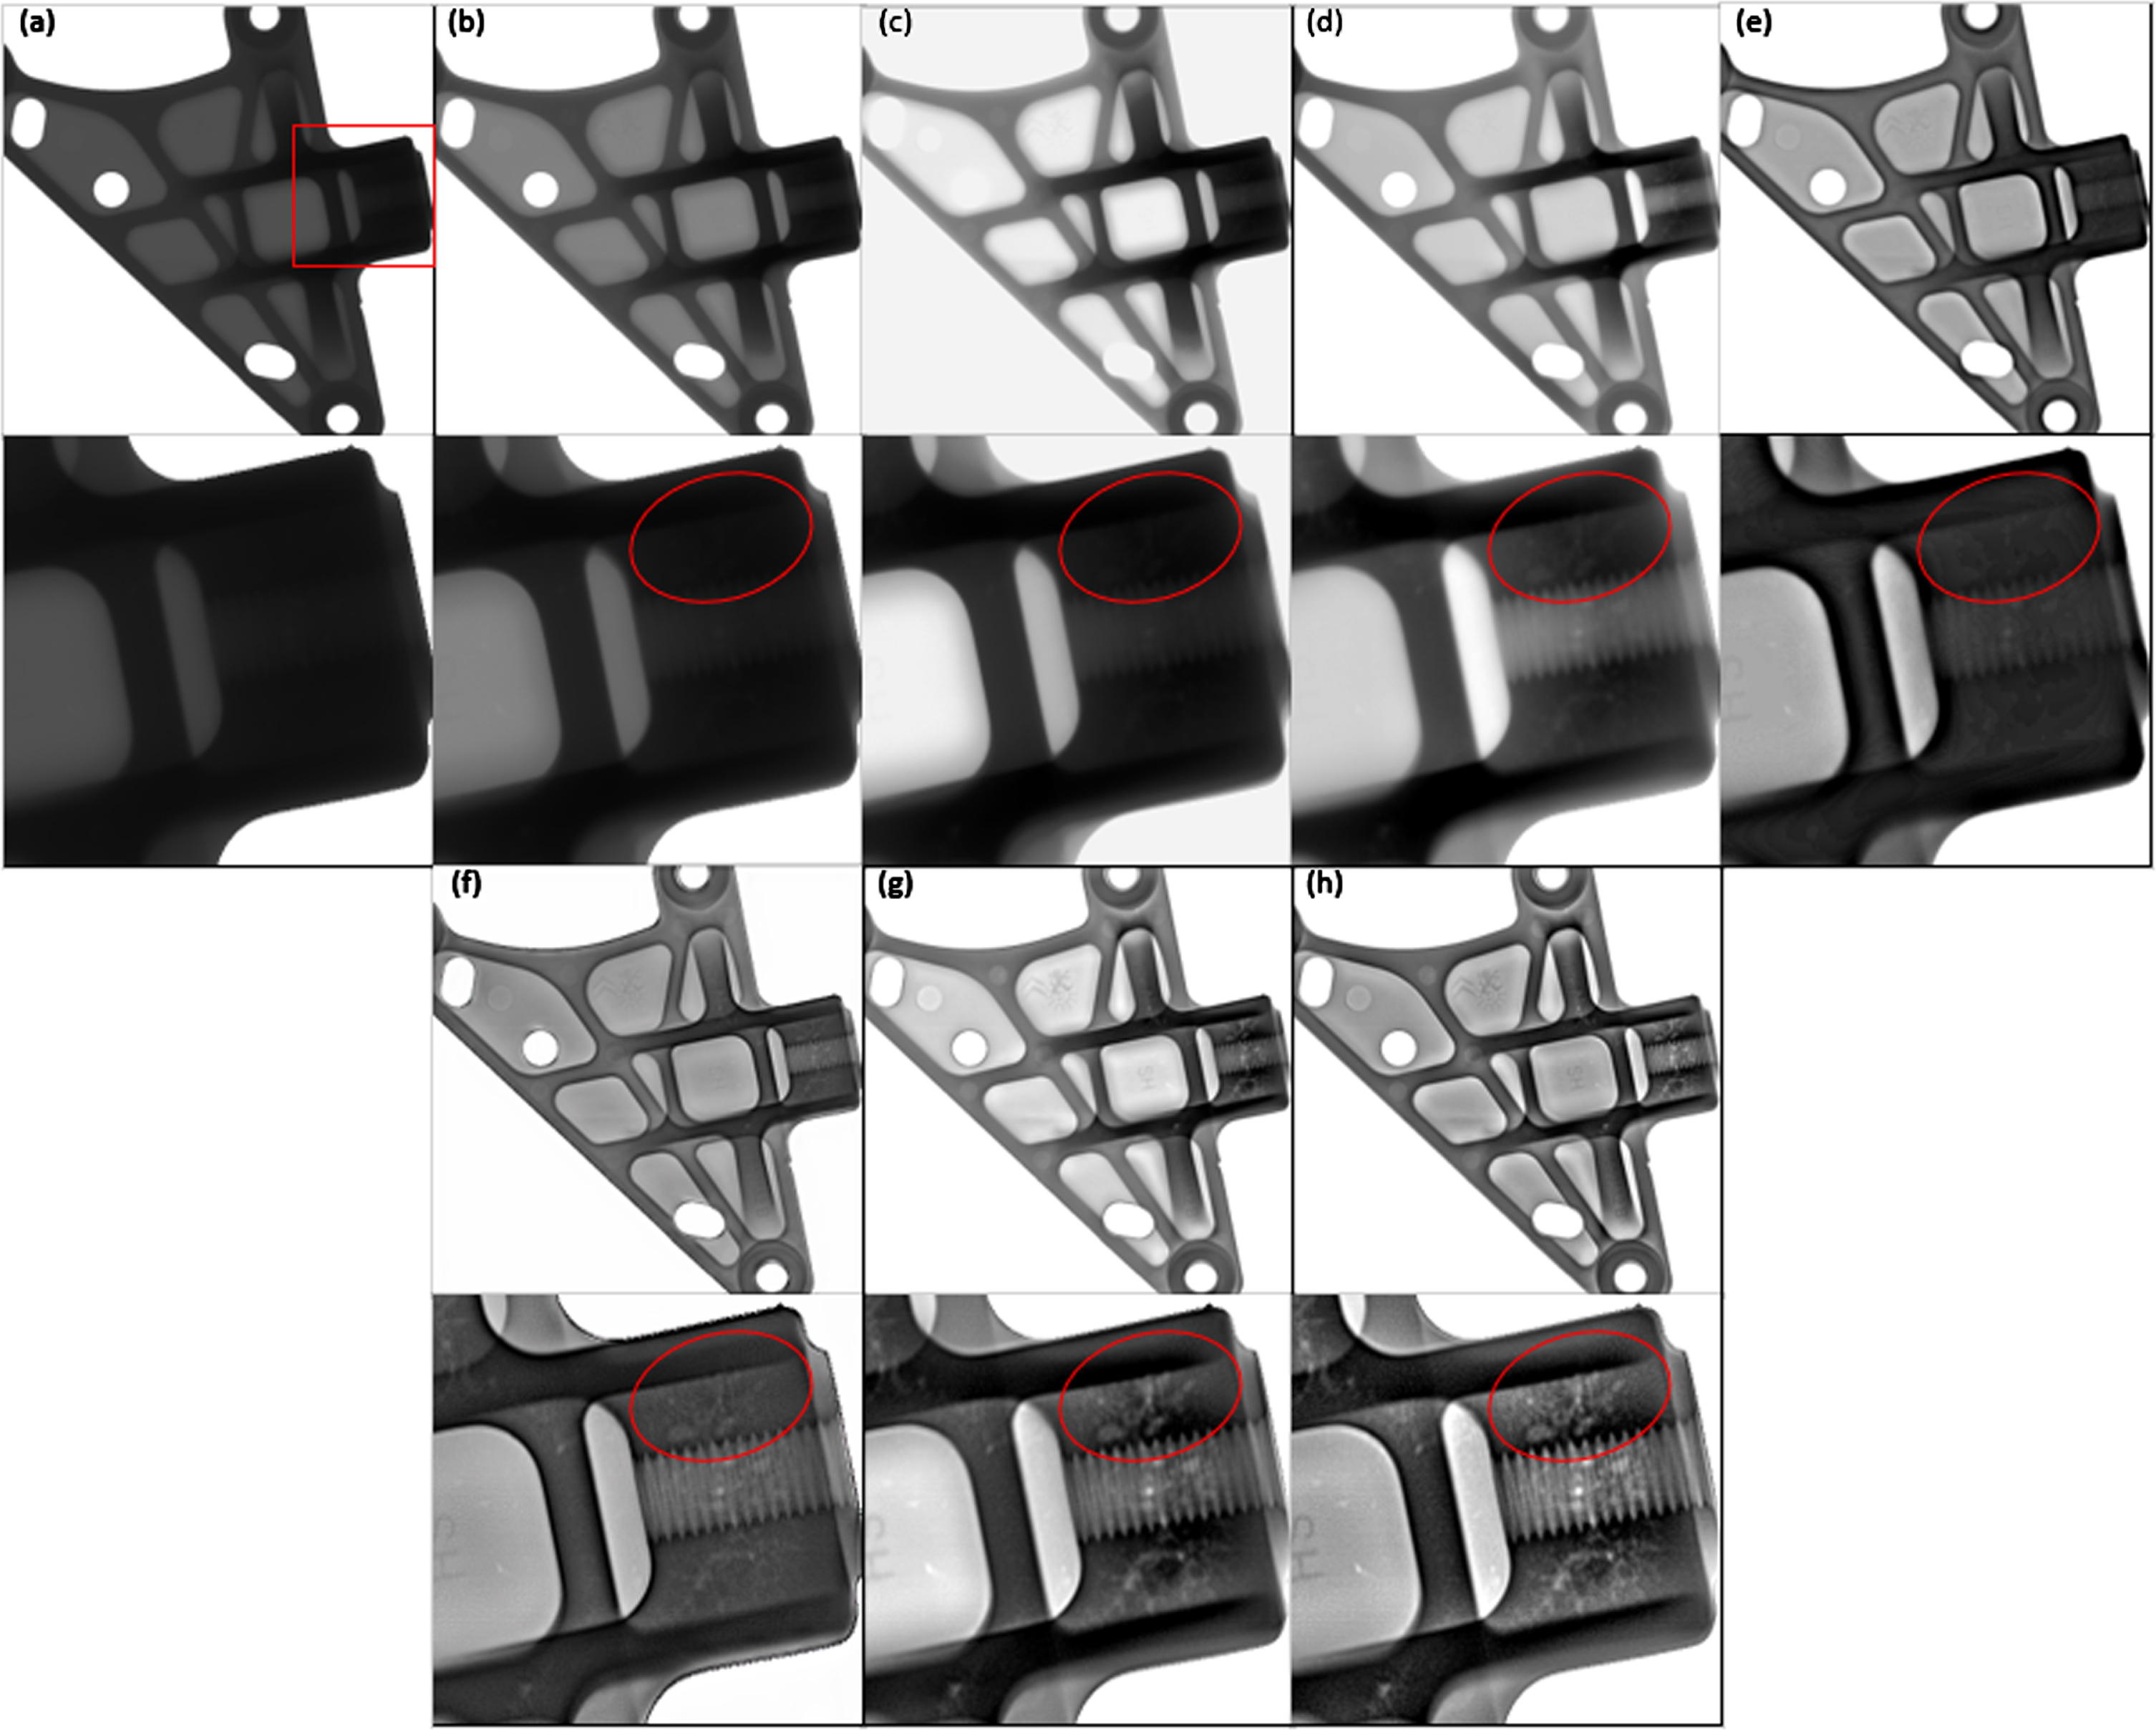
Output images for Case 1. The first row are (a) Original image, (b) Khan’s method, (c) Khan’s method, (d) Liang’s method, (e) Tang’s method, (f) Yan’s method, (g) Gu’s method, (h) the propose method. The second row are zoomed ROI images.
Output images for Case 2. The first row are (a) Original image, (b) Khan’s method, (c) Khan’s method, (d) Liang’s method, (e) Tang’s method, (f) Yan’s method, (g) Gu’s method, (h) the propose method. The second row are zoomed ROI images.

Output images for Case 3. The first row are (a) Original image, (b) Khan’s method, (c) Khan’s method, (d) Liang’s method, (e) Tang’s method, (f) Yan’s method, (g) Gu’s method, (h) the propose method. The second row are zoomed ROI images.
Figures 5–8 illustrate the processed X-ray images of four types of workpieces, respectively. To enhance observation, regions of interest (ROI), such as areas containing defects, are enlarged and displayed in the second row. These ROIs are marked by red rectangles in the original X-ray images. Due to the uneven thickness of the workpiece in the original image, there are small thickness difference in some areas. As a result, the image contrast after X-ray exposure is not high, leading to relatively fuzzy vision. In an area with a large thickness difference, rays can penetrate in some places while being impenetrable in others. The impenetrable areas are displayed as low gray values, causing the loss of effective information. The overall image has been significantly enhanced compared to the original image using Khan’s non-uniform histogram construction method. However, the overall contrast is low, and some details are not fully displayed. The output images of Khan’s histogram construction method using PQ, compared with the previous method, have been enhanced to better represent local information. However, overall, there is a significant loss of information, and the contrast is not high (refer to ROIs in Figs. 5(c)–8(c)). The output images of Liang’s method appear clearer than those obtained by Khan’s method. However, the details are not fully displayed (refer to ROIs in Figs. 5(d)–8(d)). Tang’s method combines WLS and TV regularization, and the output image details are clearer compared to the Liang’s method (refer to ROIs in Figs. 5(e)–8(e), the font information in the image can be displayed more clearly). The image edges are smoother, but the transition area of the workpiece thickness is not well reflected. In the images processed by Yan’s deep learning method, the overall workpiece structure is clear, and the difference in workpiece thickness is well reflected (refer to ROIs in Figs. 5(f)–8(f)), but the details are not clear enough (the font information in Fig. 6(f) and Fig. 7(f) is blurred). In the image using the Gu’s method, the contrast of the workpiece is significantly enhanced (refer to ROIs in Figs. 6(g)–8(g), the font information in the image is clearly displayed), and the thickness area of the workpiece is accurately represented. However, the transition area of the thickness transition area is not clearly delineated. Figures 5(g)–8(g) display the processed images using our proposed enhancement framework. The gray value of the workpiece transitions naturally, capturing details of in both thinner and thicker areas effectively, while eliminating the useless information in the background. In terms of key details and defect display (the part of the screw thread in Fig. 5(h), and the exposed defects in Fig. 7(h)), our method is significantly richer, clearer, and less noisy overall than other methods.
Quantitative analysis of the processed images
Secondly, we conduct quantitative analysis. The primary goal of enhancing industrial X-ray images is to clearly display the structure and defects of the workpiece. Therefore, this paper utilizes the average gradient (AG) [38], edge vacuum value (EAV) [39], Entropy [40], non-reference structure clarity (NRSS) [41] and other no-reference quality indicators to compare the performance of the methods. The first three indicators reflect the clarity of the image. The higher the value, the higher the clarity. The fourth indicator reflects the richness of the image information, the larger the value, and the richer the information.
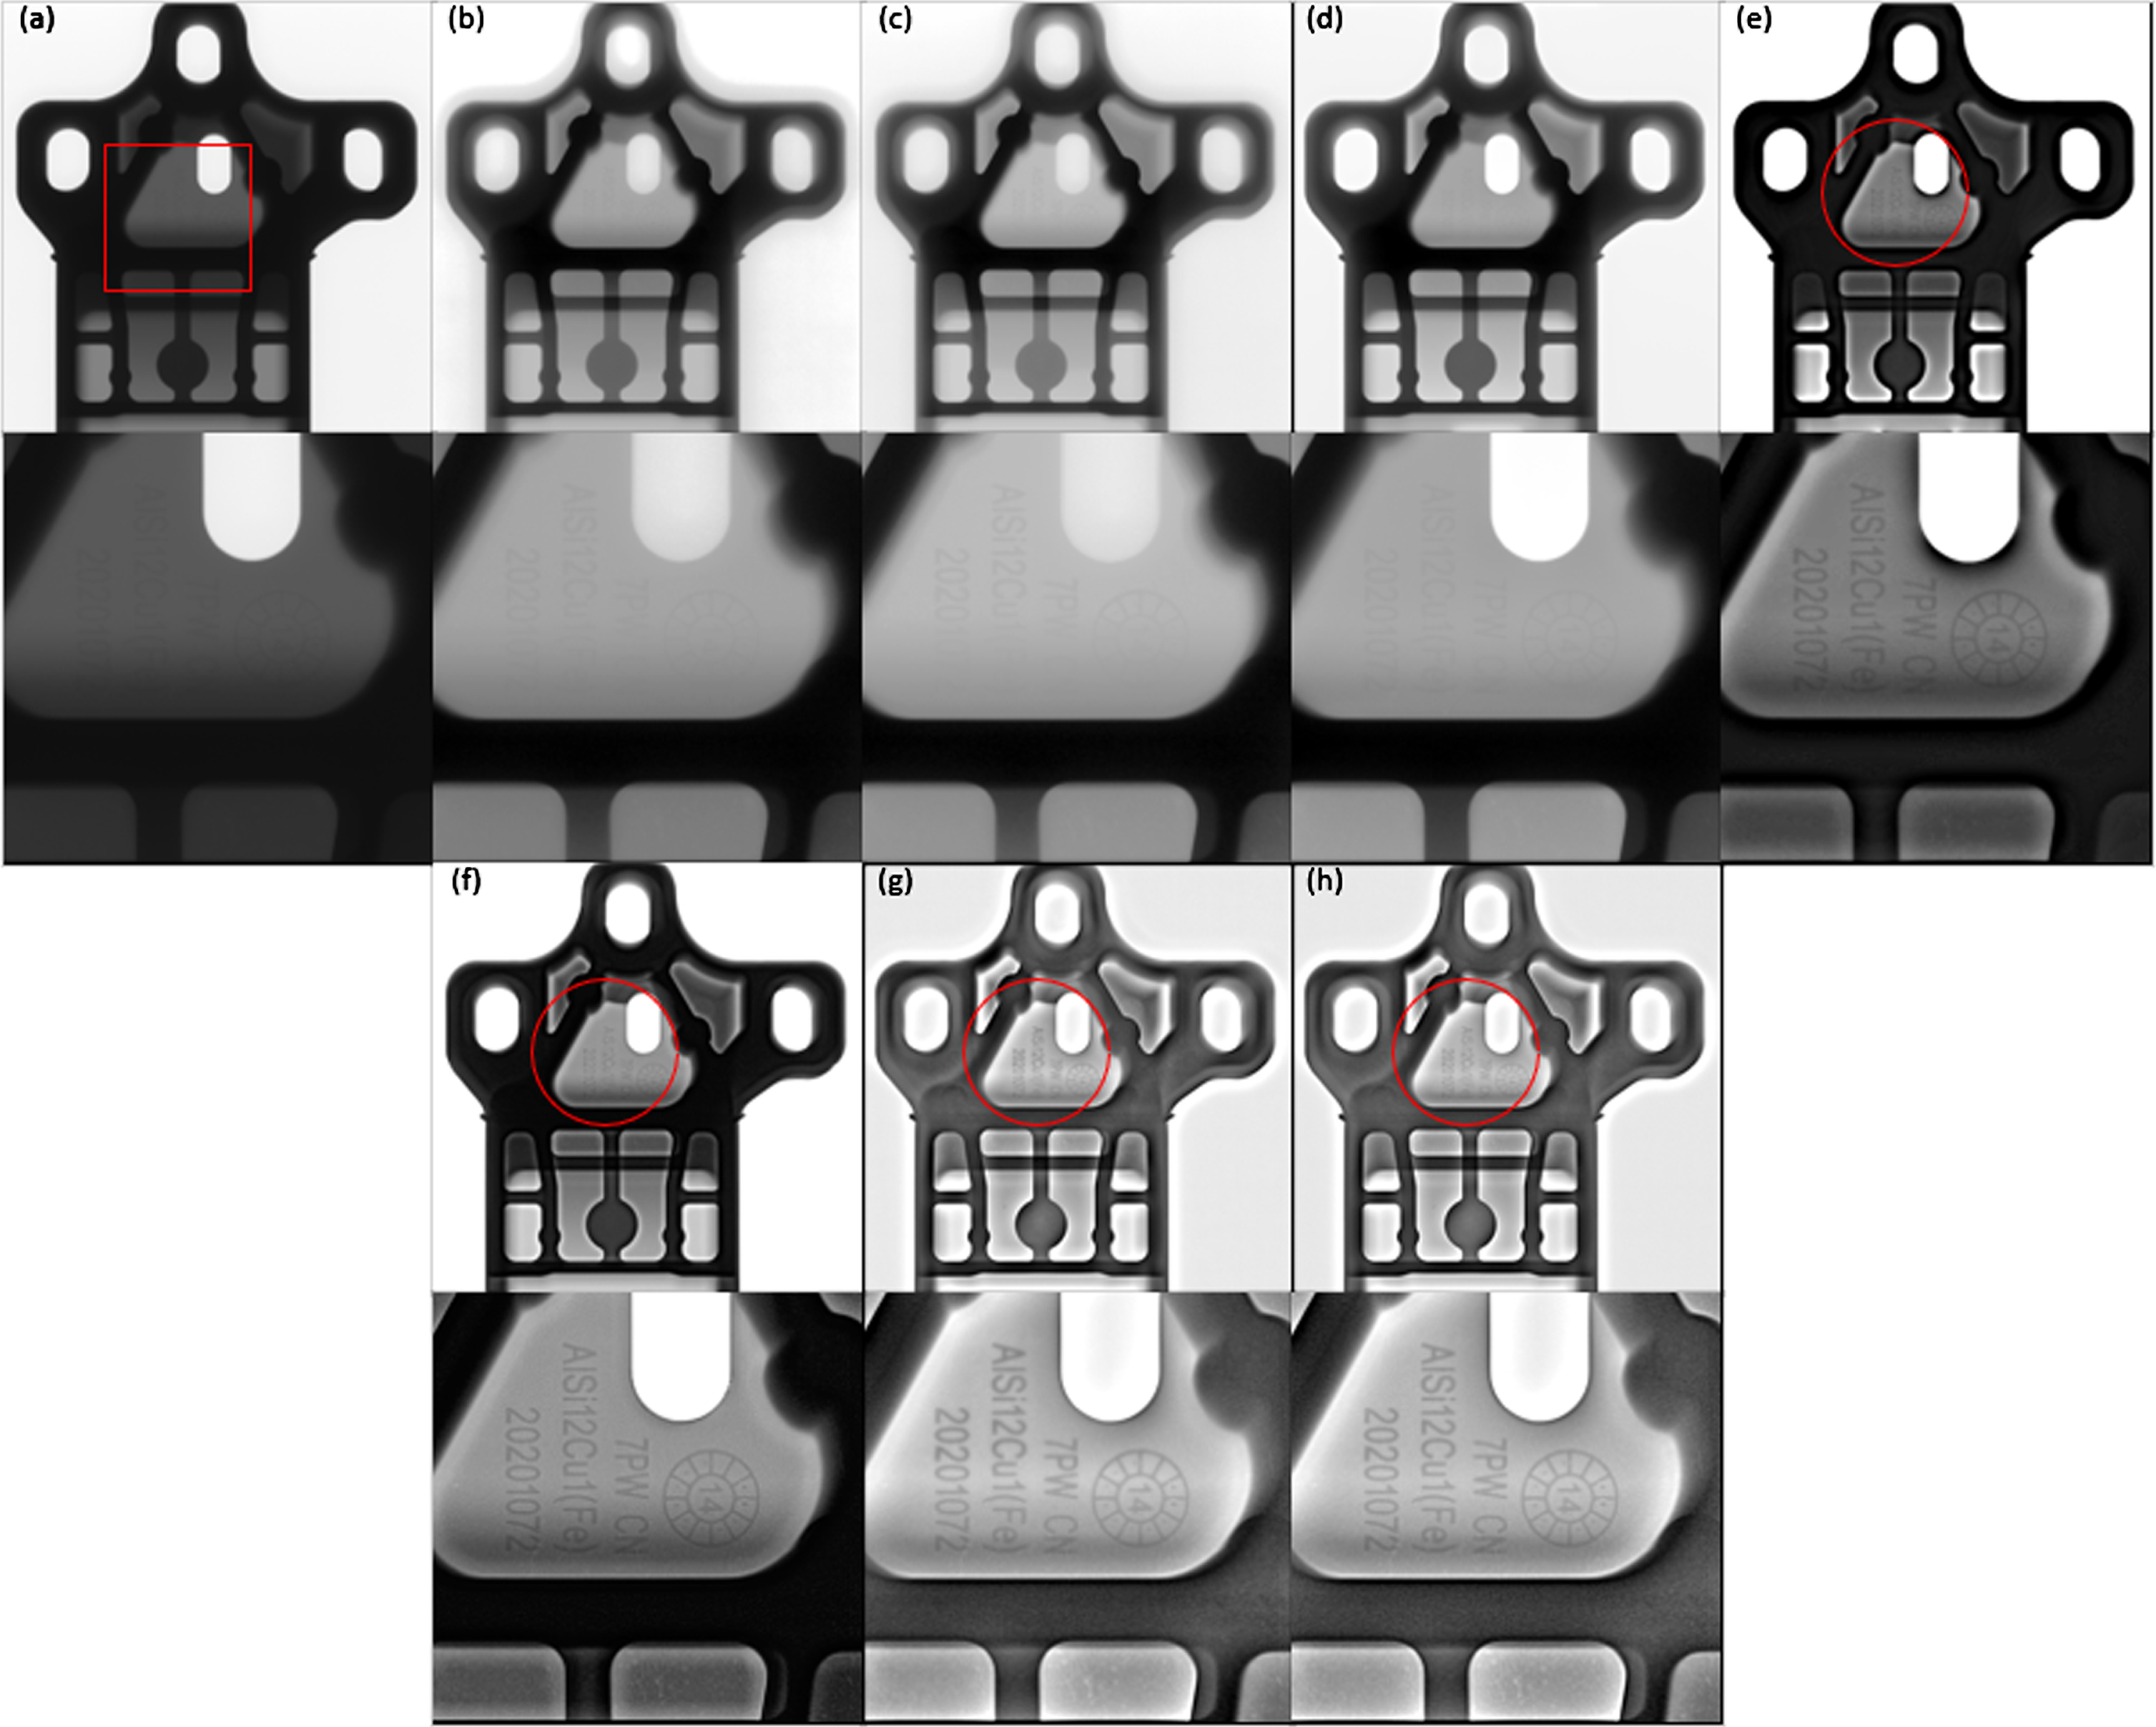
Output images for Case 4. The first row are (a) Original image, (b) Khan’s method, (c) Khan’s method, (d) Liang’s method, (e) Tang’s method, (f) Yan’s method, (g) Gu’s method, (h) the propose method. The second row are zoomed ROI images.
Table 1 displays the image quality analysis after processing the original images by all methods. As can be seen from Table 1, in the five experiments, most indicators of objective evaluation of the proposed method are superior to those of other algorithms. This suggests that the images processed by the proposed algorithm exhibit higher clarity and contrast. In summary, compared with other methods, the proposed algorithm has a significant enhancement effect. The processed image is clearer, and more information can be obtained.
In this paper, a multi-scale industrial X-ray image enhancement algorithm with LEPFE filter is proposed to address the challenges of high dynamic range in X-ray images and the complexity of displaying intricate structures. In order to reduce the dynamic range of the image, the algorithm first performs logarithmic preprocessing on the X-ray image to obtain the normalized image. Secondly, the gradient attenuation function based on local fuzzy entropy is used to adjust the gradient of the normalized image. The gradient is then incorporated into the energy function of the local edge-preserving filter as a constraint term. Since the local fuzzy entropy is less sensitive to noise than the gradient, the attenuation function can effectively suppress the noise amplification during the process of gradient compression. In addition, by incorporating the gradient as a constraint term, the image can better preserve its effective edge information, thereby ensuring the protection of details and the suppression of noise. Finally, the image is decomposed into multiple scales, and the resulting detail layers are fused using S-curve mapping enhancement to further improve the contrast. Experiment shows that the proposed algorithm has obvious enhancement effect compared with other algorithms mentioned above. The images processed by this algorithm exhibit higher contrast and provide more comprehensive information.
However, the incorporation of local fuzzy entropy in this algorithm has resulted in a decrease in image processing speed, requiring adjustments to various parameters. In future work, we will enhance the algorithm, incorporate GPU processing, optimizing the algorithm’s operational speed, and developing adaptive parameters to enhance the algorithm’s practicality.
Footnotes
Acknowledgment
We would like to thank the editors and reviewers for improving the content of this article. This work was supported in part by the Patent Transformation Project of Shanxi Province (202302006), and in part by the Fundamental Research Program of Shanxi Province (202303021211148, 202103021224204, 202203021211100).