
Abstract
BACKGROUND:
Due to the incomplete projection data collected by limited-angle computed tomography (CT), severe artifacts are present in the reconstructed image. Classical regularization methods such as total variation (TV) minimization, ℓ0 minimization, are unable to suppress artifacts at the edges perfectly. Most existing regularization methods are single-objective optimization approaches, stemming from scalarization methods for multiobjective optimization problems (MOP).
OBJECTIVE:
To further suppress the artifacts and effectively preserve the edge structures of the reconstructed image.
METHOD:
This study presents a multiobjective optimization model incorporates both data fidelity term and ℓ0-norm of the image gradient as objective functions. It employs an iterative approach different from traditional scalarization methods, using the maximization of structural similarity (SSIM) values to guide optimization rather than minimizing the objective function.The iterative method involves two steps, firstly, simultaneous algebraic reconstruction technique (SART) optimizes the data fidelity term using SSIM and the Simulated Annealing (SA) algorithm for guidance. The degradation solution is accepted in the form of probability, and guided image filtering (GIF) is introduced to further preserve the image edge when the degradation solution is rejected. Secondly, the result from the first step is integrated into the second objective function as a constraint, we use ℓ0 minimization to optimize ℓ0-norm of the image gradient, and the SSIM, SA algorithm and GIF are introduced to guide optimization process by improving SSIM value like the first step.
RESULTS:
With visual inspection, the peak signal-to-noise ratio (PSNR), root mean square error (RMSE), and SSIM values indicate that our approach outperforms other traditional methods.
CONCLUSIONS:
The experiments demonstrate the effectiveness of our method and its superiority over other classical methods in artifact suppression and edge detail restoration.
Introduction
Limited-angle X-ray CT is restricted by the scanning object or scanning environment, such as the imaging of breast CT [1], C-arm CT [2] and dental CT [3]. Typically, it can only scan the object within a limited scanning range, resulting in incomplete collection projection data.In limited-angle CT image reconstruction problems, the images reconstructed by filtered back projection (FBP) [4, 5], which will have obvious artifacts near the edges. For some traditional iterative image reconstruction algorithms [6], such as Simultaneous Algebraic Reconstruction (SART) [7] and Expectation Maxmization (EM) [8], it is challenging to reconstruct images with clear edges under conditions of incomplete projection data.
To solve the problems of artifacts and detail loss in reconstructed images. Regularization strategie has been proposed for image reconstruction of limited-angle CT. A regularization strategie is to reduce the ill-posed problem by adding prior information. TV minimization [9, 10] use the ℓ1-norm of the amplitude of image gradient as the regularization term, can effectively preserve the edge of the image. However, for limited-angle reconstruction problem, the reconstruction image may be oversmooth and there will still be some distortion near the edge with TV minimization. To further suppress artifacts and preserve the edges, some variants of total variation [11–16] have demonstrated that they can to mitigate the over-smoothness of reconstructed images to a certain extent. For example, an adaptive-weighted TV (AwTV) [14] algorithm is proposed, which considers the anisotropic edge property. The AwTV algorithm can adaptively adjust the weights according to the local image-intensity gradient and the edge details can be effectively preserved. The iteratively reweighted anisotropic TV (ATV) method [15] which combines the reweighted technique with ATV, can effectively utilize the property of image sparsity. The local anisotropic total variation repair method of sinogram (LATV) [16] leverages the continuity of local gradients in the sinogram to improve local high-frequency characteristics that are blurred by conventional TV algorithm. However, although these variants mitigate the problem of distortion, the reconstruction image will still be oversmooth. To emphasize the sparsity of image under the gradient transform and preserve the edge of the image while suppressing artifacts, the ℓ0-norm of the image gradient is taken as a regularization term [17], the ℓ0 minimization of image gradient was proposed, which can effectively preserve the image edge, but some subtle details of image will still be lost. To further suppress artifacts and restore image edge details, some regularization reconstruction methods utilize wavelet frame to suppress the artifacts [18–22], as models based on wavelet frame can sparsely approximate the piecewise smooth function like images. For example, combining wavelet frame with ℓ0 minimization, where the ℓ0-norm of wavelet coefficients is penalized. Guided image filtering (GIF) [23] is a smoothing operator with edge preserving, which is effective in many applications,including edge-aware smoothing, detail enhancement, joint upsampling. To further improving the reconstructed image quality, the GIF was introduced into the reconstruction process [24–26]. The method that couples ℓ0 minimization with GIF [25] can effectively preserve the image edge while smoothing the image. And by leveraging the advantages of GIF, the method [26] transfers reconstructed results from the TV method to the ℓ0-norm of a gradient image-based total variation minimization (TVL0) method. This method better preserves edge structures and suppresses limited-angle artifacts and noise.
To solve most regularization reconstruction models as above are usually utilize the following two optimization problems [9, 27–29]:
The scalarization method refers to a parameter-dependent single-objective optimization problem, which is proposed for MOP. For the scalarization method, the selection of the parameter is very important, and using scalarizations may destroy the structure of the optimization problem. Non-scalarization methods may have advantages for optimization problems, such as lexicographic optimality [32]. In lexicographic optimization, we need to consider the lexicographic order when comparing objective functions. We first arrange the objective functions according to their absolute importance, minimizing the objective function f k in the sorted order and using the optimal objective values of f i , i < k as constraints, until the single-objective optimization problem has a unique optimal solution.
In recent years, many deep learning (DL) methods have been proposed for CT image denoising and have achieved many encouraging results [33, 34]. The residual encoder-decoder convolutional neural network (RED-CNN) [35] is a combination of autoencoder, deconvolution network and shortcut connection, which has shown potential in suppressing artifacts and preserving image structure. A method based on a generative adversarial network (GAN) with Wasserstein distance and perceptual similarity has been proposed that can effectively suppress artifacts [36]. However, DL needs a lot of data to train the network, and in many applications, label data can not be obtained in large quantities and conveniently. Using a CNN or DL to solve a CT related inverse problem is no better than the traditional regularization methods [37]. Therefore, there are still many challenges in applying neural networks to CT reconstruction, so we only consider traditional optimization algorithms.
In this paper, we proposed a new method for limited-angle CT image reconstruction using a multiobjective optimization model guided by the image quality index. Unlike traditional scalarization methods that solely minimize the objective function, our method introduce the SSIM to guide the optimization process. The multiobjective optimization model considers the data fidelity term and ℓ0-norm of the image gradient as two objective functions. Using traditional scalarization algorithms to solve the MOP aims to minimize the objective function, however, the minimum objective function value does not represent the highest image quality. For example, if the gradient is zero, the image is black. Therefore, we employ an iterative method instead of using a scalarization algorithm to solve the model. Our method is structured into two steps, and repeat these two steps in an iteration format, and the result of the previous step is used as the initial value of the next step. The first step is to optimize the data fidelity term by SART, then calculate the SSIM value between the reference image and the iterative points that are solved by SART. The optimization process will be stopped when the image quality degrades. Then, the SA algorithm [38] is introduced to accept the degradation solution in a probabilistic form to avoid getting into the local minimum. If we accept the degradation solution, continue to repeat SART, otherwise, we use the GIF method to produce an alternative solution because GIF can effectively preserve the image edges before proceeding to the second step. The second step is to take the result of the first step as a constraint, then use ℓ0 minimization to optimize ℓ0-norm of the image gradient, the SSIM, SA algorithm and GIF are still introduced to guide the optimization process as in thefirst step.
The remainder of this paper is organized as follows. In Section 2, the proposed multiobjective optimization model and solving algorithm are presented, along with the related methods required for our algorithm. In Section 3, simulated experiment and real data experiments are conducted to evaluate the effectiveness of the proposed method. In Section 4, the conclusions are presented.
The discrete reconstruction problem of limited-angle CT is formulated as:
The guided image filtering [23] is an explicit image filter, which can be used to preserve image edges, suppress artifacts and enhance details. The method is shown as follows:
The key to defining guide filter lies in assuming a local linear model between the guidance image I and the filtering output image. Within the square window ω
k
of radius r of the pixel k, the linear transform can be formulated as:
The ℓ0-norm of the image gradient minimization can effctively suppress streak artifacts and preserve the image edges. Thus, we considered the ℓ0-norm of the image gradient as one of the optimization objective functions. To control the data errors, we incorporate the data fidelity term as another objective function.
To further improve the quality of the reconstructed image, we proposed a multiobjective optimization model for limited-angle CT image reconstruction, which is formulated as follows:
where
The scalarization methods are usually used to solve multiobjective optimization problems, such as weighting method and ɛ-constraint method. However, there are some shortcomings of scalarization method. For example, using weighting method to solve the MOP Equation (10) cannot find all Pareto optimal solutions. The other nonscalarizing methods, such as lexicographic optimization, require considering the MOP in a hierarchical manner. Moreover, both methods are based on minimizing objective function under constraints, but the minimum objective function does not mean the highest image quality. For example, minimum-∥ ∇ f ∥ 0 can result in the reconstructed image being oversmooth.
During the reconstruction process, we introduce the SSIM as a key evaluation criterion for the reconstructed images. SSIM evaluates image quality by focusing on the preservation of structural information. Reconstructed images often suffer from artifacts or oversmoothing, which can obscure fine structural details. Compared to other image quality indices like Peak Signal-to-Noise Ratio (PSNR) and Root Mean Square Error (RMSE), SSIM is more sensitive to structural details. In practical applications, the clarity and structural integrity of the reconstructed image are crucial. By prioritizing structural aspects, SSIM ensures that images with higher structural quality and clearer details are produced during the optimization process. The GIF we introduced after the degradation point is rejected, one of the significant advantages of GIF is its ability to smooth images while effectively preserving edges and fine details. Traditional smoothing methods, such as mean filtering and Gaussian filtering, often blur edges and lose critical details. GIF, by using a guided image, can reduce noise while maintaining the structural integrity of important features, which is crucial for high-quality image reconstruction.
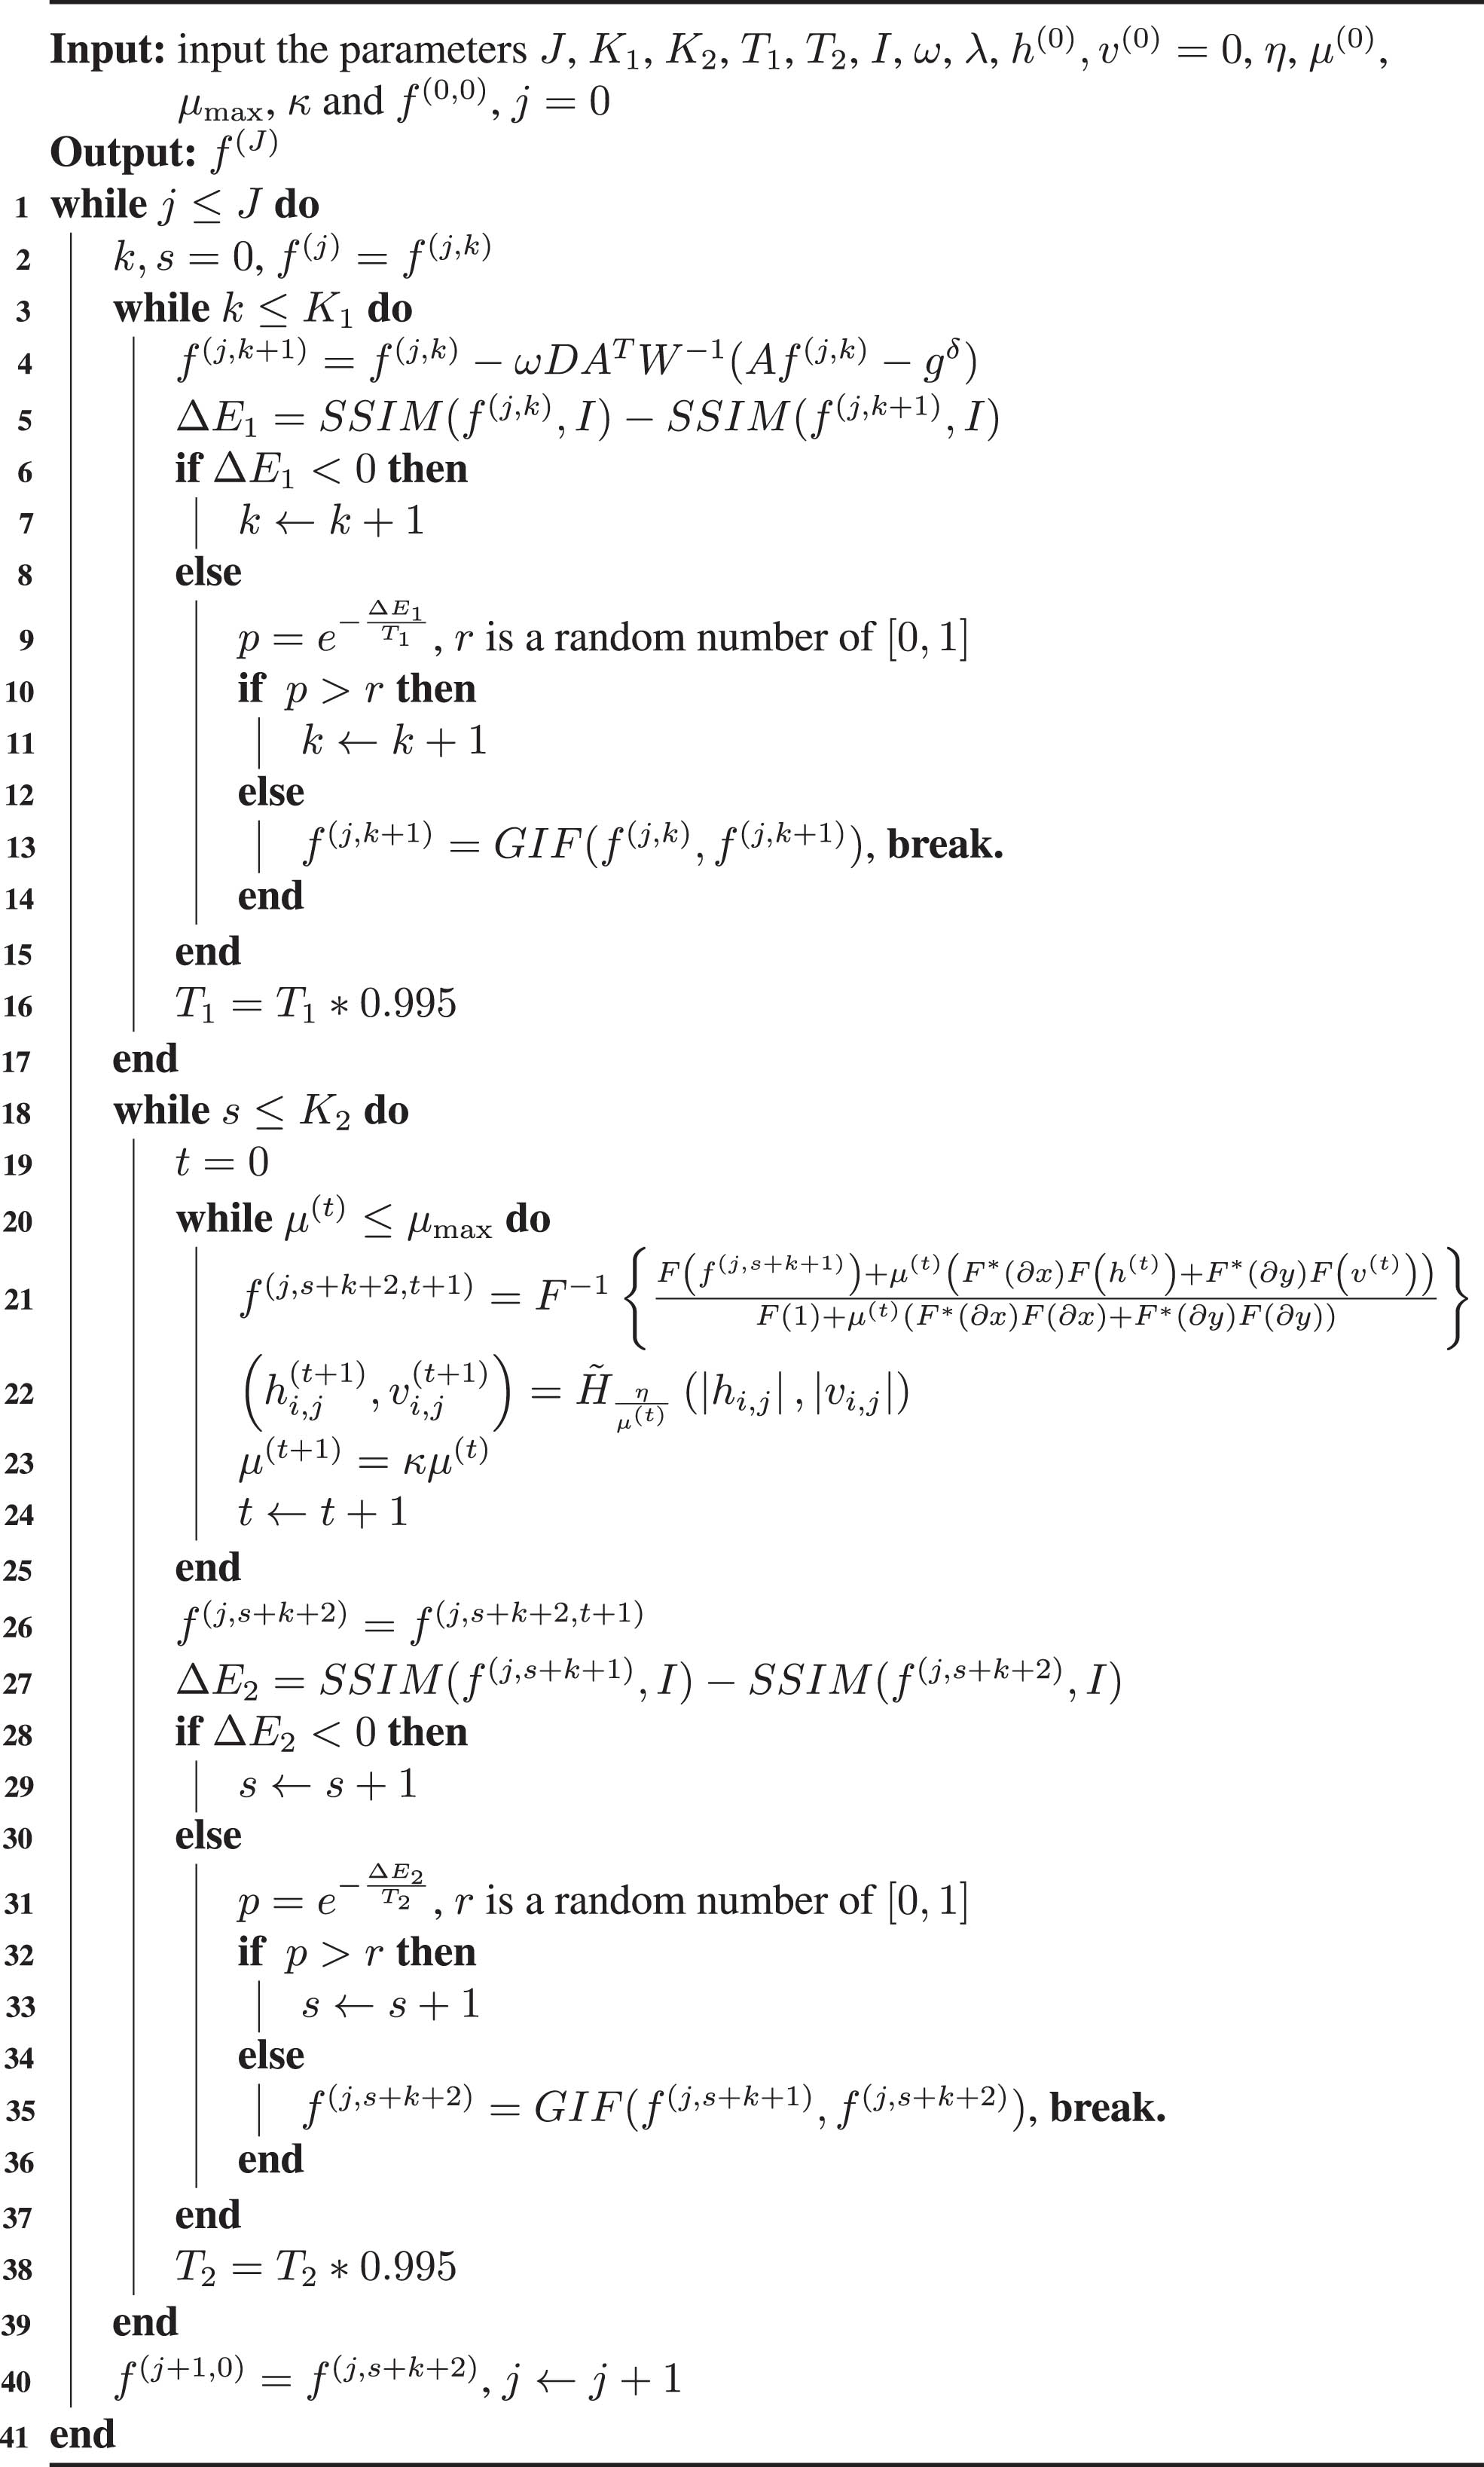
In this paper, we address solving MOP Equation (10) directly through an iterative method. During the optimization process, SSIM is introduced to guide the optimization of the objective function. When the SSIM values degrade, the SA algorithm is introduced to probabilistically accept the degraded solution to avoid getting trapped in a local minimum. Subsequently, the GIF is introduced to further improve image quality. The detailed process is as follows:
Then, we introduce the image quality index SSIM, SA algorithm and GIF to guide the optimization process. We calculate the SSIM values between reference image I and iteration point f(k+1), f(k) respectively (note it as SSIM (f(k+1), I) and SSIM (f(k), I)). If the image quality improves during the iteration process, i.e., if SSIM (f(k+1), I) is lager than SSIM (f(k), I), we repeat the iteration process Equation (12). Otherwise, we accept the iteration point f(k+1) in the form of probability to avoid getting into local minimum, the form of probability is as follows:
If accept the iteration point f(k+1), we repeat the iteration process Equation (12), otherwise we introduce guided image filtering [23] to improve image quality, which is given as follows:
To solve the problem Equation (17), let t be the iteration index. The problem Equation (17) is decomposed into the following two sub-problems, solved for (h, v) and f by alternating iteration method respectively:
To solve the sub-problem Equation (18), the solution can obtain by
To solve the sub-problem Equation (19) with h(t) and v(t), the analytical solution can obtain by:
We repeat these two steps in iteration format, and take the result of the previous step as the initial point of the next step in the iterative process until the stop conditions are met. The proposed method minimize one of the multiobjective function according to maximize the image quality index (abbr. MM), and the SA algorithm is introduced to avoid falling into a local minimum by accepting the degradation solution probabilistically. If the degradation solution is rejected, stop the optimization process and use the GIF method to produce an alternative solution, which can further improve the image quality, as GIF can effectively protect image edges. The proposed method is named as MM-SA-GIF method and will be shown in Algorithm 1.
In this section, simulated data and real projection data are utilized to evaluate the performance of the proposed MM-SA-GIF method in suppressing artifacts and preserving image edges. To validate the effectiveness of the proposed method, the classical iterative reconstruction methods TV minimization [10], ℓ0 minimization [17], ℓ0-GIF method [25] and lexicographic optimality of TV method (LO-TV) are used for comparison. All parameters are chosen to obtain a higher quality reconstruction image by trial and error.
Simulated NCAT phantom experimental results
To evaluate and validate our proposed algorithm, a NCAT (NURBS-based Cardiac-Torso) phantom with size of 512 is used in simulated experiment, Fig. 1 shows the NCAT phantom and the photon count for poisson noise is 1.0 × 10⁵. The geometry scanning parameters for simulated CT imaging system are listed in Table 1.
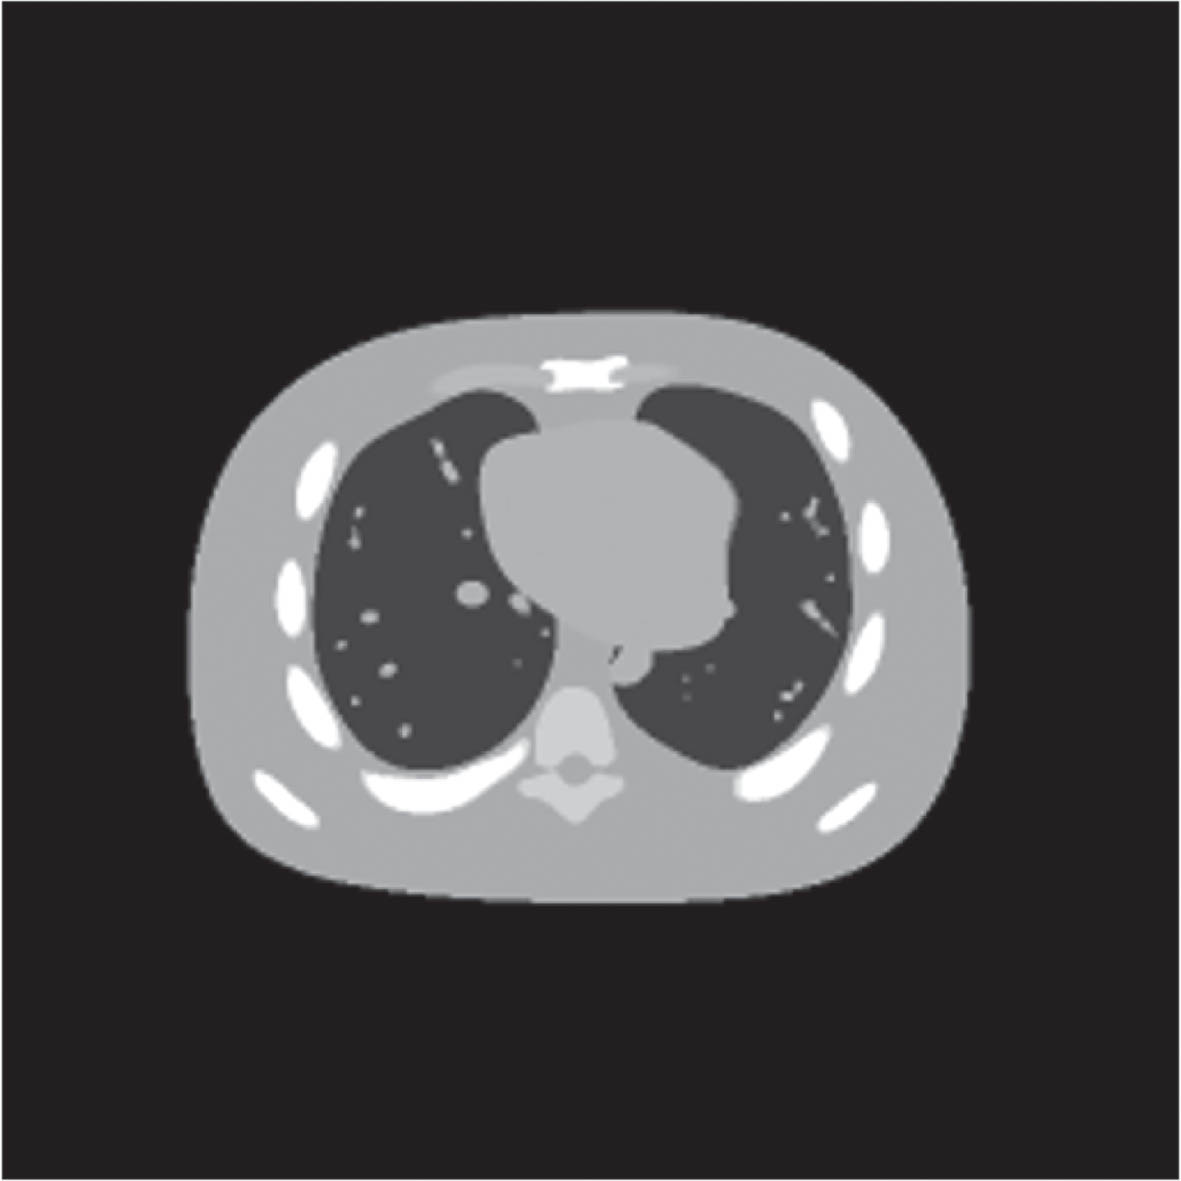
NCAT phantom.
The geometrical scanning parameters
Three scanning ranges [0, 120°] and [0, 150°] are investigated. The reconstruction parameters for each algorithm are shwon as follows: for TV minimization: the parametes, N TV = 20, α TV = 0.2; For ℓ0 minimization: (1) for the scanning range [0, 120°], the smoothing parameter η = 0.0025, κ = 15; (2) for the scanning range [0, 150°], η = 0.003, κ = 15. Among the above two methods, the stopping condition is that reaches the number of iterations N = 5000 and 4000 for the scanning ranges [0, 120°] and [0, 150°] respectively. For ℓ0 - GIF method: (1) for the scanning range [0, 120°], N = 3500, η = 0.007, κ = 15, r = 4, ɛ = 1.1 × 10⁻⁵; (2) for the scanning range [0, 150°], N = 2500, η = 0.006, κ = 15, r = 4, ɛ = 1.1 × 10⁻⁵. For LO-TV method: (1) for the scanning range [0, 120°], N SART = 500, N TV = 300, α TV = 0.0045; (2) for the scanning range [0, 150°], N SART = 500, N TV = 300, α TV = 0.005; For our method MM-SA-GIF, the reconstruction parameters are given in the following Table 2. It is important to note that for our proposed method, the set number of iterations is the maximum number of iterations. During the optimization process, an interruption mechanism will be employed to terminate the optimization early when the image quality no longer improves.
The reconstruction parameters of MM-SA-GIF of NCAT Experiment
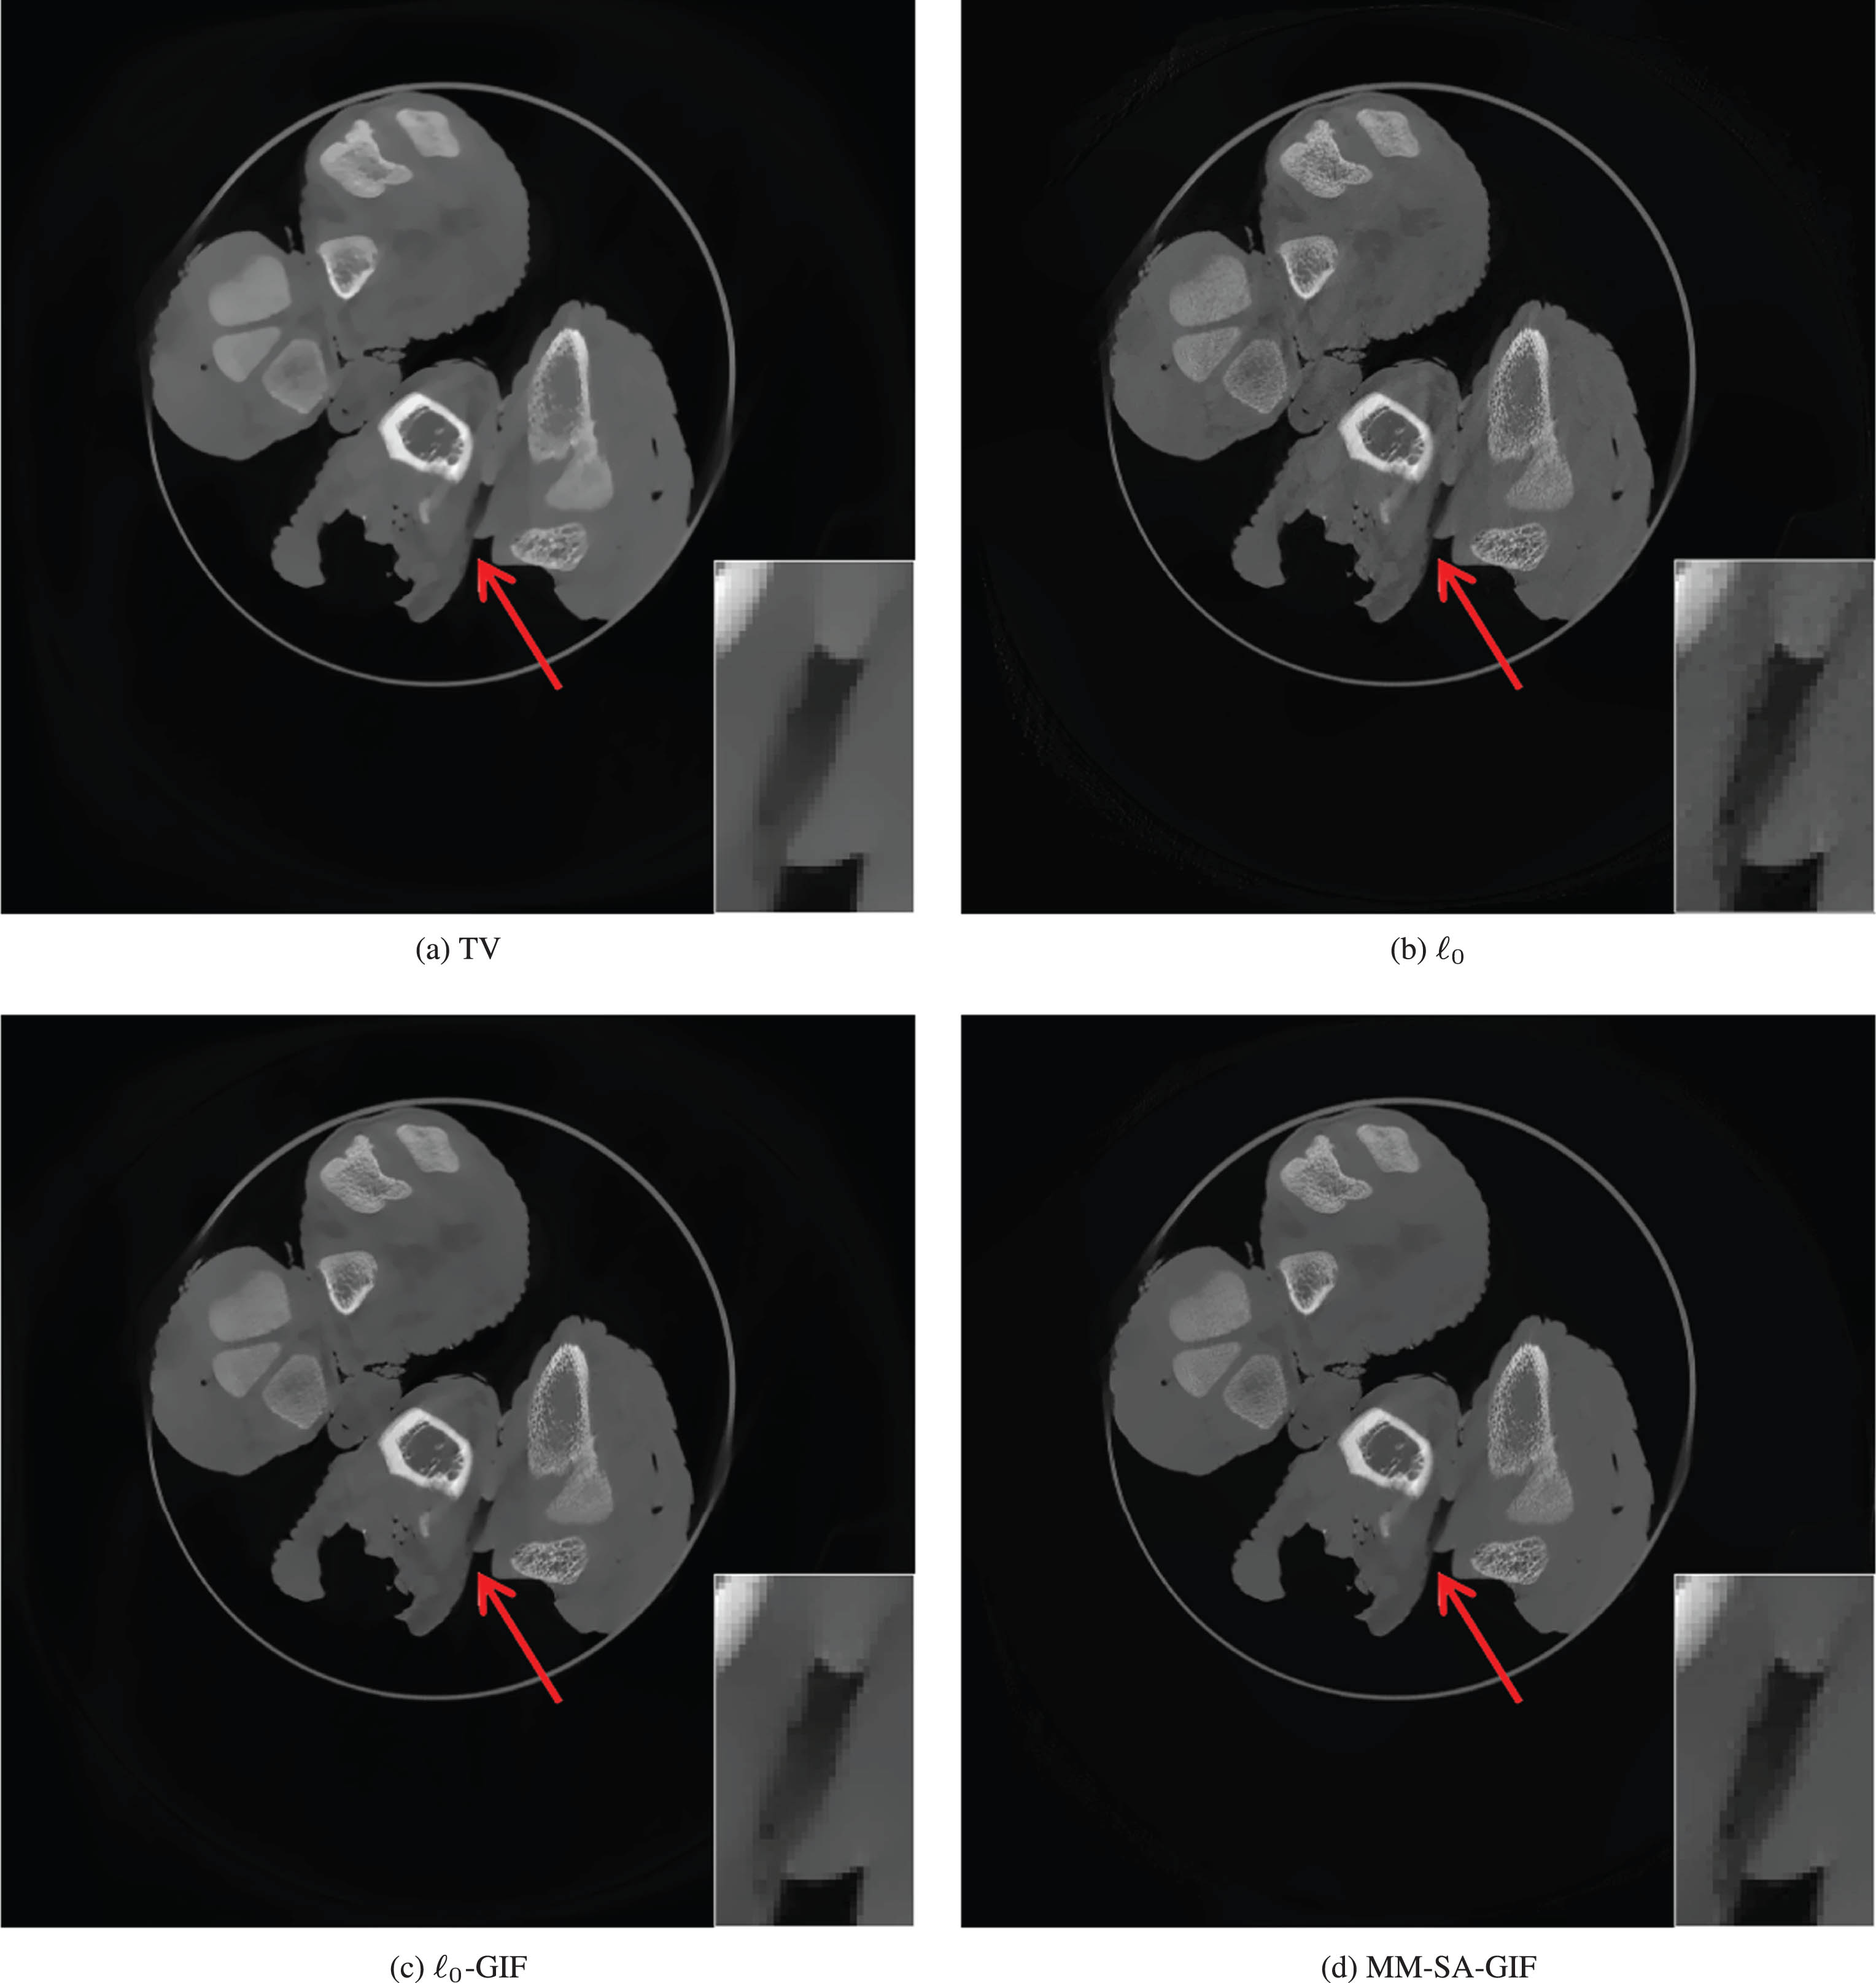
Figures 2 and 3 show the reconstruction images by TV minimization, ℓ0 minimization, ℓ0-GIF method and our proposed method for the scanning ranges [0, 120°] and [0, 150°]. From Fig. 2, it can be observed that the reconstruction image by TV minimization cannot fully restore the edges and fails to suppress artifacts.The image reconstructed by ℓ0 minimization exhibits a more complete structure compared to TV minimization, but it still fails to suppress artifacts, as seen in the rectangle in the lower left corner. Although the image reconstructed by the ℓ0-GIF method suppresses the artifacts in the lower left corner, it does not suppress the artifacts indicated by the arrow in the middle. The proposed MM-SA-GIF method reconstructs images with significantly more complete and clearer edges compared to other methods and effectively suppresses artifacts. From Fig. 3, it can be observed that as the projection data increases, the artifacts in the images reconstructed by TV minimization decrease, but some artifacts still remain. Although ℓ0 minimization suppresses most of the artifacts, the edge structures are still not clear enough. Compared to ℓ0 minimization, the ℓ0-GIF method struggles to balance artifact suppression and over-smoothing during the experiment. As a result, while the ℓ0-GIF images appear smoother, some artifacts still remain. From the enlarged detail images, it can be seen that the MM-SA-GIF method presents clearer edge structures and preserves contour integrity.
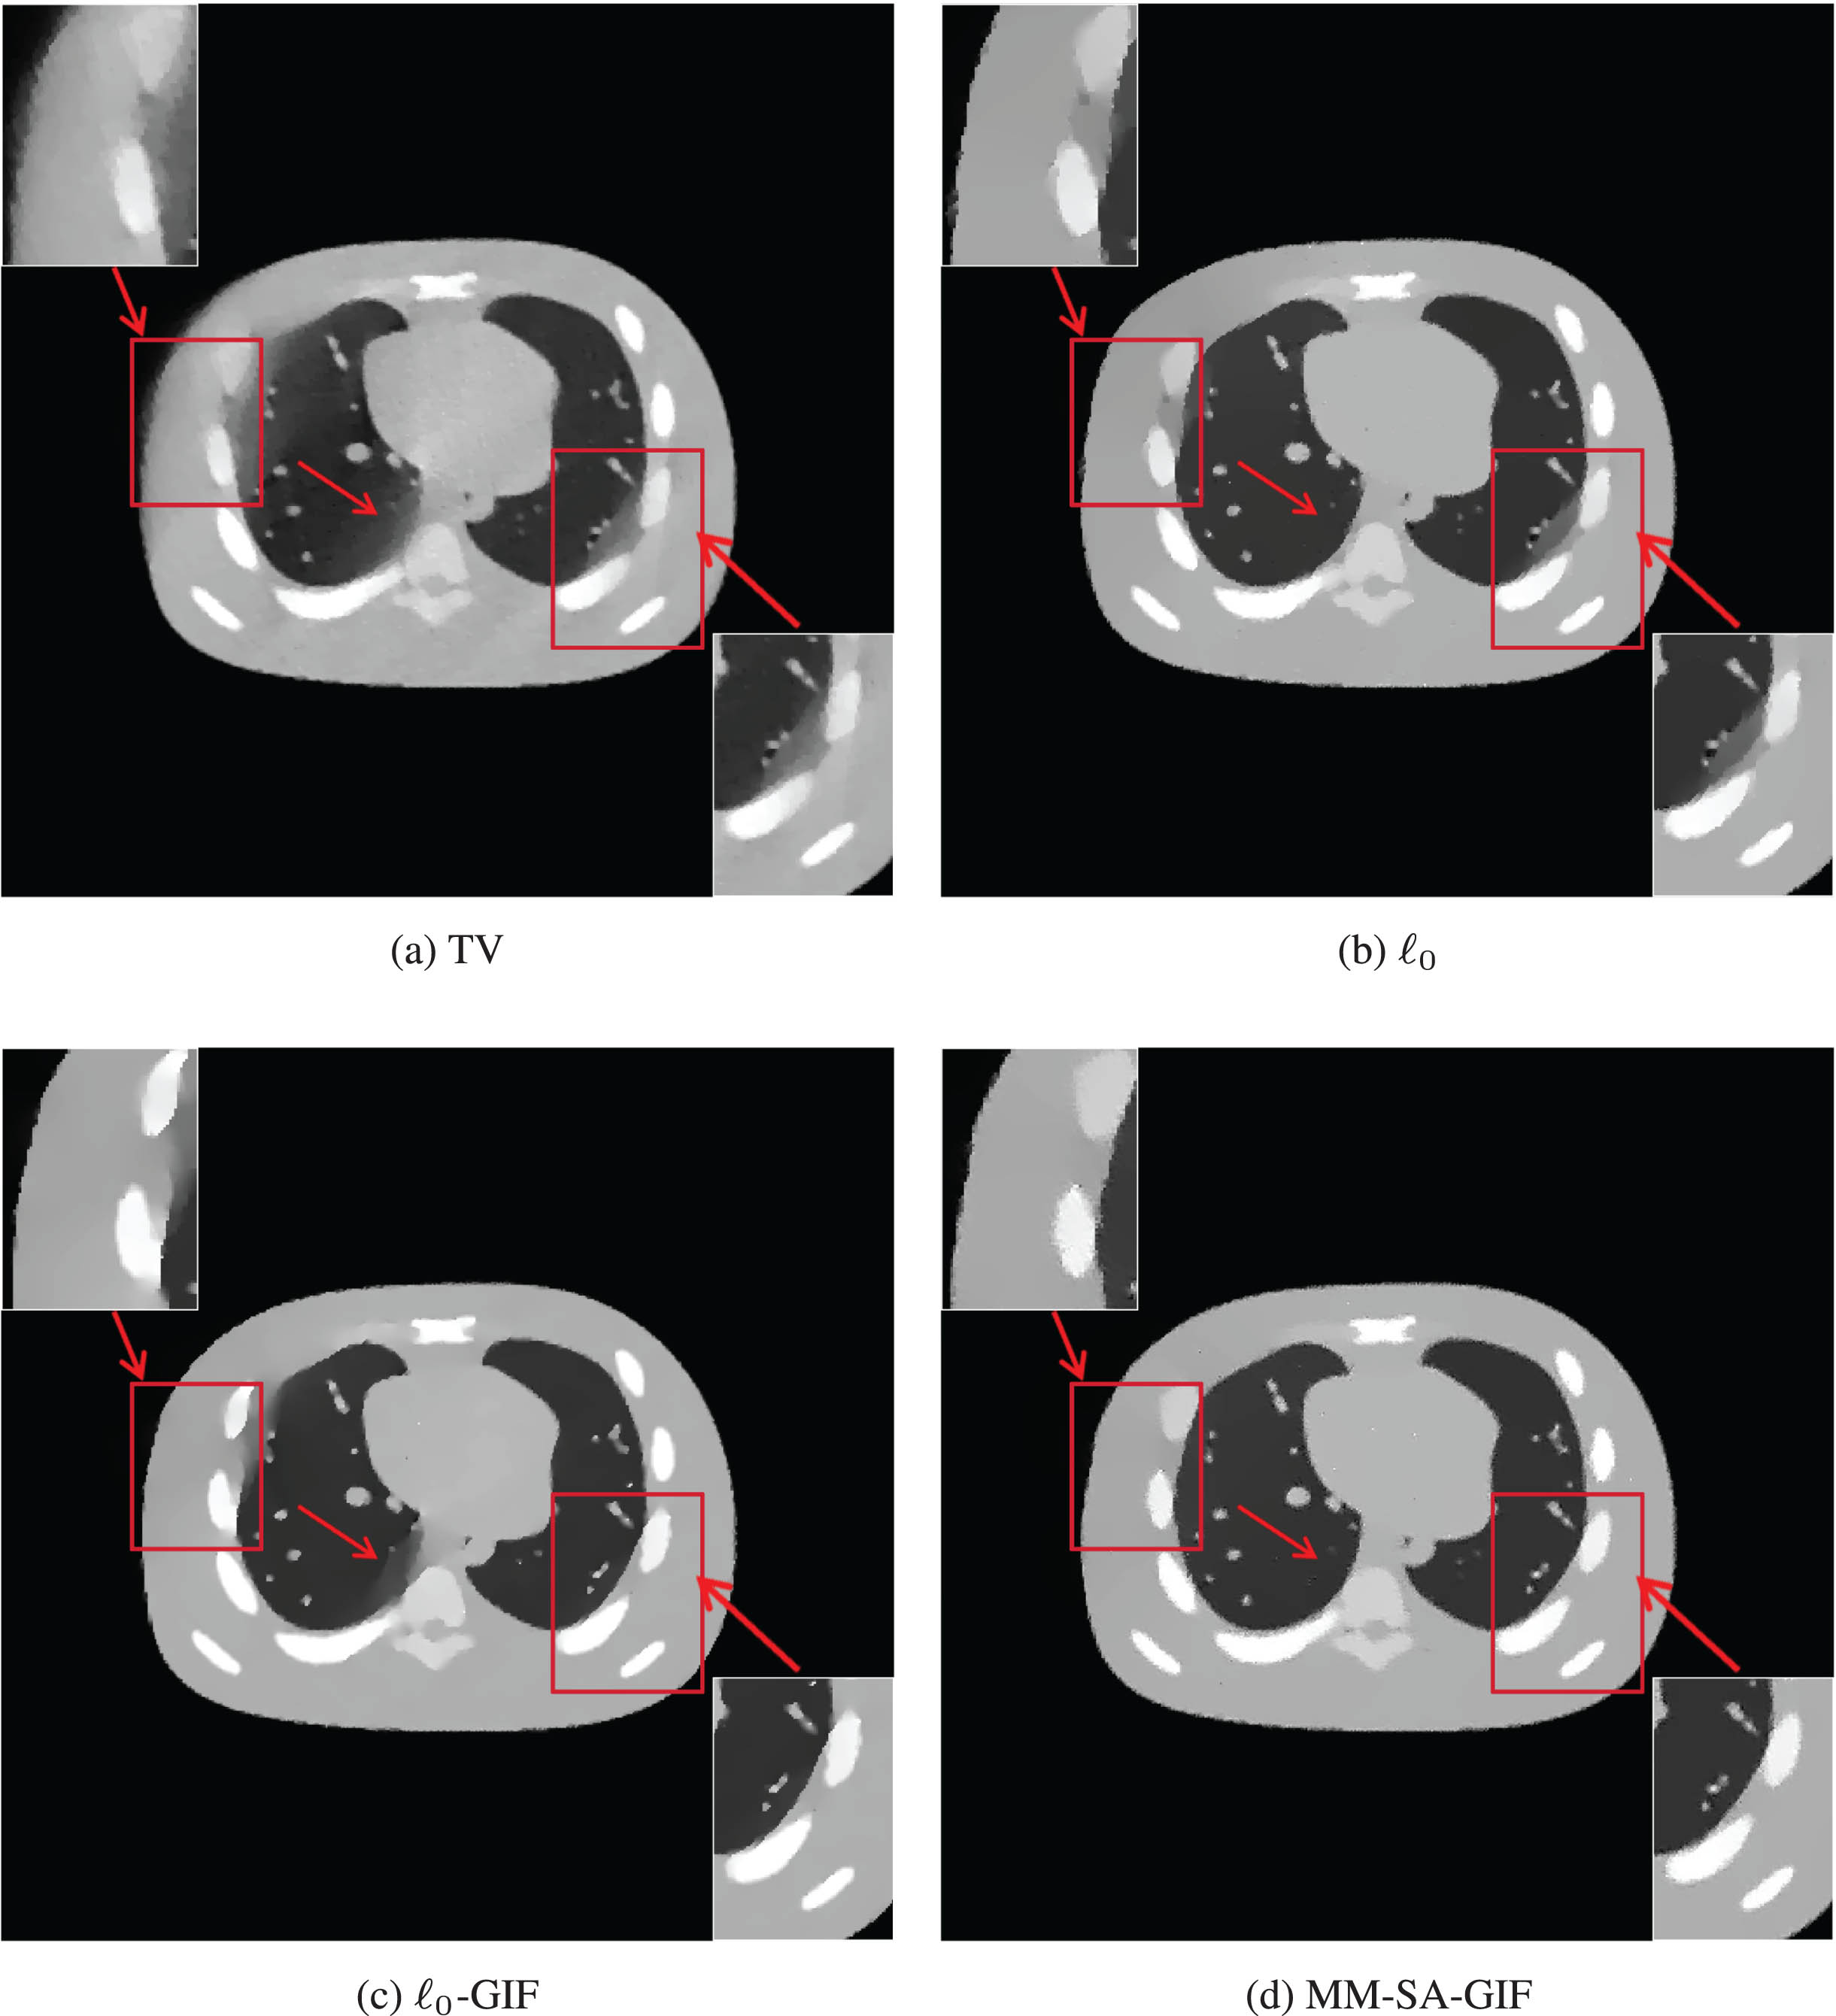
The results of simulated NCAT experiment reconstructed images using different methods for the scanning range [0, 120°].The top left is the result reconstructed by TV minimization, the top right image using ℓ0 minimization, the bottom left image using ℓ0-GIF method, and the bottom right image using the MM-SA-GIF method. The rectangles in the bottom left corners of each image represent enlarged detail areas. The red arrows indicate whether the edge details of the reconstructed image are restored. The display window for reconstruction image is [0,1].
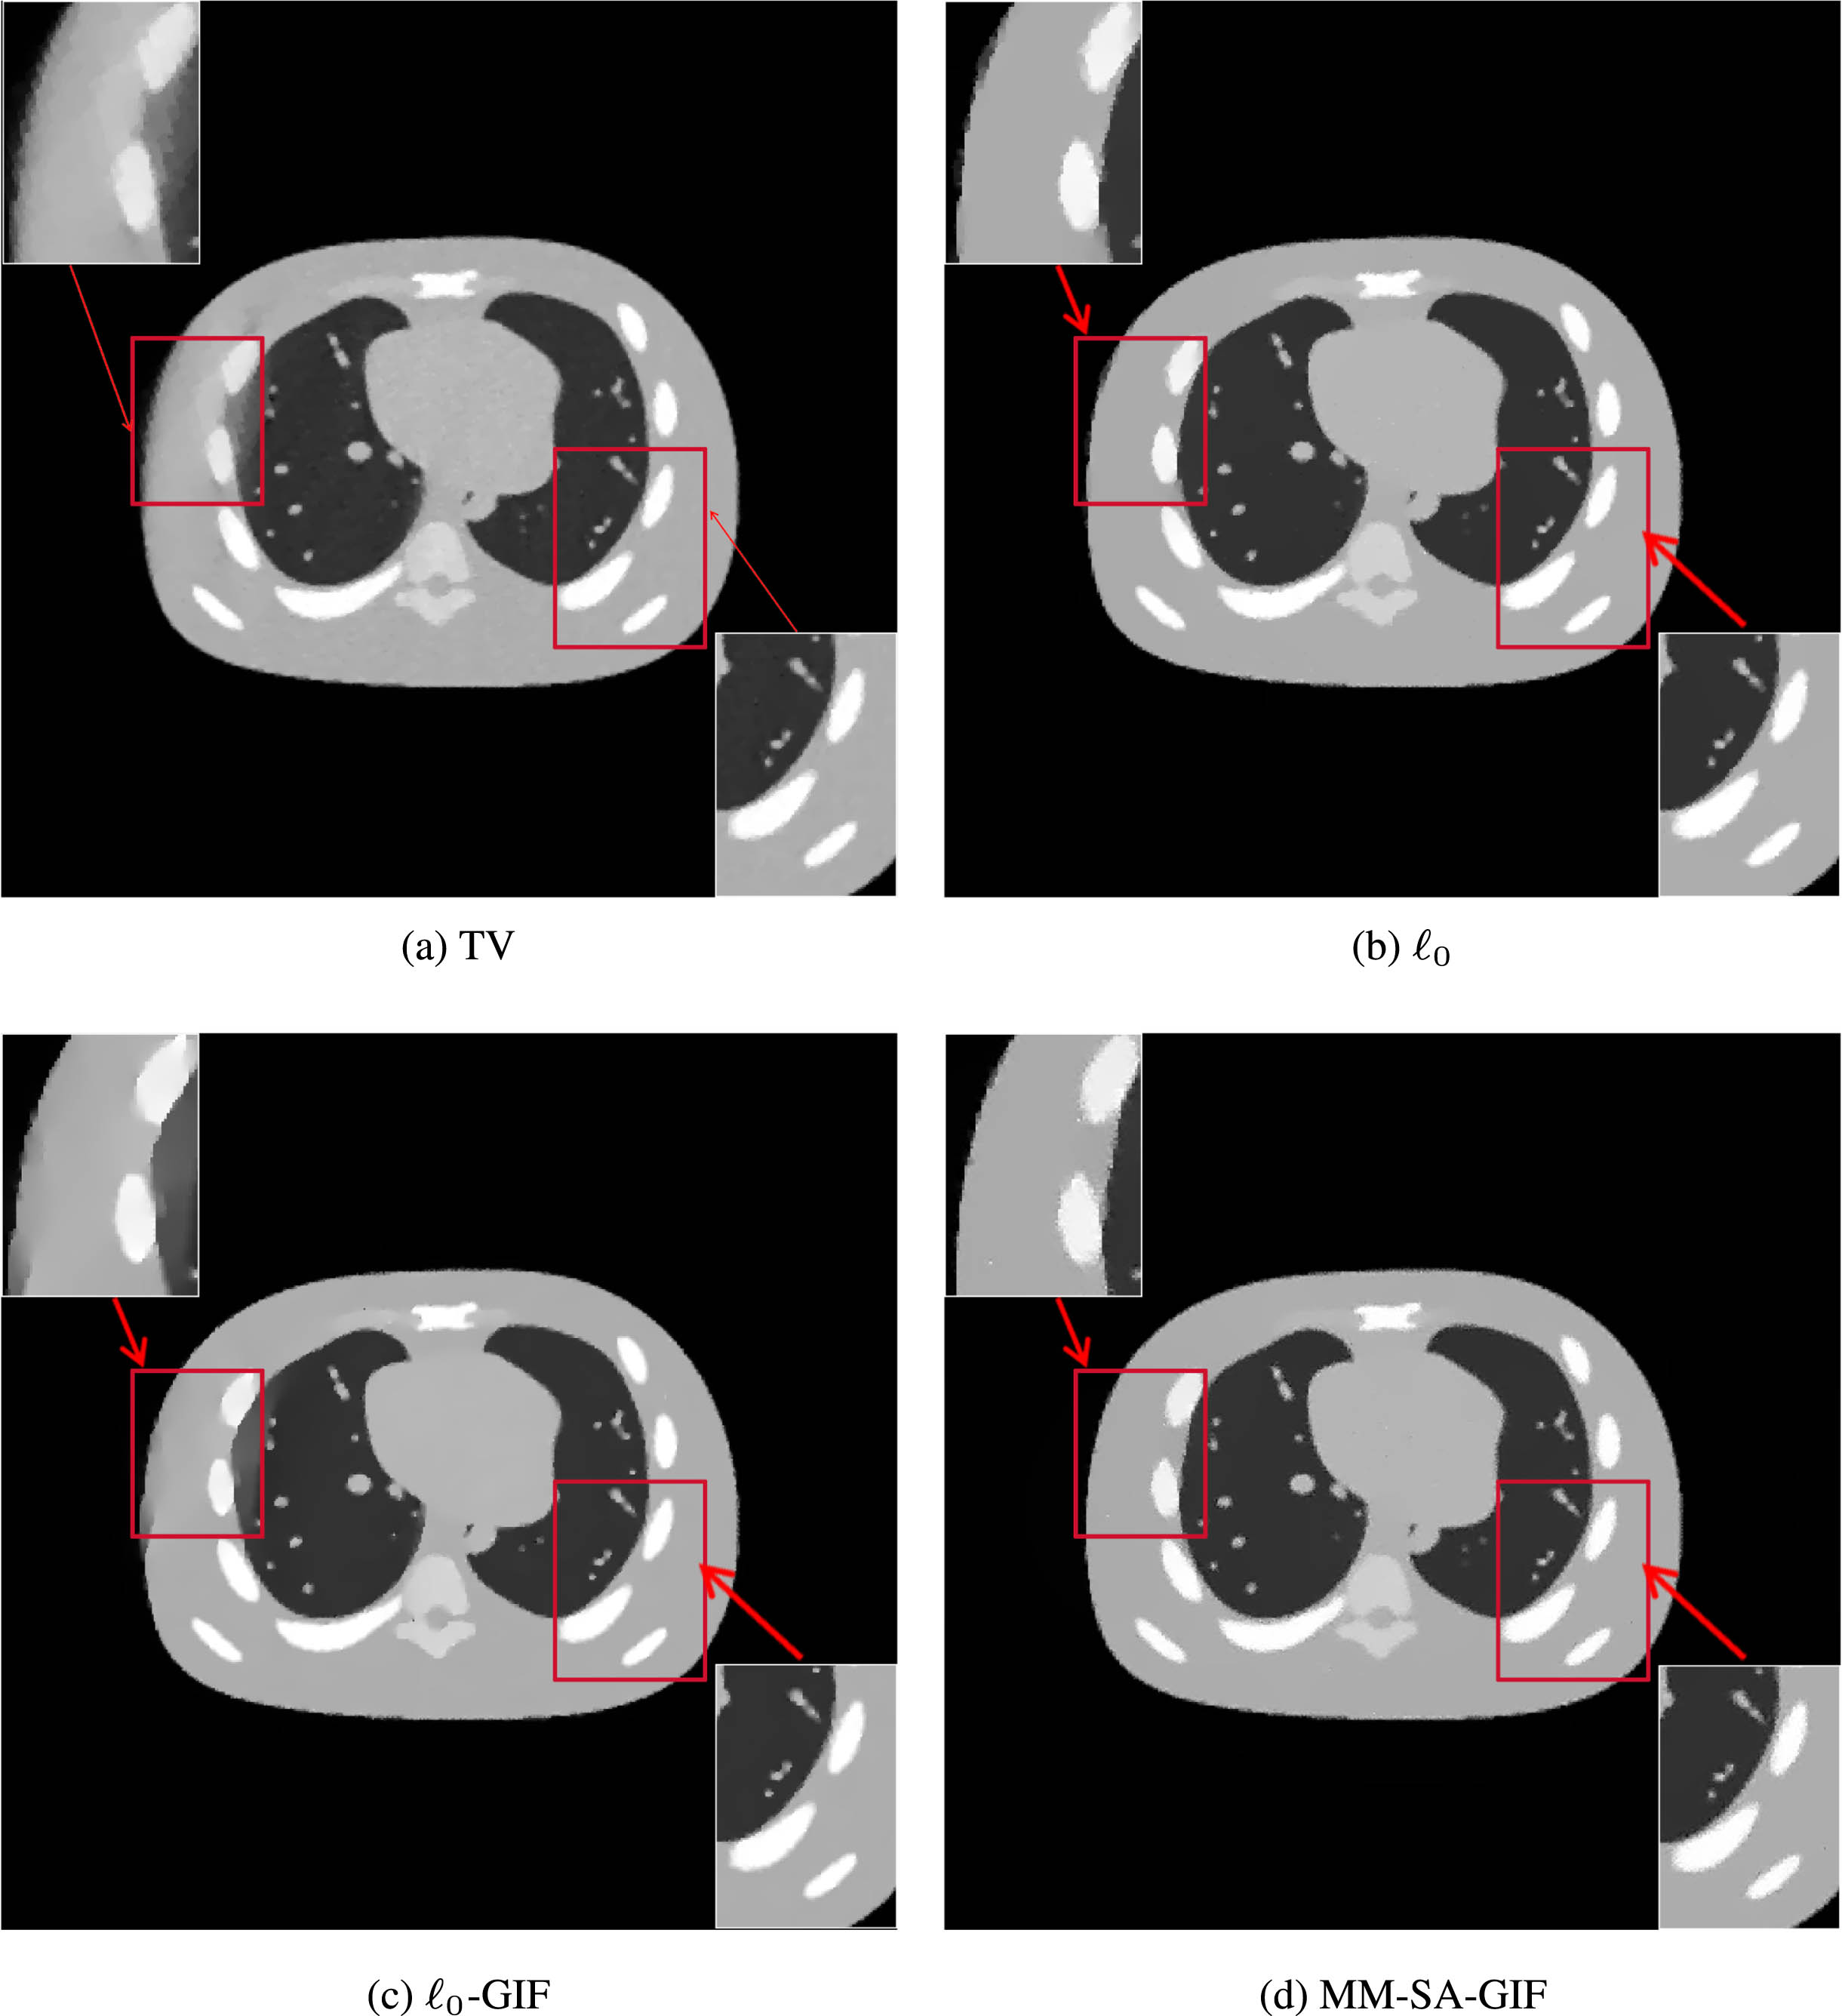
The results of simulated NCAT experiment reconstructed images using different methods for the scanning range [0, 150°]. The top left is the result reconstructed by TV minimization, the top right image using ℓ0 minimization, the bottom left image using ℓ0-GIF method, and the bottom right image using the MM-SA-GIF method. The rectangles in the top left and bottom right corners of each image represent enlarged detail areas. The red arrows indicate whether the edge details of the reconstructed images are restored. The display window for reconstruction image is [0,1].
Figure 4 shows the horizontal profiles (300th row) of the reconstructed image of simulated NCAT experiment by different algorithms from different scanning ranges of [0, 120°], [0, 150°], which can evluate the quality of the reconstructed image more intuitively. As can be seen from Fig. 4, the horizontal profiles obtained by MM-SA-GIF method are colser to the reference image, indicating that our proposed method retores more detailed information of the image.
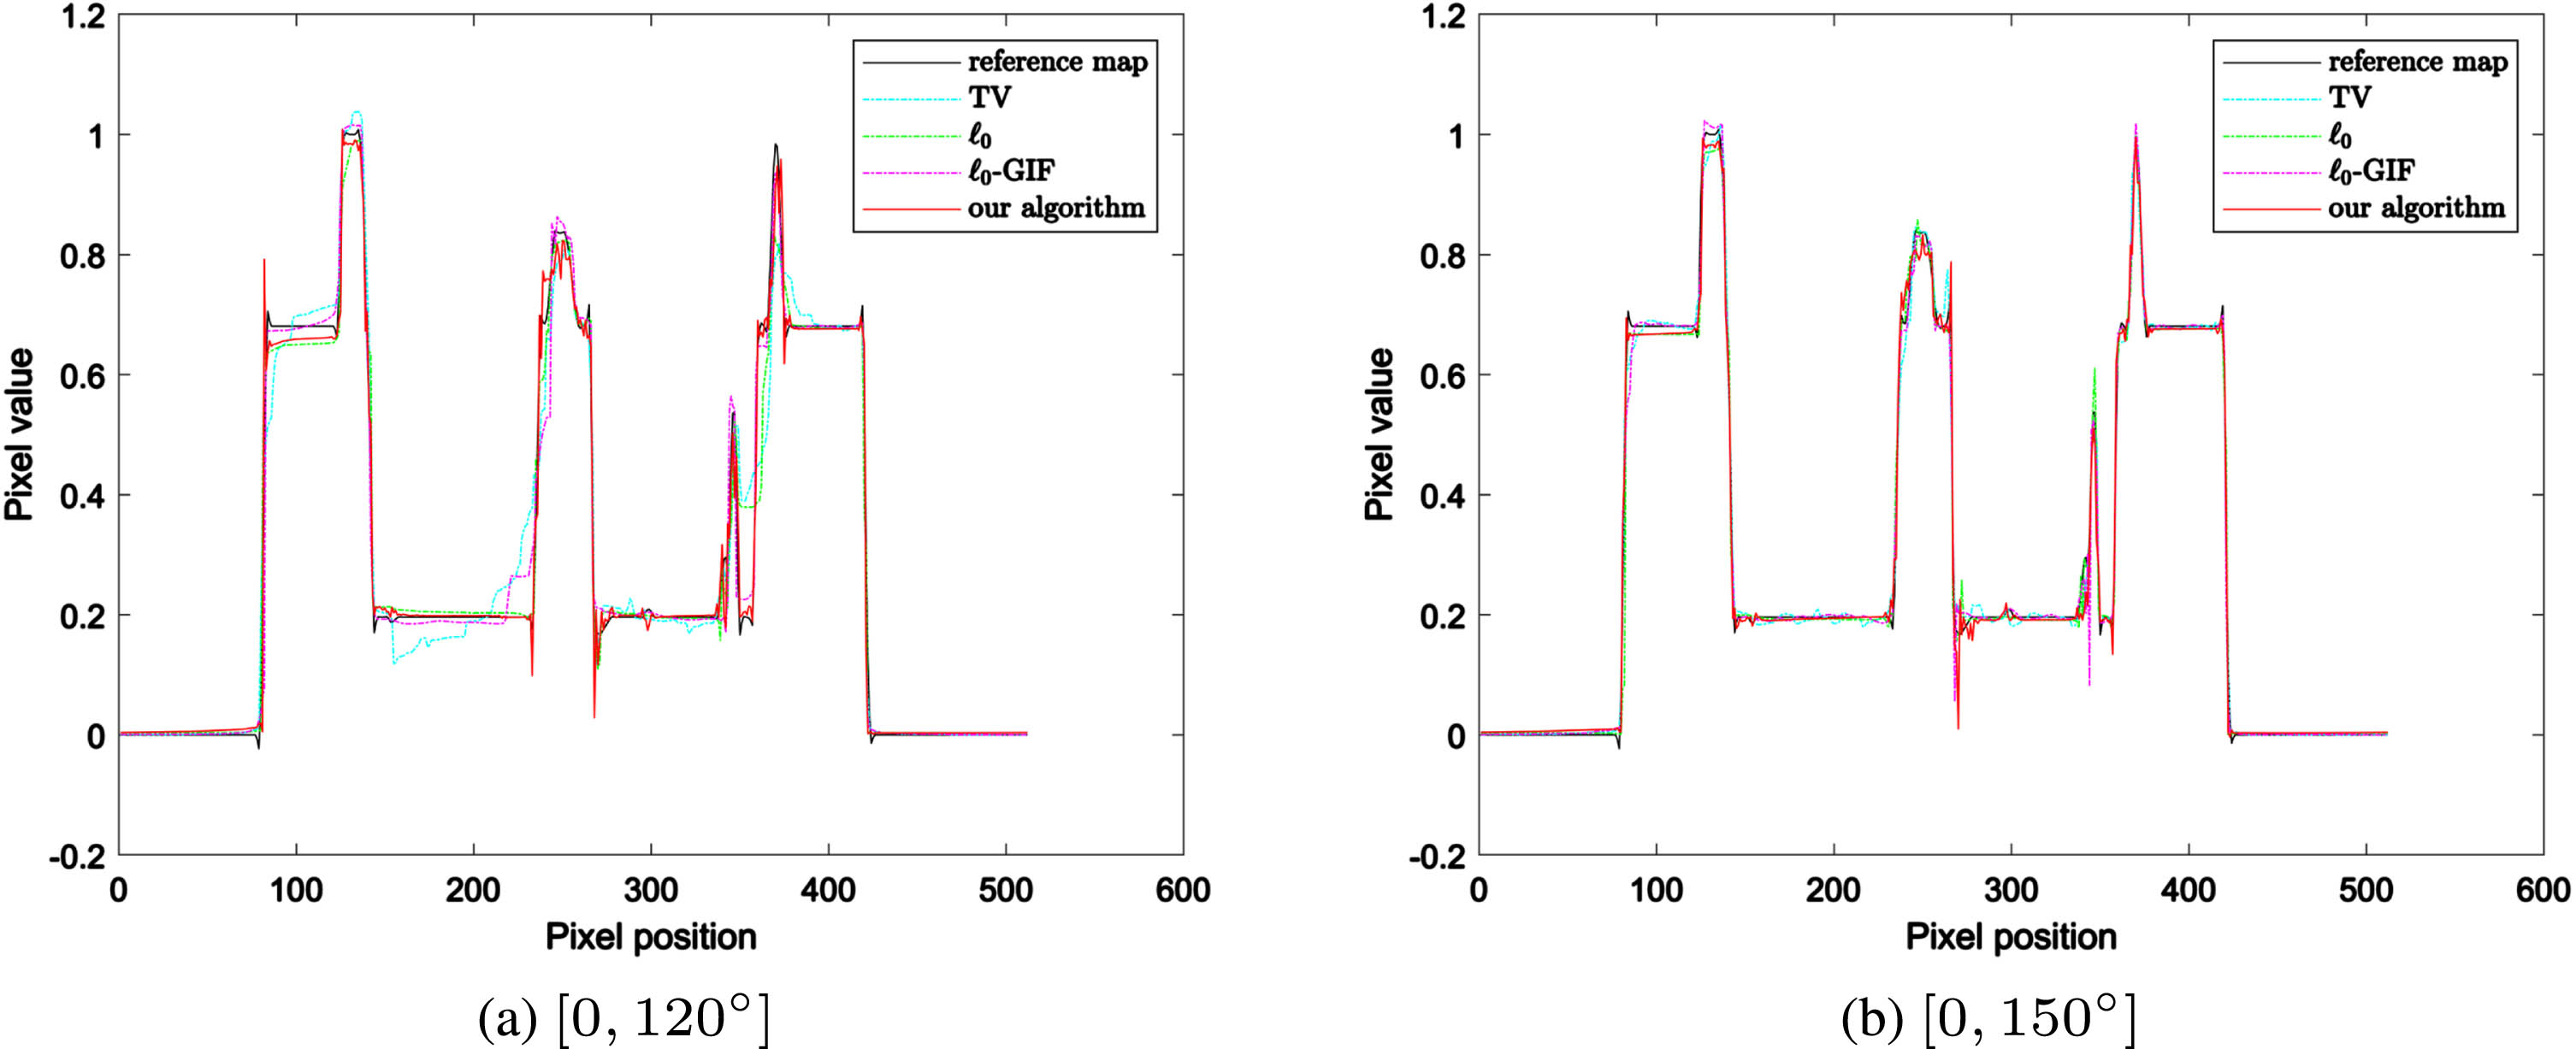
Horizontal profiles (300th row) of the reconstructed images of simulated NCAT experiment by different algorithms in different scanning ranges [0, 120°], [0, 150°].
To assess the quality of reconstructed images more directly, we introduced image quality metrics such as peak signal-to-noise ratio (PSNR), Root Mean Square Error (RMSE), and SSIM to evaluate the performance of different reconstruction methods. From Table 3, it can be observed that when the scanning ranges are [0, 120°] and [0, 150°], the PSNR and RMSE values of images reconstructed by the MM-SA-GIF method are significantly superior to the other three methods. We need to acknowledge that the SSIM values of the other three methods may be higher than those of our algorithm. This is because our algorithm utilizes the SA algorithm, which probabilistically accepts degraded solutions to explore a larger solution space, resulting in lower SSIM values compared to other algorithms. However, as evident from the reconstructed images, our algorithm significantly outperforms others in suppressing artifacts and restoring structures.
The image quality index values of NCAT phantom experiment reconstruction iamge
Figure 5 shows the reconstruction results of TV minimization, LO-TV method, and MM-SA-GIF method. The second column displays the reconstruction results using the LO-TV method. Due to the lexicographic optimization method requiring optimization according to target priorities, the SART algorithm is first used for optimization. The reconstructed image obtained by SART contains numerous stripe artifacts. Subsequently, TV regularization is applied based on the SART reconstruction results, which helps to reduce some artifacts and achieve a smoother appearance. However, it is evident from the image that this method may lead to oversmooth, resulting in the loss of fine details.
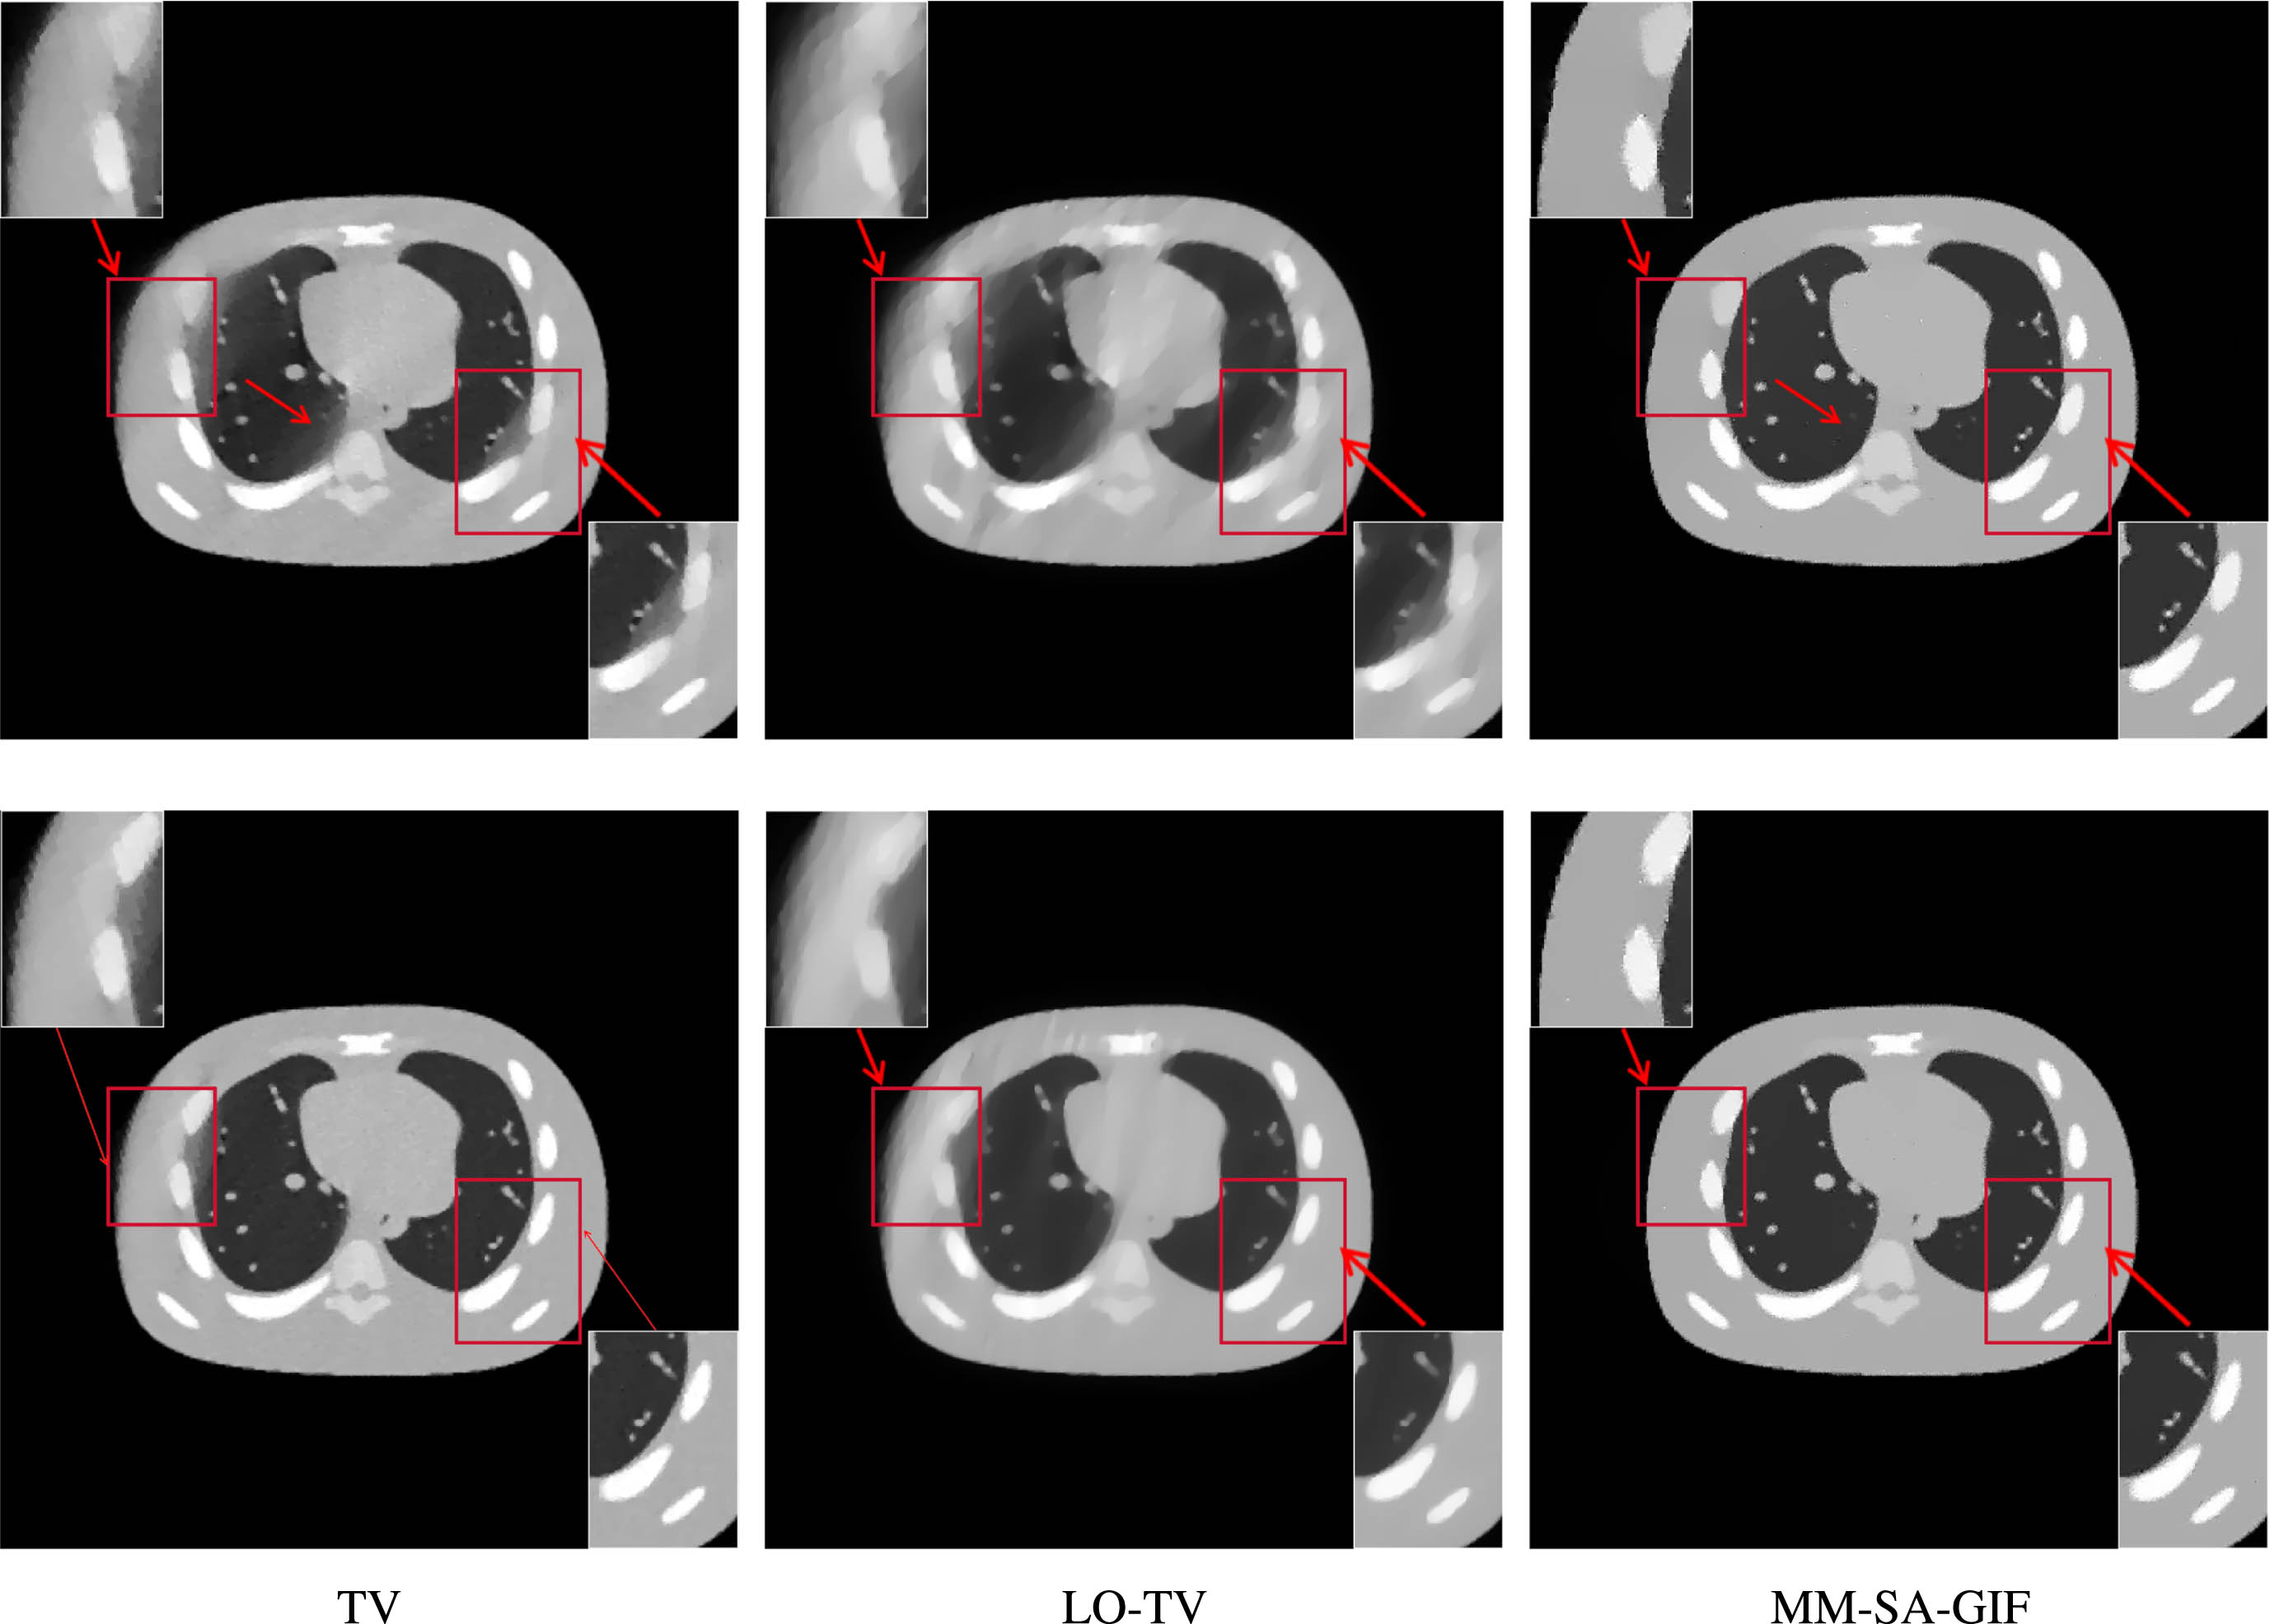
The reconstruction results of simulated NCAT experiment of TV minimization, LO-TV method, and MM-SA-GIF method. From the first row to the second row correspond to scanning angles of [0, 120°] and [0, 150°], respectively. From the first column to the third column, the reconstruction results of TV minimization, LO-TV method, and MM-SA-GIFmethod are in turn.The display window for the reconstruction images is [0,1]. The rectangles are the enlarged detail areas. The red arrows indicate whether the edge details of the reconstructed image are restored.
The real projection data of a sufficiently thin slice of Edam cheese [39], which has been carved with CT letters, are used to verify the superiority of the proposed MM-SA-GIF algorithm. The geometrical scanning parameters are shown in Table 4.
The geometrical scanning parameters of CT system
The geometrical scanning parameters of CT system
In the experiments, the scanning ranges [0, 90°], [0, 120°] and [0, 150°] are investigated, and the reconstruction parameters are shown as follows: For TV minimization: the parameters N TV = 20, α TV = 0.2; For ℓ0 minimization: (1) for the scanning range [0, 90°], the smoothing parameter η = 0.0000085, κ = 15; (2) for the scanning range [0, 120°], η = 0.0000085, κ = 15; (3) for the scanning range is [0, 150°], η = 0.0000065, κ = 15. For ℓ0-GIF method: (1) for the scanning range [0, 90°], η = 0.0000035, κ = 15, r = 2, ɛ = 1.1 × 10⁻⁶; (2) for the scanning range [0, 120°], η = 0.0000065, κ = 15, r = 2, ɛ = 1.1 × 10⁻⁶; (3) for the scanning range [0, 150°], η = 0.0000055, κ = 15, r = 2, ɛ = 1.1 × 10⁻⁵. For the above three methods, the stopping condition is reaching the number of iterations: N = 7000 for the scanning ranges [0, 90°], N = 7000 for [0, 120°], and N = 5000 for [0, 150°]. For LO-TV method:(1) for the scanning range [0, 90°], the N SART = 500, N TV = 350, α TV = 0.002; (2) for the scanning range [0, 120°], the N SART = 500, N TV = 350, α TV = 0.0009; (3) for the scanning range [0, 150°], the N SART = 500, N TV = 350, α TV = 0.0009; For our method MM-SA-GIF, the reconstruction parameters are given in the following Table 5.
The reconstruction parameters of MM-SA-GIF of Edam cheese Experiment
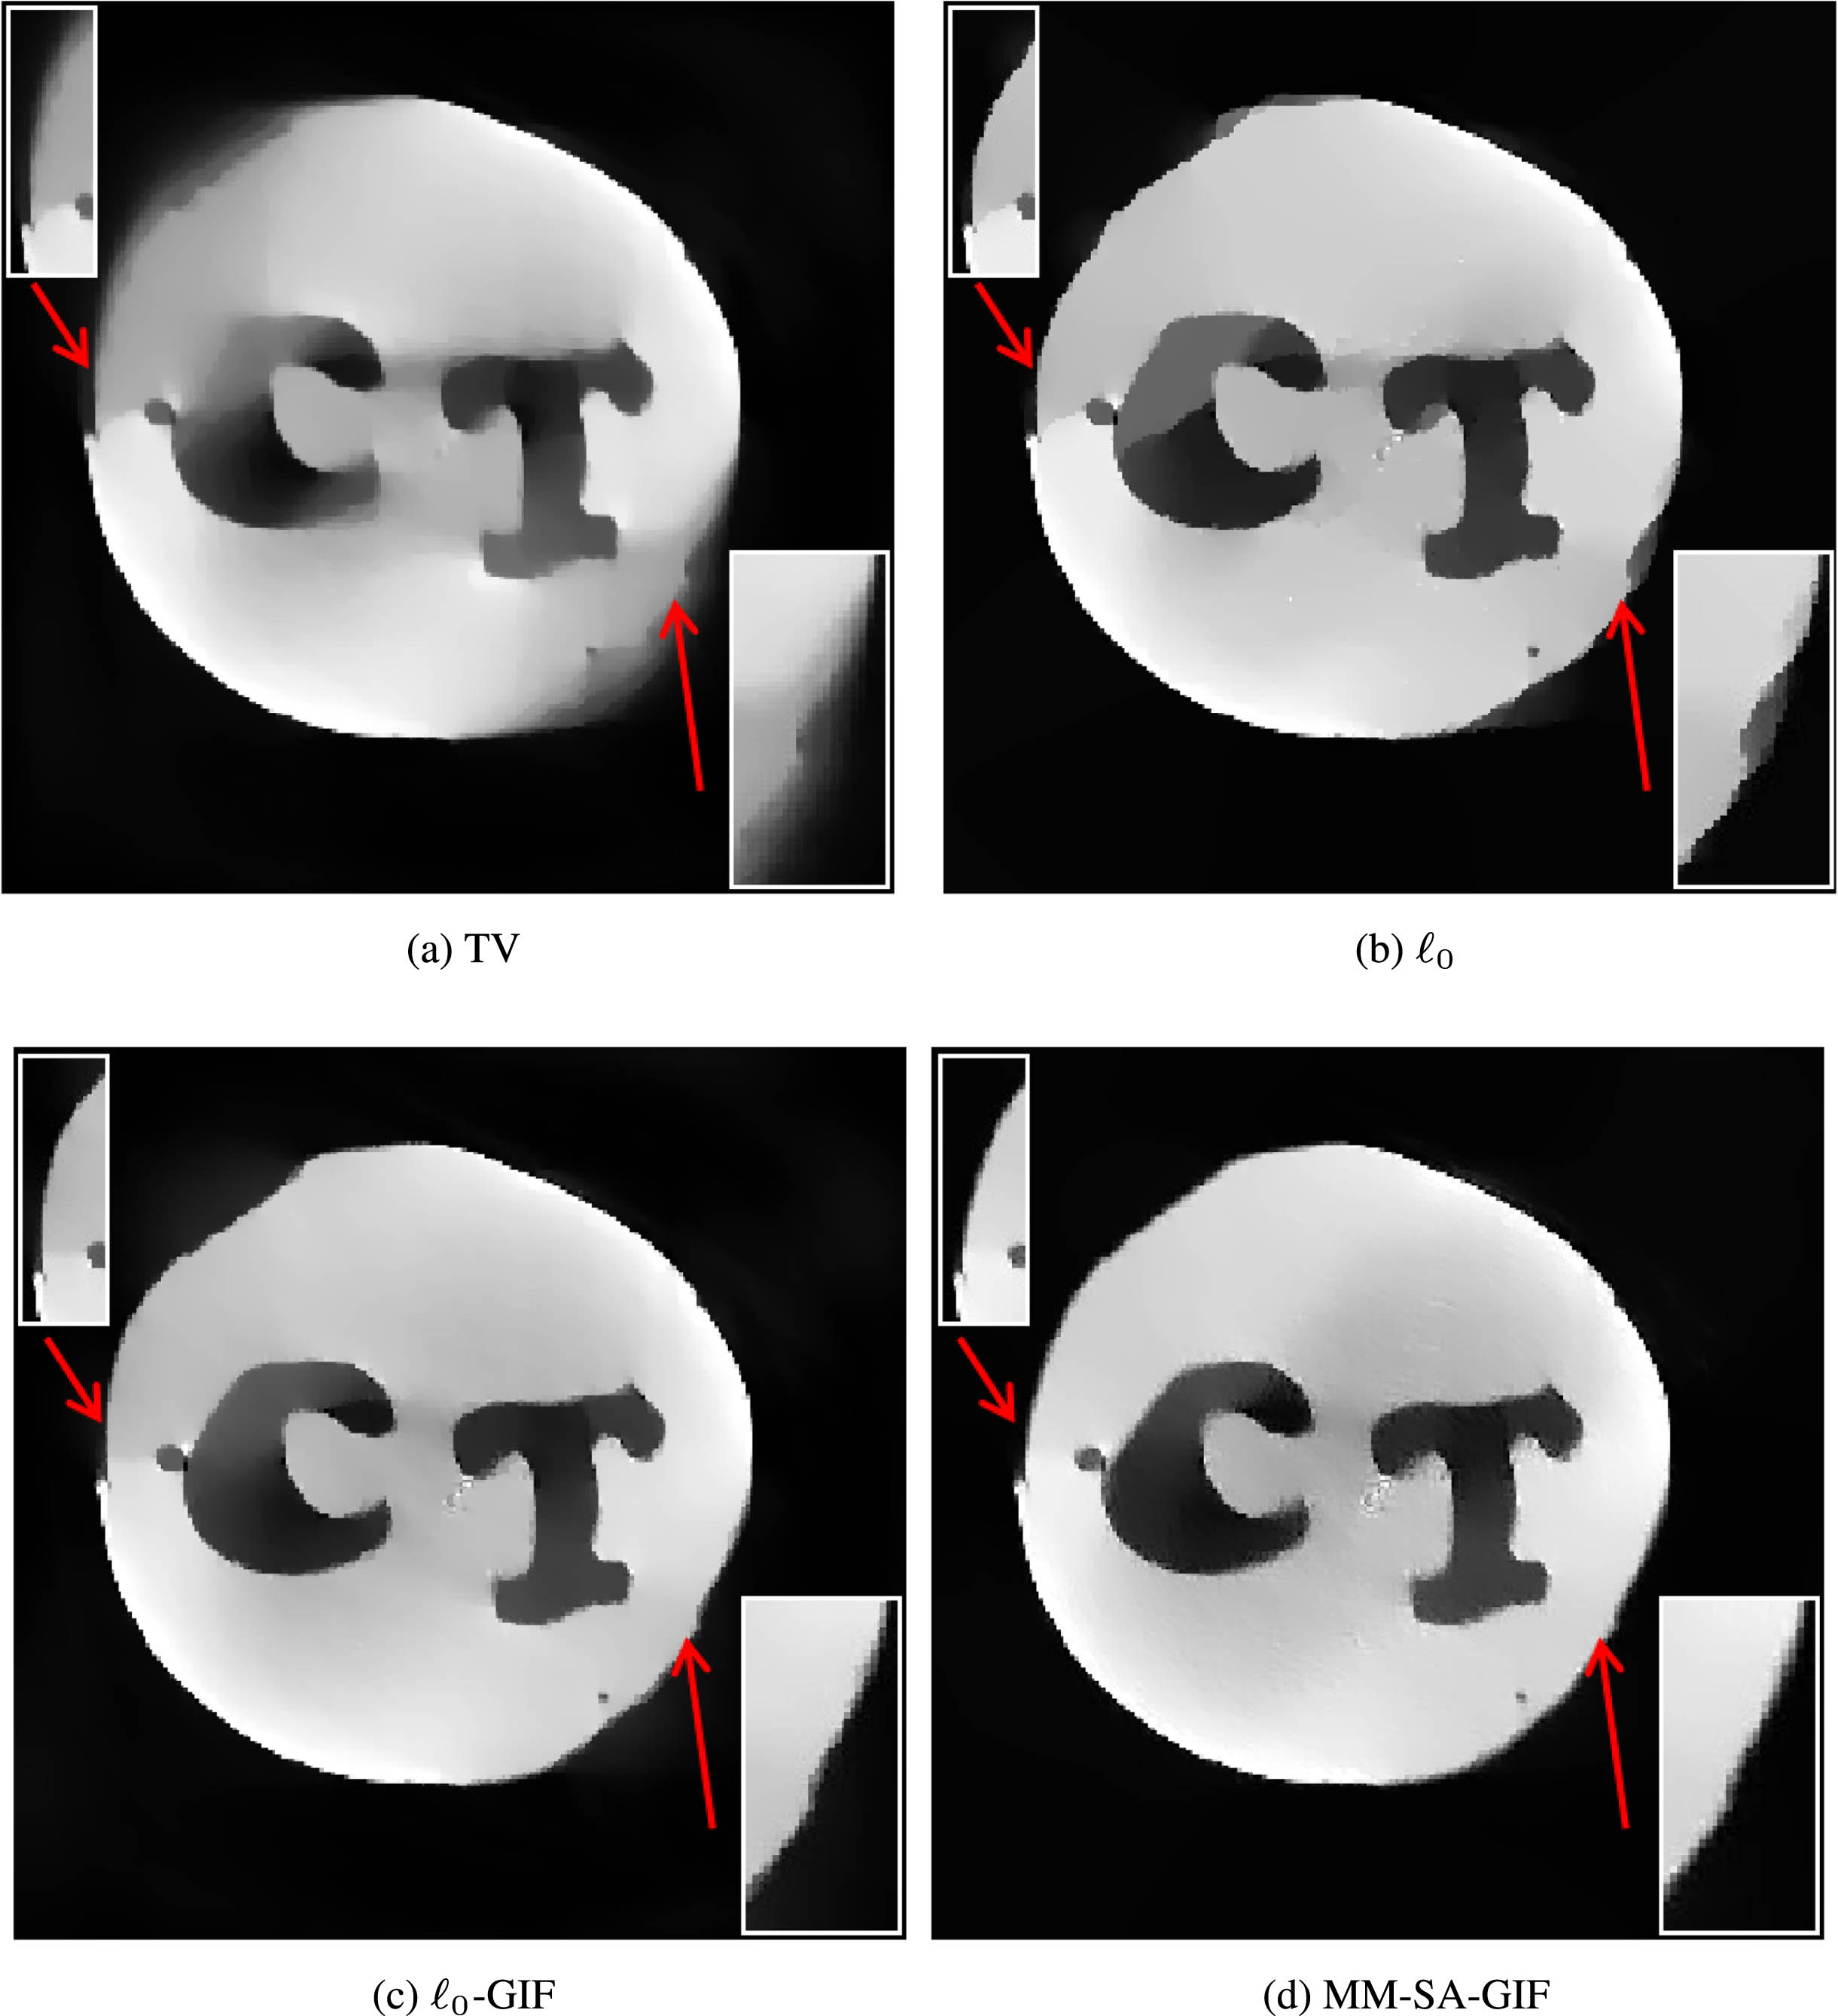
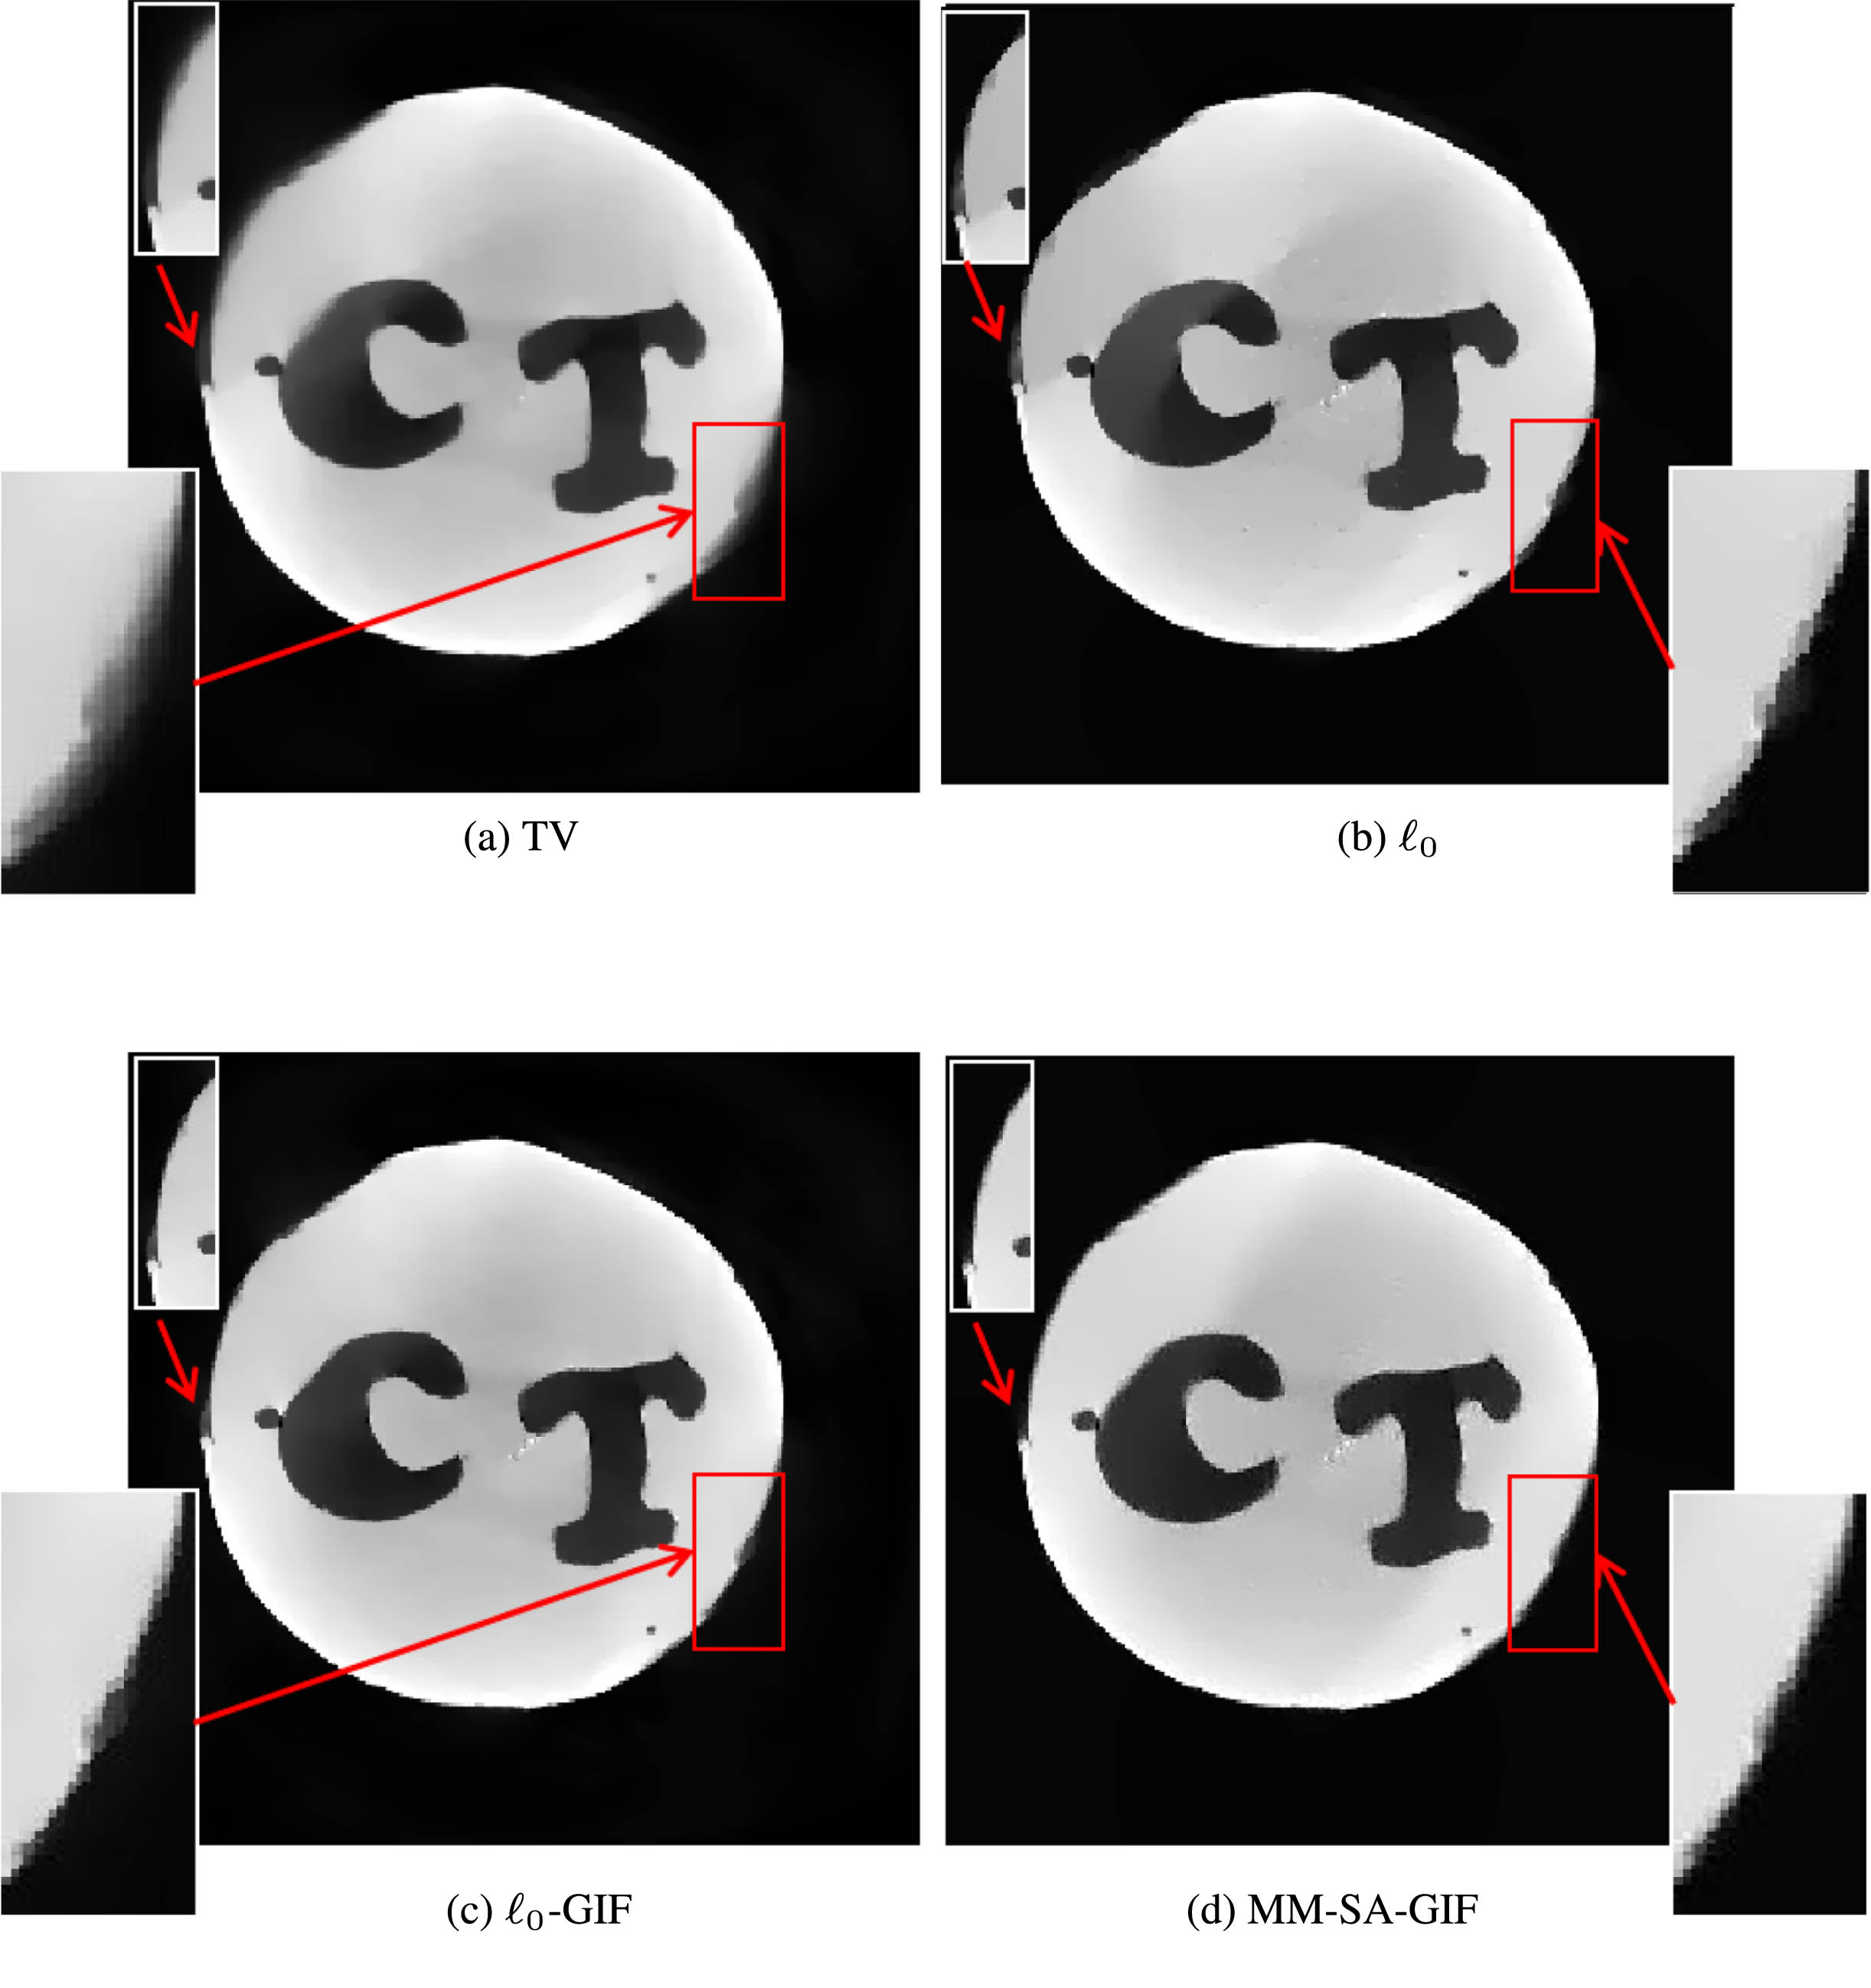
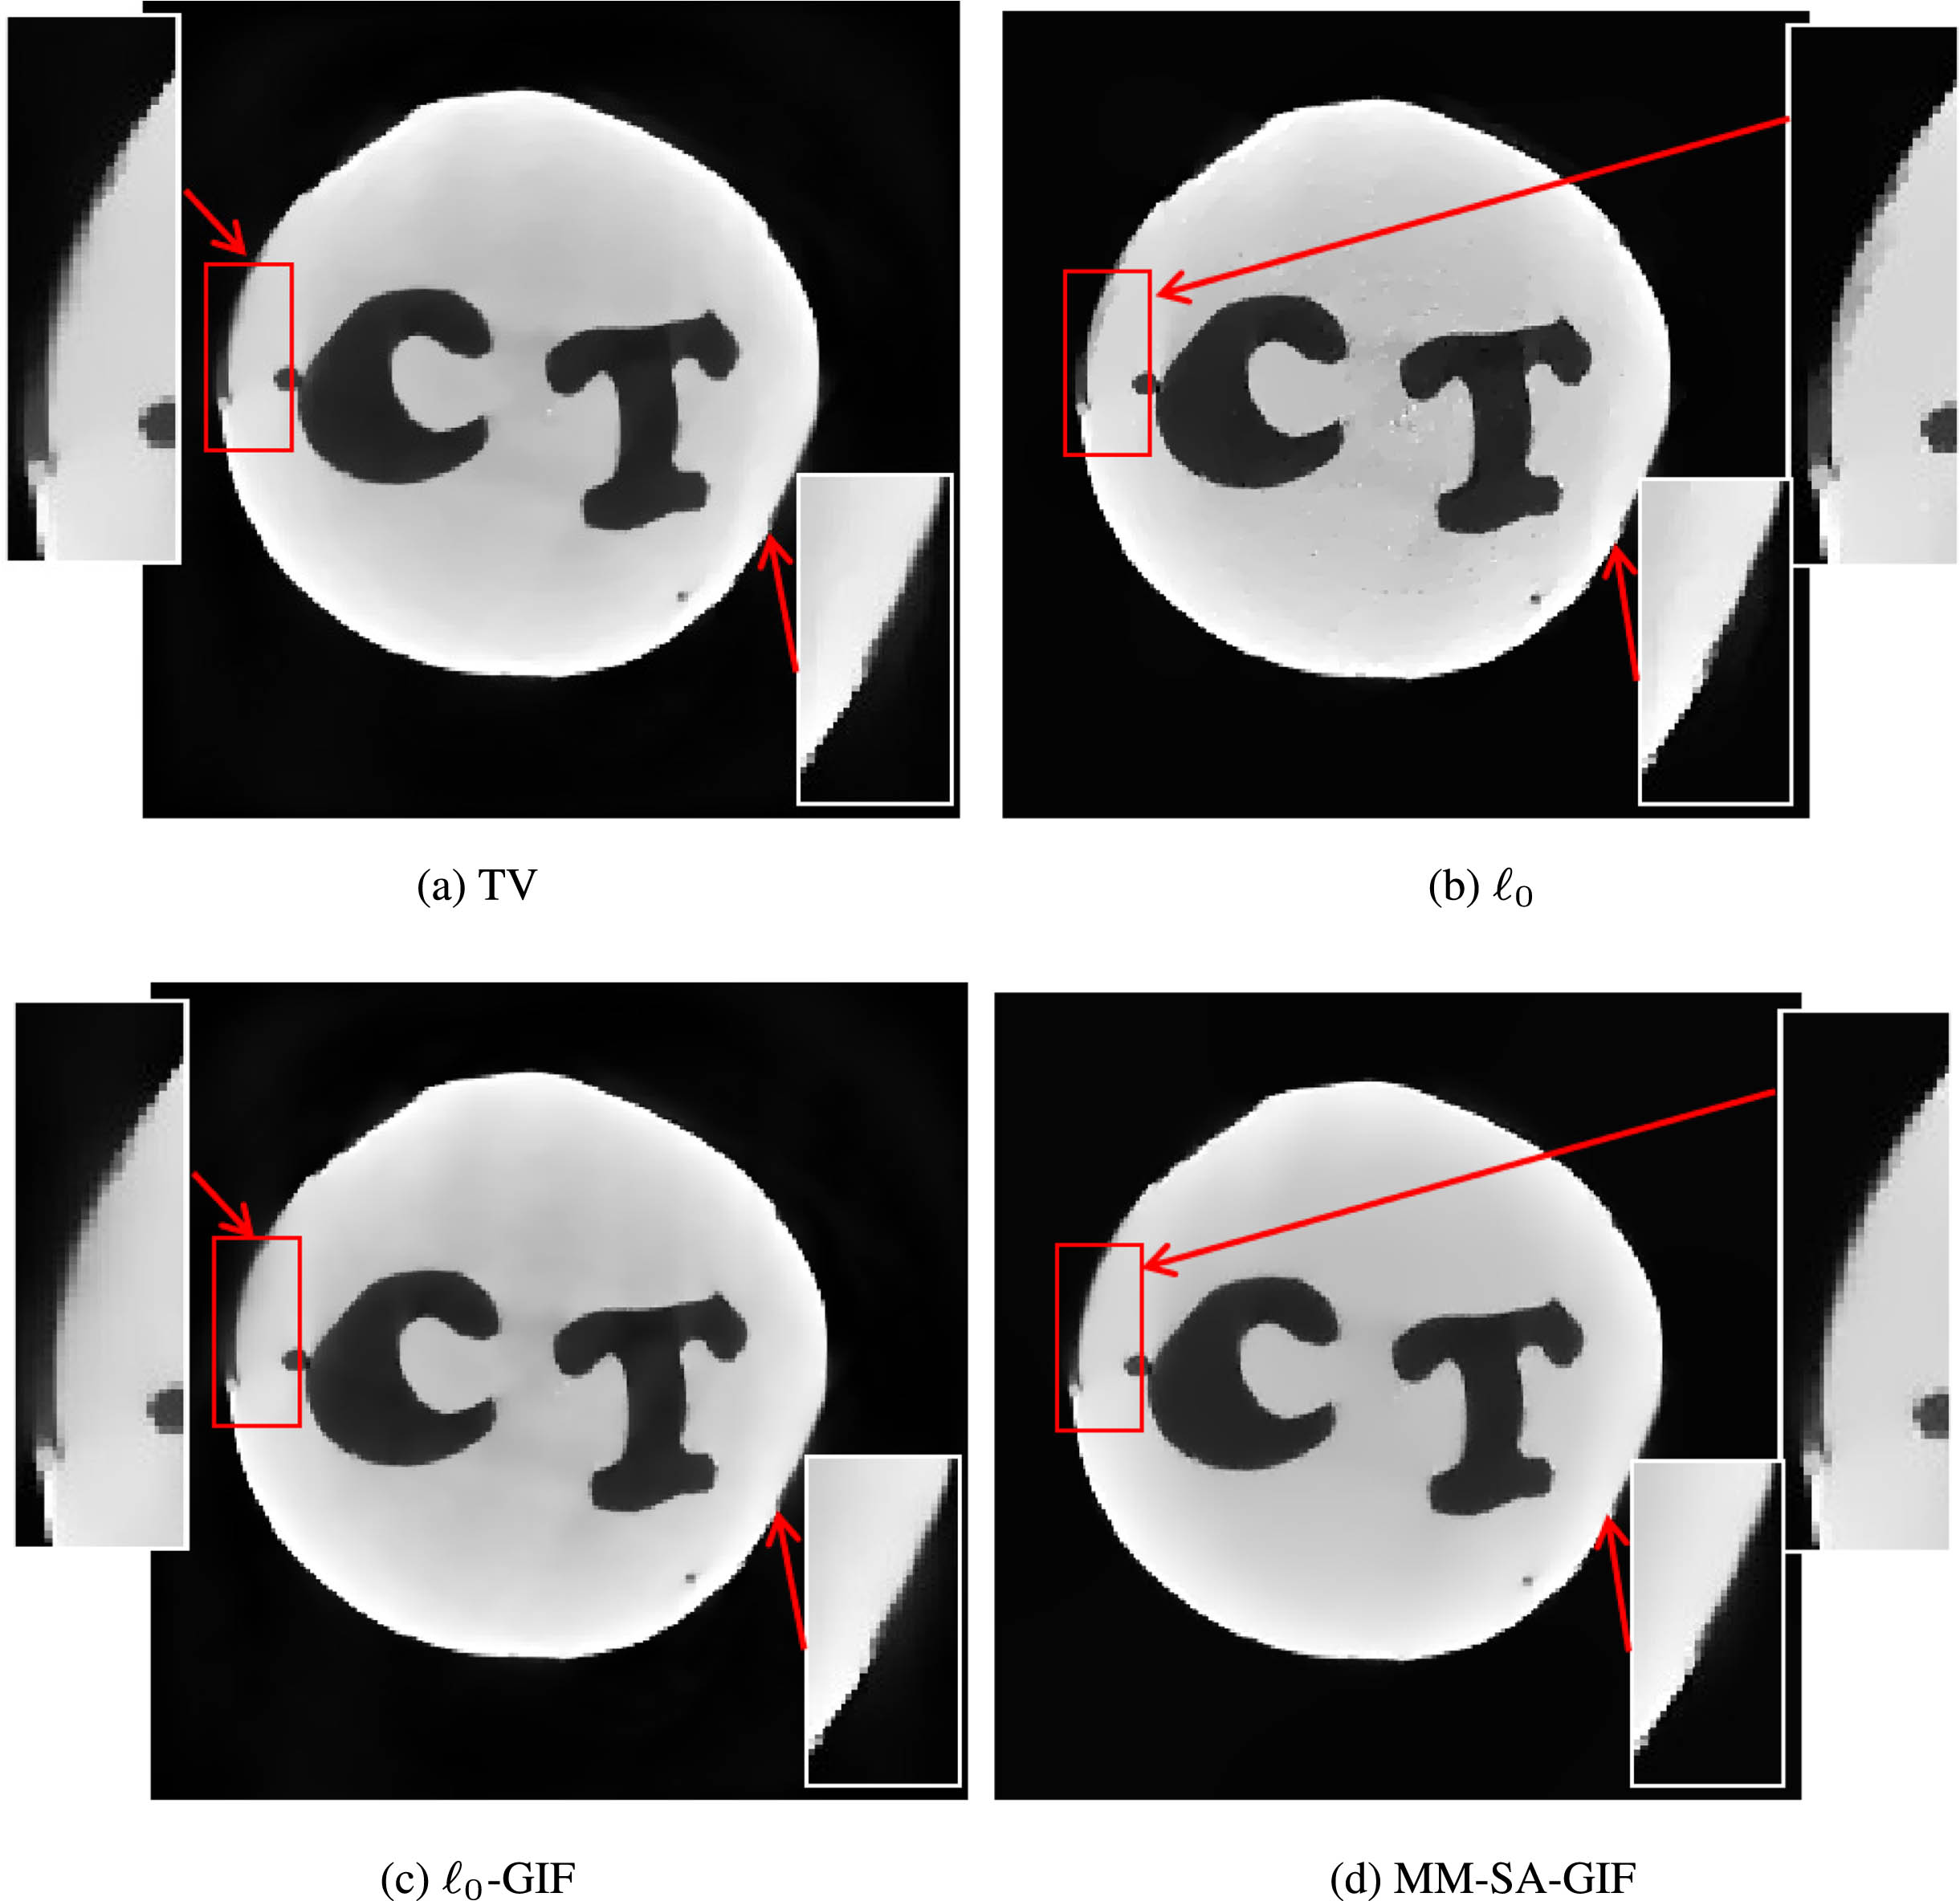
Figure 6 shows the reference image, which we reconstructed the image from scanning range [0, 360°] by SART method. Figures 7–9 show the results of reconstructed images by TV minimization, ℓ0 minimization, ℓ0-GIF method and our method for the scanning range [0, 90°], [0, 120°], [0, 150°] respectively. As can shown in Fig. 7, for the limited-angle scanning range of [0, 90°], our proposed method is clearly better at suppressing artifacts and preserving edge structures compared to TV minimization, ℓ0 minimization, and ℓ0-GIF method. From Fig. 8, with the increase in scanning angle, for the limited-angle scanning range is [0, 120°], the performance of all four methods in restoring image structure and suppressing artifacts are improved, but the TV minimization and ℓ0 minimization still have obvious artifacts at the edges, and the image reconstructed by TV minimization appeared oversmoothing. The images reconstructed by ℓ0-GIF method and our proposed method are superior to the previous two methods in artifact suppression and edge structure restoration, and from the enlarged images that our proposed method is superior to ℓ0-GIF method in edge detail restoration. As can be seen from Fig. 9, for the scanning range is [0, 150°], due to sufficient projection data has been collected, these four image reconstruction methods can completely reconstruct images and suppress artifacts. As can be seen from the enlarged images of each picture in Fig. 9, the edge details of images reconstructed by ℓ0 minimization are not as good as the other three methods, and compared with the other three methods, our proposed method has slight advantages in restoring image edge details.
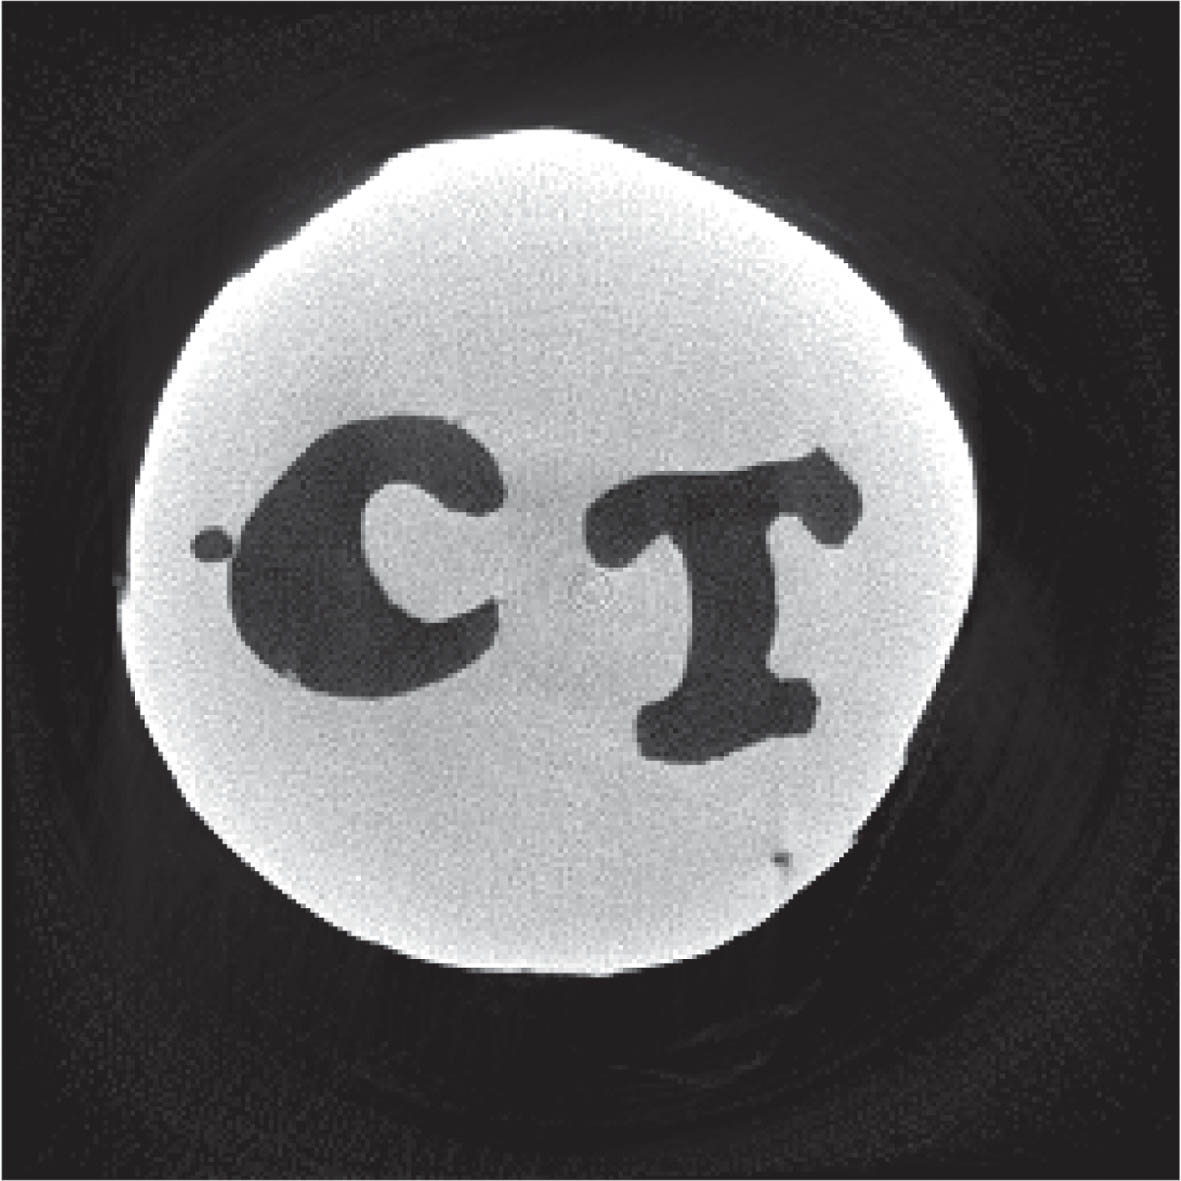
The reference image of Edam cheese.
The results of Edam cheese experiment reconstructed images using different methods for the scanning range [0, 90°]. The top left is the result reconstructed by TV minimization, the top right image using ℓ0 minimization, the bottom left image using ℓ0-GIF method, and the bottom right image using the MM-SA-GIF method. The rectangles in the top left and bottom right corners of each image represent the regions of interest. The red arrows indicate the restoration of edge details in the reconstructed images. The display window for the reconstruction images is [0,0.05].
The results of Edam cheese experiment reconstructed images using different methods for the scanning range [0, 120°]. The top left is the result reconstructed by TV minimization, the top right image using ℓ0 minimization, the bottom left image using ℓ0-GIF method, and the bottom right image using the MM-SA-GIF method.The rectangles in the top left and bottom right corners of each image represent the region of interest.The red arrows indicate whether the edge details of the reconstructed image are restored. The display window for reconstruction image is [0,0.05].
The results of Edam cheese experiment reconstructed images using different methods for the scanning range [0, 150°]. The top left is the result reconstructed by TV minimization, the top right image using ℓ0 minimization, the bottom left image using ℓ0-GIF method, and the bottom right image using the MM-SA-GIF method. The rectangles in the top left and bottom right corners of each image represent the region of interest.The red arrows indicate whether the edge details of the reconstructed image are restored. The display window for reconstruction image is [0,0.05].
Figure 10 shows the horizontal profiles (100th row) of the reconstructed image of Edam cheese experiment by different algorithms from different scanning ranges [0, 90°], [0, 120°], [0, 150°]. As see from Fig. 10, the image curve of our proposed method is closer to the reference image curve. The results demonstrate that our method is superior in reconstructing image details and preserving image information, indicating that the image reconstructed by our method is closer to the real image.
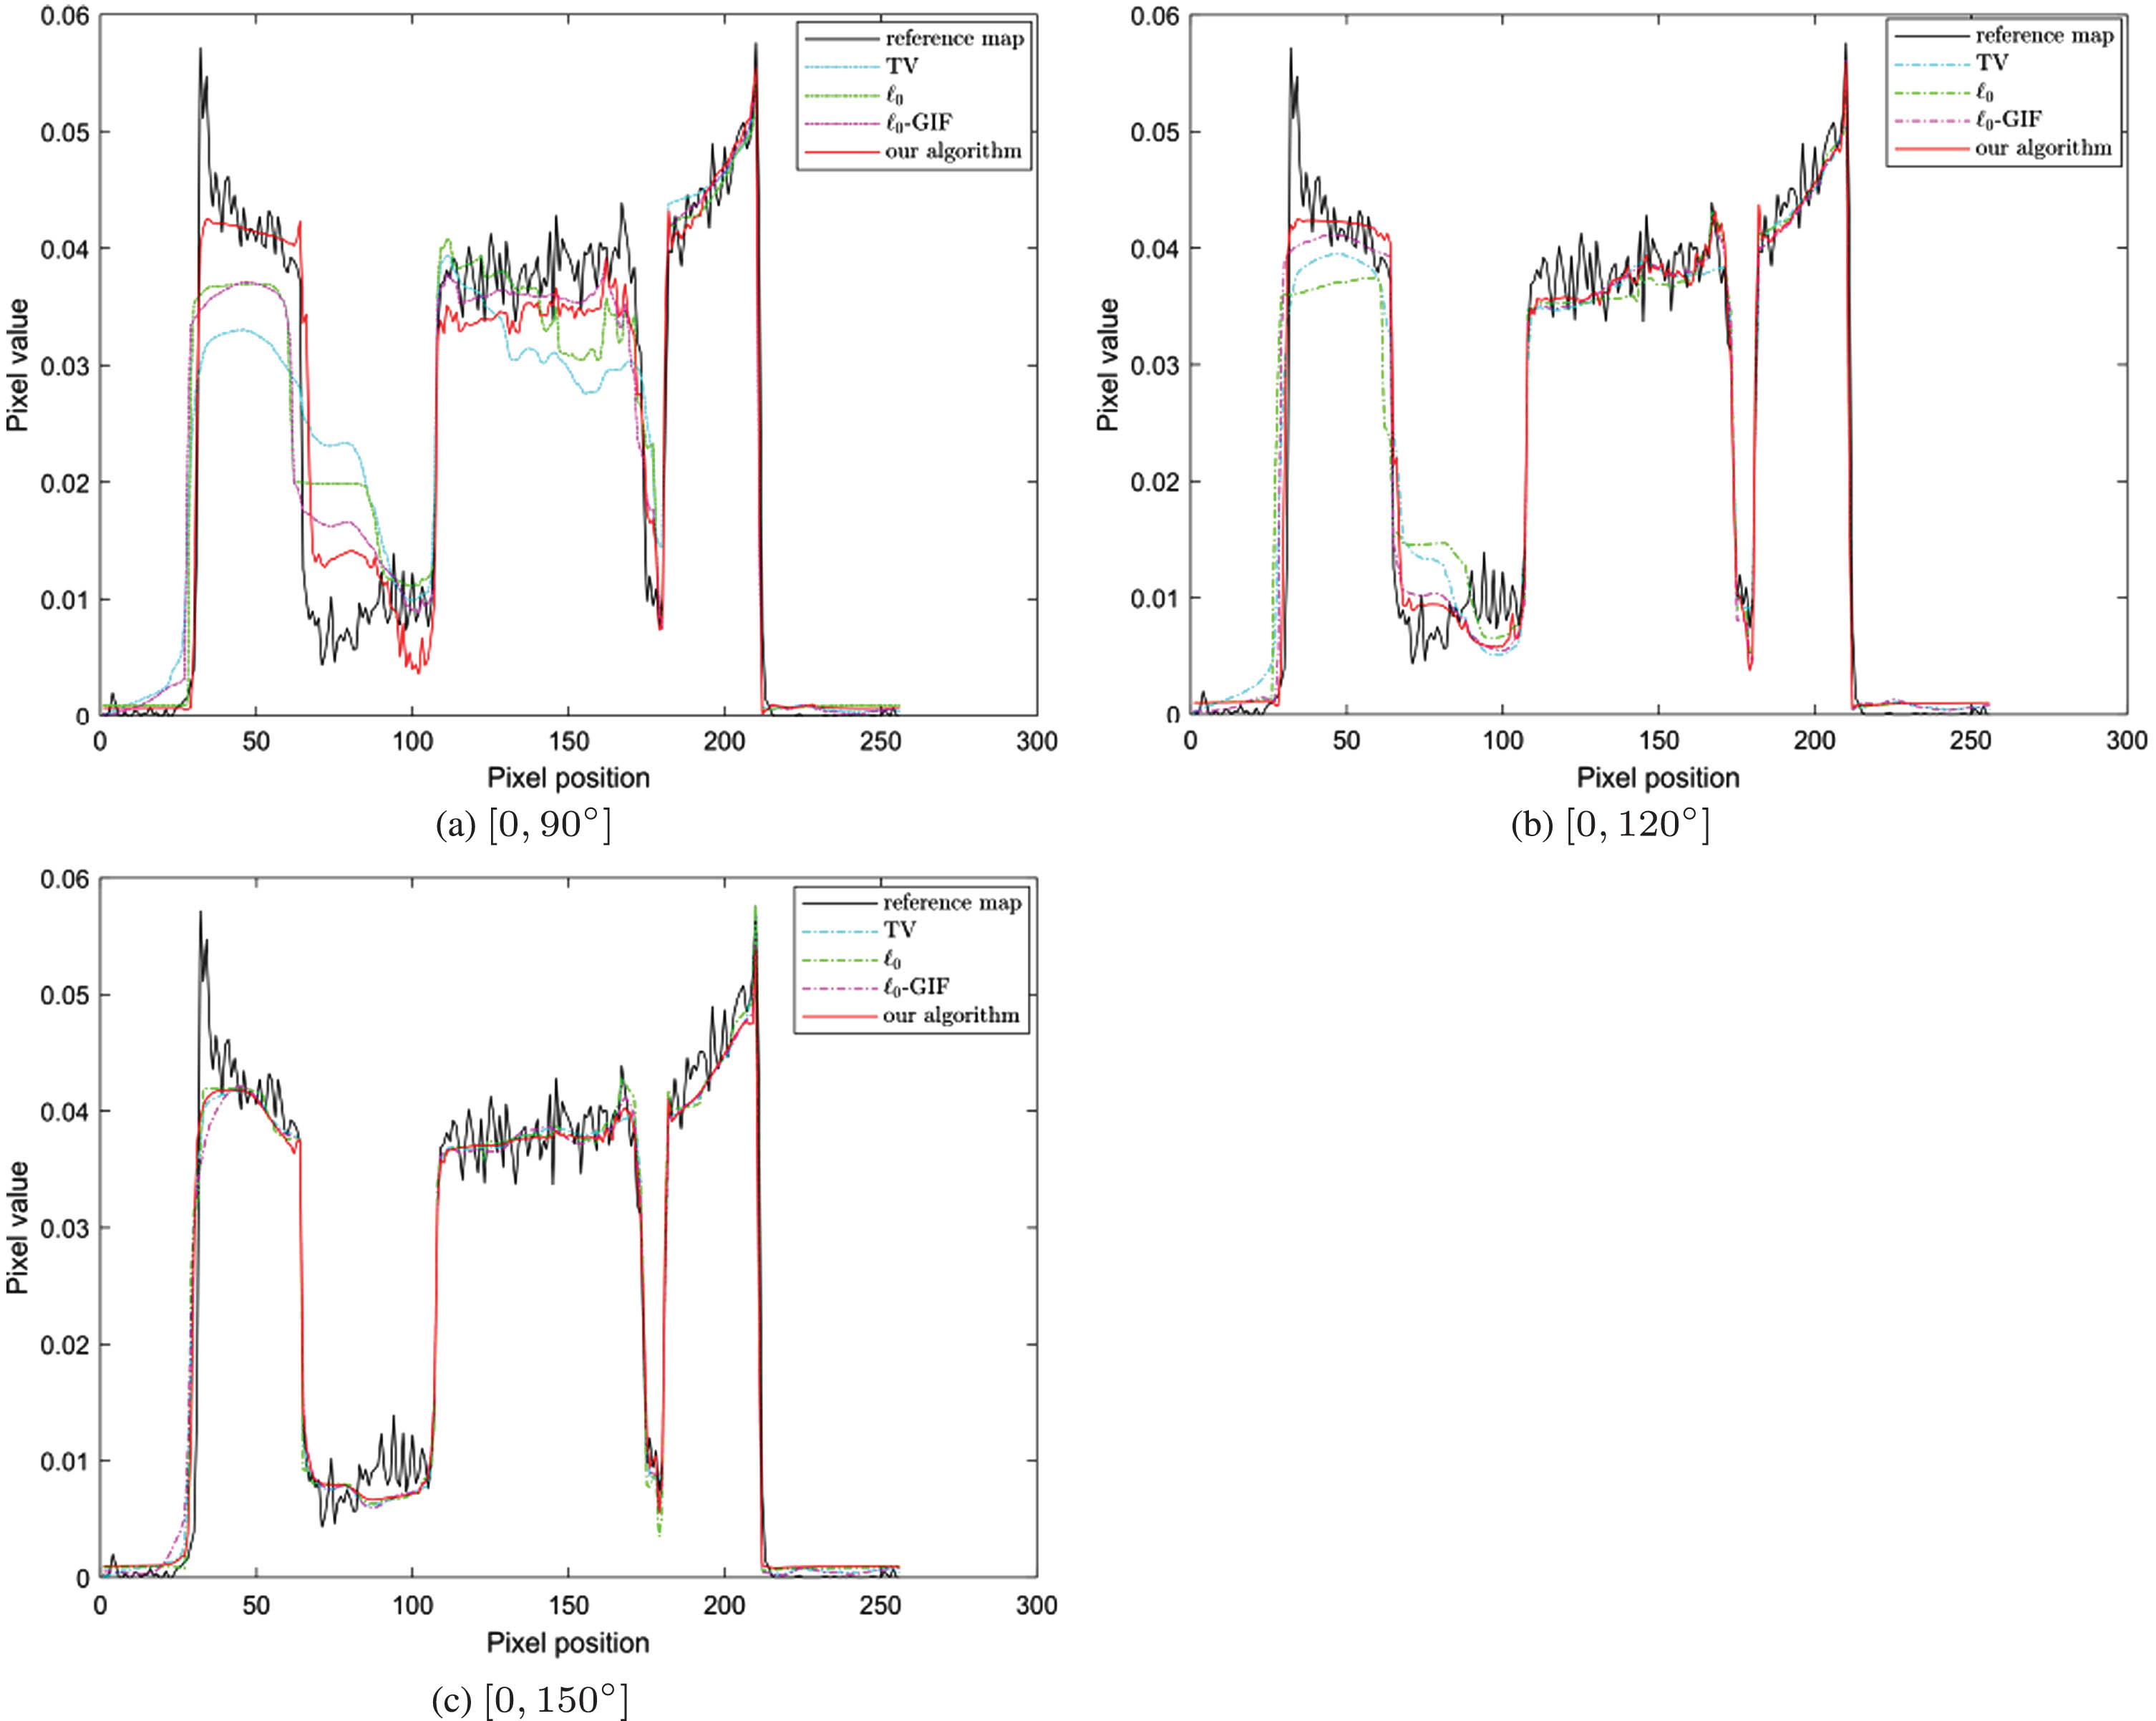
Horizontal profiles (100th row) of the reconstructed images of Edam cheese experiment by different algorithms in different scanning ranges [0, 90°], [0, 120°], [0, 150°].
Table 6 shows the PSNR, RMSE and SSIM values of reconstruction image. As can be seen from the values, except for ℓ0 minimization owns the highest SSIM values for scanning range [0, 150°], the proposed MM-SA-GIF method outperforms the other three methods in these indices. Additionally, the rectangles in the left top of the reconstruction image as region of interest (ROI) 1 and the rectangles in the right bottom as ROI 2. To evaluate the restoration of image edges more intuitively, we calculated the image quality index of the ROIs in the reconstructed images.
The image quality index values of Edam cheese experiment reconstruction iamge
Table 7 shows the image quality index values of the ROI of the reconstruction image using different methods. As seen from Table 7, the MM-SA-GIF method owns the best PSNR, RMSE and SSIM values of ROI 1 for all three scanning ranges. For ROI2, the MM-SA-GIF method owns the best SSIM value for scanning range [0, 90°] and [0, 120°]. The ℓ0 minimization owns the best PSNR and RMSE values of ROI 2 for scanning range [0, 150°], the MM-SA-GIF method owns the best SSIM value for scanning range [0, 150°]. From the perspective of image quality indices, although the ℓ0 minimization owns the best PSNR and RMSE values for scanning range [0, 150°], the reconstructed image of the proposed MM-SA-GIF method is more similar to the reference image in structure due to we introduce SSIM to guide the optimization.
The image quality index values of ROI
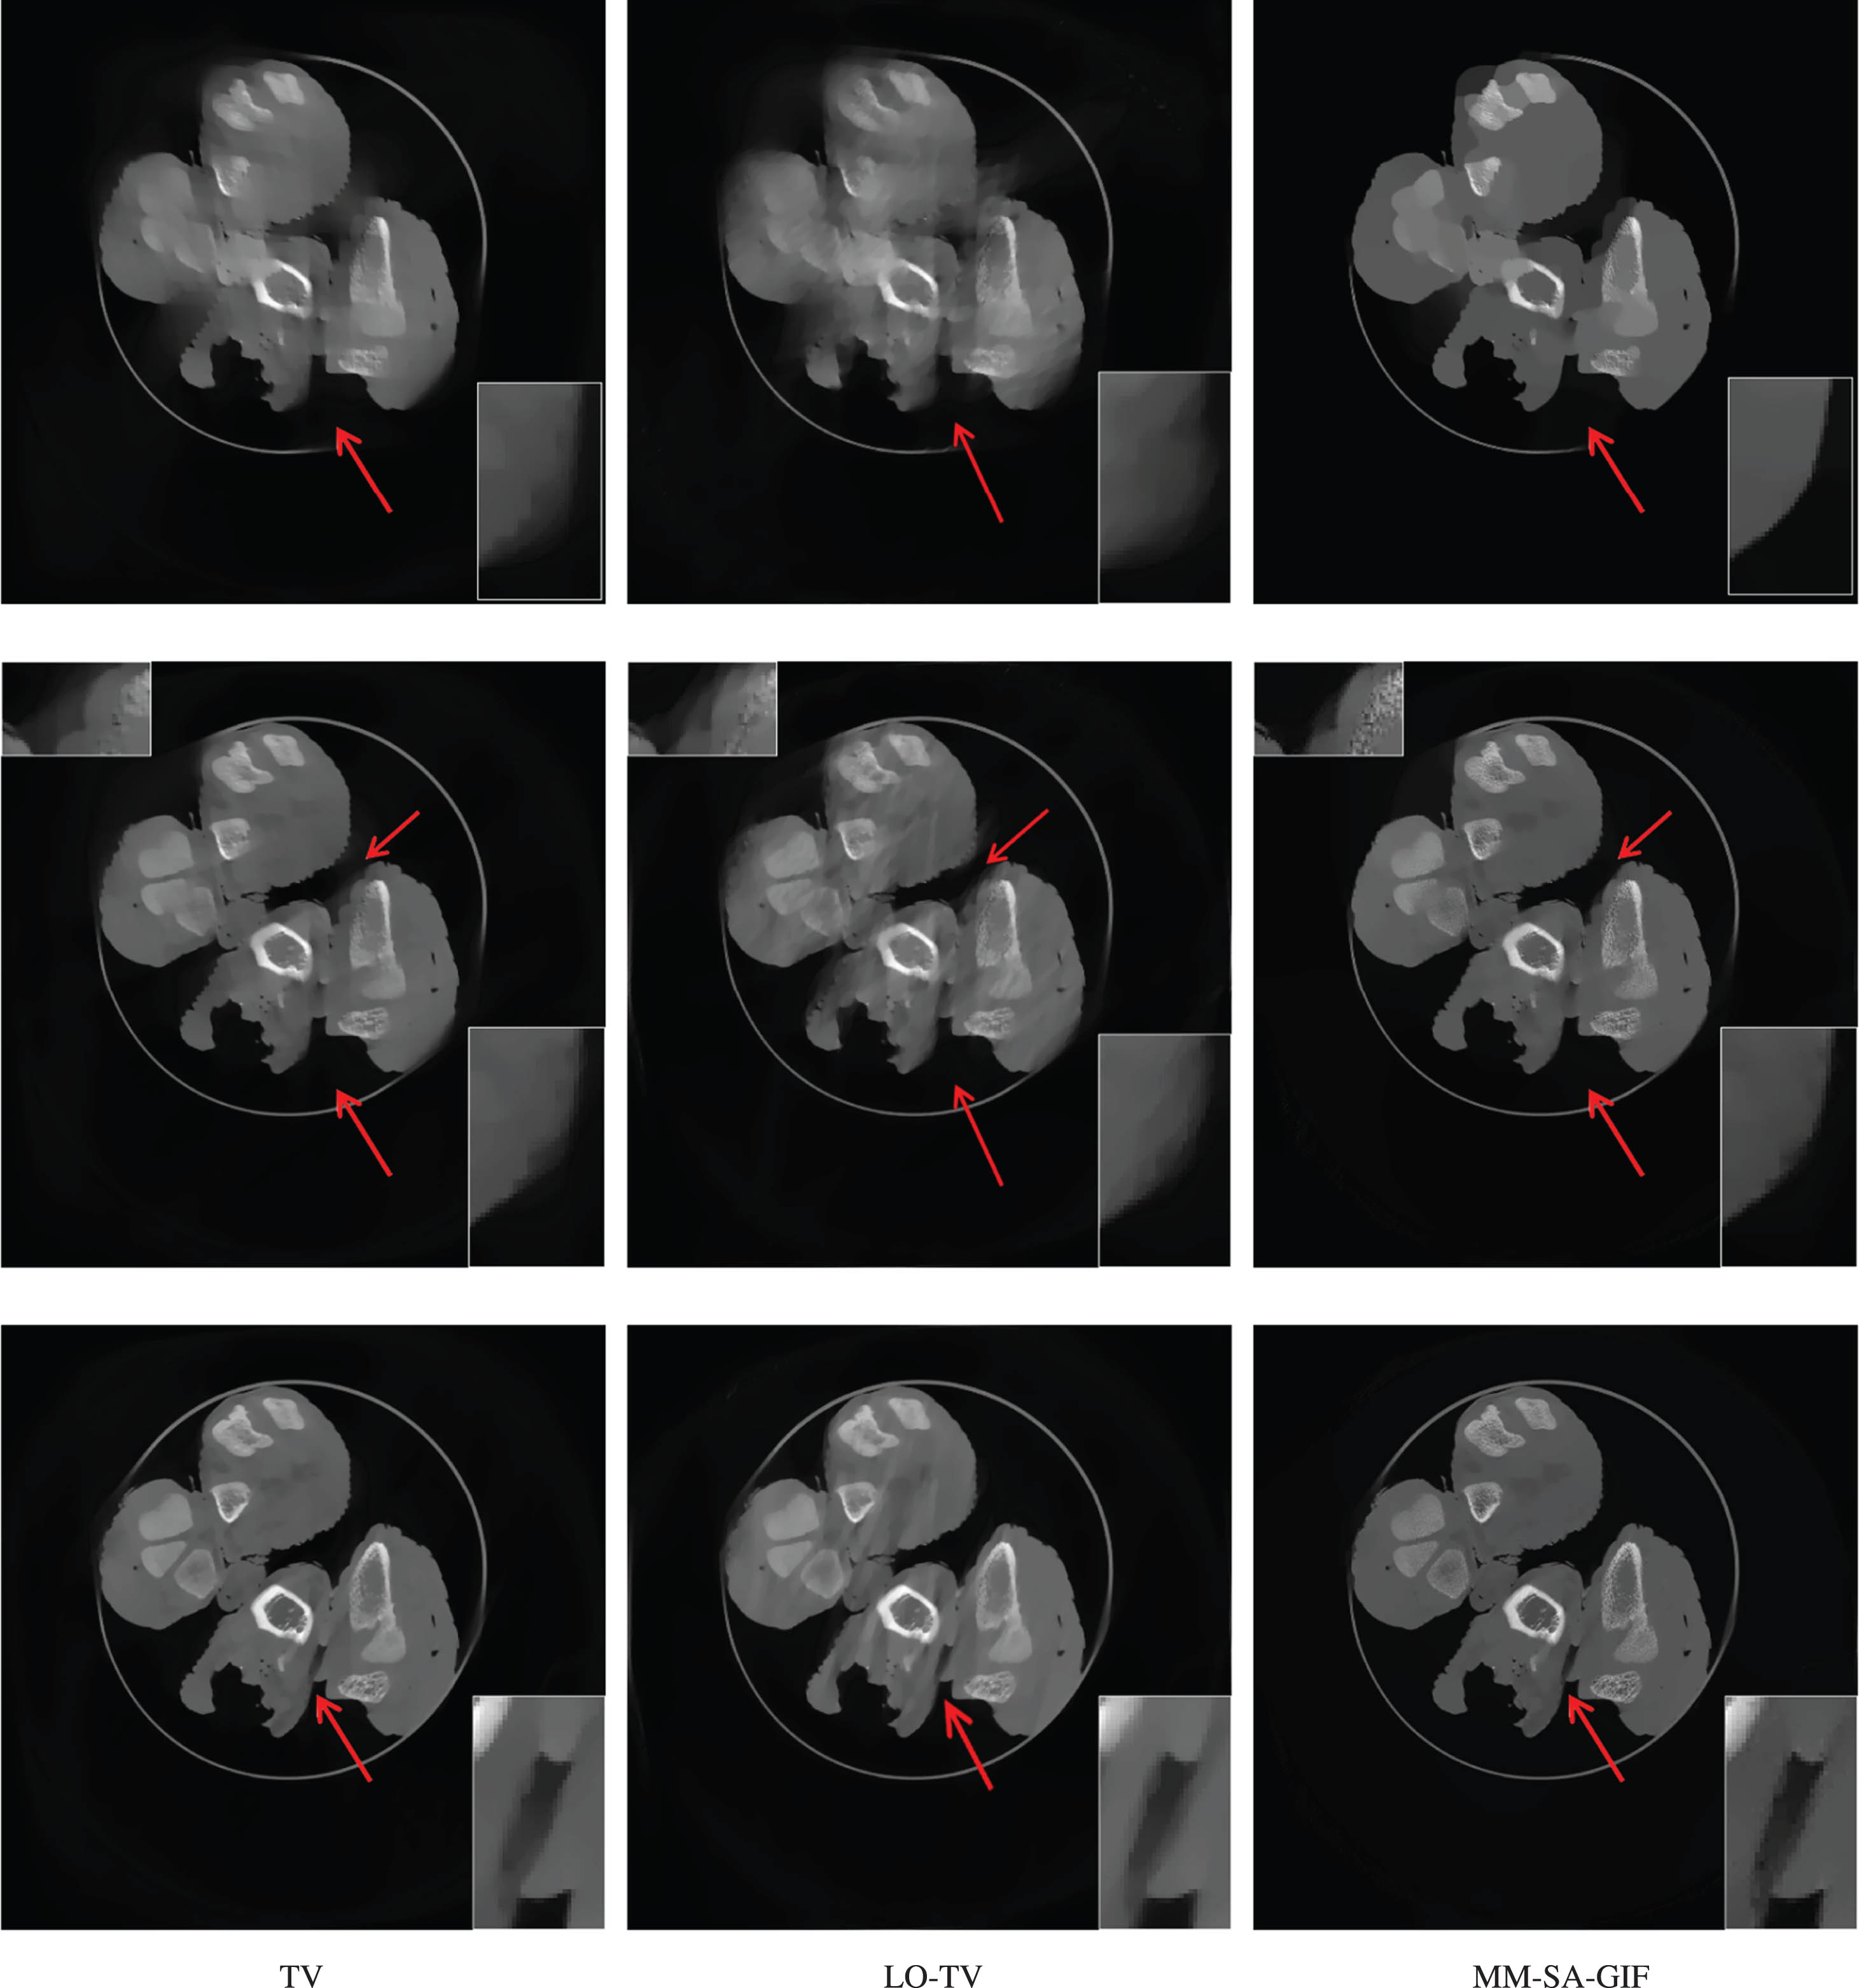
Figure 11 presents the reconstruction results of the TV minimization, LO-TV method, and MM-SA-GIF method. The second column showcases the reconstruction results using the LO-TV method. It is evident from the image that the reconstructed image obtained through the LO-TV algorithm exhibits fold artifacts. This occurs because the SART, when used with insufficient projection data, often produces significant artifacts. Consequently, applying TV regularization on top of the SART reconstruction results can still result in fold artifacts in the reconstructed image. In addition, this method often leads to oversmoothing, which causes the loss of details and reduces the overall clarity of the image.
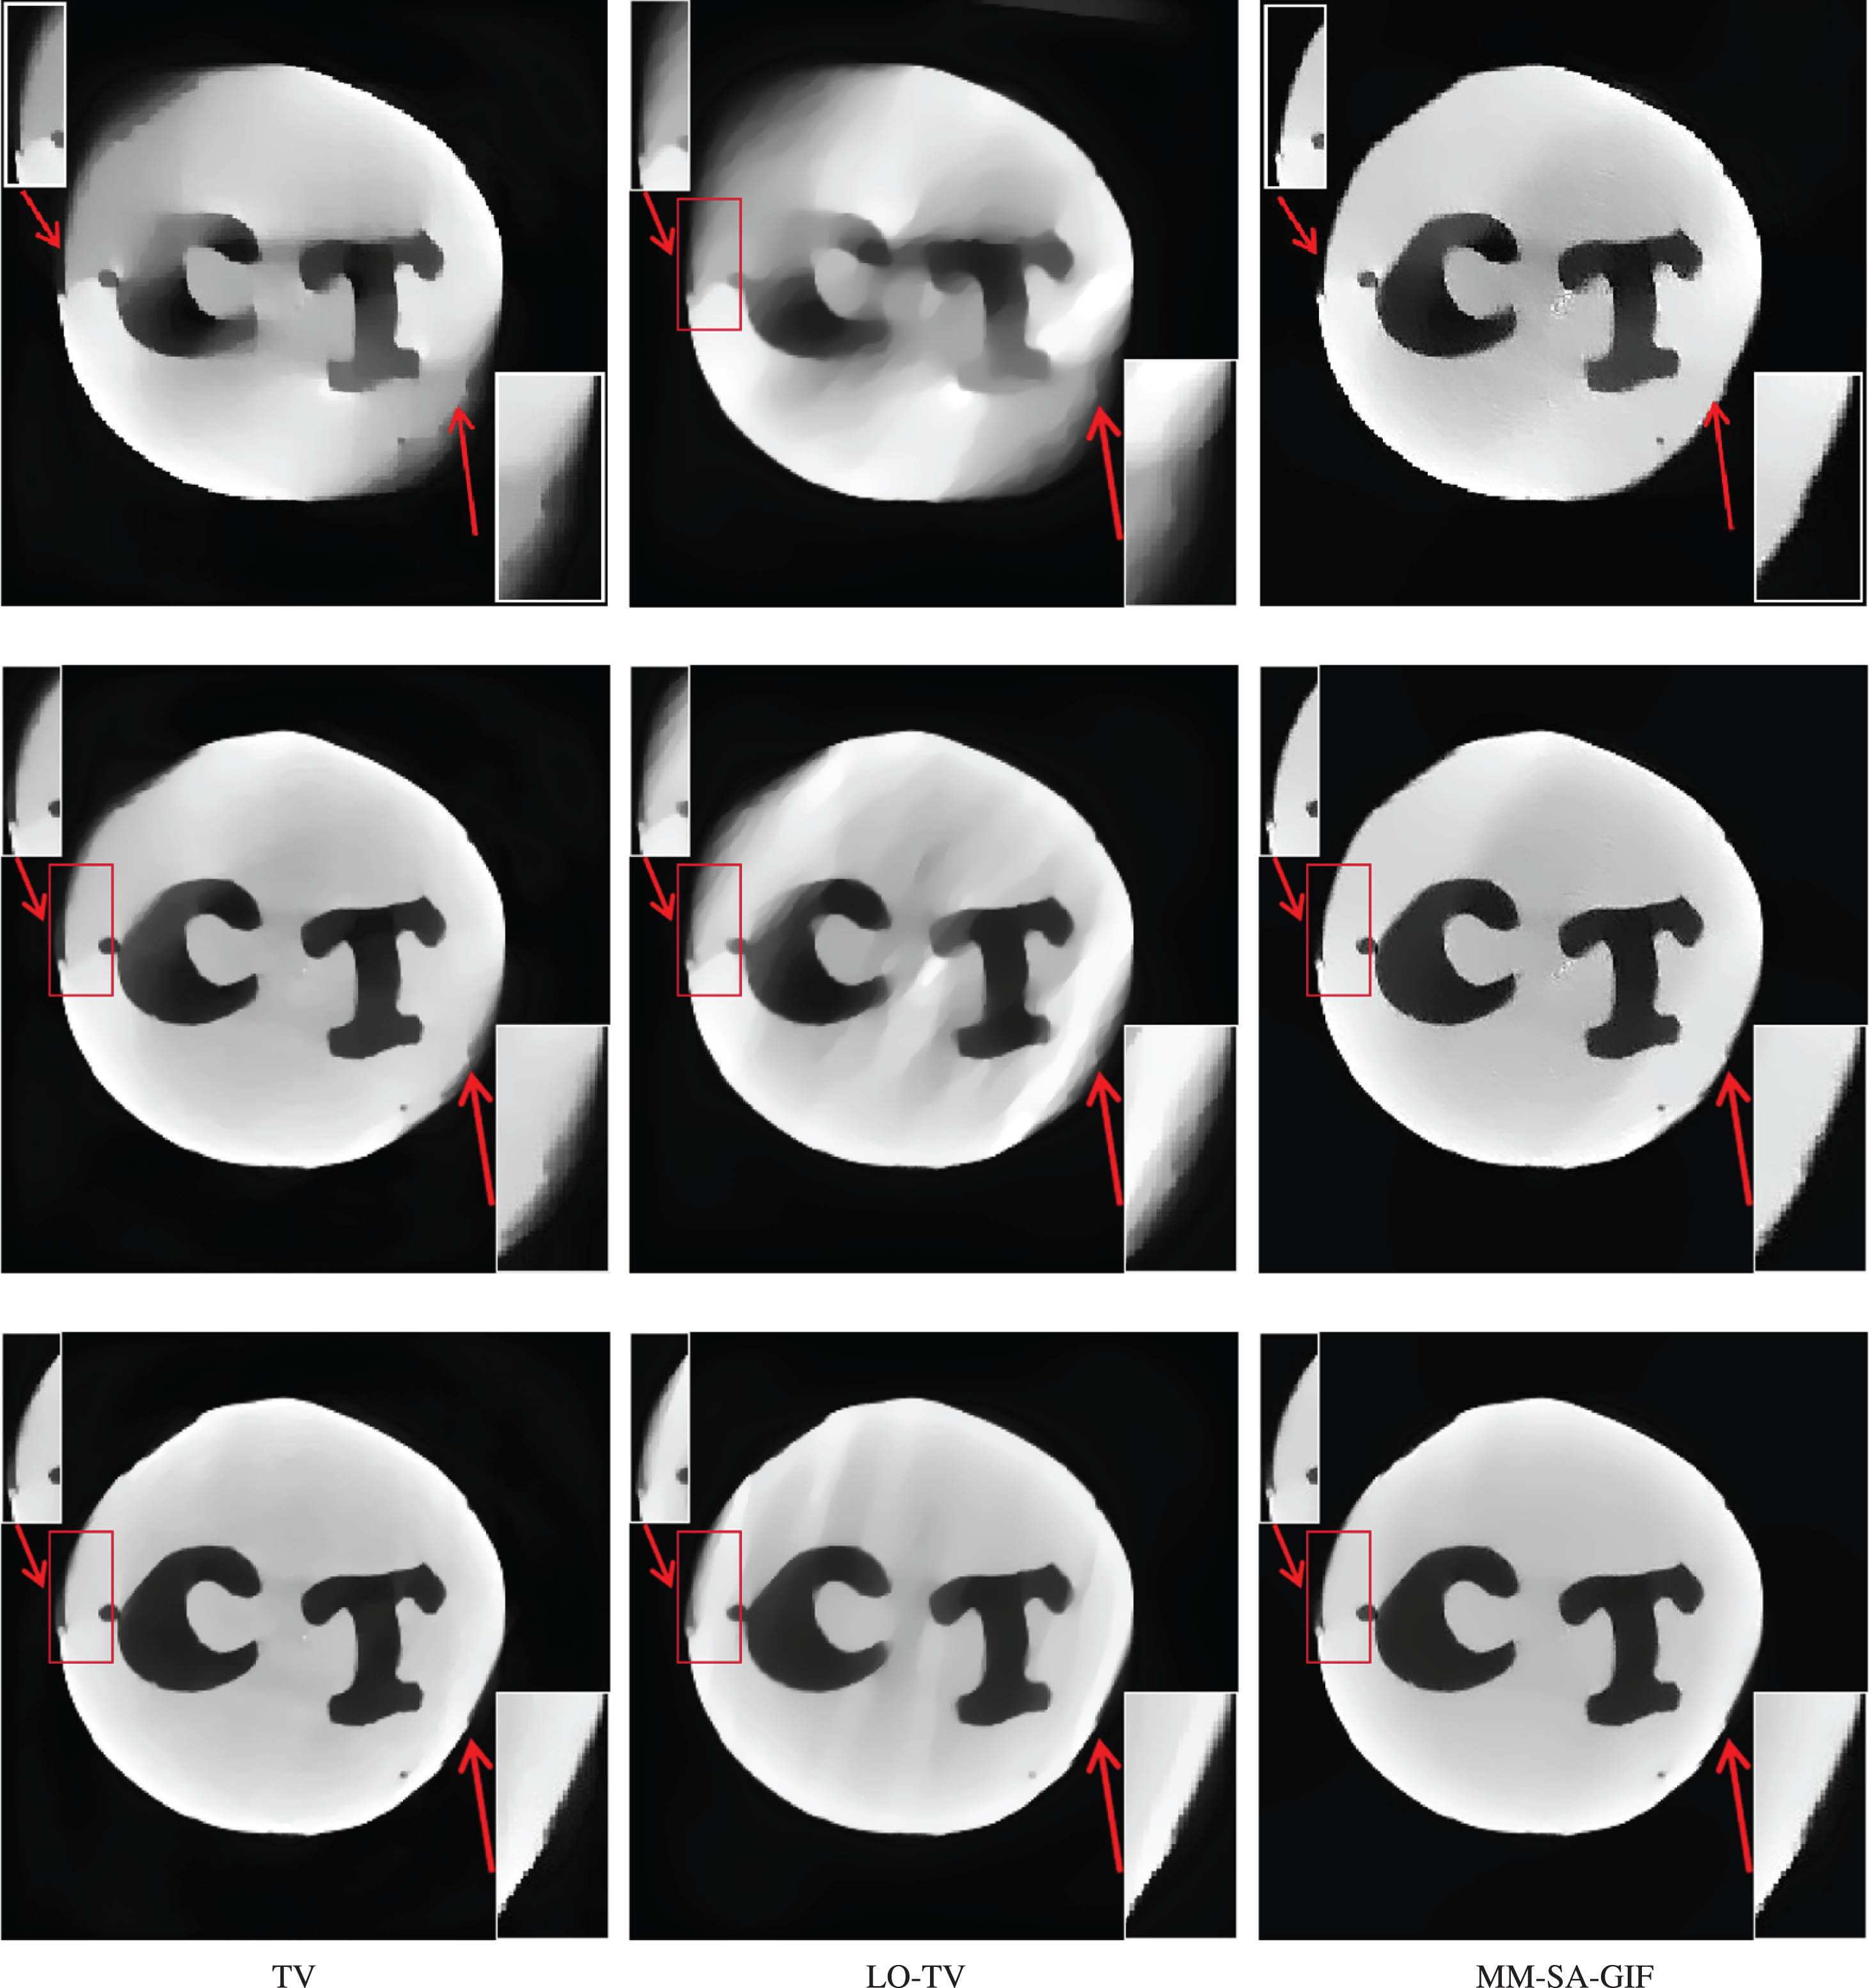
The reconstruction results of Edam cheese experiment of TV minimization, LO-TV method, and MM-SA-GIF method. From the first row to the third row correspond to scanning angles of [0, 90°], [0, 120°] and [0, 150°], respectively. From the first column to the third column, the reconstruction results of TV minimization, LO-TV method, and MM-SA-GIFmethod are in turn.The display window for the reconstruction images is [0,0.05]. The rectangles are the enlarged detail areas. The red arrows indicate whether the edge details of the reconstructed image are restored.
Another real projection data of a drumstick is utilized to evaluate the perfomance of the proposed method. The geometrical scanning parameters of CT systems are shown in Table 8.
The geometrical scanning parameters of CT system
The geometrical scanning parameters of CT system
In the experiments, we investigated scanning ranges of [0, 90°], [0, 120°], and [0, 150°], with the following reconstruction parameters: For TV minimization: the parametes N TV = 20, α TV = 0.2. For ℓ0 minimization: (1) for the scanning range [0, 90°], η = 0.00000085, κ = 15; (2) for the scanning range [0, 120°], η = 0.00000085, κ = 15; (3) for the scanning range is [0, 150°], η = 0.00000075, κ = 15. For ℓ0-GIF method: (1) for the scanning range [0, 90°], η = 0.000005, κ = 15, r = 2, ɛ = 1.1 × 10⁻⁶; (2) for the scanning range [0, 120°], η = 0.00000085, κ = 15, r = 2, ɛ = 1.1 × 10⁻⁶; (3) for the scanning range [0, 150°], η = 0.00000075, κ = 15, r = 2, ɛ = 1.1 × 10⁻⁶. The stopping condition for the above three methods is reaching the number of iterations N = 3000 for each respective scanning range. For LO-TV method:(1) for the scanning range [0, 90°], the N SART = 500, N TV = 350, α TV = 0.0005; (2) for the scanning range [0, 120°], the N SART = 500, N TV = 350, α TV = 0.0005; (3) for the scanning range [0, 150°], the N SART = 500, N TV = 350, α TV = 0.0004; For our method MM-SA-GIF, the reconstruction parameters are provided in Table 9.
The reconstruction parameters of Drumstick Experiment
Figure 12 shows the reference image, which we reconstructed the image by TV minimization from the scanning range [0, 360°]. Figures 14–16 display the reconstructed drumstick images obtained using TV minimization, ℓ0 minimization, ℓ0-GIF method and our method for scanning range [0, 90°], [0, 120°] and [0, 150°]. As can be seen from Fig. 14, for the scanning range [0, 90°], our proposed method outperforms TV minimization, ℓ0 minimization and ℓ0-GIF method in suppressing artifacts and preserving edges, but the image reconstructed by our proposed method is oversmooth. From Fig. 15, for the scanning range is [0, 120°], the reconstructed image of TV minimization and ℓ0 minimization have streak artifacts and the edges are not clear enough, with ℓ0-GIF method showing better artifact suppression compared to ℓ0 minimization.In the enlarged images at the bottom right, our proposed method effectively suppresses artifacts while preserving image edges, particularly evident in soft tissue edges. Moreover, in the enlarged images at the top left, our proposed method demonstrates superior artifact suppression in detail compared to other methods. As can be seen from Fig. 16, for the scanning range is [0, 150°], the reconstructed image of ℓ0 minimization is still exists a few streak artifacts, and the edge details are not clear enough. Compared with ℓ0 minimization, the other three method can effectively suppress artifacts. From the enlarged detail images in the right bottom, our proposed method is better in restoring image edge details.
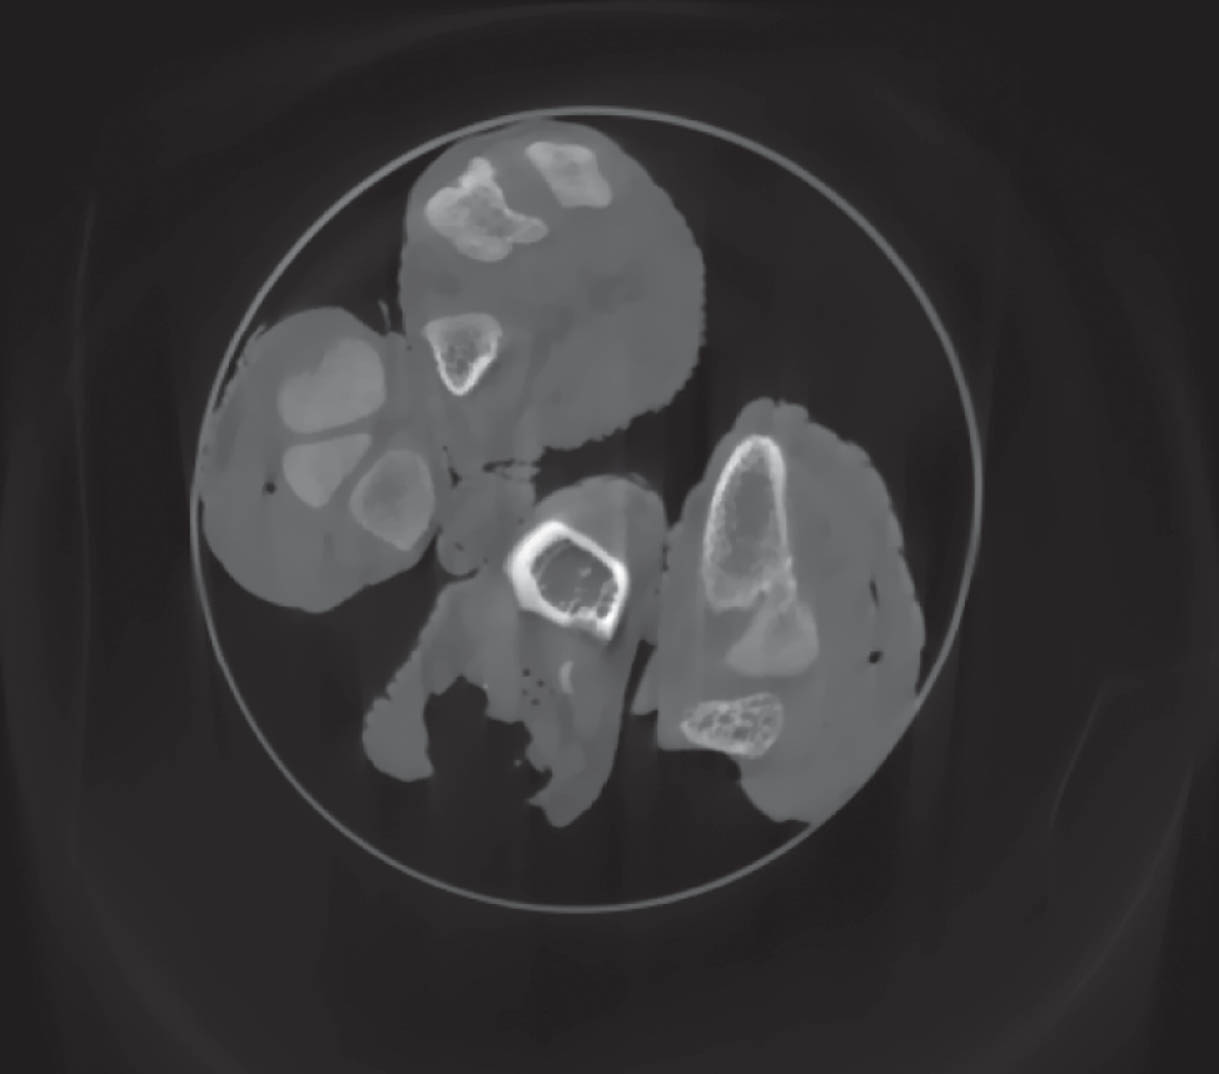
The reference image of drumstick.
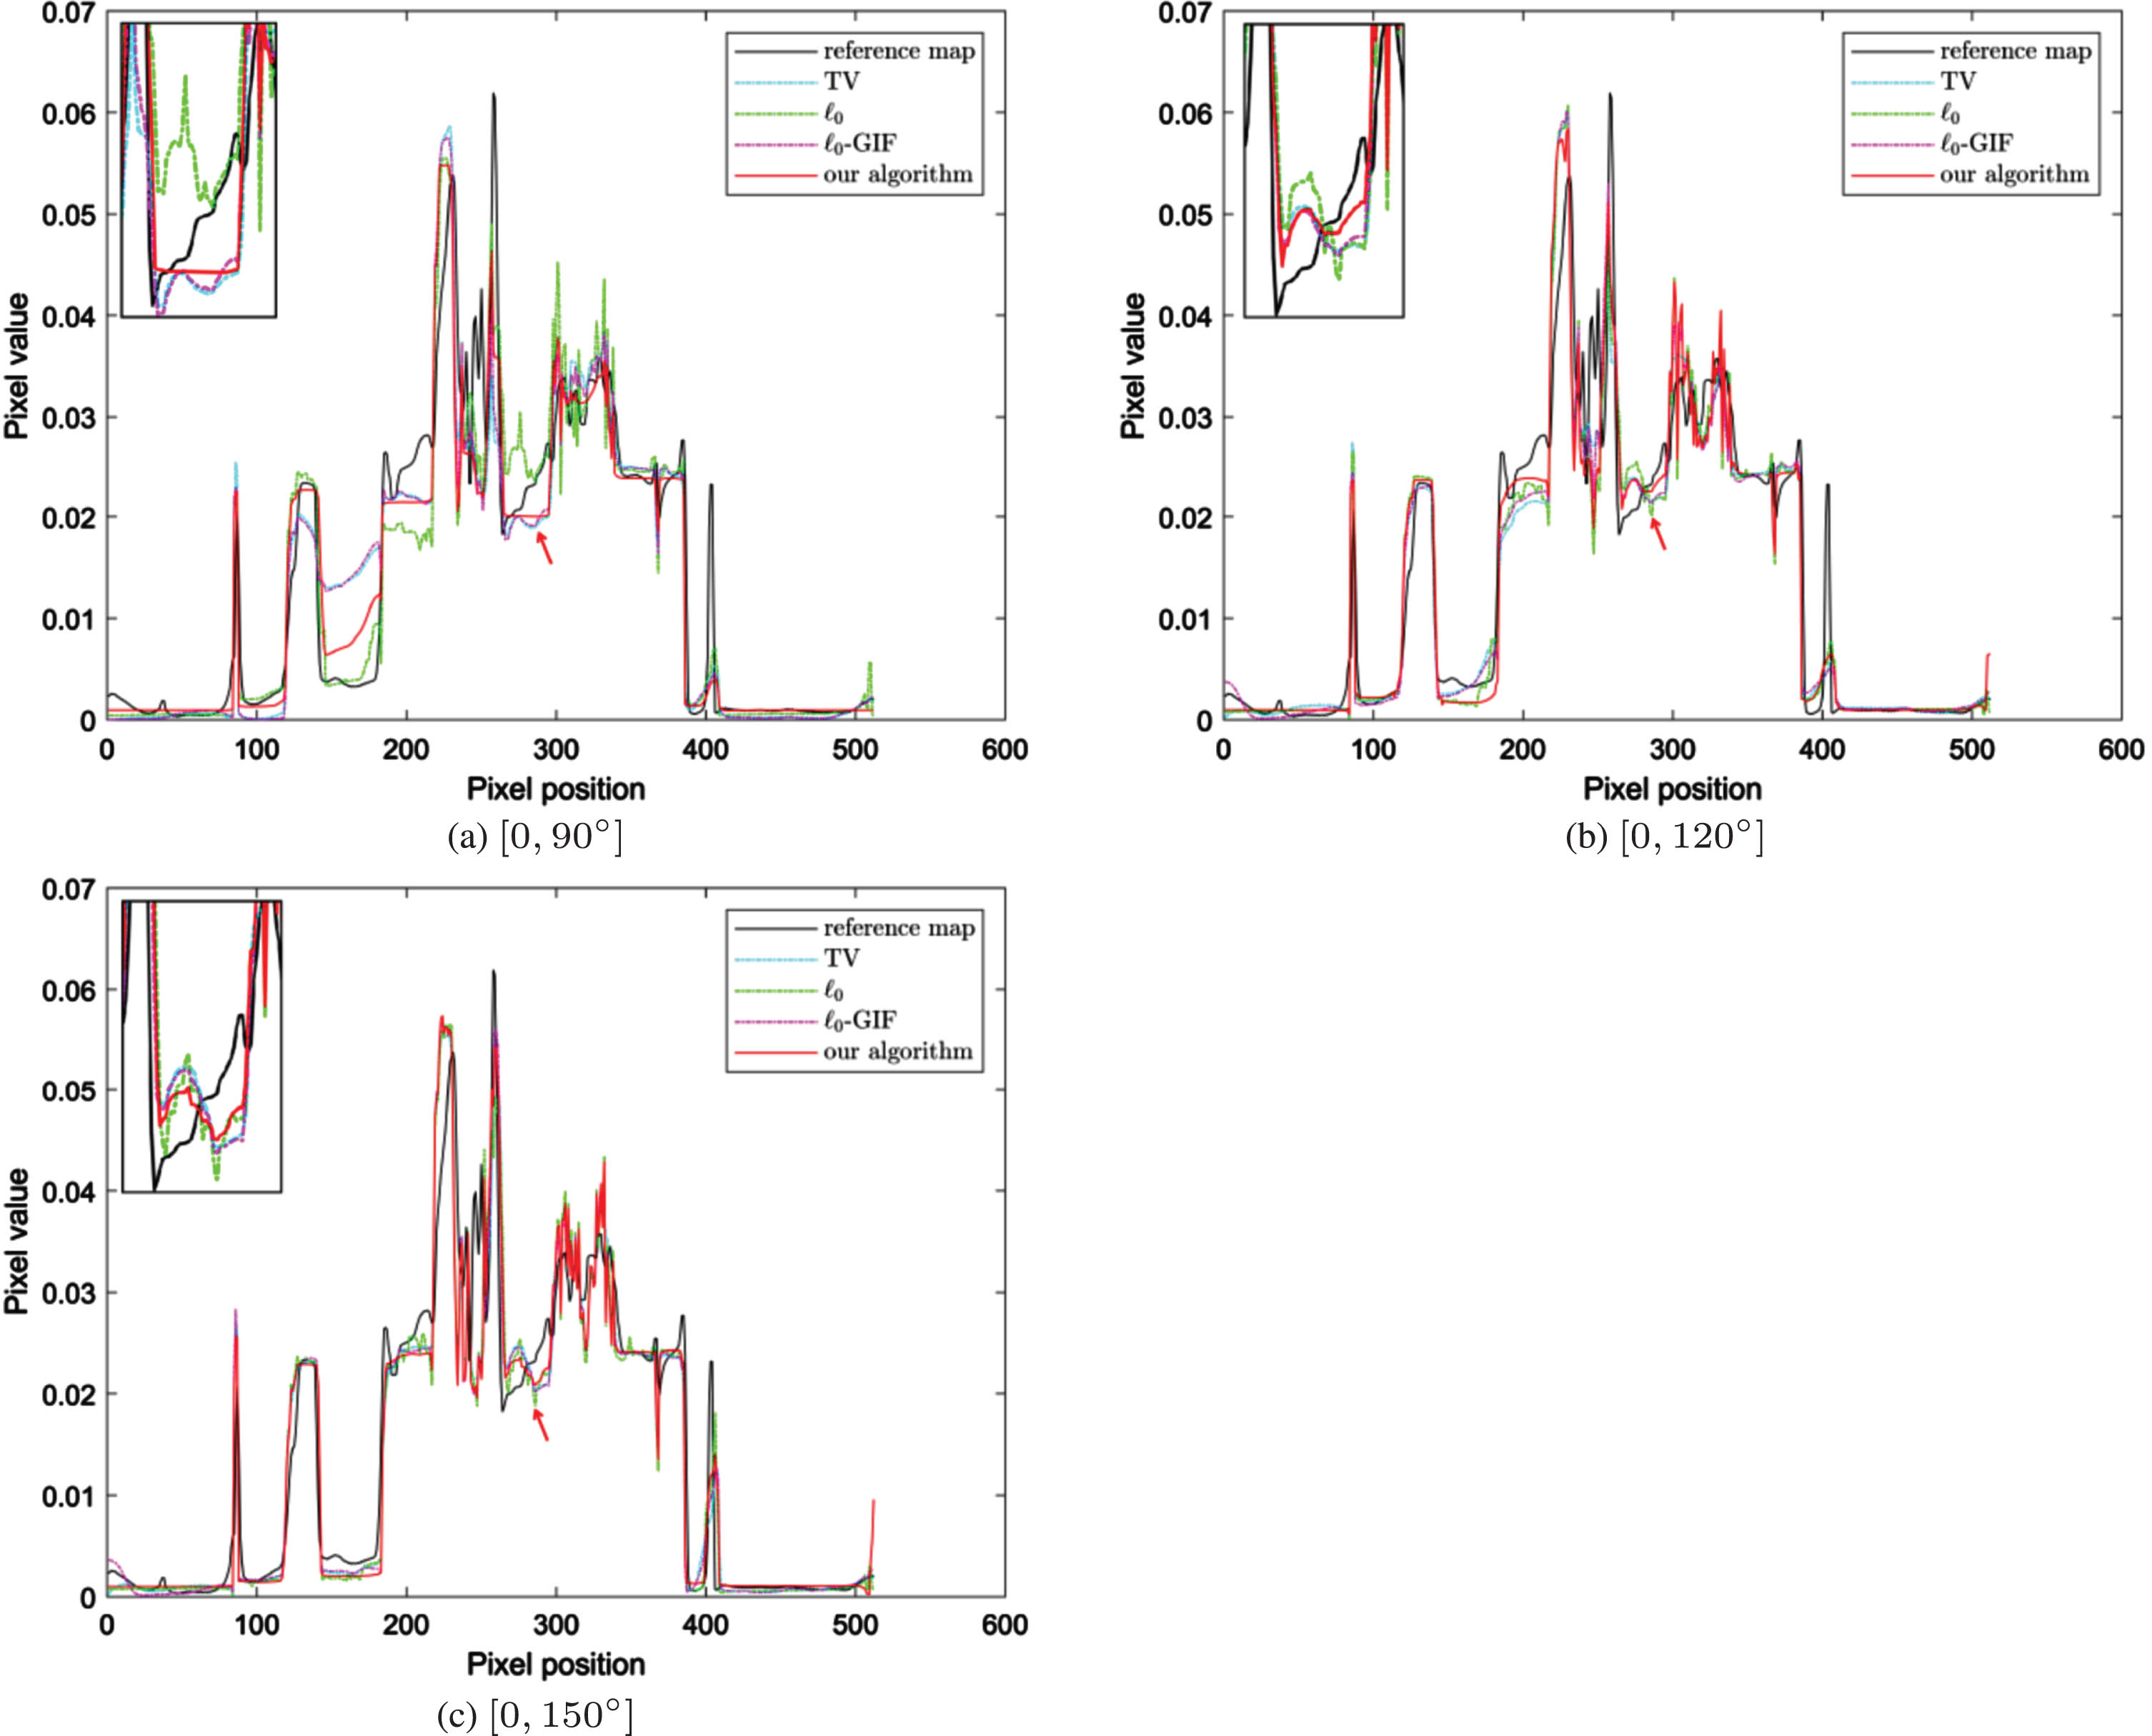
Horizontal profiles (256th row) of the reconstructed images of drumstick experiment by different algorithms in different scanning ranges [0, 90°], [0, 120°], [0, 150°]. The rectangles in the left up are the details of the horizontal profiles by red arrows.
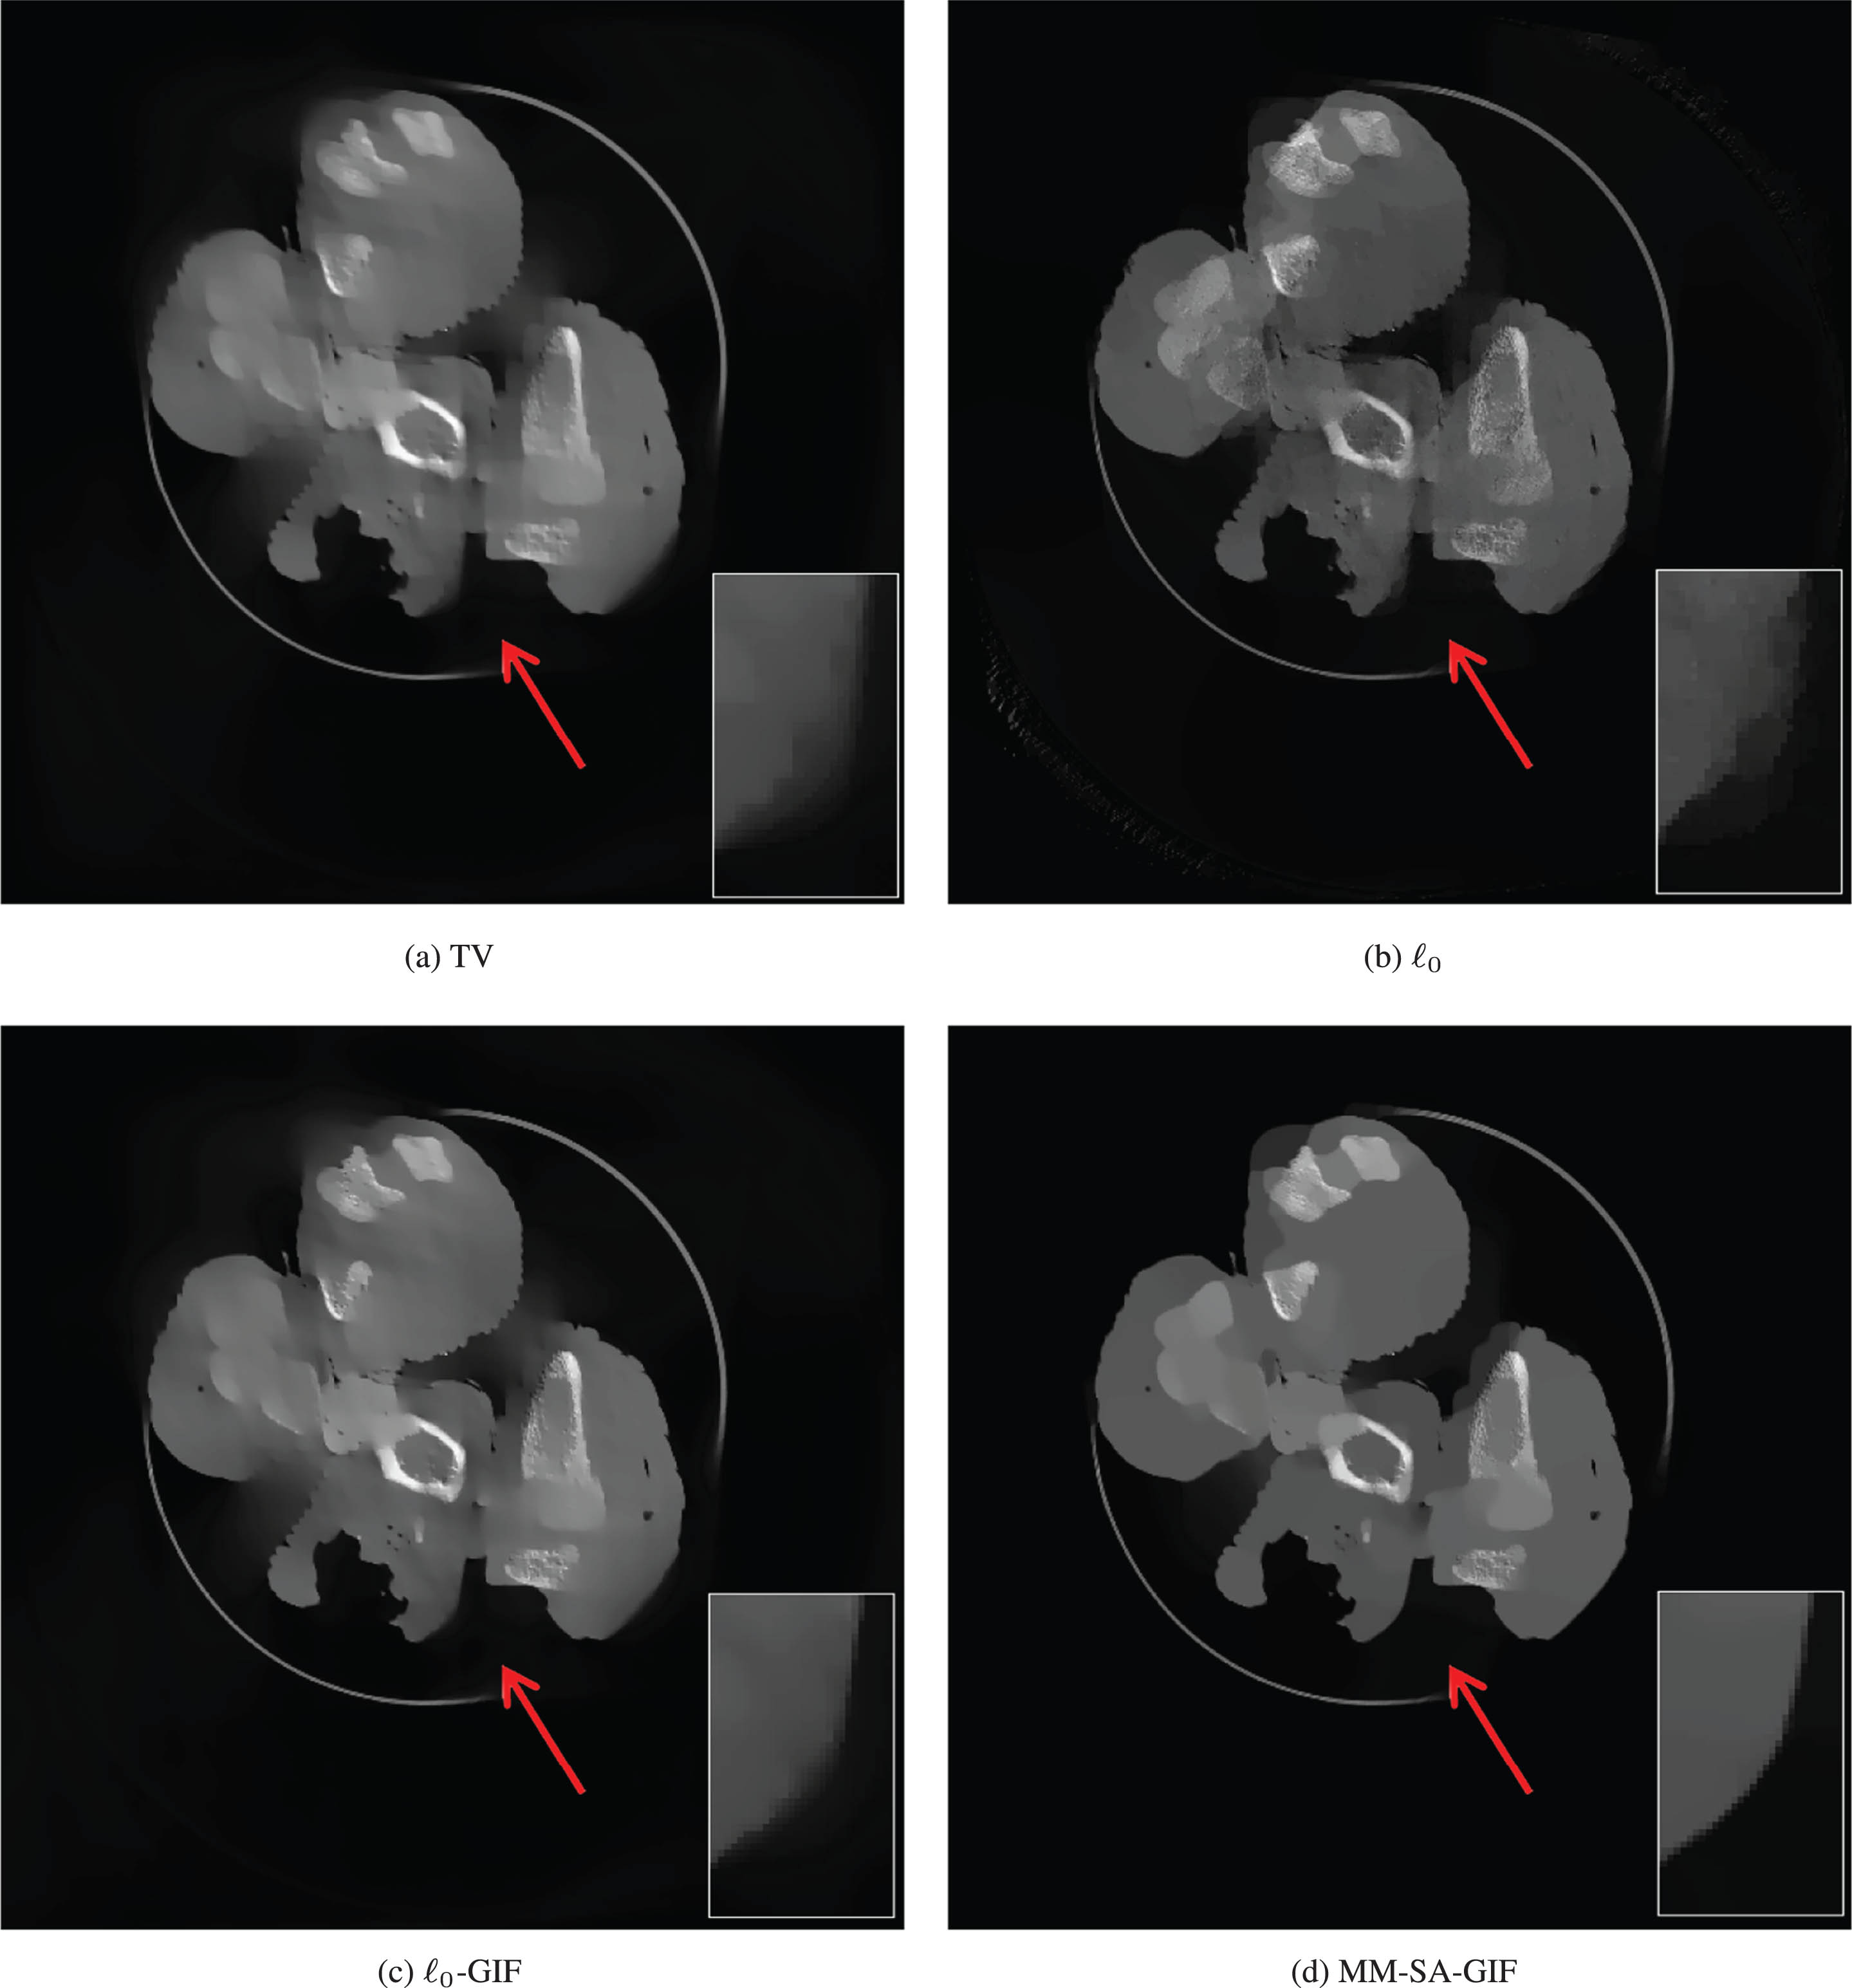
The results of drumstick experiment reconstructed images using different methods for the scanning range [0, 90°]. The top Left is the result reconstructed by TV minimization, the top right image using ℓ0 minimization, the bottom left image using ℓ0-GIF method, and the bottom right image using the MM-SA-GIF method. The rectangles in the bottom right corners are the enlarged detail areas. The red arrows indicate whether the edge details of the reconstructed image are restored.
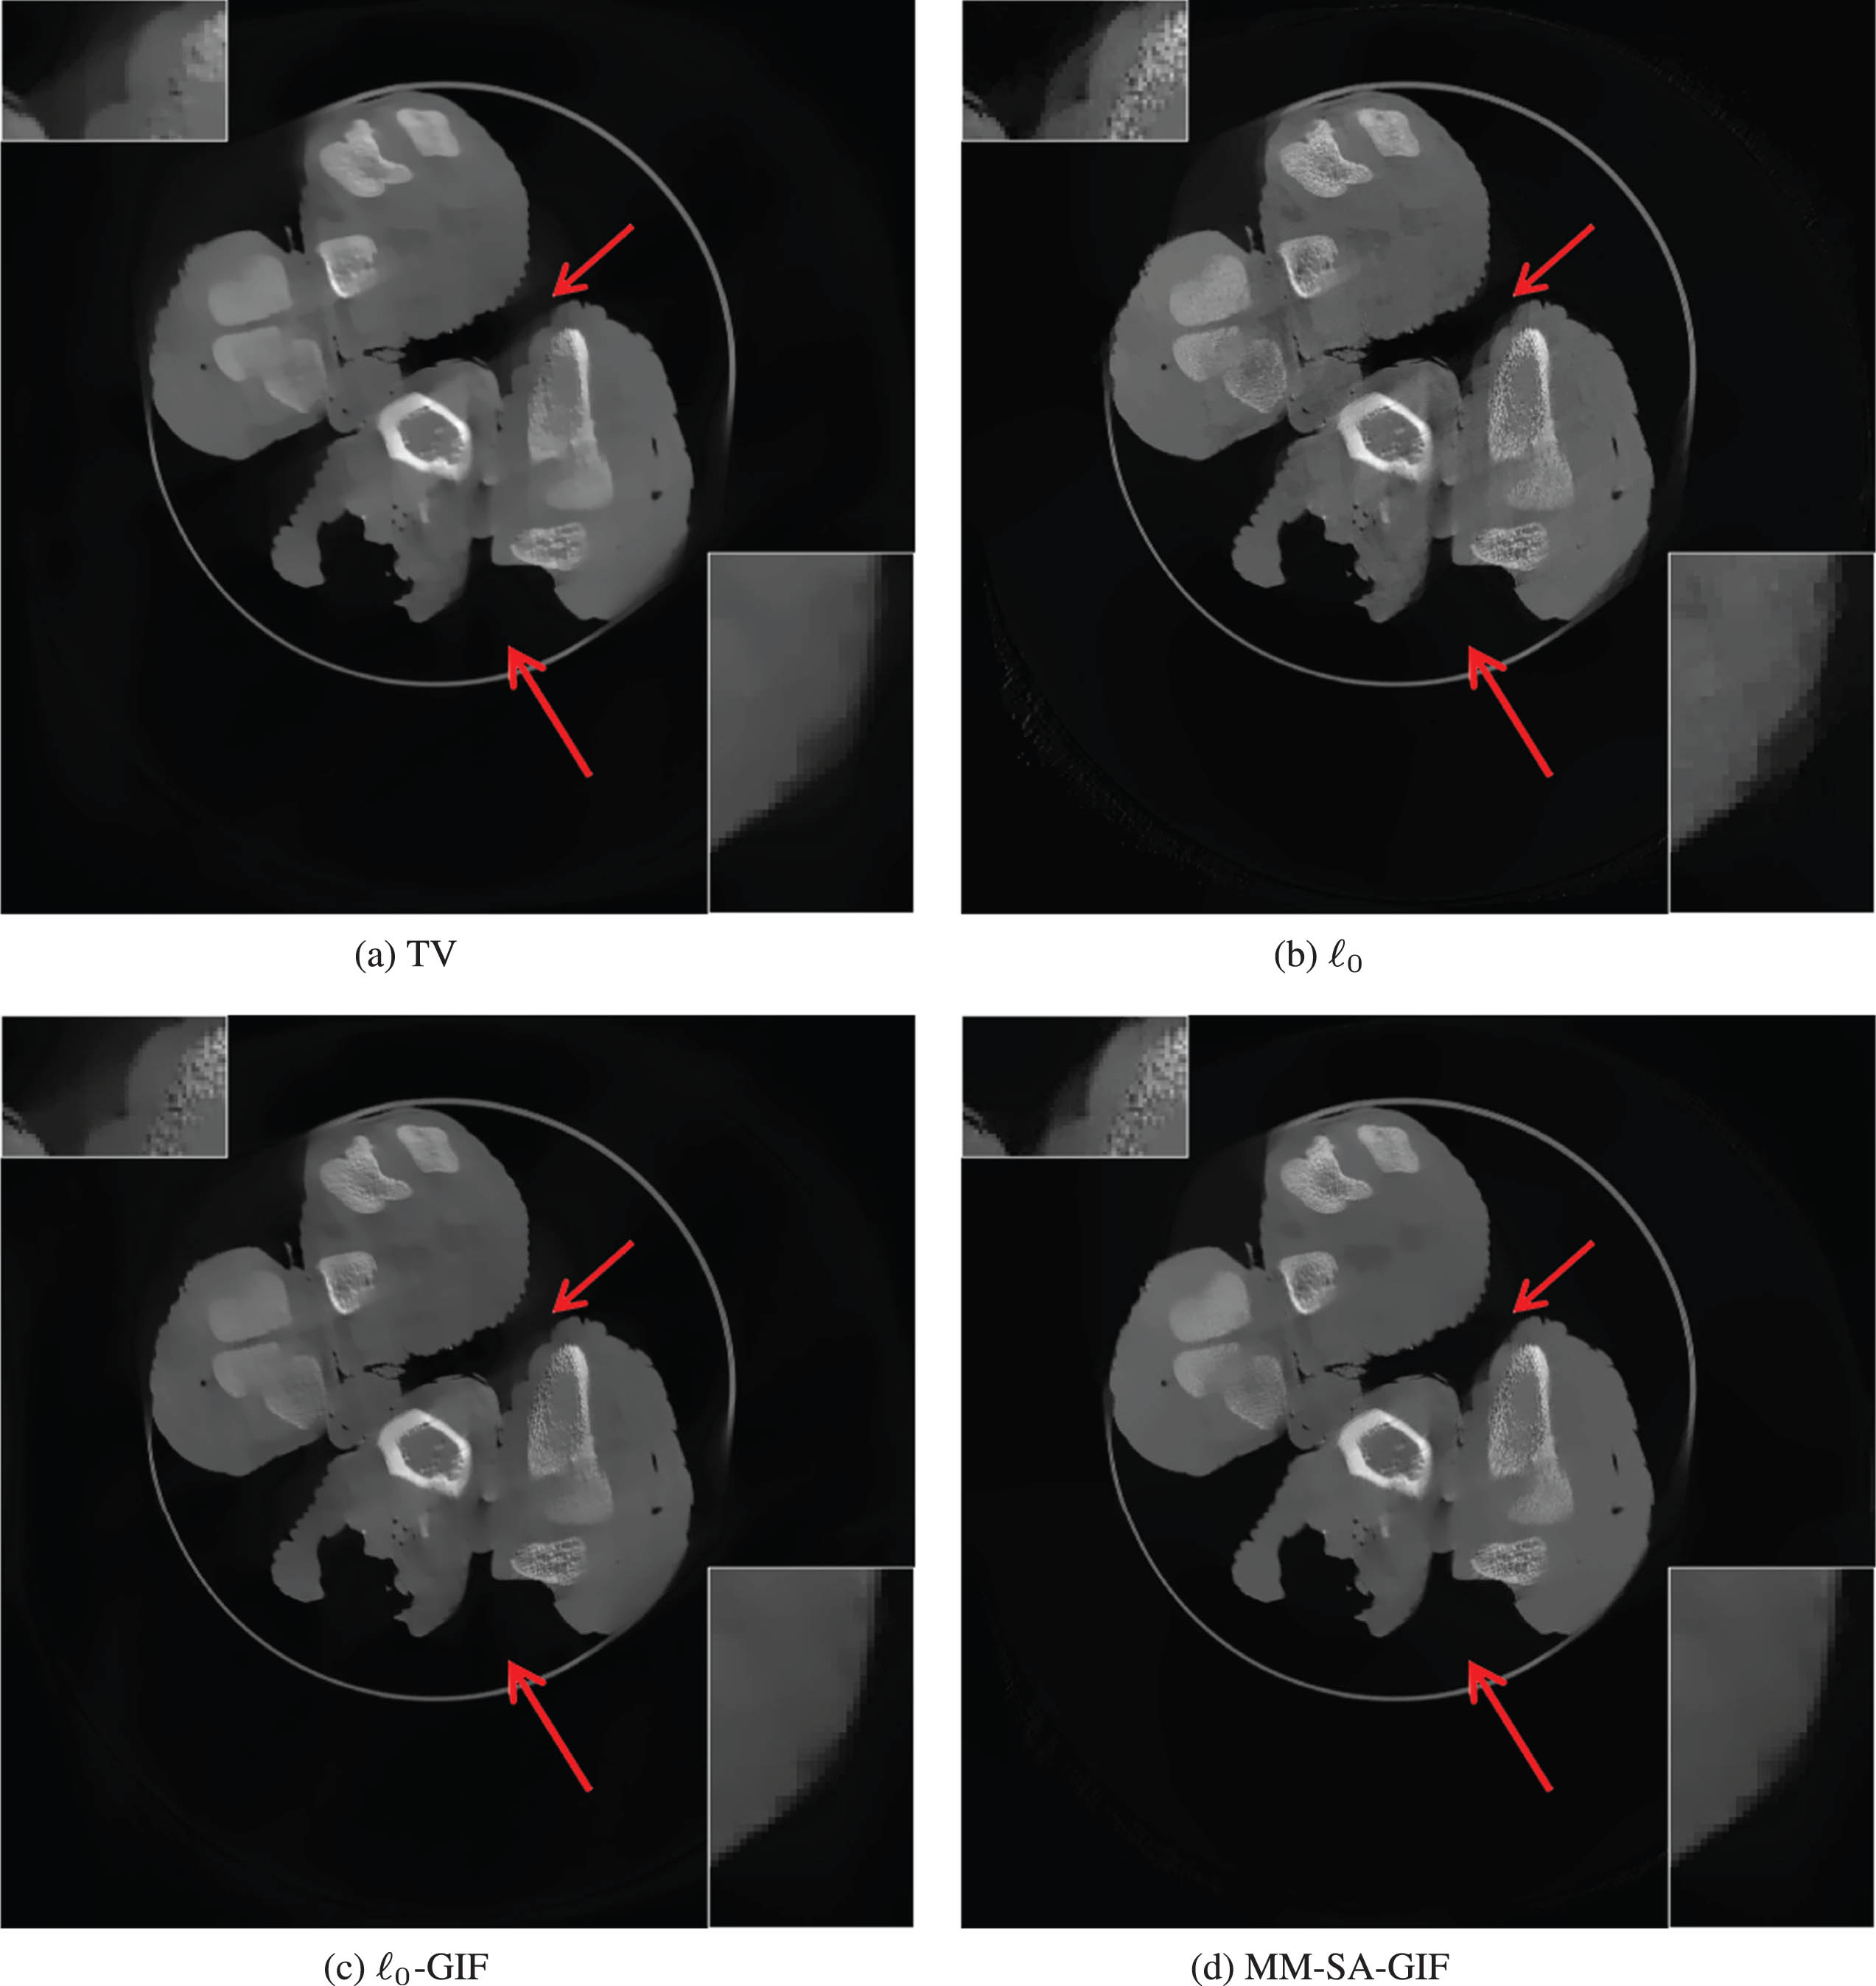
The results of drumstick experiment reconstructed images using different methods for the scanning range [0, 120°]. The top Left is the result reconstructed by TV minimization, the top right image using ℓ0 minimization, the bottom left image using ℓ0-GIF method, and the bottom right image using the MM-SA-GIF method. The rectangles in the top left and bottom right corners are the enlarged detail areas. The red arrows indicate whether the edge details of the reconstructed image are restored.
The results of drumstick experiment reconstructed images using different methods for the scanning range [0, 150°]. The top Left is the result reconstructed by TV minimization, the top right image using ℓ0 minimization, the bottom left image using ℓ0-GIF method, and the bottom right image using the MM-SA-GIF method. The rectangles in the bottom right corners are the enlarged detail areas. The red arrows indicate whether the edge details of the reconstructed image are restored.
Figure 13 displays the horizontal profiles (256th row) of the reconstructed image of drumstick experiment by different algorithms from different scanning ranges [0, 90°], [0, 120°], [0, 150°]. The rectangles in the left up are the enlarged image of horizontal profiles. As can be seen from Fig. 13, for the scanning ranges are [0, 90°] and [0, 120°], the horizontal profiles of the image of our proposed method is closer to the horizontal profiles of the reference image. For the scanning range is [0, 150°], the horizontal profiles of these four methods are all close to the reference image, but as can be seen from the enlarged image, our proposed method are more close to that of the reference image. It means that the image reconstructed by our proposed method is closer to the reference image in structure.
Table 10 shows the PSNR, RMSE and SSIM values of reconstructed images by different methods. In Table 10, for the scanning ranges of [0, 90°] and [0, 120°], the PSNR, RMSE and SSIM values of the proposed MM-SA-GIF method are better than those of the other three methods. For the scanning range of [0, 150°], the PSNR, RMSE and SSIM values of the TV minimization are better than other methods, however, as can be seen from the Fig. 16, the proposed method MM-SA-GIF is superior to TV minimization in suppressing artifacts, preserving reconstruction image edged and restoring image structural details. We should note that the values of the image quality index will be affected by the reference image, and because we introduce the SA algorithm to accept the degradation solution in the form of probability, so the SSIM values of TV minimization may be better than our proposed method. However, the SSIM values will not decline too much, because the probability of acceptance will be very low if the SSIM values decline too much.
The image quality index values of drumstick experiment reconstruction iamge
Figure 17 shows the reconstruction results of the TV minimization, LO-TV method, and MM-SA-GIF method. The second column displays the reconstruction results using the LO-TV method. Similar to the results from the simulated NCAT experiment and the Edam-cheese experiment, the images obtained using the LO-TV method exhibit significant stripe artifacts and continue to suffer from oversmoothing.
The reconstruction results of drumstick experiment of TV minimization, LO-TV method, and MM-SA-GIF method. From the first row to the third row correspond to scanning angles of [0, 90°], [0, 120°] and [0, 150°], respectively. From the first column to the third column, the reconstruction results of TV minimization, LO-TV method, and MM-SA-GIFmethod are in turn. The rectangles are the enlarged detail areas. The red arrows indicate whether the edge details of the reconstructed image are restored.
In this paper, we proposed a multiobjective optimization model for limited-angle CT reconstruction, aiming to enhance image quality. The multiobjective optimization model incorporates two objective functions: data fidelity term and ℓ0-norm of the image gradient. Unlike traditional scalarzation medthods minimizing the objective functions, we use the image quality index SSIM to guide the optimization process and solve this model by an iterative method. Firstly, we use SART to optimize the data fidelity term, and introduce SSIM to guided the optimization process. We cancluate the SSIM values between the iterative points and reference image. When the image quality degrades, the SA algorithm is introduced to accept the degradation solution in the form of probability. If the degraded solution is accepted, we repeat the use of SART to optimize the data fidelity term. Otherwise, we introduce the GIF method to further preserve the image edges and generate alternative solutions. Secondly, we take the result of the first step as the initial point and add it as a constraint to the second objective function. We use the ℓ0 minimization to optimize ℓ0-norm of the image gradient, and introduce SSIM, the SA algorithm, and GIF to guide the optimization process, similar to the first step. In the experiment part, we validate the superiority of our proposed method using both simulated data and real projection data experiments. The reconstructed results demonstrate that our method outperforms other methods in preserving image edges and suppressing artifacts. Horizontal profiles of the reconstructed images by different methods in various scanning ranges are plotted to visually observe the differences between the reconstructed image and the reference image. Compared with other methods, the profiles of our method are closer to those of the reference image than those of the other methods. Additionally, it is important to note that the choice of reference image can significantly impact the experimental data, and thus, careful selection of the reference image is necessary.
While our proposed method has advantages in suppressing artifacts and preserving edge details, the parameters selected in the reconstruction process rely on experience for manual debugging, which is laborious and time-consuming. If the scanning range is too small, the reconstructed image by our method maybe oversmooth. Furthermore, we need to acknowledge that our algorithm may have a lower SSIM value than other algorithms. This is primarily due to our utilization of the SA algorithm, which probabilistically accepts degraded solutions, leading to potentially lower SSIM values. However, despite this, the reconstructed images produced by our algorithm significantly outperform other algorithms in terms of edge preservation and artifact suppression.
In future research, since the SSIM value is influenced by the reference image and thereby impacts our reconstruction process. In future work, we plan to conduct a more comprehensive analysis to further understand the impact of different reference images on the SSIM values. Additionally, we will explore whether there is an image quality index that does not rely on a reference image.
Footnotes
Acknowledgments
This work was supported by the National Natural Science Foundation of China (NSFC) (No.61801086, No.62371184, No.11991024, No.12171063 and No.11671062); Natural Science Foundation of Chongqing (No.cstc2019jcyj-msxmX0345, No.CSTB2023NSCQ-MSX0148, and No.cstc2021jcyj-msxmX0280); The Project for Creative Research Groups at Institutions of Higher Education in Chongqing (No.CXQT20014). Scientific and technological research program of Chongqing Municipal Education Commission (KJQN202300535, KJQN202000534, KJZD-K202100503, KJZD-K202300506 and KJQN202100521).