
Abstract
Adapting the original latitude of acceptance concept to Likert-type surveys, response latitudes are defined as the range of graded response options a person is willing to endorse. Response latitudes were expected to relate to attitude involvement such that high involvement was linked to narrow latitudes (the result of selective, careful responding) and low involvement was linked to wide latitudes (the result of disinterested, careless responding). In an innovative application of item response theory, parameters from Samejima’s graded response model were used to examine response latitude width. Other item response theory–based tools (e.g., test characteristic curves, information functions) were used to examine the influence of response latitudes on the psychometric functioning of several attitude surveys. A mix of experimental and nonexperimental methods was employed to create groups of high and low involvement surveys. Comparisons of these surveys showed that high involvement was related to significantly narrower response latitudes than low involvement. Furthermore, wide response latitudes were related to unfavorable psychometric properties such as reduced survey discrimination and reduced internal validity relative to narrow latitudes. Comparisons of information functions in high and low involvement conditions, however, were less consistent. Implications of wide response latitudes are quite unfavorable for researchers and suggest that an element of error is present when respondents feel little involvement with an attitude topic.
Likert-type surveys are widely used to assess self-report attitudes and opinions in disciplines such as psychology, sociology, and political science. Several decades ago, social judgment theorists (C. W. Sherif, Sherif, & Nebergall, 1965; M. Sherif & Hovland, 1961) suggested that a concept known as a latitude played an integral role in survey responding. Originally applied to Thurstone-type surveys, this concept suggests that people have varying ranges (i.e., latitudes) of survey items that they may find acceptable, with strongly opinionated people tending to have narrow, stringent latitudes. The contribution of the present study is threefold. First, the latitude concept is modified for the popular Likert-type survey format, and termed a response latitude. Second, we provide a means of measuring response latitudes using item response theory (IRT) so as to provide more precise estimates of latitude width relative to the original technique. Third, we show how IRT-based metrics such as discrimination and information can be used to carefully examine the effects of response latitudes on a survey’s psychometric properties. These IRT-based metrics are more informative than classical test theory–based metrics such as item–total correlations and coefficient alpha.
This research is important because the implications of wide response latitudes are quite unfavorable for researchers; increased response error is apt to be present when respondents feel little involvement with the attitude being assessed. Thus, wide response latitudes—typically used by people who lack involvement with a survey topic—are likely to be associated with degraded psychometric properties. A procedure like the one presented here is needed so that researchers may investigate response latitude widths in Likert-type surveys. Through a mixture of experimental and nonexperimental strategies, we were able to compare the response latitudes of several high versus low involvement attitudes and found that wide response latitudes were indeed associated with degraded psychometric properties. Through this research, we can ultimately better understand the behavior of respondents and use that knowledge to improve attitude measurement.
Latitudes in Thurstone-Type Attitude Surveys
Social judgment theorists such as M. Sherif and Hovland (1961) have theorized that people have differing ranges of attitudes with which they agree. Imagine that all attitudes toward a given topic are placed onto a continuum with increasingly positive attitude statements placed toward one pole and increasingly negative attitude statements placed toward the other pole in a fashion conceptually similar to Thurstone-type surveys. Rather than thinking about people’s attitudes as though they represent a specific point on this continuum, these researchers thought people’s attitudes were better conceptualized as a range of acceptable attitude statements on this continuum. For instance, someone may endorse items ranging from neutral to moderately supportive on a measure of attitudes toward alcohol prohibition (Hovland, Harvey, & Sherif, 1957).
Attitude statements that are acceptable to a person fall into that person’s latitude of acceptance. A wide latitude of acceptance, then, is one that encompasses a large area along this theoretical continuum; this person is accepting of a wide range of viewpoints about the topic. On the other hand, the person with a narrow latitude of acceptance is quite particular about the viewpoints that she or he accepts, accepting only those that are very close to her or his own attitude. For clarity, we note that M. Sherif and Hovland (1961) discuss other “latitude” concepts (e.g., latitude of rejection, latitude of indifference). We limit our discussion to the latitude of acceptance, and we use the term latitude in this paper to refer specifically to a latitude of acceptance.
Classic studies conducted by social judgment theorists (e.g., Hovland et al., 1957; La Fave & Sherif, 1962; M. Sherif, 1960) operationalized latitude width as the mean number of attitude statements that the individual deemed acceptable. For example, Hovland et al. (1957) provided participants with a number of attitude statements from the aforementioned prohibition survey to classify as objectionable or acceptable. People who accepted a large number of statements were said to have wide latitudes of acceptance; those who accepted few statements were said to have narrow latitudes of acceptance. Studies like these empirically demonstrated the usefulness of the latitude construct by showing that various groups of respondents used different latitudes when responding to attitude surveys. As described in detail later, these groups typically differed in their level of personal involvement with the attitude topic.
Response Latitudes: Applying the Latitude Concept to Likert-Type Response Options
The original operationalization of latitudes—as number of items endorsed—has at least two important limitations. First, this operationalization relies on dichotomous (i.e., bipolar objectionable or acceptable) responses to each attitude item. Although respondents were sometimes provided with graded response options, responses were nevertheless dichotomized (e.g., object-accept) for latitude width calculations. We believe a better approach to latitude width measurement would use data from graded response options (e.g., strongly disagree to strongly agree). This would not only provide respondents the opportunity to accurately report gradations of their attitudes, but it would also provide researchers with a more accurate representation of participants’ thoughts and opinions.
A second limitation of the original operationalization is that it relies on a survey design technique that is fundamentally different from the popular Likert-type surveys with which most researchers are familiar and comfortable. Social judgment studies like those mentioned above used survey methodology in line with Thurstone’s (1928), rather than Likert’s (Likert, Roslow, & Murphy, 1934), approach to measurement. Although both approaches to attitude measurement are acceptable, the Likert approach is certainly more popular (DeVellis, 2011). This is likely due to the relative ease of developing and scoring Likert-type scales. In sum, the latitude concept as originally operationalized in social judgment studies is limited because it is imprecise and not amenable to popular Likert-type surveys.
We propose that the latitude concept can be applied to the graded response options (e.g., strongly disagree to strongly agree) found in Likert-type surveys. Instead of examining the number of items that a respondent finds acceptable (as in the Thurstonian approach), for Likert-type surveys we examine the number of response options that a respondent finds acceptable. We refer to this range of acceptable response options as a response latitude. Figure 1 shows the response latitudes for two hypothetical respondents who, despite having the same location on the attitude continuum, have different response latitudes. The horizontal arrows represent a continuum of possible responses that a respondent has available to her when responding to an attitude item; this example shows the typical 5-point Likert-type response scale. The figure also shows the single response option that best represents the respondent’s attitude. Because her or his response latitude is wide and encompasses three response options, Respondent A might select neither agree nor disagree, somewhat agree, or strongly agree to this hypothetical item. This is true even though somewhat agree appears to be the most accurate representation of how she or he feels. Respondent B, on the other hand, has a narrow response latitude and is only willing to select the somewhat agree option, which is indeed the most accurate representation of how he feels. Although others (e.g., Krosnick, 1999; Madden & Klopfer, 1978) have speculated on applying the latitude concept to graded response options, ours is the first empirical investigation that we could identify.

Graphical representation of different response latitude widths.
Response Latitudes and Attitude Involvement
Several social judgment studies have indicated that latitudes are linked to attitude involvement (e.g., Hovland et al., 1957; La Fave & Sherif, 1962). Those who feel personally involved with a given topic tend to have relatively little tolerance for other points of view and therefore have narrow latitudes of acceptance. For instance, Hovland et al. (1957) found that, compared with a sample of less involved participants (i.e., university students), a sample of involved participants (i.e., highly conservative and highly liberal people) rated more prohibition attitude items as objectionable. Findings from studies of this sort led M. Sherif and Hovland (1961, p. 130) to conclude that “the person who zealously upholds a position tends to be quite particular about accepting other positions and is likely to see the rest of the world as opposed to his stand.” Finally, Madden and Klopfer (1978) found that participants used an undecided (?) response option more frequently when responding to a high involvement survey (capital punishment) than a low involvement survey (observation of Sunday as a religious day). They suggested that respondents had narrower response latitudes for the important topic. That is, when respondents cared about the topic, they often preferred to use the undecided option because relatively few options fell into their stringent, narrow latitude.
Measuring Response Latitudes Using IRT
An IRT framework is well suited for measuring response latitudes because it facilitates the analysis of survey responses at a fine level of detail. Because we are concerned with the assessment of Likert-type responses, we opted to use Samejima’s (1969) graded response model (GRM). Space constraints prohibit a more detailed, technical explanation of IRT and the GRM; the interested reader is referred to Embretson and Reise (2000) or Samejima (1997), respectively, for more information about IRT and the GRM. The GRM uses option response boundary parameters, represented by the letter b. IRT parameters such as the GRM b parameter are estimated at the sample level; parameter estimates represent the general response style of a sample.
In the first step of estimating GRM parameters, a series of “operating response functions” are estimated to describe the relation between each response option and the latent attitude; these functions follow the same shape as response functions in the dichotomous two-parameter logistic (2PL) IRT model. From these curves, a series of option response functions—shown in Figure 2—are estimated to describe the likelihood that a person at a given level of the latent attitude selects a given response option. Embretson and Reise (2000) call these “category response functions.” The x-axis in this figure represents the latent attitude continuum (attitudes toward drinking, in this case), which is represented by values ranging from −3 (very unfavorable drinking attitudes) to +3 (very favorable drinking attitudes). The y-axis represents the probability that people at various locations along the attitude continuum will select a given response option. Each response option is represented by a curved function running along the attitude continuum; higher points along these functions indicate higher probabilities of respondents selecting that particular response option. People with drinking attitude scores between −1.2 and −0.5, for example, are most likely to select the somewhat disagree option in response to the example item. As the figure shows, there are four b parameters associated with a 5-point response scale. The lowest (b1) and highest (b4) b parameters represent the location at which there is a .50 probability of respondents selecting the lowest (strongly disagree) and highest (strongly agree) response options. The middle b parameters (b2 and b3) represent the locations at which the middle response option functions intersect, respectively. The estimated b2 parameter for the example item in Figure 2, for instance, is −0.5, where the somewhat disagree and neither agree nor disagree functions intersect.

Graphical representation of distances between GRM b parameters.
The primary focus of this study is the distance between bs; these distance calculations are shown graphically as the bracketed regions of the attitude continuum at the bottom of Figure 2. To the extent that respondents are selective and discerning in their choice of response option, the distance between bs will be low. Peaked, narrow response option functions accompanied by small b-to-b distances indicate that people at one location on the attitude continuum are selecting a particular option whereas people at nearby locations are not selecting it. These distance measures, then, are indicative of the response latitudes with which the response options were selected.
Using the IRT framework outlined above, and based on the tenets of social judgment theory along with preliminary work by Madden and Klopfer (1978), we expect that response latitude widths will relate to participants’ self-reported involvement with attitude topics.
Hypothesis 1: High involvement attitudes will relate to significantly narrower response latitudes than low involvement attitudes, operationalized as distances between GRM b parameters.
Measurement Implications of Response Latitudes
The latitude concept continues to receive attention in the persuasion and attitude change literature (e.g., Crano & Prislin, 2008) but has received very little attention with regard to its applicability to attitude measurement. This is concerning because the implications of wide response latitudes are quite unfavorable for researchers; response latitudes suggest that an element of response error is apt to be present in response data when respondents feel little involvement with the attitude being assessed.
Krosnick’s (1999) theory of survey satisficing, which suggests that respondents with weak attitudes are likely to satisfice when responding to attitude items, provides a link between attitude involvement and response latitudes. Specifically, respondents tend to take a “good enough” approach to responding, often by selecting the first response option that appears minimally acceptable (Krosnick, Judd, & Wittenbrink, 2005). This occurs because it is cognitively difficult for people with weak opinions to respond accurately to attitude survey items. Satisficing is used as a means of conserving mental energy, which results in relatively careless, disinterested responding. In contrast to satisficing, optimizing is the process of carefully and accurately responding to attitude items such that the very best response option is selected. Evidence has supported the supposition that satisficing tends to be used by people with weak attitudes. For instance, weak attitudes can be more susceptible than strong attitudes to survey context effects—measurement error introduced by a survey instrument (Lavine, Huff, Wagner, & Sweeney, 1998; Tourangeau & Rasinski, 1988). Based on Krosnick’s (1999) theory of survey satisficing, we would expect people with low involvement to satisfice when completing a survey, resulting in relatively poor psychometric properties.
Operating within the IRT framework, several metrics are useful for examining the psychometric properties of Likert-type attitude surveys. One such metric is the test characteristic curve. This characteristic curve represents the ability of an attitude survey to discriminate high valence respondents from low valence respondents along the attitude continuum. High involvement attitudes are expected to produce narrow response latitudes and careful, selective responding. This should translate to attitude surveys that have greater discrimination power than their low involvement counterparts.
Hypothesis 2: Response latitude width will relate to discrimination in test characteristic curves such that narrow-latitude surveys are associated with greater discrimination than wide-latitude surveys.
Krosnick’s (1999) theory of survey satisficing suggests that the same response processes (careless, disinterested responding) that are associated with wide response latitudes will lead to increased measurement error. As satisficers select the first minimally acceptable response that they see from within their response latitude (rather than the very best response option), they effectively introduce an element of measurement imprecision that is likely to reduce reliability of the survey. In IRT, test information, where the term information refers to the psychometric information that the survey provides about people at various locations along the attitude continuum, is a measure of the precision and reliability of the survey. Test information functions are inversely related to measurement error; when a lot of error is present, test information tends to be low.
Hypothesis 3: Response latitude width will relate to test information such that narrow-latitude surveys are associated with more information than wide-latitude surveys.
Finally, we expect that the internal validity of attitude measurement will relate to response latitude width. An attitude survey is valid to the extent that it measures an attitude that truly exists within respondents (Borsboom, Mellenbergh, & van Heerden, 2004). The satisficing apt to be associated with wide response latitudes, however, points to respondents lacking a distinct, discernible attitude—a condition called indifference (Cacioppo & Berntson, 1994). Respondents in this study will be provided several multi-item attitude surveys as well as single-item measures asking for their overall opinion toward each attitude topic. Using the IRT framework, the multi-item surveys can be scored such that each respondent’s location on the latent attitude continuum (theta) is estimated. To the extent that these IRT-based theta scores align with the single-item measures, a survey can be considered internally valid because respondents are cognizant of, and able to identify, their own attitude (i.e., the attitude appears to actually exist). We propose that respondents associated with wide response latitudes will be less able (than those associated with narrow latitudes) to accurately identify their attitude with a single-item measure such that it accurately corresponds to their calculated attitude score.
Hypothesis 4: IRT-based attitude scores associated with narrow response latitudes will be more strongly related to a single-item measure of attitude than will IRT-based scores associated with wide response latitudes.
Method
The goal of this study is to (a) measure response latitudes using an IRT framework and to (b) compare the psychometric properties of wide-latitude and narrow-latitude surveys. This necessitated that high and low involvement groups of participants be differentiated and then compared. We used three different methods of creating high and low involvement groups, with the expectation of finding consistent results across all three methods of grouping. We made an intra-individual comparison of naturally occurring high versus low involvement attitude topics, an inter-individual comparison of naturally occurring groups of high versus low involvement toward a particular attitude topic, and used a randomized experiment to manipulate high versus low involvement. Each of these comparisons has its own methodological strengths and limitations. Taken together, though, the results to the extent they are consistent across methods will provide more confidence than the use of any single method alone.
A short pilot study was administered to a small sample of university students to preliminarily assess people’s self-reported attitudes toward, and feelings of involvement with, several different attitude topics. Example attitude topics included animal rights, physician-assisted suicide, and divorce. Based on the preliminary information gathered in this pilot study, we selected surveys for each of the three following grouping methods.
Grouping Method 1: Comparing a High Involvement Attitude to a Low Involvement Attitude
There are natural intra-individual differences in attitude involvement; the same people feel more involved with some attitude topics than with other attitude topics. A series of studies by Boninger, Krosnick, and Berent (1995) demonstrated that people’s involvement (interest and identification) varied quite a bit for different attitude topics like racial integration and abortion. Our pilot study showed similar intra-individual variation in involvement toward various attitude topics. Using people’s natural inclinations to feel involved or uninvolved with particular topics, we sought to compare an attitude of high involvement with one of low involvement while holding sample constant. Madden and Klopfer (1978) used this grouping method to uncover differing response latitudes between high and low involvement attitude surveys.
For this method, we sought one survey with high mean involvement and another survey with low mean involvement, with the two having relatively similar mean attitudes. Based on the pilot study, a survey of attitudes about drinking (Lynne Cooper, Russell, Skinner, & Windle, 1992) was selected as the high involvement survey. The survey assesses the degree to which people are accepting of (agree or disagree with) various motives for drinking. Sample items include “How do you feel about drinking as a way to celebrate?” and “How do you feel about drinking as a way to relax?” A survey of attitudes about employment testing (Lounsbury, Bobrow, & Jensen, 1989) was selected as the low involvement survey. This survey assesses the degree to which people are in favor of using employment tests. Sample items include “I think employment testing is an invasion of privacy” and “Testing is the best way to find the best person for a job.”
Grouping Method 2: Median Splitting Based on Involvement
There are also natural interindividual differences in attitude involvement; different people vary in how involved they feel toward the same attitude topic. Using people’s natural inclinations to feel involved or uninvolved with a single attitude topic, we compared people who felt most involved with a topic to those who felt least involved with that same topic. We sought a survey with high variability in involvement, with the aim of performing a median split on this variable to create high and low involvement groups. This grouping method was used by Lavine et al. (1988) to create high and low attitude strength groups. This method is conceptually quite similar to many social judgment studies (e.g., C. W. Sherif et al., 1965) that compared naturally occurring groups of high and low involvement respondents with respect to the same attitude topic.
Based on the pilot study, a survey measuring attitudes toward sex (Cooper, Shapiro, & Powers, 1998) was selected for this purpose. This survey assesses the degree to which people are accepting of (agree or disagree with) various motives for having sex. Sample items include “How do you feel about having sex to prove to yourself that your partner thinks you’re attractive?” and “How do you feel about having sex because it helps you to feel better when you’re lonely?”
Grouping Method 3: Experimentally Manipulated Groups
To examine interindividual differences in an experimental manner, we set out to manipulate the degree of involvement participants felt about a particular attitude. Several experimental studies have successfully manipulated attitude involvement by varying the degree of personal relevance participants feel with respect to a particular topic (e.g., Boninger et al., 1995; Petty & Cacioppo, 1984; Petty, Cacioppo, & Goldman, 1981). Boninger et al. (1995) speculated that involvement manipulations work by forcing participants in high involvement conditions to think about an attitude topic in very personal manner. For example, Petty and Cacioppo (1984) manipulated participants’ involvement with attitudes toward a tuition increase by having participants first read a vignette describing a tuition increase occurring at their own university (the high involvement condition) or a university in another part of the country (the low involvement condition). Similarly, we sought to manipulate attitude involvement by forcing respondents to consider a personally relevant or personally irrelevant vignette before completing a survey.
For this grouping method, we sought a survey with relatively low involvement, and based on the pilot study selected a survey assessing attitudes toward prisoners (Melvin, Grambling, & Gardner, 1985). The survey assesses the degree to which people believe prisoners are basically good or decent. Sample items include “prisoners only think about themselves” and “most prisoners can be rehabilitated.”
Respondents were randomly assigned to see one of two versions of a short vignette before completing the survey:
Prisoners are people who have been convicted and incarcerated or imprisoned for their crimes. The state of [Ohio or Idaho] is considering implementing a daytime prisoner work release program. Prisoners would be released during regular working hours (8 a.m.–5 p.m.) on weekdays. Prisoners would work at common [Ohio or Idaho] businesses and large retail stores. Prisoners would typically work in jobs like cashiers, baggers, greeters, and customer service representatives.
In the high involvement condition, the vignette describes a prison work release program taking place in respondents’ home state (Ohio), intended to make the issue more relevant and make respondents think about the possibility of having to personally interact with prisoners. In the low involvement (Idaho) condition, it should have been relatively easy for respondents to view the scenario as irrelevant and maintain a mental distance with regard to prisoners.
Data Collection
The drinking, employment testing, sex, and prisoners surveys were administered to a convenience sample of N = 971 students from a Midwestern United States university, in exchange for course credit. Fifty-eight percent of respondents were female, 83% were Caucasian, and the mean age was 19 years (SD = 1.7).
Responses to items from each attitude survey were collected using 1 (strongly disagree) to 5 (strongly agree) Likert-type response options. Each attitude survey was followed by two measures of attitude involvement. The first measure was a 4-item measure of personal involvement (Zuwerink & Devine, 1996); an example item reads “My attitude toward [topic] is very important to me.” The second measure is a 2-item measure of thought depth (Barta & Ray, 1986); an example item reads “When completing the [topic] survey, I had many thoughts about [topic].” Each attitude survey was also followed by a single-item measure of attitude valence, that is, “Overall, how do you feel about [topic]?” Responses to this final item were gathered using a 7-point scale (extremely oppose to extremely favor) to allow respondents to express relatively fine gradations in overall attitude.
Results
We first subjected all attitude surveys to basic psychometric analyses (e.g., item–total correlations; alphas) to examine the properties of each. This resulted in dropping a few items from the employment testing, sex, and prisoners surveys. Table 1 shows the final number of items retained for each survey, along with basic descriptive statistics for each survey. After removing problem items, all surveys exhibited adequate internal consistency; coefficient alpha and mean item–total correlation estimates are presented in Table 1.
Descriptive Statistics for Each Attitude Survey.
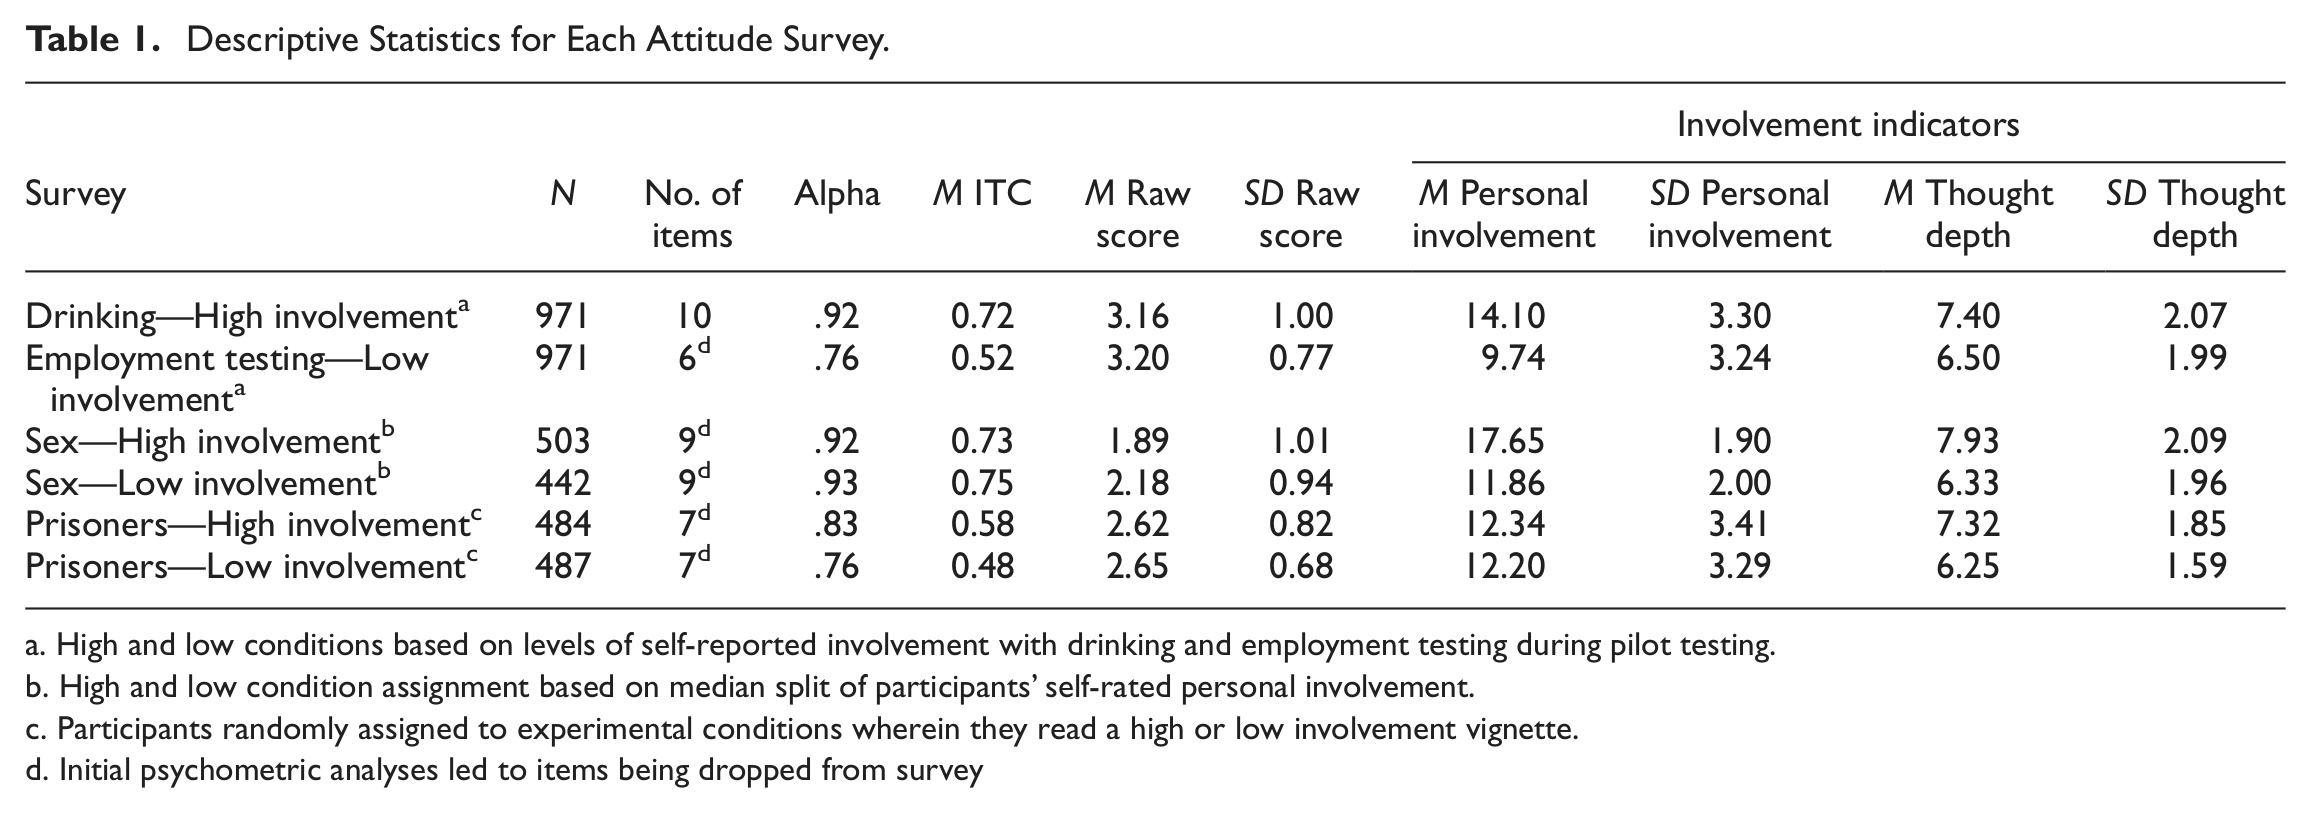
High and low conditions based on levels of self-reported involvement with drinking and employment testing during pilot testing.
High and low condition assignment based on median split of participants’ self-rated personal involvement.
Participants randomly assigned to experimental conditions wherein they read a high or low involvement vignette.
Initial psychometric analyses led to items being dropped from survey
The measure of personal involvement was used for purposes of median splitting responses to the sex survey into high and low involvement groups, as per Grouping Method 2, above. Possible scores on the personal involvement measure ranged from 4 to 20, and the observed median of 15 was used to differentiate high from low involvement. Because of missing data, accurate personal involvement values could not be calculated for 26 responses, which were excluded from further sex survey analyses.
Attitude survey means and standard deviations are shown in Table 1 along with the mean scores and standard deviations of the attitude involvement indicators. For each high and low involvement condition, the attitude survey mean scores were fairly similar, whereas the means of their respective attitude involvement indicators appear to differ. One exception is the relatively similar personal involvement scores seen on the prisoners surveys; however, the expected difference in attitude involvement does appear when attitude involvement is measured with the thought depth scale. In short, these descriptive statistics support our assumption that involvement—rather than valence—is the key differentiator of what we have labeled the “high” and “low” conditions.
We used MULTILOG 7.0 to estimate IRT parameters for the GRM. Note that parameters were separately estimated for each high and low involvement condition of the prisoners and sex surveys. Before proceeding with substantive analyses, we tested the model–data fit of each survey to the GRM using MODFIT (Stark, 2001). We examined the fit of each survey item individually, and also considered items in doublets and triplets. The chi-square error values associated with model–data fit analyses were generally within acceptable bounds, according to guidelines provided by Drasgow, Levine, Tsien, Williams, and Mead (1995). The individual item mean chi-square error value for the high involvement sex survey was slightly greater (mean χ2 = 3.15) than the value suggested by Drasgow et al. (χ2 < 3.0); all other values fell below this threshold. The chi-square values associated with item doublet and triplet analyses of the sex, drinking, and employment testing surveys also exceeded 3.0, indicating the presence of some nonindependence of items. Given the generally acceptable levels of individual item fit, however, this was not especially concerning. In short, item–data fit seemed to be adequate.
Hypothesis 1: Relation Between Involvement and Latitude Width
High involvement surveys were expected to have relatively narrow response latitudes, and low involvement surveys were expected to have relatively wide response latitudes. The distance between each GRM b parameter was calculated for all items, and then aggregated to the survey level. Table 2 shows the mean b-to-b distance for each of the high and low involvement surveys. As shown, mean distances were uniformly smaller in the high involvement conditions than in the low involvement conditions. To determine whether or not distances substantially differed between high and low involvement conditions, three independent-sample t tests were conducted. Results, presented in Table 2, indicated that the mean distances were significantly different in all high versus low comparisons. Response latitudes were narrower for the high involvement surveys than low involvement surveys.
Response Option Threshold Distance and Discrimination Parameters for High and Low Involvement Surveys.

Note. b = response option boundary parameters, estimated with the graded response model.
p < .05.
Figure 3 visually shows this finding with option response functions from two example high and low involvement survey items. The option response functions appear more tightly condensed in the high involvement condition, indicative of narrow response latitudes. Figure 4 provides a direct visual comparison of the same option response functions estimated from high and low involvement sex and prisoners conditions. The trend seen in these particular response functions is the same as that seen in most comparisons; high involvement option response functions were more peaked and narrow, indicating that high involvement respondents used relatively narrow response latitudes and were hence more discriminating between response options than their low involvement counterparts. Hypothesis 1 was supported; response latitudes were narrower in high involvement surveys than low involvement surveys.
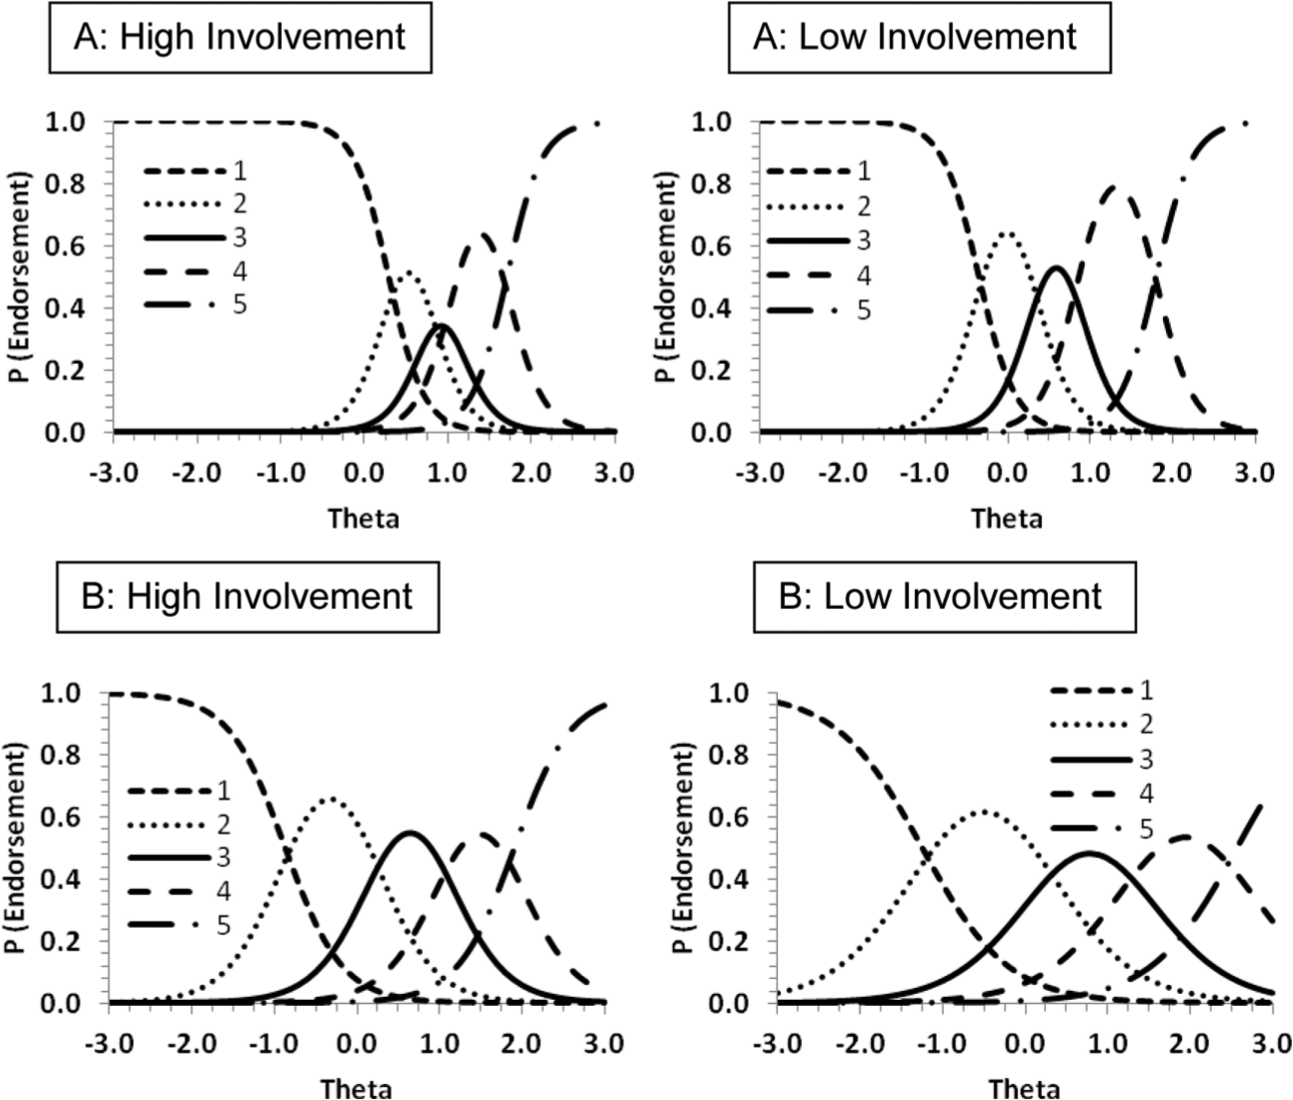
(A) Response option functions for the sex survey item “How do you feel about having sex because it helps you feel better when you’re lonely?” in high (mean b-to-b distance = .47) and low (mean b-to-b distance = .72) involvement conditions. (B) Response option functions for the prisoners survey item “In general, prisoners are basically bad people” in high (mean b-to-b distance = .92) and low (mean b-to-b distance = 1.30) involvement conditions.

(A) High and low involvement option response functions from an example sex survey item, “How do you feel about having sex to cheer yourself up?” (B) An example prisoners survey item, “In general, prisoners are basically bad people.”
Hypothesis 2: Relation Between Latitude Width and Discrimination
Narrow-latitude surveys were expected to have a greater ability to discriminate high from low valence respondents, relative to wide-latitude surveys. Some preliminary evidence to support this hypothesis is seen in the greater GRM a discrimination parameters in Table 2 and the more peaked option response functions shown in Figures 3 and 4. To more directly test this hypothesis, test characteristic curves were created for all surveys, and high versus low test characteristic curve comparisons are shown in Figure 5. These curves represent the proportional probability that people at various locations along the attitude continuum are likely to select the most positive response option (strongly agree). The values along the y-axis represent the graded response options for the survey, such that 1 = strongly disagree and 5 = strongly agree. Hence, as the curve reaches higher points of the y-axis, there is more agreement with the survey items. Discrimination in these curves is represented by the slope of the curve. A completely horizontal line, for instance, would indicate a complete lack of discrimination; such a survey has no ability to discriminate high from low attitude respondents. The steeper the slope of the curve, the greater the discrimination. The curves uniformly show somewhat steeper curves in the high involvement than low involvement conditions. Hypothesis 2 was supported; high involvement surveys were more discriminating than low involvement surveys. Narrow-latitude surveys were associated with higher, more desirable levels of discrimination than wide-latitude surveys.

Test characteristic curves for high and low involvement surveys: (A) Drinking (high involvement) and employment testing (low involvement) surveys; (B) High and low involvement sex surveys; (C) High and low involvement prisoners surveys.
Hypothesis 3: Relation Between Latitude Width and Information
Test information functions were created for each high and low involvement survey, and are shown in Figure 6. Information functions are inversely related to the standard error of measurement; greater test information indicates reduced measurement error and improved psychometric precision. It should be noted for Part A of Figure 6 that there were fewer items in the low involvement condition than high involvement condition. This difference in number of items influences test information independent of the psychometric properties of each survey. The functions shown in Parts B and C, however, are more robust comparisons because these information functions were derived from the exact same survey items in high versus low conditions. For two of the three comparisons, test information was greater for the high involvement survey than the low involvement survey. The exception to this was the information for the high and low involvement sex surveys, which appeared to have roughly equivalent levels of information that covered an overlapping but diverging area of the attitude continuum. Hypothesis 3 was partially supported; there appears to sometimes be more information derived from narrow-latitude surveys than wide-latitude surveys.
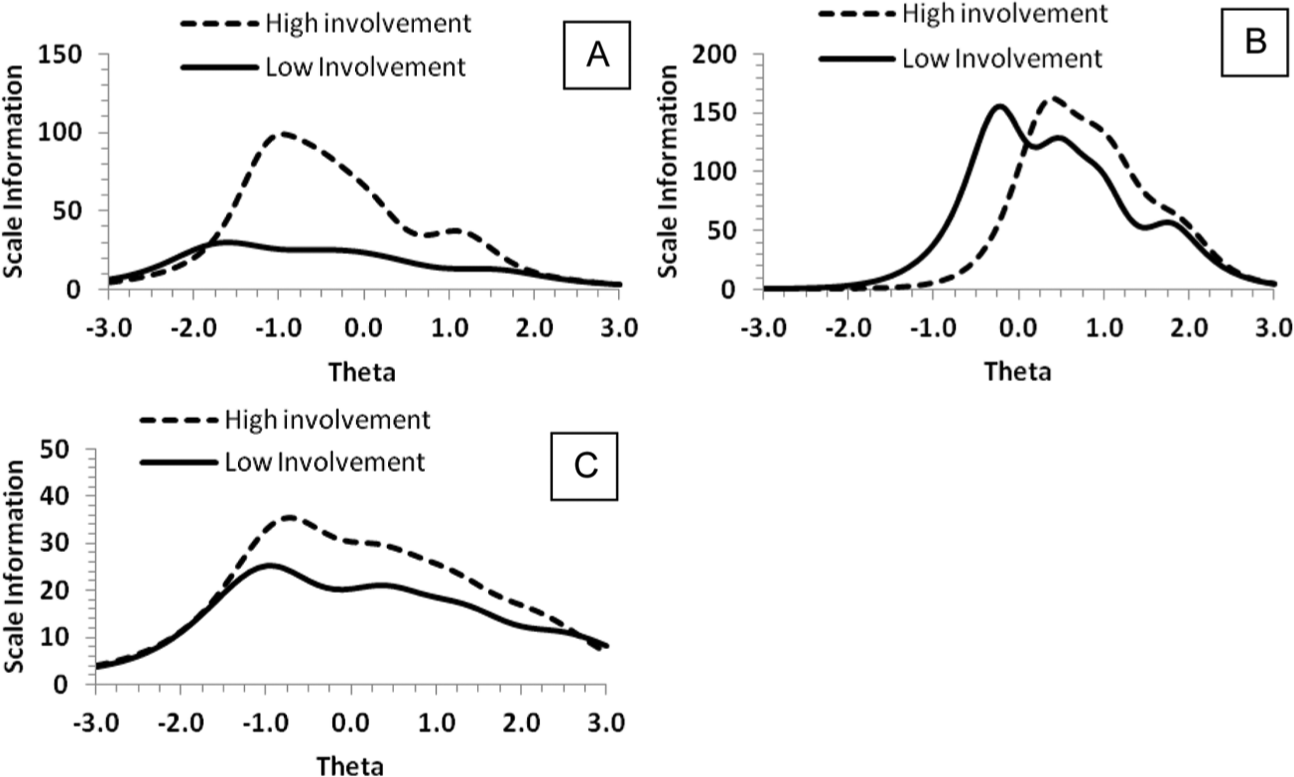
Test information functions for high and low involvement surveys: (A) Drinking (high involvement) and employment testing (low involvement) surveys; (B) High and low involvement sex surveys; (C) High and low involvement prisoners surveys.
Hypothesis 4: Relation Between Latitude Width and Internal Validity
The final hypothesis concerns the internal validity of wide-latitude and narrow-latitude surveys. To test our proposition that narrow-latitude surveys would be more accurate than wide-latitude surveys, we first calculated all respondents’ attitude scores in the form of IRT-derived theta scores. We correlated these values with respondents’ single-item self-reported attitudes in high and low involvement conditions; results are presented in Table 3. Correlations were uniformly stronger in the high involvement than low involvement conditions. Next, we performed the Fisher r-to-z transformation on all correlation coefficients, resulting in zr values. Following guidelines provided by Chen and Popovich (2002), each high involvement zr was then compared with its low involvement counterpart, resulting in three z test scores. All three zs were significant at the .05 level, indicating that each correlation was significantly different from its counterpart. Hypothesis 4 was supported; the relations between narrow-latitude survey scores and single-item measures were greater than that between wide-latitude survey scores and single-item measures.
Correlations Between IRT Model–Derived Theta Scores and Self-Reported Attitude Valence for High and Low Involvement Surveys.

Note. Zr = Fisher r-to-z transformed correlation coefficients.
p < .05.
CTT- and IRT-Based Metrics
In addition to IRT-based metrics, two CTT-based metrics were calculated to see if they would be sensitive to changes in response latitudes, namely coefficient alpha and mean item–total correlations (Table 1). In two of the three comparisons, these values indicated greater internal consistency in high involvement than low involvement conditions. Interestingly, though, these values did not point to any loss of internal consistency in the low involvement sex surveys even though option response functions (Figures 3 and 4) and test characteristic curves (Figure 5) indicated a loss of measurement precision. Perhaps these CTT metrics track more closely with test information, which provided somewhat inconclusive results (Figure 6). Although CTT metrics are potentially useful for examining differences between latitude conditions, we believe that the use of an IRT framework allows for a much more precise examination of psychometric functioning through discrimination and information functions.
Discussion
The latitude of acceptance concept from social judgment theory (C. W. Sherif et al., 1965; M. Sherif & Hovland, 1961) was adapted to Likert-type response options. We successfully used an IRT framework to measure response latitude widths and the psychometric properties of wide-latitude and narrow-latitude attitude surveys. As expected, attitude involvement seemed to be a key driver of latitude width. People who felt involved with a particular attitude topic were more selective, and seemingly more careful, when selecting responses to survey items. As expected, wide-latitude surveys showed poorer psychometric functioning than narrow-latitude surveys. Wide-latitude surveys showed reduced discrimination and reduced internal validity relative to narrow-latitude surveys. Two of the three comparisons showed greater information in wide-latitude conditions. Unexpectedly, there was little difference in information between the high and low involvement sex scale comparison. In general, wide-latitude surveys provided less psychometric information than narrow-latitude surveys, but the inconsistency seen here should be resolved in future research. Overall, these findings indicate that, although CTT-based metrics like coefficient alpha and mean item–total correlation values may be useful in detecting degraded psychometric functioning, IRT-based metrics like discrimination and information were more informative in understanding psychometric differences.
Psychological Processes Guiding Survey Responding
Findings from the present study indicate that highly involved people tend to use narrow response latitudes and are thus more discerning when responding to surveys than those who are less involved. This helps explain the manner in which attitude involvement is expressed in terms of survey response behavior. Specifically, these results provide empirical support for Krosnick’s (1999) assertion that survey respondents with weak attitudes may be selecting the first response option they see that falls into their response latitude. In Krosnick’s terminology, respondents with weak attitudes satisfice and provide less-than-optimal survey responses. Given the cognitive difficulty associated with weak-attitude people discerning the optimal survey responses that reflect their true opinion, wide response latitudes suggest that a fair amount of imprecise or careless responding may occur in attitude survey research, and the present findings support this assertion.
Practical Implications for Researchers
The findings of this study have implications for those who conduct attitude survey research. Although we used an IRT framework to investigate response latitudes, the added complexity of using IRT (vs. more simplistic CTT metrics) sometimes cannot be justified in practice. A frequent barrier to the use of IRT in practice is sample size. A simulation study by Reise and Yu (1990) indicated that close to 500 respondents are needed to obtain accurate GRM item parameters. When practical constraints prohibit the use of IRT, researchers may wish to use a measure of personal involvement (e.g., Barta & Ray, 1986; Zuwerink & Devine, 1996) as a proxy for the IRT-based latitude analyses conducted here. These involvement measures could serve as a simple detection system, such that low attitude involvement might alert the survey administrator that survey responses are susceptible to wide response latitudes.
Alternately, it is quite possible that researchers could enact a simple “survey intervention” in an attempt to induce feelings of involvement with an attitude topic. For instance, researchers might consider having participants read a short paragraph before completing a survey, describing the importance of accurately sharing their attitude. Or, as in the experimental vignette preceding the prisoners survey in the present study, researchers might consider providing participants with some background information about the topic to make them think a bit more deeply about the topic.
Limitations and Future Directions
A few potential limitations of the present study should be noted. First, all of the comparisons made here were between dichotomous high and low involvement groups. It is still unclear exactly how much attitude involvement might be required to maintain sufficiently narrow response latitudes. Future work might examine the psychometric effect of eliminating only the most severely uninvolved respondents, say, the bottom 10% or 20% of the involvement distribution.
A second potential limitation was that the analyses conducted here primarily focused on IRT parameters, discrimination values, and information aggregated across survey items. As pointed out by a reviewer, researchers interested solely in survey-level analyses may wish to consider alternative IRT models such as Muraki’s modified GRM, which simultaneously estimates latitudes for all survey items. Those interested in analyzing latitudes separately for individual items may wish to use Samejima’s GRM like we have demonstrated here. Detailed item-to-item comparisons of response latitudes may yield interesting results. It is possible that certain types of items are more susceptible to the ill effects of wide response latitudes. For example, response patterns for negatively worded items seem to sometimes differ from those of positively worded items (e.g., DiStefano & Motl, 2006). Because negatively worded items require greater cognitive power, satisficing in combination with wide response latitudes may be particularly problematic for negatively worded items.
A third potential limitation of this study is our reliance on meta-attitudinal measures of attitude involvement, which require a person to be cognizant of, and able to report, their own attitude characteristics (see Bassili, 1996). Instead of relying on meta-attitudinal measures, future research may examine the possibility of using latent class analysis to statistically detect the presence of groups that might be high versus low involvement. A new approach presented by Roberts, Rost, and Macready (2010) seems promising in this regard.
Footnotes
Declaration of Conflicting Interests
The author(s) declared no potential conflicts of interest with respect to the research, authorship, and/or publication of this article.
Funding
The author(s) received no financial support for the research, authorship, and/or publication of this article.