




Abstract
To what extent do supporters of electoral losers and nonvoters maintain lower evaluations of institutions post-election? A sizable literature identifies a divergence in perceptions among winners and losers regarding democratic satisfaction, with few studies extending this to perceptions of other electoral and nonelectoral institutions nor to include nonvoters. The timing of the 2015 Asian Barometer survey in South Korea allows us to identify evaluation prior to Park Geun-Hye’s impeachment scandal. Analysis consistently finds that those who supported the losing presidential candidate in 2012 maintained lower evaluations of institutions, with inconsistent results regarding nonvoters.
Introduction
To what extent do supporters of electoral losers and nonvoters maintain lower evaluations of institutions in general post-election? Democracies rely on tacit public support, especially from those who have lost elections (e.g. Nadeau and Blais, 1993: 553). Perceptual differences between winners and losers move beyond variation in satisfaction with the immediate results and the potential policies that may follow but may permeate evaluations of electoral and nonelectoral institutions. Such deviation can threaten the bedrock of democracy. However, most studies on losers’ consent rarely look beyond satisfaction with democracy or perceptions of electoral fairness to assess perceptions of institutions. Meanwhile, despite a growing literature on losers’ consent, previous research has typically examined past nonvoters precisely at a time in which turnout in democracies overall has declined (e.g. Blais et al., 2004; Blais and Rubenson, 2013; Franklin et al., 2004; Gray and Caul, 2000; Hooghe and Kern, 2017). If nonvoter evaluations are lower than those of electoral losers, even in nonelectoral institutions, this suggests a significant and often overlooked challenge to democratic legitimacy. Taken in tandem and often outnumbering winners, the perceptions of losers and nonvoters potentially challenge the legitimacy of democratic institutions more broadly.
A growing literature covers democratic satisfaction in South Korea (e.g. Kang, 2015; Park, 2004, 2010, 2011; Shin and Cho, 2010; Son, 2016). Despite the image of successful democratic consolidation (e.g. Diamond, 2008; Hahm, 2008), Yun and Min (2012) describe South Korea as exhibiting democratic consolidation and democratic deficits simultaneously, while Cho (2014b) argues the need for greater civic education as South Koreans are not informed adequately about what separates democratic and nondemocratic regimes. Furthermore, the consistently low evaluations of certain political institutions, namely the National Assembly (see Park (2009); Roh (2017), suggests a lack of faith in institutions that could erode further if losers view elections as somehow unfair.Yet few studies tackle losers’ consent directly in South Korea (e.g. Jou, 2009; Rich, 2015).
Whereas in other countries, one’s status as a winner or loser often overlaps with ethnolinguistic divisions (see Ruiz-Rufino, 2013), South Korea’s homogeneity removes this additional complexity. The South Korean party system also may remain in flux (e.g. Croissant, 2002; Hellman, 2011; Park, 2010; Rich, 2019), with parties frequently entering and exiting the system, yet voters seem able to identify parties on an ideological spectrum. Meanwhile, despite South Korea’s successful democratization, the country “still struggles to broaden and deepen the limited rule of electoral democracy” (Cho, 2014a: 700). As such, concerns of the fairness of the democratic system should be particularly salient.
The lower evaluations of electoral losers may be due, in part, to citizens overestimating the likelihood of their preferred party’s electoral success (e.g. Blais and Gélineau, 2007; Hollander, 2014), exacerbated by campaigning messages that heighten expectations. Such an expectations gap should be particularly evident in close elections (e.g. Howell and Justwan, 2013), where losers may not have expected to be losers. Taiwan’s 2004 presidential election, for instance, ended with the incumbent Chen Shui-bian winning with a margin of less than 0.25%, leading his opponents to reject the results and tens of thousands joining protests in Taipei. Brunell and Buchler (2009) 1 argued that a high degree of competition, especially in winner-take-all elections, generates more losers than a landslide election where the elected candidate is more likely to be representative of the dominant position of constituents. 1 Highly competitive elections also potentially generate lasting divisions in public opinion that may undermine the institutionalization of democratic norms (e.g. Whitehead, 2007).
In the 2012 South Korean presidential election, the conservative Saenuri Party’s Park Geun-Hye won with 51.6% of the vote, the only presidential candidate since democratization to win an outright majority, compared to Moon Jae-in of the center-left Democratic Party capturing 48% of the vote. 2 Despite concern about the potentially partisan influence of the National Intelligence Service to favor Park (e.g. McCurry, 2017; Sang-Hun, 2013; SCS, 2014), no organized protest of the result followed. Furthermore, high turnout (75.8%, up from 63% in 2007) would have generated more winners and losers.
To put the 2012 election into perspective, Figure 1 shows the gap in vote shares between presidential candidate winners and second-place candidates in every election since democratization. The first three elections saw three candidates receiving at least 15% of the vote. The 2007 election, while not a close race, returned to three candidates garnering at least 15% of the vote. The Grand National Party’s Lee Myung-Bak received 48.7% of the vote, nearly double that of his closest opponent, United New Democratic Party’s Chung Dong-Young (26.1%). By contrast, South Korean voters across the ideological spectrum expected a close 2012 election. Thus, it is realistic to expect that many electoral losers in 2012 were surprised to find themselves backing a losing candidate.

Winner-runner up vote gap (%).
This article first presents the literature on losers’ consent with connections made to nonvoters and to South Korea. Empirical analysis follows that finds that those who voted for Moon Jae-in were not only less satisfied with democracy and less likely to call the election free and fair, but also exhibited less trust in most institutions under study as compared to those who voted for Park. Meanwhile little consistency emerges in the views of nonvoters regarding perceptions of institutions, even after disaggregating based on the partisan preferences of nonvoters. The findings suggest the breadth of influence that losing appears to have on perceptions of democratic institutions, while questioning the extent of nonvoter dissatisfaction. The conclusion suggests additional avenues to unpack loser and nonvoter perceptions.
Views of losers and nonvoters
The perceptual differences between supporters of winning versus losing candidates may arise for multiple reasons. Supporters of losing candidates may see their perceptions of an electoral system sour in part as a psychological effort at cognitive consistency (e.g. Anderson et al., 2005). From a purely ideological or partisan approach, winners should expect policies that align with their interests while losers should not. However, this assumes meaningful ideological differences among parties and assumptions about the ideological proximity of the resulting government to electoral winners, with research finding proximity promoting satisfaction often regardless of whether one supported or did not support the winning candidate or parties (e.g. Curini et al., 2012; Ezrow and Xezonakis, 2011; Kim, 2009). People may also prefer winning separate from ideological rationales if the utility of backing a winner is greater than backing a loser (e.g. Kahneman et al., 1997; Thaler, 1994). More broadly, research outside of elections finds winning in general produces positive emotional responses while losing often leads to disillusionment (e.g. Brown and Dutton, 1995; Wilson and Kerr, 1999).
One can evaluate democracies on a myriad of metrics, from the protection of civil rights and liberties to the extent of broad competition in the electoral process (e.g. Altman and Pérez-Liñán, 2002). However, the difficulty in measuring most of these aspects often prioritizes relying on public perceptions of how democracy functions. Of these, satisfaction with democracy remains the focus (e.g. Anderson and Guillory, 1997; Dalton, 2004; Norris, 1999), with the assumption that satisfaction, as a summary indicator, captures that the state meets broader expectations of fairness, representation, and provision of services (e.g. Clarke et al., 1993; Fuchs, 1993; also see Ezrow and Xeozonakis, 2014).
However, the divergence of perceptions between winners and losers appears not to be limited to satisfaction with democracy, but extends to related aspects such as political trust, confidence of responsiveness to citizens, viewing the process as fair, and even satisfaction with the choice of candidates (e.g. Anderson and Mendes, 2006; Craig et al., 2006; Howell and Justwan, 2013; Karpowitz et al., 2011; Kornberg and Clark, 1994).While focusing on democratic satisfaction as the measure of choice may appear straightforward, a myopic focus potentially overlooks the broader effects of being an electoral winner or loser.
Likewise, a growing literature has begun to identify variation in trust across electoral and co-existing nonelectoral institutions. A variety of studies (e.g. Chi and Kwon, 2016; Huang et al., 2013; Wong et al., 2011) have found in both South Korea in particular and East Asia more broadly that there is variation in the level of trust that respondents place in different institutions. Additionally, Park (2017) finds that the relative levels of trust in different institutions vary over time and from survey to survey. This divergence in trust in different types of institutions is only compounded when the distinction is made between winners and losers. For example, the effects of a presidential election naturally should influence perceptions of the president, and winners and losers may view political parties in divergent terms. However, a contagion effect may exist across other branches of government (e.g. the legislature and judiciary) and to other government and nongovernmental institutions, a concern largely supported by the findings of Huang et al. (2013). Likewise, winners and losers may view election commissions differently (e.g. Diamond and Morlino, 2005; Hartlyn et al., 2008; Kerr, 2013), especially if the institutions had previously been accused of partisan or otherwise biased actions. Furthermore, if losers rationalize that their loss is due to a broader system rigged against their interests (e.g. the media promoting “fake news”), then evaluations across even nonpolitical entities should vary between winners and losers. If this is the case, then losers likely are not simply responding to expectations of policies that they oppose, but also appear to infer a broader discontent with politics beyond rational self-interests.
Nor is it as clear as to how one should necessarily identify winners or losers. Rather than identifying whether a respondent actually voted for a winning candidate, party, or ruling coalition, many sidestep this by inferring vote choice and thus winner/loser status based on the party or candidate preference of the respondent (e.g. Jou, 2009; Moehler, 2009).This is particularly problematic in district-based elections, where the respondent’s preferred party may not have run a candidate. If respondents opted to vote for an alternative candidate due to strategic voting or the absence of a district candidate from their preferred party, relying on either party identification or vote choice may be misleading in terms of effects on satisfaction. For example, Singh (2014) disaggregates winners and finds the expected boost in terms of democratic satisfaction for those preferring the winning party, with those who voted for but did not prefer the winning party largely indistinguishable from electoral losers.
Lastly, due to assumptions on how to measure winners and losers, the views of nonvoters are largely omitted from comparison (e.g. Loewen and Blais, 2006). High rates of nonvoting challenge the legitimacy of elections and perhaps signal broader democratic deficits, justifying a closer analysis of this group. Meanwhile, placing attention on nonvoters in high-turnout elections, especially one expected to be close, can elucidate whether this segment of the population is primarily disconnected or disinterested in politics or has partisan leanings yet failed to turn out for other reasons. When included in analyses, nonvoters are often accounted for with a single dummy variable (e.g. Wagner et al., 2003). This includes research specifically on South Korea (e.g. Cho and Kim, 2016; Rich, 2015). Nonvoters may have differing levels of political engagement and interest, influencing perceptions of democracy and its components compared to winners and losers, especially if one disaggregates nonvoters by preferred party. Nonvoters who are politically engaged but do not vote may be viewed as temporary nonvoters, compared to the politically disengaged who consistently do not vote. Yet most studies, to date, do not separate out types of nonvoters (e.g. Blais and Gélineau, 2007; Tavits, 2008).
Another means to separate out types of nonvoters is by party preference. One may assume that nonvoters supportive of winning candidates and parties would exhibit similar evaluations of electoral winners, especially if they are policy oriented as they presumably should expect the benefits of winning without the costs associated with turning out to vote. Likewise, a policy-oriented supporter of a losing party would be expected to have similar negative evaluations post-election regardless of whether or not they voted. However, if psychological attachments drive perceptions, we would expect to see variation between the voting and nonvoting partisans. For example, voting for a winner may create a greater sense of credit-claiming compared to nonvoting co-partisans, boosting evaluations, while nonvoting supporters of losing candidates may lack the psychological attachment to the loss, producing more positive evaluations post-elections than their co-partisan voters. One would also expect, in a dominant party system, that those preferring the opposition may not vote, seeing the action as futile (e.g. Rich and Holmes, 2016). Admittedly, concerns about a wasted vote or an election blowout in the Korean case should have been minimal based on information available at the time. However, without disaggregating nonvoters by partisanship, we lose the ability to contextualize properly the extent of divergence among voters and nonvoters.
In sum, the expectation remains that just as electoral losers traditionally show lower satisfaction with democracy, this deviation should extend to electoral and nonelectoral institutions more broadly. Meanwhile, consistently lower evaluations of nonvoters would suggest a broader challenge to democratic stability beyond just biases in representation. In contrast, if nonvoters do not consistently correspond with lower evaluations, their inactivity can be read as disengagement or complacency, essentially forms of implicit consent. Disaggregating nonvoters, the expectation remains that nonvoters supportive of electoral losers would have more positive evaluations than those voting for losers while nonvoters supportive of electoral winners would not share the same boost in evaluations as voting for a winner. A lack of distinction would indicate the extent that partisanship influences nonvoter engagement.
Research design and empirical analysis
This analysis relies on Wave 4 data from the Asian Barometer, with 1200 South Korean respondents (see summary statistics in Appendix Table 1). 3 The timing of the survey, which was implemented 27 October–2 December 2015, comes after two issues that likely influenced evaluations of the Park Geun-Hye administration: the April 2014 Sewol ferry sinking and the May 2015 outbreak of Middle East Respiratory Syndrome (MERS). However, the timing predates the major scandals of the Park administration that ultimately led to her impeachment in December 2016. It is also far enough away from the 2012 election to avoid temporary spikes in deviation based solely on immediate reactions to electoral results and it predates campaigning for the 2017 election.
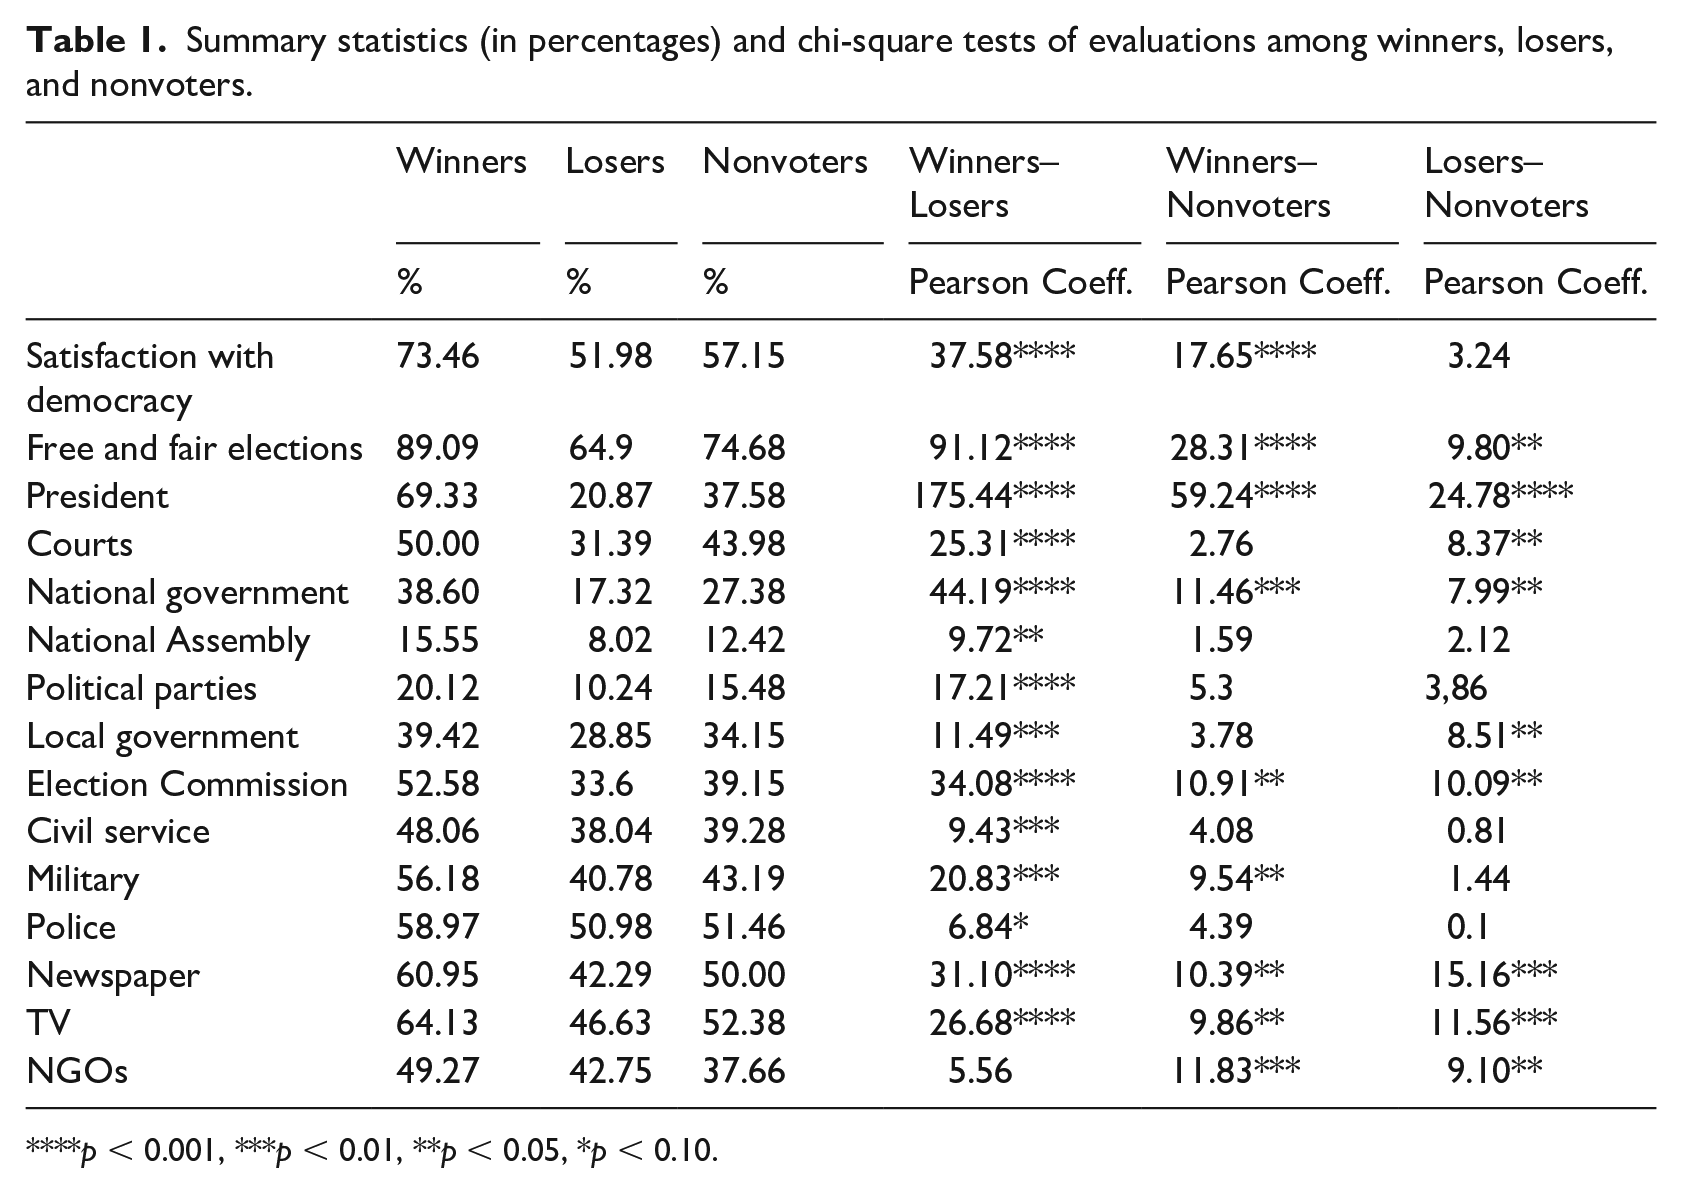
We use Questions 33 and 34, which ask whether the respondent voted and for whom they voted, if applicable. Winners are defined as those who claimed to have voted for Park Geun-Hye and losers those who claimed they voted for Moon Jae-in. 4 The difference in the percentage of explicit electoral winners and losers in the survey is even closer than the actual election results, with 42.70% coded as winners (Park) and 21.25% as losers (Moon). Nonvoters, 14.87% of respondents, are first presented as a single group, before separating out nonvoters based on respondents’ stating to which party they felt closest (Question 53): none, Park’s Saenuri Party, or Moon’s Democratic Party. 5 As an initial test, we present levels of satisfaction for democracy (Question 92) with another factor we would assume varies by one’s status, perceptions of the election as free and fair (Question 38), both measured on a four-point Likert scale with higher scores corresponding with satisfaction and fairness. Reduced to a binary measure, overall 63.12% claimed satisfaction with democracy and 79.79% believed the election to be free and fair. Divided by status, clear variation emerges, with over a 20-point deviation in both measures between winners and losers, with nonvoters providing higher rates than losers (Table 1).
Summary statistics (in percentages) and chi-square tests of evaluations among winners, losers, and nonvoters.
p < 0.001, ***p < 0.01, **p < 0.05, *p < 0.10.
Asian Barometer also includes similar four-point trust measures for a series of other institutions (Questions 7–19).We would expect that electoral losers would evaluate institutions directly related to the electoral loss as well as institutions in which the president would have considerable influence more negatively than winners. However, if losing generates broader negative perceptions, these should be evident in evaluations of institutions that are generally viewed as nonpartisan 6 as well as those separate from the government entirely. We thus organized these institutions into four categories based on the degree of direct partisan influence expected from : (a) the president, the courts and national government; (b) the National Assembly, parties, and local government; (c) the election commission, civil service, military, and police; and (d) television, newspapers, and nongovernmental organizations (NGOs).
Table 1 shows the rates of satisfaction for each, recoded as binary and broken down by winners, losers and nonvoters. Across every measure, winners displayed higher evaluations than losers, with an average difference of 16.26%. The largest deviation predictably arises in trust of the president, with rates of trust among winners more than double than that of losers (69.33% versus 20.78%), while the smallest deviation is seen in perceptions of NGOs (6.52%), where the winner of a presidential election should have no influence. Despite this variation, we should not overstate the winner–loser deviation as across most of the measures, majorities of winners and losers share similar views. In contrast, perceptions of nonvoters as a whole were only marginally higher than those of losers, with an average of 5.57% difference. A few outliers emerge: nonvoters were more trusting of the president, courts, and the national government by 10% or more while only less trusting in one instance, that of NGOs (–5.09%). Again, the overall similarities between nonvoters and losers, and to a lesser extent nonvoters and winners, suggests a broad consensus on perceptions of most institutions.
Table 1 also presents the Pearson chi-squares comparing winners to losers, winners to nonvoters, and losers to nonvoters. Comparing evaluations of electoral winners to losers, we see that only the variation in trust NGOs fails to reach statistical significance. While a divergence in trust in the executive office would be expected, that the divergence extends into institutions where Park would have limited direct political influence (e.g. courts), ones viewed as nonpartisan (e.g. police, military civil service), and ones beyond the government (e.g. media) suggest that the pattern is not simply due to ideological or policy differences. That said, and unlike many younger democracies (e.g. Chang et al., 2014), a majority of electoral losers still stated they were satisfied with democracy. Combined with a majority of losers viewing elections as free and fair, these preliminary results suggest that loser dissatisfaction does not seem to be an existential threat to democratic survival.
Meanwhile, nonvoters statistically differ from winners in only nine of our 16 variables (p ⩽ 0.05) and nonvoters differed from electoral losers in only two variables, trust in newspapers and NGOS, and only at p < 0.10. Nonvoters remain remarkably similar to losers on satisfaction, while views of the election as free and far differ by 10% (significant at 0.001). That nonvoters do not consistently differ from either winners or losers questions what motivates them to abstain and suggests at least tacit approval of the democratic electoral process.
Preliminary results suggest a clear divergence in perceptions between winners, losers, and nonvoters, but do not disaggregate among nonvoters. For example, do nonvoters who otherwise identify with winners or with losers share similar perceptions to those who vote? Of the respondents stating that they did not vote, most did not identify with a party (76.02%), with similar rates among those who preferred the Democratic Party (13.45%) and Saenuri (10.53%) parties. A cursory view shows similar satisfaction with democracy among Saenuri preferred nonvoters versus their voting brethren (72.22% vs 73.46%), while Democratic nonvoters were slightly more satisfied (60.87% vs 55.49%). Meanwhile, supporters of the Saenuri party who did not vote viewed the election as similarly free and fair as Saenuri voters (88.89% vs 89.09%), yet Democratic supporters who did not vote were far less likely to view it in the same light (47.06% vs 62.77%). T-tests, however, find no significant difference between partisan voters and nonvoters on these issues.
To capture variation within nonvoters and to identify the robustness of the preliminary findings, we conducted series of ordered logit models on each of the previously presented four-point measures of perceptions and trust. For independent variables, we include first dummy variables for those who voted for Moon Jae-in and those who stated they did not vote, leaving voters for Park as the baseline. Next, controls are included for the two largest parties, Moon’s Democratic Party and Park’s Saenuri Party. Additional demographic controls include gender (female), age (a continuous measure), and education (measured on a 10-point scale). As regionalism remains a defining trait of South Korean electoral politics (e.g. Cho, 2000; Lee, 2003), with Honam in the southwest overwhelmingly supportive of liberal-progressive parties and Yeongnam in the southeast registering a similar support for conservative parties, 7 dummies for both regions are included as well. In addition, positive evaluations of governmental performance as it relates to the economy, often measured via individual evaluations of the state of the economy, have been linked to increased levels of trust in political institutions in a wide variety of locations, including South Korea (e.g. Chang and Chu, 2006; Huang et al., 2013; Kim, 2010; Park, 2017; Wong et al., 2011). As such, five-point economic evaluations, both of the nation as a whole and the economic conditions of one’s own family, are included.
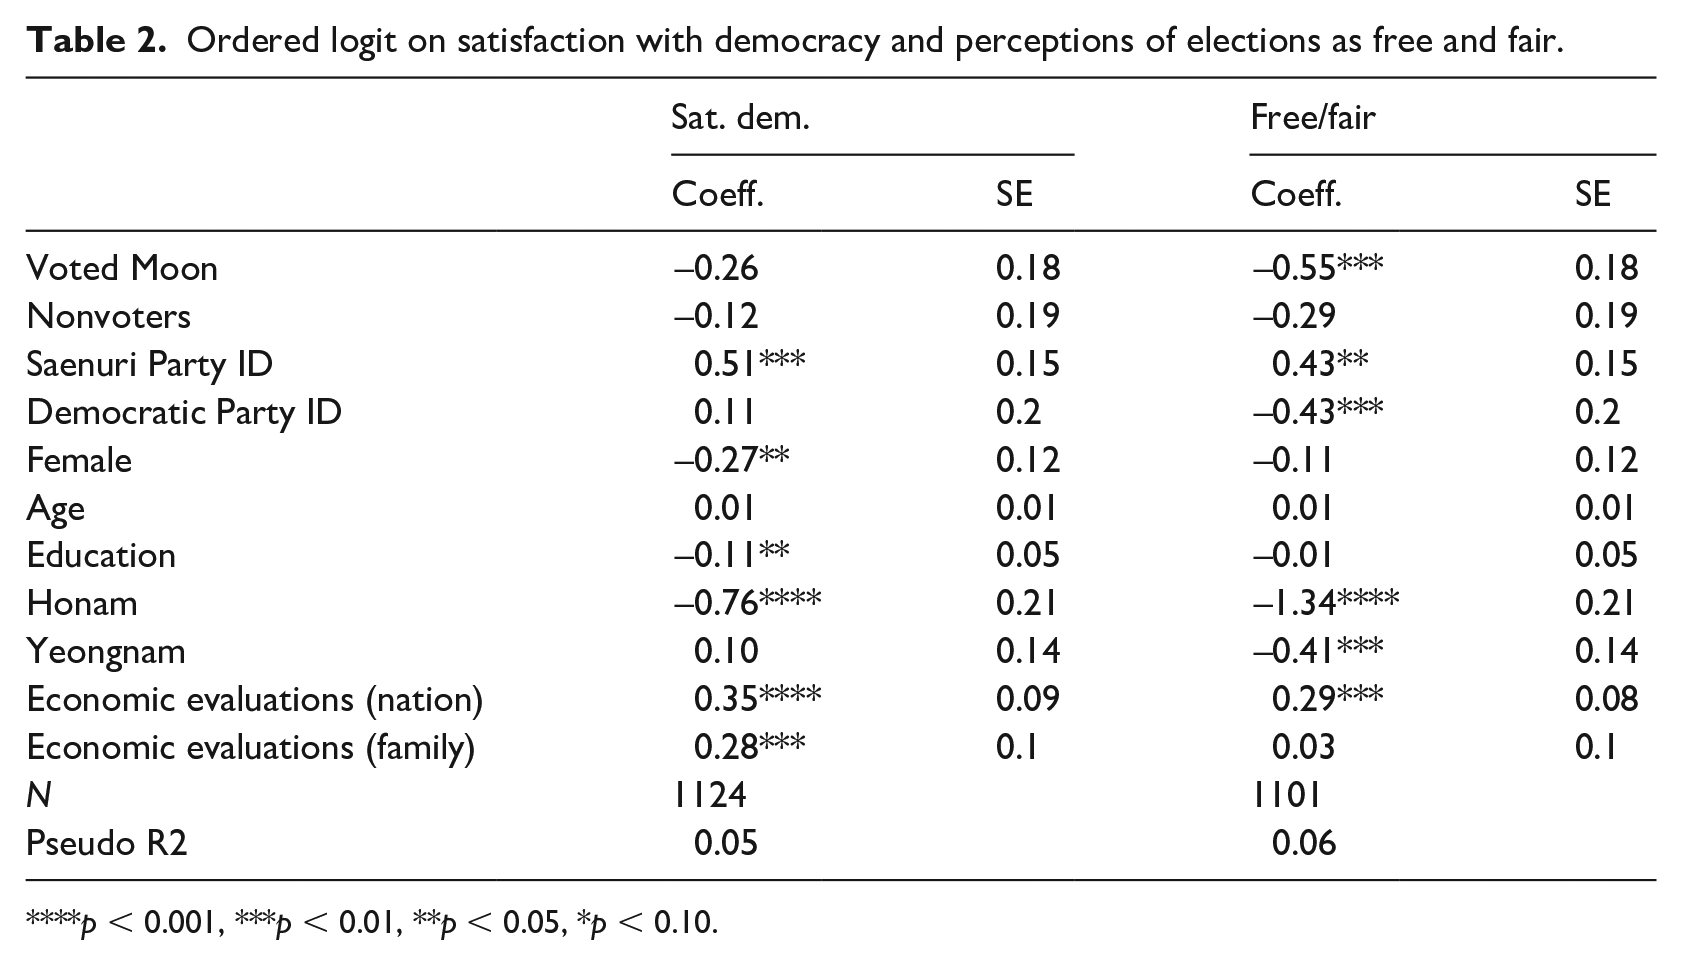
Several patterns emerge across the models presented in Tables 2–6. 8 Table 2 includes just the models of satisfaction with democracy and viewing the election as fair. Regarding satisfaction with democracy, we find no statistically significant differences in satisfaction between electoral winners and losers or nonvoters. Meanwhile electoral losers negatively corresponded with viewing elections as free and fair, significant at p < 0.001, while nonvoters failed to reach significance. In Table 3, we focus on the trust in the president and the two institutions that the president has the most influence: the courts and national government. Here, we find that voting for an electoral loser (Moon) corresponds with lower evaluations in each model, although weakest in the courts model (p < 0.10), while the nonvoter dummy variable only reaches significance in the president model, with a noticeably smaller coefficient than the electoral loser variable in each model.
Ordered logit on satisfaction with democracy and perceptions of elections as free and fair.
p < 0.001, ***p < 0.01, **p < 0.05, *p < 0.10.
Ordered logit on trust in institutions.

p < 0.001, ***p < 0.01, **p < 0.05, *p < 0.10.
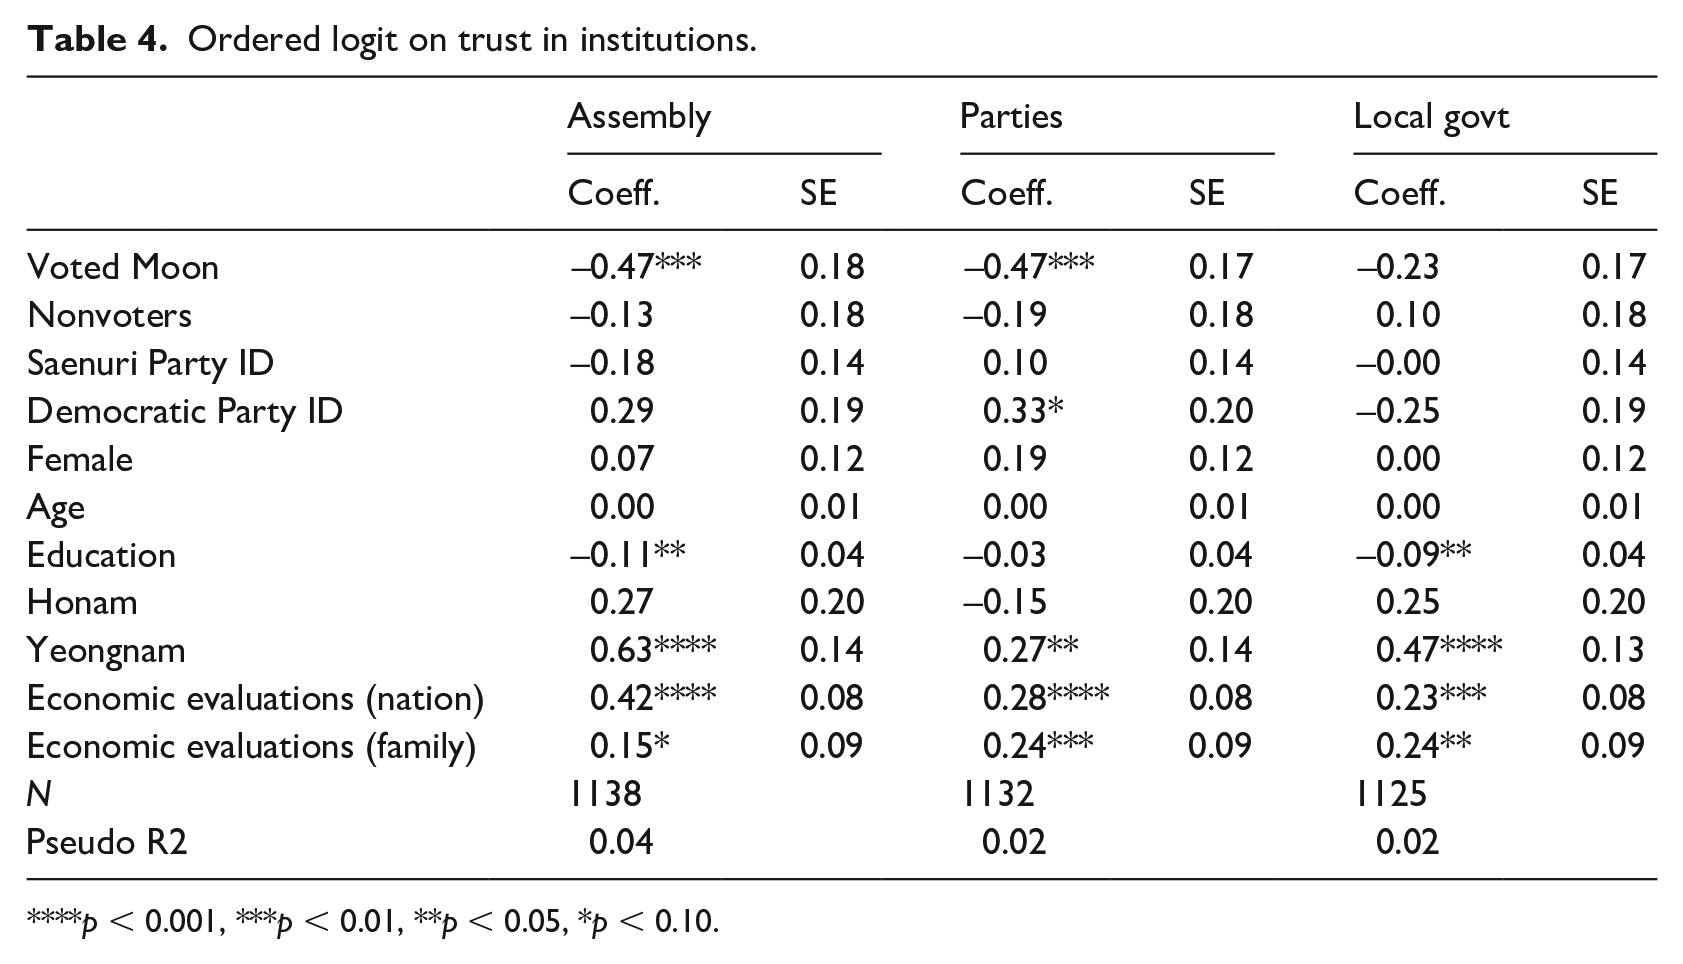
Ordered logit on trust in institutions.
p < 0.001, ***p < 0.01, **p < 0.05, *p < 0.10.
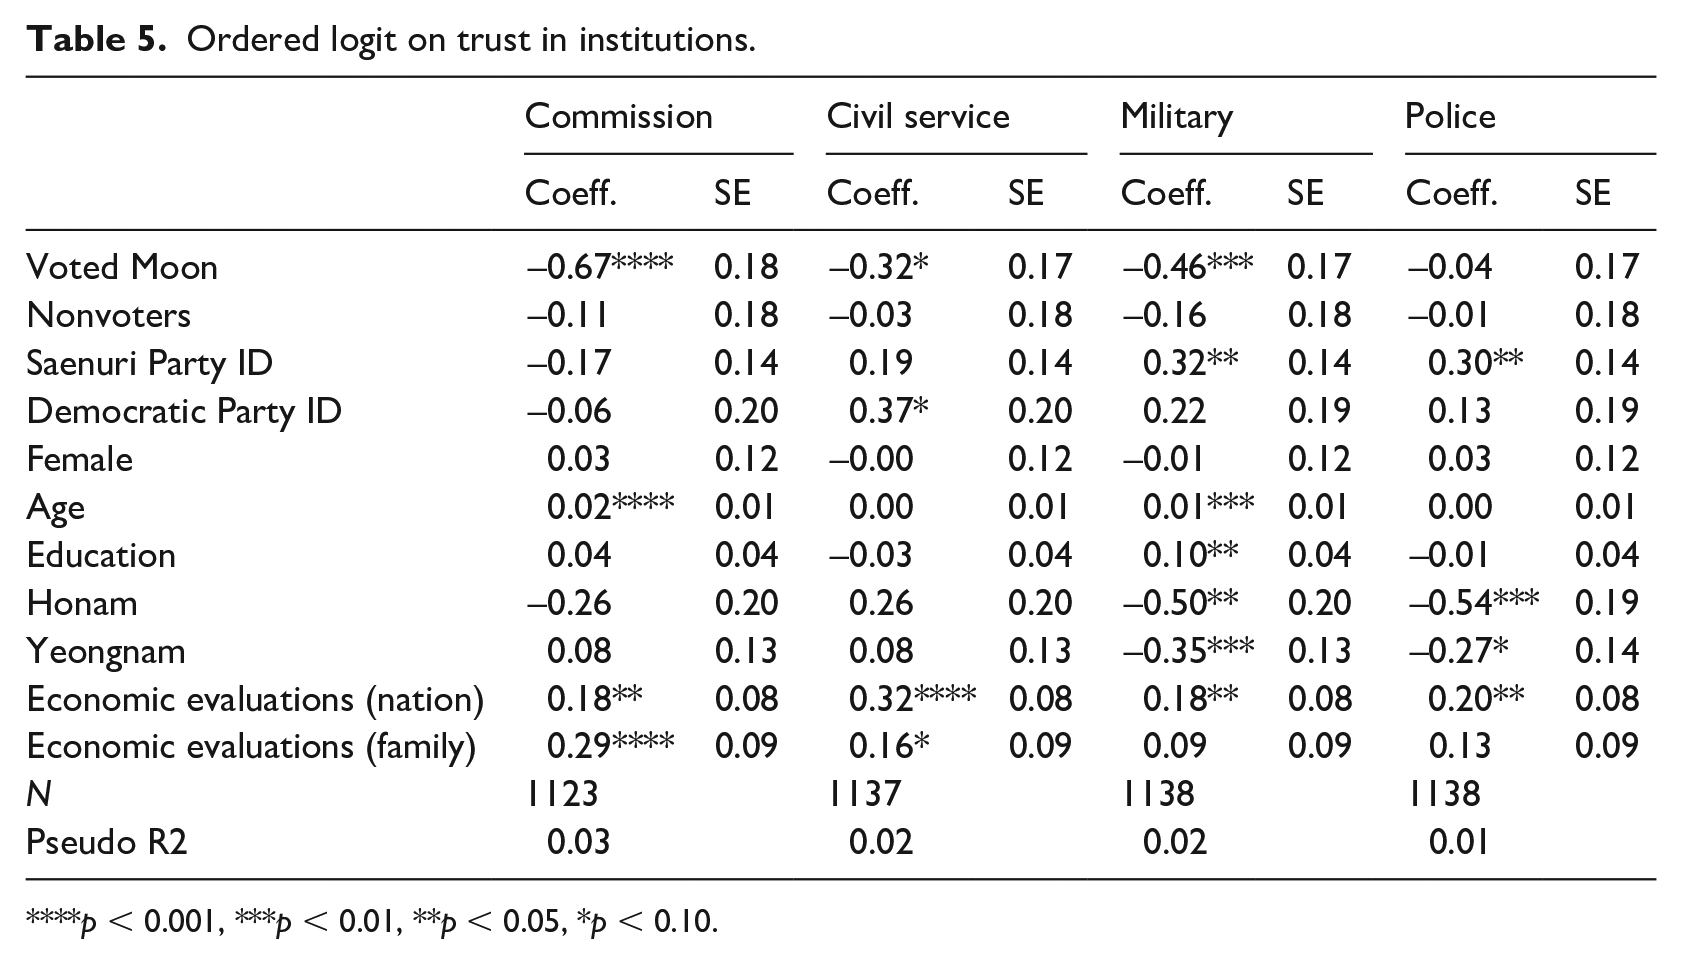
Ordered logit on trust in institutions.
p < 0.001, ***p < 0.01, **p < 0.05, *p < 0.10.
Ordered logit on trust in institutions.

p < 0.001, ***p < 0.01, **p < 0.05, *p < 0.10.
Table 4 moves to institutions in which the president has less direct influence: the National Assembly, political parties, and local government. Here voting for an electoral loser in the presidential race negatively corresponded with trust in all three models, only failing to reach significance in the local government model, while nonvoters were not significant in any model. Table 5 includes models for institutions traditionally viewed as nonpartisan: the electoral commission, civil service, military, and police. Here, voting for an electoral loser corresponded with lower evaluations across all four models, significant in all but the police model, while the nonvoter variable failed to reach significance in any model. Lastly, Table 6 focused on institutions outside of the government: newspapers, television, and NGOs. Again, electoral losers corresponded with lower evaluations, although this fails to reach significance in the newspapers model. In contrast, nonvoters too negatively corresponded with evaluations in each model, but only reached statistical significance in the NGO model.
In sum, electoral losers corresponded with statistically significant lower evaluations in 11 of the models compared to nonvoters in only three: viewing the election as free and fair, trust in the president, and trust in NGOs. Moreover, the coefficient on nonvoting is considerably larger in only one model, trust in NGOs, while the nonvoting has a substantively larger influence in most of the models. The findings suggest that nonvoting primarily affects only the perceptions of the most recent election. More broadly, in four models the perceptions of electoral losers and nonpartisan nonvoters both were statistically indistinguishable from electoral winners: satisfaction with democracy, and trust in the National Assembly, local government, and newspapers. The lack of significance on satisfaction with democracy suggests that respondents separate out abstract views of democracy compared to institutional components of democracy, a factor that aids in democratic stability. The lack of statistical significance on the National Assembly model could simply be a function of the overall low evaluations of the institution, while the finding on local government suggests that voters and nonvoters separate national and local issues.
More importantly, separating out institutions based on the influence of the president on those institutions suggests the far-reaching influence of being an electoral loser. While one would expect lower levels of trust in the president, courts, and national government if one voted for a different presidential candidate, that electoral losers view parties, the electoral commission, civil service, the military, the police, television, and NGOs as less trustworthy is a pattern not seen to the same extent for nonvoters.
Regarding the partisan dummy variables, we see less consistency. In only one model are both variables significant, regarding whether elections are free and fair, in expected directions. Meanwhile, the Saenuri Party variable corresponds with increases in evaluations in six other models, the largest coefficient predictably on the presidency model (0.95, p < 0.001), and negatively corresponds with evaluation of the election commission and NGOs. In contrast, other than perceptions of the elections as free and fair, the Democratic variable barely reaches significance (p < 0.10) and in only three models, trust in civil service, local government, and newspapers. Moving on to other control variables, economic evaluations largely correspond positively with evaluations, consistent with the conventional wisdom. However, no consistent pattern emerges on the other controls other than the Honam variable which, more often than not, corresponded with a statistically significant decline in evaluations, suggesting motivations for the regional divergence beyond its traditional partisan leanings.
To identify the extent in which types of nonvoters differed in perceptions, additional models included interaction terms for nonvoters and identification with the Saenuri and Democratic parties (see Supplemental Tables 1–4). However, the limited number of partisans who stated that they did not vote should lead to some caution in the interpretation of results. 9 Across the models, the Saenuri interaction variable was only significant in one model, negatively corresponding with trust in civil service (coefficient: –1.26, p < 0.05). The Democratic interaction variable, by contrast, reached statistical significance in four models, positively corresponding with evaluations of the president, parties, newspapers, and television. While the coefficients are largely in the expected direction, these findings suggest limited leverage in disaggregating nonvoters on party lines. Moreover, the addition of the interaction variables in these models leave the nonvoter variable significant in only two models, but the electoral loser (voting for Moon) variable significant in ten of the models.
Additional models were tested for robustness, producing findings largely consistent with the original models (omitted for brevity). The survey includes a four-point measure asking whether the respondent believes that “most people are trustworthy” (Question 24) as well as a four-point measure of interest in politics (Question 44). Adding these separately or together to the original models failed to change the core findings while the trustworthy measure positively corresponded with evaluations in every model ( p < 0.001). Finally, with concern that evaluations of electoral institutions influenced views on other institutions, separate models included the average of evaluations of national electoral institutions (the president and National Assembly) and electoral institutions more broadly (president, National Assembly, national government, local government) with the dependent variable comprising the average of trust in the nonelectoral institutions. With otherwise the same independent variables as the original models, here we find the electoral losers and nonvoters still correlated with lower evaluations, but only the former reached significance.
Overall, the findings not only confirm a divergence in perceptions on democratic satisfaction and electoral fairness between electoral winners and losers, but a divergence that extends well beyond institutions directly impacted by the presidential election. Whether this pattern is due to depressed evaluation by losers or a heightened support for simply voting for a winner remains unclear (e.g. Anderson and Tverdova, 2001; Singh et al., 2012). Moreover, the findings here suggest the limited saliency of nonvoting on evaluations, while disaggregation at best suggests some distinction between voters and nonvoters who support losing parties.
Concluding remarks
The results show a clear distinction between the perceptions of winners compared to losers, perceptions that are not limited to perceptions of democracy in the abstract, but extend to trust in most of the institutions under analysis. However, on most evaluations, majorities of winners and losers largely agreed, suggesting that the lower evaluations of losers do not fundamentally challenge democratic stability in the country. Meanwhile, despite expectations, nonvoters did not consistently differ from electoral winners after controlling for additional factors, nor did the disaggregation of nonvoters based on partisan preference show consistent differences across types of nonvoters or in relation to electoral winners. The results suggest that nonvoting may not be as great a challenge to democratic stability as one might have initially considered if stability can be adequately measured by trust in institutions. Thus, the tacit acceptance of the democratic system and related institutions by nonvoters suggests that they may only turn out to vote when democracy is in jeopardy.
While only a snapshot in time, the results suggest the far-reaching psychological impact of winning or losing elections, although it cannot shed light as to whether today’s electoral losers shift evaluations if they become electoral winners in the future. In the South Korean case this is particularly important where power has frequently alternated between liberals and conservatives and today’s losers can expect to be future winners. That Moon Jae-in was elected president in 2017 should have converted most of the previous electoral losers to winners. Furthermore, South Korea offers a unique case study in the corruption scandal of former South Korean president Park Geun-Hye, who was impeached for colluding with and giving classified documents to a close family friend and political adviser. Scandals, like this one, could undermine the support of Park’s Saenuri Party and respondents to the survey, overall. However, as this analysis has shown, even after such as a scandal has taken place, we would expect survey respondents who had initially voted for Park to give her higher evaluations.
Additionally, one aspect largely left unexplored is the timing and duration of divergent perceptions. In other words, one might expect a greater distinction in views between winners and losers immediately after an election, but do these dissipate with time, remain flat, or reemerge immediately before the next election? Limited work assesses the winner–loser deviation over time (e.g. Chang et al., 2014) which would provide greater means of assessing not only baseline evaluations but to what extent variation between electoral winners and loser is cyclical. Future work should also consider tracing the effect of winning, losing, and nonvoting not only across elections but during individual election cycles. Additional disaggregation is also worth considering. For example, Abdelzadeh (2014) finds deviation in political dissatisfaction among supporters of opposition parties based on their levels of political conviction and a similar distinction among electoral losers, either by conviction or by the depth of partisan attachment, may help shed additional light on the precise mechanism leading to lower evaluations among this group.
Supplemental Material
supplemental_material – Supplemental material for The Lingering Effects of Losing and Nonvoting on Institutional Trust: An Analysis of South Korea
Supplemental material, supplemental_material for The Lingering Effects of Losing and Nonvoting on Institutional Trust: An Analysis of South Korea by Timothy S Rich, Lucas Knight and Andi Dahmer in Journal of Asian and African Studies
Footnotes
Appendix
Summary statistics.

| N | Mean | SD | Min | Max | |
|---|---|---|---|---|---|
| Satisfaction with democracy | 1177 | 2.65 | 0.66 | 1 | 4 |
| Elections free and fair | 1138 | 2.96 | 0.78 | 1 | 4 |
| Trust in president | 1182 | 2.46 | 0.79 | 1 | 4 |
| Trust in courts | 1184 | 2.33 | 0.72 | 1 | 4 |
| Trust in National Assembly | 1192 | 1.72 | 0.71 | 1 | 4 |
| Trust in national government | 1191 | 2.14 | 0.73 | 1 | 4 |
| Trust in parties | 1185 | 1.87 | 0.69 | 1 | 4 |
| Trust in civil service | 1191 | 2.36 | 0.68 | 1 | 4 |
| Trust in military | 1192 | 2.47 | 0.71 | 1 | 4 |
| Trust in police | 1192 | 2.51 | 0.71 | 1 | 4 |
| Trust in local government | 1179 | 2.25 | 0.71 | 1 | 4 |
| Trust in newspapers | 1183 | 2.51 | 0.71 | 1 | 4 |
| Trust in TV | 1186 | 2.56 | 0.71 | 1 | 4 |
| Trust in election commission | 1176 | 2.37 | 0.72 | 1 | 4 |
| Trust in NGOs | 1158 | 2.42 | 0.72 | 1 | 4 |
| Voted Moon | 1150 | 0.21 | 0.41 | 0 | 1 |
| Nonvoters | 1150 | 0.15 | 0.36 | 0 | 1 |
| Saenuri Party identifiers | 1200 | 0.31 | 0.46 | 0 | 1 |
| Democratic Party identifiers | 1200 | 0.14 | 0.35 | 0 | 1 |
| Female | 1200 | 0.50 | 0.50 | 0 | 1 |
| Age | 1200 | 45.73 | 14.56 | 19 | 80 |
| Education | 1200 | 7.29 | 1.67 | 1 | 10 |
| Honam | 1200 | 0.10 | 0.30 | 0 | 1 |
| Yeongnam | 1200 | 0.26 | 0.44 | 0 | 1 |
| Economic evaluations (nation) | 1196 | 2.26 | 0.75 | 1 | 5 |
| Economic evaluations (family) | 1199 | 2.67 | 0.67 | 1 | 5 |
Funding
The author(s) disclose receipt of the following financial support for the research, authorship, and/or publication of this article: This work was supported by the Academy of Korean Studies (AKS-2020-R01).

Supplemental material
Supplemental material for this article is available online.
Notes
Author biographies
References
Supplementary Material
Please find the following supplemental material available below.
For Open Access articles published under a Creative Commons License, all supplemental material carries the same license as the article it is associated with.
For non-Open Access articles published, all supplemental material carries a non-exclusive license, and permission requests for re-use of supplemental material or any part of supplemental material shall be sent directly to the copyright owner as specified in the copyright notice associated with the article.
