
Abstract
Bureaucracies often provide information to legislatures in an effort to influence the agenda. This paper assesses whether data affects this influence, arguing quantitative support can increase the likelihood of legislative discussion and passage of bills related to a given topic. I also assess the impact of centralization on an agency’s ability to provide information and shape legislative agendas. I find including data in bureaucratic reports can significantly increase an agency’s influence on the legislature, but this effect is only present in a centralized setting. These results suggest centralized agencies are better equipped to marshal quantitative support for arguments to legislatures.
Introduction
The use of data in policymaking is quickly becoming an integral part of modern government. The clearest demonstration of this is the rapid increase in Chief Data Officer (CDO) positions within various government entities over the past decade. Since Colorado hired its first statewide CDO in 2010, 24 other states and the District of Columbia have followed suit (Freed, 2019). The growth in these positions has led to the creation of the State Chief Data Officers Network, convened to enable sharing of best practices between states (Kleykamp, 2019). At the federal level, the Foundations for Evidence-Based Policymaking Act of 2018 has recently mandated that all federal agencies appoint a Chief Data Officer to manage the data assets of the agency. 1 These developments demonstrate that data’s role in governance is increasing, yet there is little academic research devoted to assessing its impact.
This paper begins to explore how data is used in government decision making and to what effect. Specifically, it focuses on the provision of data-laden information by bureaucratic agencies to legislative bodies. Bureaucracies serve as key information providers for legislatures at both the state and federal levels, meaning these exchanges are incredibly frequent and can have significant impacts on subsequent policy choices (Workman, 2015; Workman et al., 2017). However, the impact of information provided by bureaucracies is not uniform. Previous research has shown that structural factors of bureaucracies influence the ability of an agency to shape legislative discussions. One such example is centralization, which affects the concentration of an agency’s agenda and its alignment with legislative concerns (Bark, 2021). The amount of data included in bureaucratic communications may also be one of these factors in that it can provide factual information on which legislators may base their arguments in favor of a specific position. This leads to the first research question addressed in this paper: does the inclusion of data make bureaucratic arguments stronger, such that legislatures are more likely to take up the topic of concern?
I argue the use of data increases the likelihood that a given issue will appear on the legislative agenda based on the elaboration likelihood model taken from social psychology. This model suggests individuals with strong motivations to learn about a topic will be more receptive to quantitative arguments (Petty & Cacioppo, 1986). While not all legislators will be interested in every substantive policy area, those who are should be more receptive to bureaucratic arguments supported by data and statistics. Such legislators will be more likely to place an issue on the agenda and shepherd it through the legislative process if it has quantitative support. They may also utilize the data in a more symbolic sense to craft a narrative surrounding the policy to engender support among colleagues who are less invested in the issue at hand (March & Olsen, 1984).
The second question addressed in this paper relates to the bureaucracy, asking whether the structure of the agency affects its ability to provide data and shape the legislative agenda. I contend that it does, primarily through the degree of centralization. Highly centralized agencies collect larger amounts of data in a single location, making it more accessible for inclusion in reports sent to the legislature. Less centralized organizations, meanwhile, do not have ready access to as much data for such purposes, thereby limiting their ability to influence the legislative agenda and its outputs.
These hypotheses are investigated through a comparison of legislative agenda space devoted to topics with varying levels of quantitative support in bureaucratic reports as well as the progress of bills on the same topics through the legislative process. Substantively, the dataset focuses on a comparison of higher education policy in Kansas and Illinois and the quantitative information provided by the higher education governance board in each state. Using a series of path analysis mediation models and a large dataset containing over 9,000 coded paragraphs, I find some evidence that provision of data by the bureaucracy can increase the likelihood of a topic being introduced and passed into legislation, specifically for centralized agencies. Following the analyses, I provide a brief discussion of the results and their implications.
Bureaucratic Provision of Data
Traditional notions of the bureaucracy envision it as the realm of experts, where information is held close to maintain an advantage over political principals. Thus, a great deal of the literature focuses on ways to control bureaucratic leaders and minimize moral hazard (McCubbins & Schwartz, 1984). However, recent research suggests bureaucrats are much more willing to share information than previously thought. This line of work is based on the idea that information is a key driver of political agendas, as it allows issue positions to be translated into actionable policy preferences (Baumgartner & Jones, 2015; Rochefort & Cobb, 1994). From this perspective, then, bureaucracies have little incentive to guard their informational advantage. Instead, bureaucrats use information to affect the policy process at a much earlier stage in order to help define policy problems within their domain (Shafran, 2015; Workman et al., 2017). To do so, bureaucracies are eager to provide as much information as possible to legislators in order to shape their perspective on policy questions to more closely match the bureaucracy’s goals (Bark, 2021; Workman, 2015). Bureaucracies are not the only organizations providing this information, but they are among the most significant (Sabatier & Whiteman, 1985). Because bureaucracies interact with legislators repeatedly over time, a sense of trust is built up between the two institutions. As part of this longstanding relationship, legislators also become familiar with agency positions and biases and adjust their responses accordingly. This allows legislators to utilize bureaucratic information even if it is not perfectly accurate or in line with the legislator’s own beliefs (Guston et al., 1997; Workman, 2015; Workman et al., 2017). As a result, bureaucracies can have sizable impacts in shaping legislative agendas.
The impact itself is highly variable, however, depending on the information an agency is able to provide. The quality of the information can be significantly affected by the characteristics of the agency (Hird, 2005), which in turn impacts how much of a bureaucracy’s information is actually used by the legislature. Agencies which are able to provide concise, relevant, and timely information are much more likely to be influential in the policy process (Sabatier & Whiteman, 1985), as are agencies which are trusted or deemed credible by legislators (Guston et al., 1997; Rich, 2001). Such credibility is built up over time as bureaucrats become more knowledgeable in a given policy area through their experience (Gailmard & Patty, 2013). This experience develops bureaucratic expertise and generates information that is relied upon during legislative hearings (May et al., 2016; Workman et al., 2017). Agencies can build additional credibility through internal means, such as good performance and high managerial capacity (Carpenter, 2001; MacDonald & Franko, 2007). These traits can also translate to the production of data, which policymakers increasingly associate with effective practices (Spillane, 2012). Thus, the most effective agencies are likely to be considered those which produce timely data for legislatures considering relevant policy choices.
Legislative Use of Data
Mere production of data is not enough to influence the policies adopted by a state’s legislature, however. A variety of other factors condition whether legislators will use the presented data to inform their policy choices. To explain these factors, I turn to the Elaboration Likelihood Model (ELM) used in psychology research to describe how individuals respond to persuasive messages. This model presents two routes of elaboration individuals utilize when considering an argument—the peripheral route and the central route (Kitchen et al., 2014; Petty & Cacioppo, 1986). Which route a legislator is apt to use depends on their interest in the issue at hand.
The central route is commonly used by individuals who are motivated to contribute meaningfully to a decision and whose understanding of the topic is high (Petty & Cacioppo, 1986). In a political setting, these are legislators with a strong inclination toward a given policy area—such as those serving on a relevant committee or, in this case, representing a district containing an institution of higher education. Such legislators will be highly motivated to influence decisions related to higher education policy and will be sufficiently informed to do so. By engaging in the central route of processing, these individuals are likely to find factual support of arguments and policy proposals convincing. To the extent that bureaucratic data serves this purpose, it will enable legislators on the central route to demonstrate the strengths or proven benefits of a policy and thereby push it onto the legislative agenda. With the involvement of such actors, then, the central route of processing is predictive of the extent to which data can drive the policy agenda.
In addition to this instrumental use of bureaucratic data, legislators on the central path of persuasion may also use information in a more symbolic way to influence the interpretation of a policy proposal by colleagues on the peripheral path (March & Olsen, 1984). Considered from a neo-institutionalist perspective, information serves as a symbol of rational competence, with more data lending greater legitimacy to decision making (Feldman & March, 1981). This symbolism enables savvy legislators who are invested in a policy to craft a narrative surrounding a proposal that appears convincing to colleagues in the legislature.
Such narratives are highly likely to influence the opinions of legislators on the peripheral path of persuasion, which often relies on secondary factors (rather than factual evidence) to determine positions (Hutton & Baumeister, 1992). Such secondary factors include cues from representatives with greater expertise and similar ideologies, such as party leaders or relevant committee chairs (Dahl, 1950). Because these experts are presumed to be trustworthy on the policy being considered and appear to have consulted data to support their position, non-specialist members of the legislature feel safe in accepting their narratives about the issue despite their largely symbolic nature. Thus, while ideology will play an important role in the policy positions of legislators on the peripheral route, these legislators will also be affected by the amount of quantitative data presented in support of a policy proposal.
The symbolic use of information in policy debates also helps to explain the apparent contradiction between legislators’ limited capacity due to attention constraints (Jones, 2001; Jones & Baumgartner, 2005; Simon, 1996) and their use of significant amounts of data from bureaucratic reports as argued here. Data is used in the instrumental sense for only the most invested of legislators, who are willing to spend the time and effort to engage deeply with a policy proposal. For the majority of legislators, however, large amounts of data simply serve as a signal that a policy issue has been evaluated by others. As a result, they themselves do not carefully consider the data presented or its content, thereby easing the cognitive burden associated with the issue.
The Case of Higher Education
To assess these arguments, I focus on data provision regarding higher education policy, where the major bureaucratic players are found at the state level. These agencies are known as governance boards, usually headed by state higher education executive officers (SHEEOs). 2 By most accounts, SHEEO agencies come in two major forms—governing boards and coordinating boards (Dressel et al., 1980; McGuinness, 2003). Both structures oversee higher education in their state and serve as a sort of liaison between the state’s colleges and universities on one hand and the state’s legislature and governor on the other (Bark & Fryar, 2018; Ness, 2010). In this vein, one of the key roles of SHEEOs is “facilitating and controlling the flow of information between the various entities and actors” within the state, including the provision of data about a state’s higher education sector (Hillman et al., 2015, p. 31).
Though the overarching goals of SHEEOs are similar across the two types, governing boards and coordinating boards are structured somewhat differently. Governing boards are more centralized in their authority, often having the power to make a variety of decisions on behalf of a state’s institutions of higher education. In some states, these powers even include authority over campus budget decisions (Glenny, 1959; Millett, 1984). Coordinating boards, meanwhile, have less centralized decision authority and are often limited to reviewing decisions that have already been made at the campus level (Hillman et al., 2015; McGuinness, 2003). Under these structures, campus officials retain more autonomy, which allows the statewide board to address broader concerns. In fact, one of the major strengths of the coordinating board approach is the ability it provides for the board to “focus on broad public policy issues and to devote considerable attention to the data and information required to advise the elected leaders responsible for making policy and allocating public resources” (Lingenfelter et al., 2008).
These distinctions make SHEEOs an ideal organization type for the questions raised in this article. Both governing and coordinating boards work toward the same goals—providing oversight and coordination of public higher education within their state—and are active providers of information and data to state legislatures (Hillman et al., 2015). Indeed, one of the reasons for developing statewide coordination of higher education in the first place was to advise state policymakers regarding higher education policy (Lingenfelter et al., 2008). This centrality of information provision to the mission of SHEEOs ensures they are sending enough data and information to legislators to have a tangible impact, making them a good case to determine whether this effect exists before moving on to agencies that may be less data driven.
However, SHEEOs are also an interesting case in that they carry out their tasks differently based on the structure of the agency, which may influence the amount and type of data they are able to produce. Structural factors have long been known to influence an agency’s agenda (Hammond, 1986; Moe, 1995). Centralization in particular has been shown to have substantial impacts on an agency’s response to incoming information (May et al., 2008), as well as the information it is able to produce for external audiences (Bark, 2021). In higher education, bureaucratic centralization has been shown to influence minority student enrollment, both independently and through an interaction effect with legislative representation (Hicklin & Meier, 2008). Looking at SHEEOs specifically, centralization may affect the types of data on which an agency tends to focus its attention. For example, a governing board in a highly centralized setting may provide specific data from each campus to support its needs. Less centralized coordinating boards, meanwhile, may focus on overarching trends in order to highlight the condition of the higher education sector as a whole rather than a particular campus. As a result, SHEEOs present an opportunity to test whether different agencies utilize data to varying degrees of success in shaping the legislative agenda.
Hypotheses
Based on this review of information processing, one can construct hypotheses in answer to the research questions: whether the inclusion of data makes a bureaucracy’s arguments stronger, such that legislatures are more likely to take up the topic of concern; and whether centralization of the bureaucratic agency influences this relationship. With regard to the first question, my hypothesis is that including data in a bureaucratic report will increase the likelihood of a topic ending up on the legislative agenda. This is based largely in the ELM literature, which suggests data is a powerful tool in persuading people who use the central route for assessing arguments. Given legislators’ interest in making good public policy in order to increase their chances of reelection or to credit claim among specific constituent groups (Mayhew, 1974), many of them are likely to utilize this central pathway. Furthermore, data can provide legislators with the necessary evidence that a specific policy has been or will be effective, thereby enabling them to craft a narrative to defend their position publicly. These symbolic narratives can also be used to convince legislators who use the peripheral route of evaluating a policy’s merits, thereby utilizing the data indirectly. Thus for legislators who have some level of interest or expertise, and those who rely on such colleagues, data is likely to be influential of legislative outcomes.
Beyond this basic test, I also expect to find differences in the effectiveness of data presented by bureaucratic agencies. As mentioned above, centralization can be hugely influential in determining an agency’s agenda, which in turn affects the data a bureaucracy is able to produce. A more centralized organization is likely to have control over data at a finer level of detail, meaning it may be able to include more data in its reporting to the legislature. Such data comes in various forms, from narratives with data mixed in sporadically to graphics and tables exclusively focused on quantitative data. 3 Centralized organizations are likely to maintain larger amounts of data in one location than decentralized organizations, meaning they are likely to be better able to marshal the information needed to make a convincing point. Additionally, centralization may itself lend credibility to the argument, as a single agency serving as the voice of higher education may seem more convincing to legislators than a chorus of institutions with nuanced perspectives. As a result, I hypothesize agencies with a higher degree of centralization—in this case, consolidated governing boards—will have greater impacts on legislative agendas and outputs.
Research Design
To test these hypotheses, I rely on a comparative case study approach focusing on higher education policy in two states. The dataset combines information provided by the bureaucracy with legislative bills introduced in both states, which is analyzed using a series of intervening variable regression models to assess the impact data has on the legislative agenda and its outputs.
Case Selection
Higher education policy was chosen as the substantive focus of this analysis for two key reasons. First, it is a highly significant policy area which is often discussed in state legislatures. Although the focus has increasingly turned to cutting higher education budgets and requiring greater accountability of colleges and universities in recent years, state legislatures regularly discuss and make policy regarding higher education issues. Furthermore, this policy area is tied to larger discussions of state budgets and economies through its role in producing a qualified workforce and enabling economic growth. As a result, higher education is often part of the political agenda, ensuring there is sufficient information on which to base the analysis.
Secondly, and more significantly for the present article, education is a key area for “evidence-based policymaking.” At both the K-12 and postsecondary levels, education policy is routinely called on to become more informed by data (Amann, 2000; Mandinach, 2012; Ness, 2010). In fact, under the American Recovery and Reinvestment Act of 2009, funds were specifically set aside for the creation of robust data systems (“The American Recovery and Reinvestment Act of ”, 2009). This legislation strongly encouraged state systems of higher education, headed by SHEEOs, to begin collecting data to improve policy choices and outcomes for students. Accordingly, bureaucratic reporting on these issues in the years since is likely to contain significant amounts of data which state legislators may use to support their policy positions.
The two cases included in the analysis are Kansas and Illinois. They were chosen based on the structure of their SHEEO organizations, as they present a comparison of the two major structural classifications—a consolidated governing board (Kansas) and a coordinating board (Illinois). Each of these states can be viewed as an ideal type of the structure it embodies and are thus representative of other SHEEO agencies of the same structure. This distinction is especially useful in demonstrating the different ways in which bureaucratic agencies use data to support arguments to legislatures.
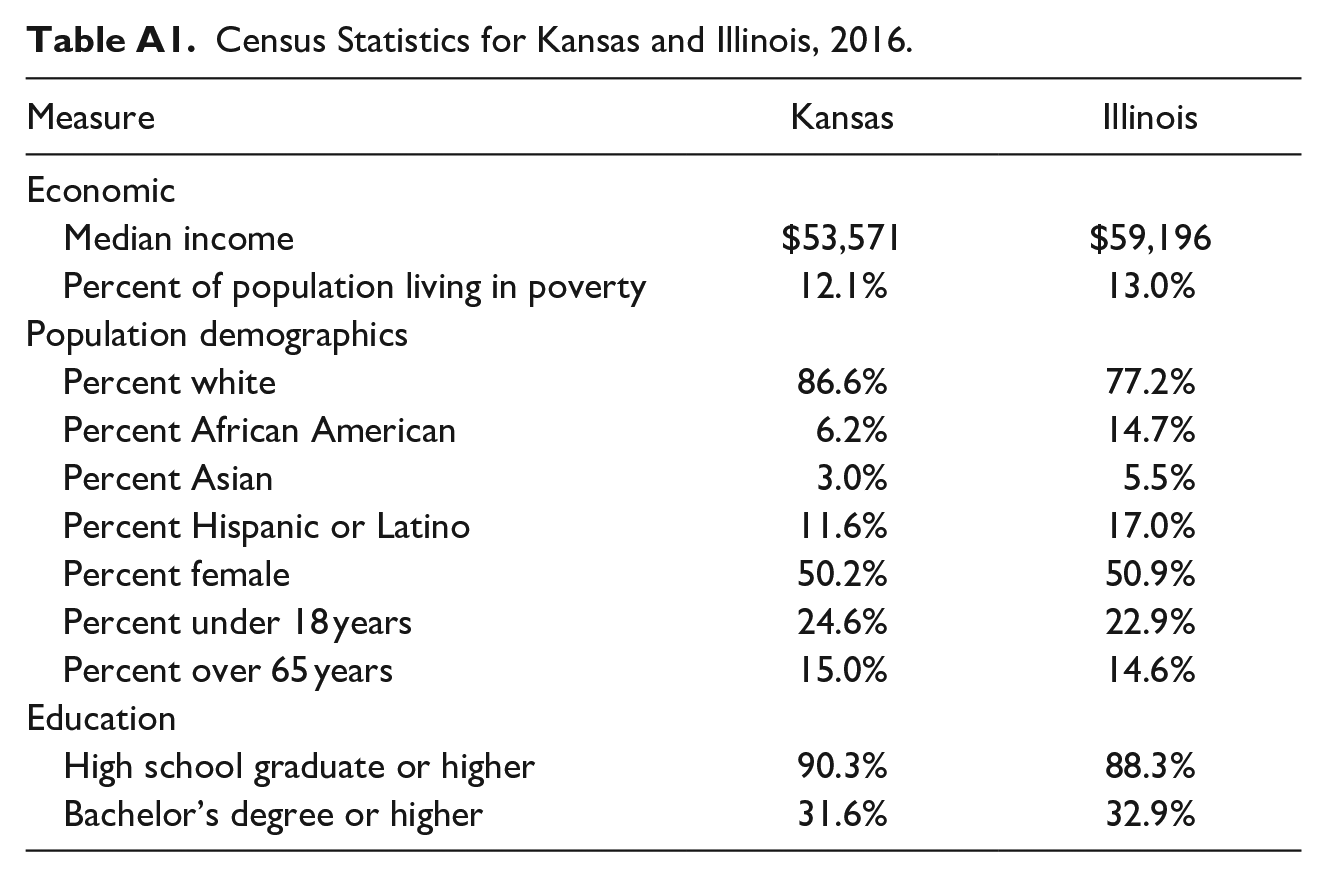
In other ways, the states are relatively comparable. Aside from Chicago, both states are largely rural and agricultural. They are both located in the Midwestern part of the country, with similar median income and poverty rates. In terms of populations, Kansas and Illinois are mirrors of each other, with similar proportions of various categories of age, gender, and race. 4 Most interestingly, the percentage of the population aged 25 or older holding at least a bachelor’s degree is almost identical in the two states (31.6% in Kansas and 32.9% in Illinois), which suggests higher education as a whole has similar reach in both states.
The state legislatures, however, differ in one important respect: legislative professionalism. Based on the traditional measures of legislative professionalism—compensation, staff availability, and days in session (Squire, 2007, 2017)—the Illinois General Assembly operates at a higher level of professionalism than the Kansas State Legislature. According to the 2015 Squire Index, Illinois ranked 9th among the 50 states and Kansas ranked 31st (Squire, 2017). This distinction suggests that the Kansas legislature may be more reliant on data and information provided by bureaucratic sources, as they have fewer staff resources to devote to independent policy research and may experience greater uncertainty as a result. Such uncertainty has been shown to increase legislative reliance on bureaucratic information in other settings (Gailmard & Patty, 2013; Workman et al., 2017), implying that higher education policy will be similarly affected. The less professional legislature in this analysis is also paired with a more centralized bureaucratic structure, lending further support to the expectations presented in Hypothesis 2.
Data and Measures
The data for this article are drawn from two main sources for each state included in the analysis. The first source of data is the annual reports of the bureaucratic agencies, which relay information about the activity of the organization and discuss goals for the state’s higher education sector over the coming years. The reports from these agencies are major sources of signaling to the state legislature about higher education as well as a primary method of accountability for the agencies themselves. These reports are by no means the only source of communication between the bureaucracy and the legislature related to higher education, as SHEEOs often engage in less formal activities such as attending hearings and maintaining working relationships with individual legislators. However, agency annual reports offer greater breadth than other communications, as they cover most topics of importance to the agency’s operations. More significantly for the question investigated here, these reports are also the primary method of providing bureaucratic data to the legislature about the condition of higher education in the state. This feature is what makes the annual reports the ideal document to analyze in the models to follow.
The dataset includes information from five annual reports of the Illinois Board of Higher Education (2012–2016) and six annual reports from the Kansas Board of Regents (2012–2017). These samples include all reports which were publicly available at the time of data collection. Though the number of reports is small, each was broken down and coded at the paragraph level, resulting in 1,424 units of observation comprising the bureaucratic agenda in the two states over roughly the same period. 5 These paragraphs were coded into 30 substantive topics using previously developed methods (Bark, 2021). The topic coding scheme was based on the topics appearing repeatedly in the tables of contents of a sample of SHEEO reports from several states and substantive expertise in higher education policy. A detailed description of the procedures used to develop the topical coding scheme is available in Appendix B along with descriptive statistics regarding each topic (Table A2) and selected examples (Table A4).
Each paragraph was also coded based on the amount of data it contained on a five-point ordinal scale ranging from 0 (no data, entirely narrative) to 4 (entirely data, no narrative). If a paragraph contained some data, but it made up less than half of the text, the paragraph was coded 1 (primarily narrative, interspersed with data). If the paragraph was predominantly characterized by data briefly supplemented by narrative, it was coded 3 (primarily data, includes brief narrative). The middle category was reserved for those paragraphs which were approximately evenly split between data and narrative. Once all paragraphs were coded, the data was aggregated by topic. For each topic in each year, I measure the mean amount of data used per paragraph to determine which topics are supported by the most quantitative information. A higher value on this variable indicates paragraphs on a topic contain higher amounts of data on average, such as the affordability topic in 2016, which had a mean data usage of 2.667 in Kansas. On the other hand, a mean near zero—such as the goals and master plans topic in Illinois in 2012, which had a mean of just 0.067—indicates few paragraphs on the topic were supported by quantitative data. The mean amount of data per topic is used as the primary independent variable in the models to follow. Descriptive statistics for this measure and variables discussed below are available in Tables 1 and 2.
Descriptive Statistics—Kansas Data.
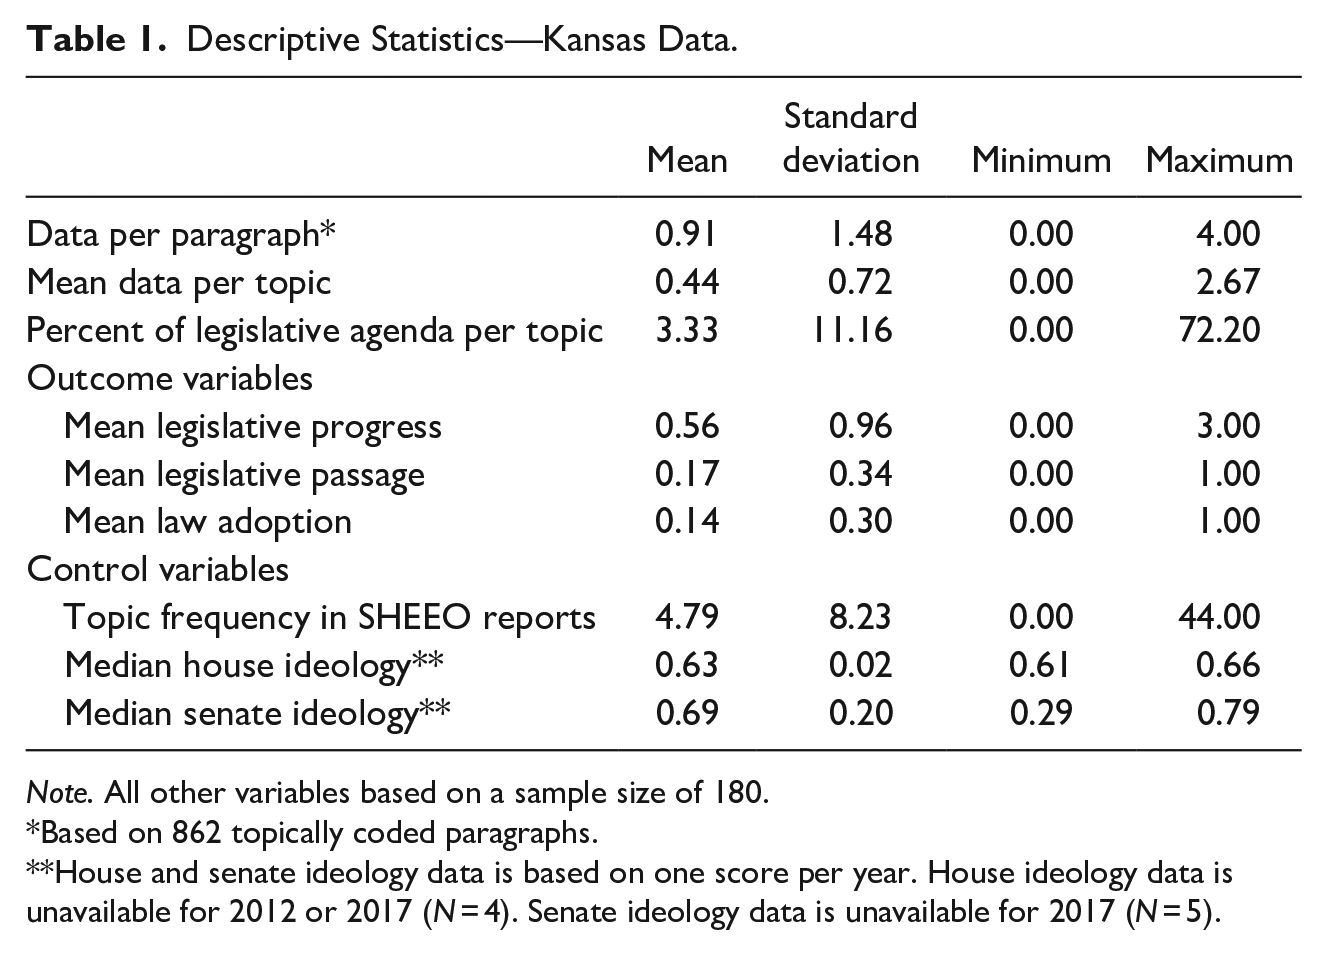
Note. All other variables based on a sample size of 180.
Based on 862 topically coded paragraphs.
House and senate ideology data is based on one score per year. House ideology data is unavailable for 2012 or 2017 (N = 4). Senate ideology data is unavailable for 2017 (N = 5).
Descriptive Statistics—Illinois Data.
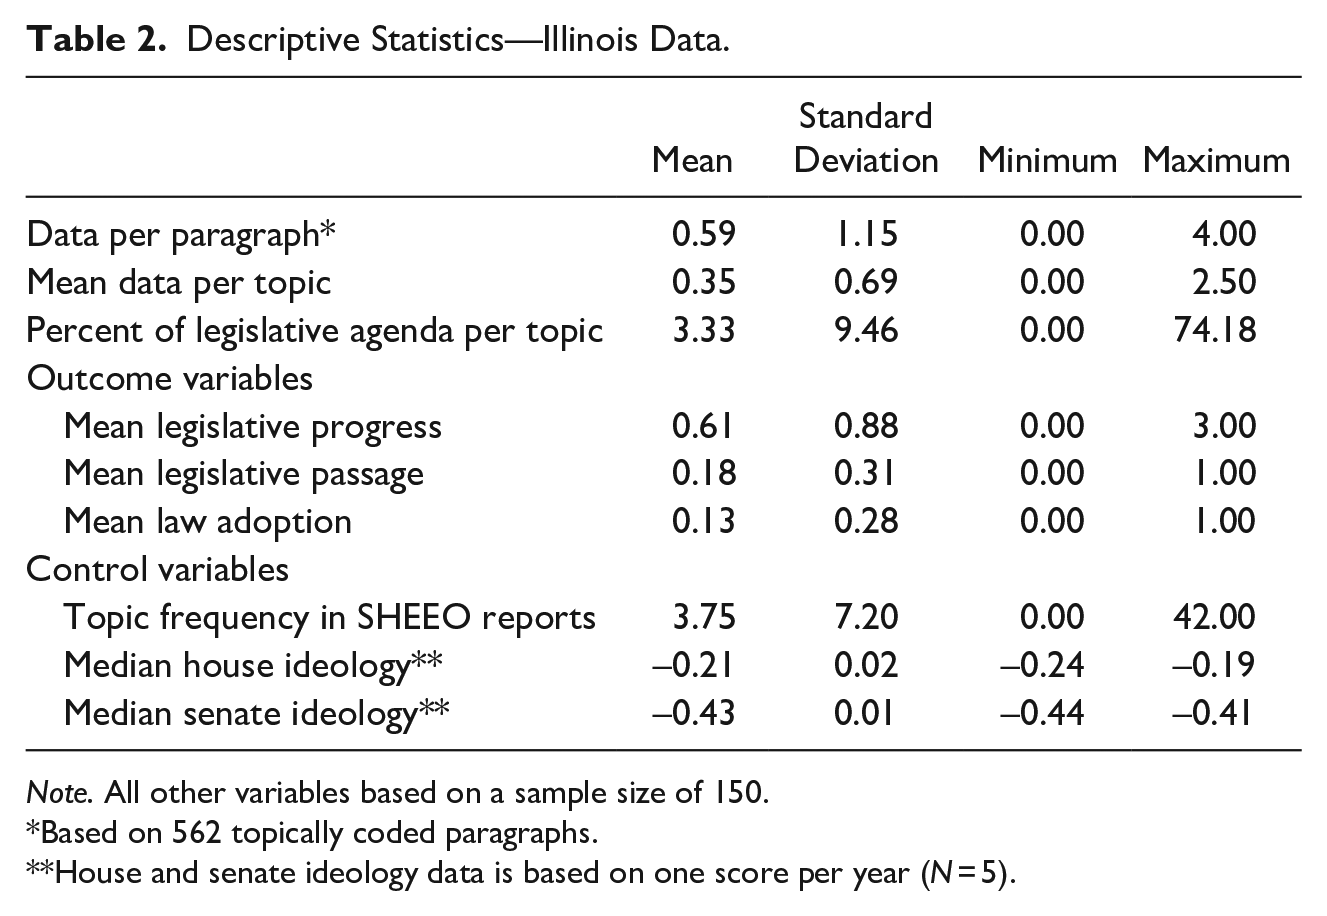
Note. All other variables based on a sample size of 150.
Based on 562 topically coded paragraphs.
House and senate ideology data is based on one score per year (N = 5).
The second major source of data for the analysis is the text of bills introduced into the legislatures of each state. Using introduced rather than passed legislation ensures all considerations of higher education are captured, rather than just those which are able to successfully navigate the policy process. Furthermore, introduced legislation often serves as an early signal of emergent policy issues which have not yet garnered enough support to become law (Hillman et al., 2015, p. 26). These are precisely the types of issues which are most likely to be buoyed by quantitative evidence, making the choice of introduced legislation ideal for the present analysis. The text of each bill was coded in the same way as the information from the SHEEO reports—at the paragraph level by substantive topic within higher education, resulting in 7,857 substantively-coded observations from the legislative data. The coding scheme used for both types of data was identical in order to maintain their direct comparability. The legislative portion of the dataset formed the basis for both the mediating and dependent variables in the models presented later. The mediating variable is simply the percentage of the legislative agenda devoted to a given topic, calculated separately for each state in each year of the dataset.
The dependent variables focus on legislative outputs, measured in three ways. Each of these variables was constructed based on an ordinal scale with the following points: 0—Introduced and Referred to Committee, 1—Committee Hearing Conducted/Recommended for Passage by Committee, 2—Passage by one or both Legislative Chambers, and 3—Signed into Law by Governor. The first dependent variable used, legislative progress, is the average progress through the legislature of bills on a given topic. This variable uses the mean progress for bills on a given topic in each year to measure how far bills are moving in the legislative process. The remaining two dependent variables assessed are based on dichotomized versions of the ordinal scale described above. The first, termed the passage rate, is the percentage of bills which passed at least one chamber of the state legislature (coded as either a 2 or 3 on the original scale). The final dependent variable is the percentage of bills on a topic which were eventually signed into law by the governor (coded 3 on the original scale). For example, a bill which passed one or both legislative chambers but was not signed into law would be coded a 2 for legislative progress, a 1 for legislative passage, and a 0 for law adoption. A visual demonstration of the coding of these variables is available in Table A5 in Appendix B.
In the analysis to follow, each of the variables of interest was coded at the paragraph level and then aggregated by substantive topic code. Thus, the unit of analysis is a topic in a given year, calculated separately for each of the two states. In practice, this means the independent variable and each of the dependent variables is an average of the applicable paragraphs within a substantive topic code. Logically speaking, to the extent that a topic in the SHEEO reports contains quantitative data, bills containing that topic will be more likely to pass through the legislature, even if it is not the only topic the bill contains. Because the data structure is based on paragraphs for all variables, the proportions of a multi-topic bill coded into each substantive topic will be accounted for in the model, as each paragraph has been included based on its substantive topic code (rather than an overall measure for each bill introduced). For detailed examples demonstrating how the coding scheme is applied to a bill containing multiple topics, see Appendix B.
In addition to the primary variables discussed above, the models include three control variables to minimize the risk of spuriousness. I first control for the frequency of appearance of each topic in the SHEEO agency’s annual report. This helps to ensure any observed effects are not driven by topics which are mentioned disproportionately often in the reports. Secondly, a control is included for the ideology of both state legislative chambers in each year to protect against partisan differences driving the results (Jennings, 2019). These variables are drawn from the spatial models developed by Shor and McCarty (2011) and obtained from the Correlates of State Policy Project (Jordan & Grossman, 2020). The scores are similar to the DW-NOMINATE scores produced at the national level, ranging from −1 to +1 such that a negative score indicates a more liberal legislature and a positive score indicates a more conservative legislature. The scores used here are the median ideology of each chamber of a state’s legislature in a given year.
Methods
In order to answer the research questions, I rely on a series of intervening variable models (Hayes, 2009; MacKinnon et al., 2007; Shrout & Bolger, 2002). Specifically, I utilize path analysis-based mediation using the Hayes PROCESS macro (Hayes, 2013; model 4). In these models, a path analysis assesses relationships between all of the included variables rather than just the impact of the independent variable(s) on a dependent variable. Each model in the analysis contains one independent variable (X), one dependent variable (Y), and one intervening variable connecting them (M). With these parameters, the Hayes model produces regression estimates for four effects: the direct relationships between X and Y, X and M, and M and Y; and the indirect relationship between X and Y flowing through M (based on 5,000 bootstrapped samples). The structure of these models is shown in Figure 1, with the solid arrows representing the direct relationships being tested and the dashed arrow signifying the indirect relationship. This approach allows for testing both whether the additional data increases the likelihood of an issue becoming part of the legislative agenda and whether issues with more quantitative support from the bureaucracy are more likely to survive the legislative process and become law. Moreover, an intervening variable model allows for the inclusion of a mediation effect to assess any indirect relationships between the dependent and independent variables while controlling for the middle stage, in this case the legislative agenda.
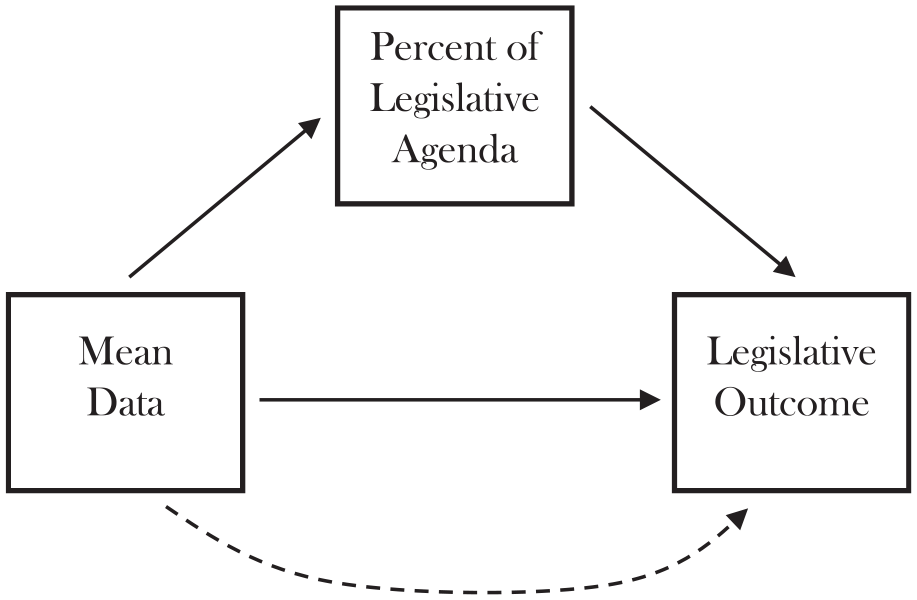
Intervening variables model structure using path analysis mediation.
The primary independent variable in each of these models is the mean amount of data per topic paragraph, using topic-years as the unit of analysis. The dependent variables in the final stage are measures of the average progress of bills on a given topic. Legislative progress is assessed in terms of each of the three variables discussed in the previous section—mean progress, legislative passage, and law adoption. The percentage of the legislative higher education agenda devoted to a specific topic is used as the intervening variable in each model, facilitating a determination of whether the relationship between the independent and dependent variables can be partially or entirely explained by the legislative agenda. Each of these variables is measured for each topic in each year of data, resulting in 30 observations per state for each year. Finally, I include the three control variables—total frequency of appearance for each topic in the bureaucratic annual reports, median state house ideology, and median state senate ideology—in each model to minimize the risk of spuriousness between the variables.
Findings and Discussion
To assess the hypotheses presented above, I conducted separate analyses for the two states. This enabled an examination of whether bureaucratic data can be influential in the legislative process in general (Hypothesis 1) while simultaneously evaluating whether the centralization of the agency impacts its ability to use data effectively (Hypothesis 2). Both sets of analyses utilized the same path analysis mediation models, with independent models being run for each of the dependent variable measures.
The results from the models using data from Kansas are shown in Table 3. The first stage of all three models is identical, using the mean data per topic paragraph to predict the proportion of the legislative agenda that will be devoted to the topic. On its own, the first stage of these models is a simple OLS regression. The only significant predictor at this stage of the Kansas models is the mean amount of data, showing an increase in the amount of data provided on a given topic helps to increase its share of the higher education agenda.
Full Results of Multi-Stage Intervening Variable Models—Kansas.
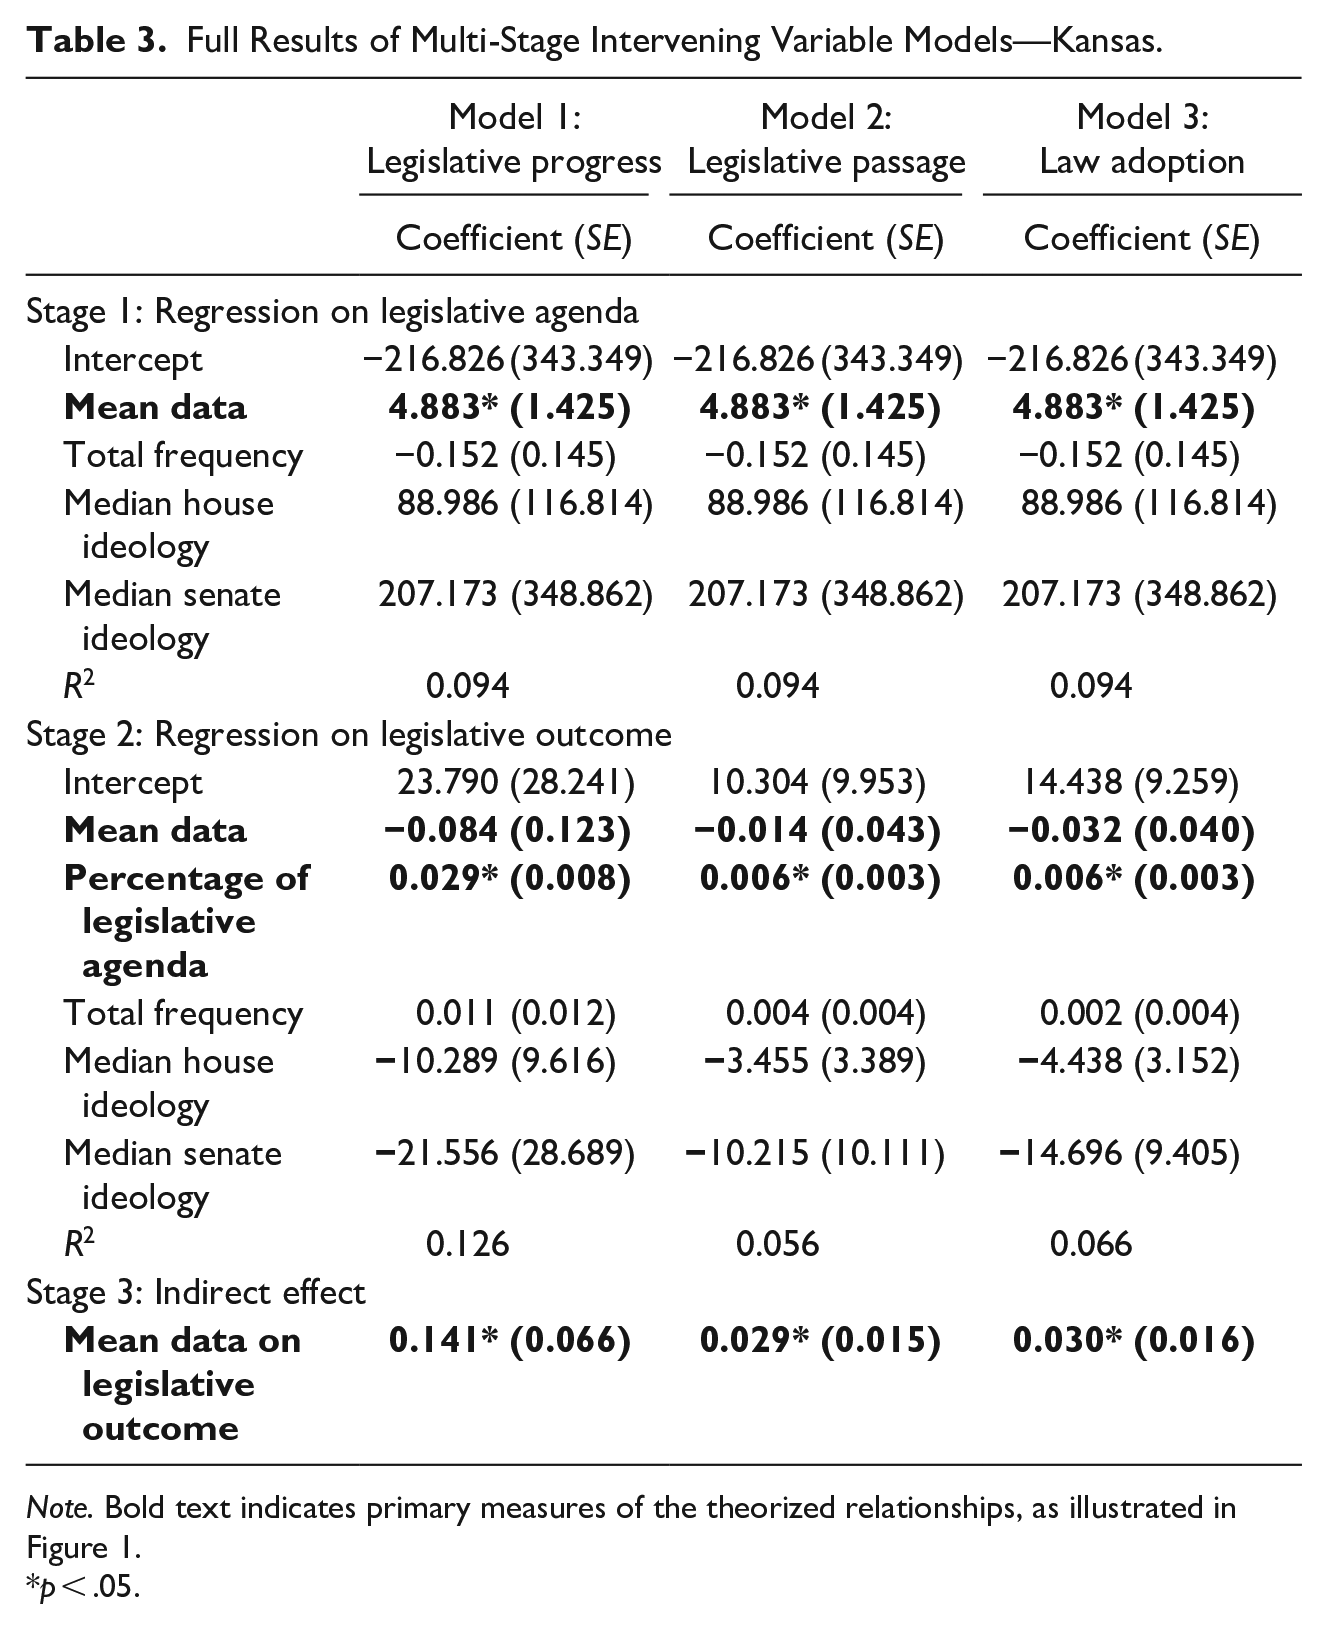
Note. Bold text indicates primary measures of the theorized relationships, as illustrated in Figure 1.
p < .05.
The second stage of the models is similar, in that it is essentially a simple OLS regression model when considered in isolation. In this stage, the percentage of the legislative agenda devoted to a given topic is incorporated as an independent variable predicting the legislative outcome variables. Model 1 uses legislative progress as the outcome variable, which ranges from 0 to 3. Models 2 and 3 have dichotomous outcome variables measuring whether a bill passed at least one chamber of the legislature and was passed into law, respectively. All three models returned a statistically significant result for the percentage of the legislative agenda devoted to a topic, showing that an increased share of the legislative agenda results in a higher likelihood that bills related to the topic will progress through the legislative process. However, mean data provision was not significant at this stage, indicating it cannot directly predict the legislative success of bills on a given topic.
The final stage of the Kansas models takes a deeper look at the relationship between these variables by testing the indirect link between them. This stage assesses the impact of mean data on each of the three legislative outcomes, mediated by the proportion of the legislative agenda focused on the topic. A significant result for this relationship indicates that an increase in the amount of data regarding a topic in the bureaucratic reports does improve the eventual likelihood of bill passage when conditioned on the mediating variable, even though a direct effect could not be observed in stage two. This relationship was positive and significant across all three models, demonstrating that an increase in data indeed improves the likelihood of legislative progress, regardless of how the dependent variable was measured.
These findings suggest the amount of data present in a bureaucratic report can indeed affect the legislative agenda related to higher education policy. The topics on which the bureaucracy provides more data are not only more likely to gain the attention of legislators through bill introductions in the Kansas legislature, but are also more likely to be supported throughout the legislative process. Thus, the results from the Kansas data are supportive of Hypothesis 1. This result suggests there may be legislators in Kansas willing to utilize the central route of information processing defined in the ELM to assess the data presented by the bureaucracy. To the extent this is the case, such highly motivated legislators would have a greater likelihood of introducing and shepherding bills through the legislative process and of creating symbolic narratives to persuade colleagues to support the policy change. Although the models here cannot confirm whether this is indeed the mechanism being carried out, they do show the increase in data is significantly related to a bill’s likelihood of adoption by the legislature at large.
The data from Illinois did not return such a clear picture, as shown in Table 4. The same three models were performed using data from the Illinois SHEEO and state legislature, but with no statistically significant results for the variables of interest. In stage one of the models, the only statistically significant predictor of a topic’s appearance on the legislative agenda is shown to be how frequently it is discussed in bureaucratic reports, with a higher number of paragraphs associated with a greater likelihood of appearance on the legislative agenda. The amount of data contained in these paragraphs, however, falls well short of significance in predicting legislative discussion of a topic.
Full Results of Multi-Stage Intervening Variable Models—Illinois.
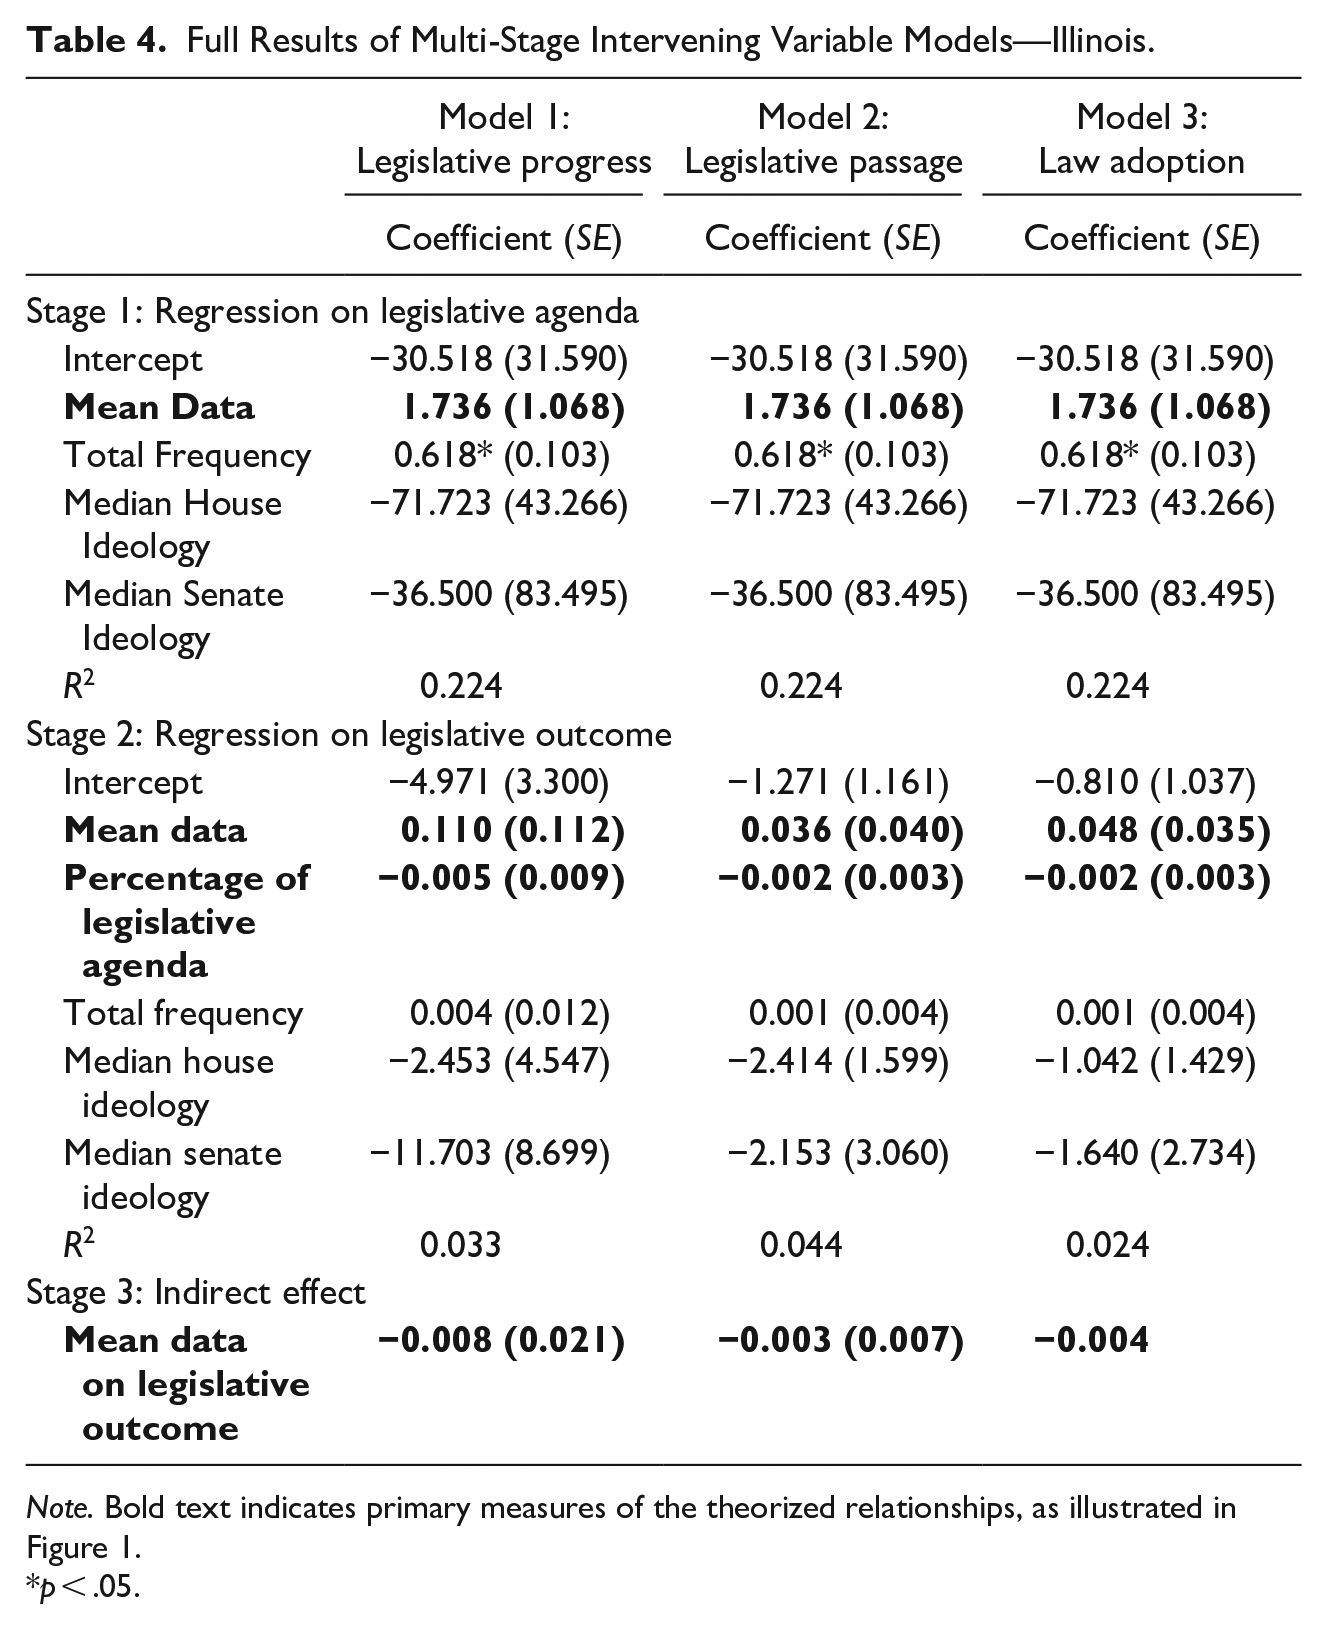
Note. Bold text indicates primary measures of the theorized relationships, as illustrated in Figure 1.
p < .05.
The findings from stage two of the models are similarly nonpredictive across all three models, with none of the variables of interest or control variables returning a statistically significant result. This finding suggests that even the proportion of the legislative agenda devoted to a topic cannot predict which legislation is likely to become law in Illinois. Finally, the third stage of the Illinois models indicate there is no indirect relationship to account for, showing that the amount of data provided on a topic remains nonpredictive even when conditioned on the proportion of the legislative agenda devoted to a topic. The lack of significance among key variables suggests that data is not as influential in shifting the attention of the Illinois General Assembly as it is in the Kansas State Legislature, indicating the results for Hypothesis 1 are mixed at best.
There are several potential causes of this result. The first is that the coordinating board structure used in Illinois limits the ability of the agency to produce relevant and timely data. As a result, legislators may be less likely to find the data produced by the agency useful in policy conversations. This explanation also has implications for Hypothesis 2, and is revisited below. The second potential reason for this finding is that the majority of legislators in Illinois use the peripheral route of information processing related to higher education, leaving no one to do the work of assessing data in an instrumental sense. Though not tested directly here, this seems to be the least likely explanation, as there are 60 public institutions of higher education throughout the state in addition to a strong presence of private-sector institutions (Illinois Board of Higher Education, 2020). Accordingly, a large percentage of legislators have at least some level of vested interest in higher education policy as it relates to their district, which would arguably lead some of them to utilize the central route of the ELM.
The final potential cause of bureaucratic data having minimal influence on the Illinois legislature is the professionalization of the organization. As expected, the more professional legislature appears much less likely to depend on information provision by the bureaucracy in determining its agenda related to higher education. This is likely due to the fact that more professional legislatures often have greater staff resources which are able to provide them with alternative sources of information. In this case, the bureaucracy may be competing for influence in terms of which information is used by legislators, thereby limiting the independent impact of SHEEO agencies. Though this is an interesting rationale for the findings based on the Illinois agenda, testing it thoroughly is beyond the scope of the data used in this article and must be left to future research.
In relation to Hypothesis 2, the findings from both states are supportive. The centralized governing board in Kansas is better able to utilize data to increase its influence in the state legislature than is the coordinating board structure used in Illinois. This is likely related to the fact that the Kansas SHEEO is able to provide more data on average than its Illinois counterpart (means of 0.91 and 0.59 per paragraph, respectively). The governing board in Kansas utilizes a hands-on approach in collecting and reporting data from various campuses and presenting it to the legislature with a single voice. This, paired with the legislature’s inability to produce its own information, may enable legislators to utilize bureaucratic data in support of specific policies related to higher education by engaging in the central pathway for information processing and using the data in a symbolic sense to craft supportive narratives. Conversely, the decentralized nature of the coordinating board in Illinois seems to limit the amount of data available for inclusion in the agency’s annual report. This constraint suggests the agency may be less able to produce data that legislators are apt to find useful, as mentioned in the discussion related to Hypothesis 1. As a result, Illinois legislators have less of an opportunity to use bureaucratic data as a basis for their policy positions and their attempted persuasions of colleagues, potentially leading them to rely on other sources of information. In turn, these limitations help to explain the smaller observed impact from the SHEEO than we see in Kansas.
Overall, the results demonstrate that the inclusion of data in bureaucratic reports can have tangible impacts on an agency’s ability to influence the legislative agenda and resulting policies. However, this impact was not uniform across the two types of agencies examined. In Kansas, all three models showed positive and statistically significant effects across the board, indicating that topics utilizing more data in bureaucratic reports are more influential in the state legislature. In Illinois, the data produced by the SHEEO did not have any significant impact on the legislative agenda or its outputs. Based on these results, it appears the centralized governing board was able to marshal data effectively to have a tangible impact on legislative outputs, whereas the decentralization of the coordinating board left it unable to provide enough data relevant to legislative discussions. This likely prevented use of the data in either an instrumental or symbolic fashion and thus left the SHEEO with little to no influence on legislative outputs in Illinois.
Implications and Conclusion
Over the past decade, government entities have increasingly turned to data for making policy decisions. This is especially true in bureaucratic settings, where agencies are often expected or required to provide accountability data about their activities to political overseers and/or the general public. This paper began to consider the impact of such data on the ability of these agencies to influence the legislative agenda using a comparative case study approach substantively focused on higher education policy.
Specifically, the analysis focused on whether data led to increased influence on the legislative agenda or an increase in the likelihood of bill passage on related topics and whether the structure of the agency affected its ability to have this type of influence. The findings on the former question were mixed, showing an impact by the Kansas Board of Regents but not the Illinois Board of Higher Education. This suggests that the amount of data provided by a bureaucratic agency can be effective in the policy process, but this is not always the case in practice. Instead, the relationship proposed in Hypothesis 2 appeared to be more accurate; the amount of data provided by an agency interacts with its degree of centralization to determine the influence an agency will have on the legislative agenda and its outputs.
Operating within a centralized structure ensures a large amount of data is gathered in a single location, meaning it is readily available for inclusion in bureaucratic reports sent to the legislature. As a result, the agency is able to provide more data on more topics using a single voice and is likely to have a stronger impact on legislative decision making. A decentralized structure, however, limits the amount of data available when compiling the agency’s annual report. In doing so, it also reduces the quantitative support for arguments being made, which may cause the arguments to appear less convincing (or less useful for narrative creation) to legislators and therefore have less influence in shaping the agenda.
These findings have important implications for both scholars and practitioners. From an academic perspective, this article helps to provide a missing link between bureaucracies as providers of information and the impact of that information on the legislative policy process. Indeed, this need was explicitly expressed by Erik Ness, who called for the expansion of studies related to the effect of higher education governance structure on public policy to consider “how effectively these agencies provide information during the policy process” (Ness, 2010, p. 40). This study has shown the provision of data in reports submitted to the legislature is part of this process, and can have tangible impacts on the legislative outcomes. It has also revealed the production of data as one of the ways centralization can influence the policy impacts of a bureaucratic agency by enhancing or limiting its capacity to produce quantitative information, thereby building on a long line of research into bureaucratic structure.
For practitioners in the bureaucracy, the implications are clear: providing more data to support arguments made to the legislature can both increase legislative attention to a topic as well as increase its chance of surviving the legislative process to become law, as seen from the Kansas SHEEO reports. Though the models could not demonstrate the mechanism through which this occurs, the ELM suggests such data provision may help to convince legislators on the central pathway of persuasion of a topic’s merits and allow them to utilize the information in more symbolic ways to motivate colleagues to support a policy proposal. Accordingly, bureaucrats—especially those in agencies with centralized structures and large caches of available data—may benefit from the incorporation of additional quantitative support into annual reports and other communications to legislators to increase their influence on relevant policies.
Despite the contributions of the present research, there remain a few limitations that leave unanswered questions. The first is that it includes only two states from which to draw conclusions. No two states are perfectly comparable, and—though they are relatively similar on a wide array of factors—the states used here are no exception. Accordingly, the possibility exists that the findings relate to idiosyncrasies of the chosen states rather than solely the centralization of a state’s higher education agency. The second limitation of this article is the issue of competing sources of information provided to state legislators. This may be especially impactful for the results of the Illinois models, where the more professional legislature has access to internal research in addition to information provided by the bureaucracy. Due to the structure of the data used in this project, I am unable to test for comparative influence on legislative agendas. Relatedly, the present models do not directly account for legislative professionalism, which remains as a potential alternative explanation of the results. Though there are theoretical reasons to believe bureaucratic centralization would continue to matter for data production and legislative influence, the results are limited by the inability to control for this factor.
As a consequence, part of the explanation for the lack of statistical significance in the Illinois model could include legislative professionalism or the influence of other actors that have not been accounted for. The investigation of additional sources of information provided to the legislature is a clear avenue for future research into agenda setting in state politics. Such data could be easily incorporated into the present dataset due to the nature of the coding scheme used. Further benefit could be obtained through the use of automated coding methods, such as those used by Dwidar (2021) and Loftis and Mortensen (2020), to enable efficient collection of the large amounts of data required to expand upon this work. Conducting this research would build on the present analysis by further refining our understanding of the bureaucracy’s role in setting the legislative agenda as well as the challenges it faces in doing so.
Footnotes
Appendix A: Supplementary Table
Census Statistics for Kansas and Illinois, 2016.
| Measure | Kansas | Illinois |
|---|---|---|
| Economic | ||
| Median income | $53,571 | $59,196 |
| Percent of population living in poverty | 12.1% | 13.0% |
| Population demographics | ||
| Percent white | 86.6% | 77.2% |
| Percent African American | 6.2% | 14.7% |
| Percent Asian | 3.0% | 5.5% |
| Percent Hispanic or Latino | 11.6% | 17.0% |
| Percent female | 50.2% | 50.9% |
| Percent under 18 years | 24.6% | 22.9% |
| Percent over 65 years | 15.0% | 14.6% |
| Education | ||
| High school graduate or higher | 90.3% | 88.3% |
| Bachelor’s degree or higher | 31.6% | 32.9% |
Appendix B: Methodological Appendix
Declaration of Conflicting Interests
The author declared no potential conflicts of interest with respect to the research, authorship, and/or publication of this article.
Funding
The author received no financial support for the research, authorship, and/or publication of this article.