
Abstract
A number of psychological theories suggest that increased economic inequality may lead to greater social class stereotyping. However, all existing evidence for this claim is correlational. Across three experiments (one exploratory and two confirmatory, N = 2,286), we observed that exposure to socially signaled inequality—operationalized in terms of variation in perceived incomes among groups of target individuals—amplified the endorsement of one key social class stereotype: the perception that higher income individuals are more competent. When judged amid greater inequality, the same high-income targets were perceived as more competent and the same low-income targets were perceived as less competent, compared with when judged amid greater equality. By contrast, we found no consistent effect of exposure to inequality on stereotypes regarding warmth and relatively weak class-based stereotyping on the warmth dimension in general. We discuss implications of these findings for theories regarding the effects of economic inequality.
With income inequality rising to historic levels (Piketty et al., 2017), the consequences of inequality have become an increasing concern for psychologists. Most studies in this area have focused on identifying psychological correlates of inequality, but correlational evidence begs the question of causality and, as a result, researchers have begun exploring experimental methods to study inequality’s effects (e.g., Côté et al., 2015; Hackel & Zaki, 2018; Nishi et al., 2015; Payne et al., 2017). The present research builds on these findings by employing experimental methods to investigate the hypothesis that economic inequality increases social class-based stereotyping. To this end, we developed and validated a novel method for manipulating exposure to economic inequality. Unlike past manipulations that have induced direct awareness of economic inequality (Côté et al., 2015) or created microscale resource inequalities between participants (e.g., Hackel & Zaki, 2018; Payne et al., 2017), our method attempts to capture one aspect of the lived experience of inequality by systematically manipulating exposure to relatively equal versus unequal social groups. Through this procedure, we demonstrate the first causal evidence that exposure to socially signaled inequality amplifies one major social class stereotype: the association between the perceived socioeconomic status (SES) of visual targets and their perceived competence.
The Competent Rich and Warm Middle Class
Social class stereotypes abound in social perception and the culture at large, and occur for both the warmth and competence dimensions, which are theorized within the stereotype content model (Fiske et al., 2002) to be the two dominant domains of human stereotyping (Fiske, 2010). Of the dimensions, the most robust social class stereotype is a positive association between class and competence. The perception that individuals of higher social class are competent appears as early as elementary school (Woods et al., 2005), has been shown to be very difficult to suppress even through incentives (Oh et al., 2019), and has been observed across different samples, measures, and cultures (Caprariello et al., 2009; Cuddy et al., 2009; Durante et al., 2013; Lott, 2002). Illustratively, Durante and colleagues analyzed data from 25 different European, American, Asian, and African countries, and found that high-status groups (e.g., “the rich,” “white collar workers”) were consistently rated as more competent than low-status groups (e.g., “the poor,” “the unemployed”).
Social class also impacts stereotyping on the dimension of warmth, although this association appears more complex, and at present is less clear. A number of studies find that the rich are perceived to be low in warmth (e.g., Christopher & Jones, 2004; Christopher & Schlenker, 2000). Yet, there is also evidence that the poor are perceived to be low in warmth (Cuddy et al., 2009; Fiske et al., 2002). This suggests a more complex “inverted U”-shaped relationship between social class and perceived warmth, with the middle class considered warmest and the rich and poor stereotyped as less warm.
Inequality and Social Class Stereotyping
A number of theoretical perspectives suggest that exposure to economic inequality may amplify social class stereotypes. Kraus and colleagues (Kraus et al., 2017) have argued that social class stereotyping is in part a consequence of social class signaling—the way social class is communicated through speech, dress, preferences, and other social behaviors. When economic inequality is high, these authors suggest that such signaling becomes more prevalent and psychologically salient, thereby increasing social class stereotyping.
Another account of how inequality might influence social class stereotyping was proposed by Durante and colleagues (2013, 2017). Drawing on system justification theory (SJT; Kay et al., 2007), they proposed that social class stereotyping responds to changes in inequality chiefly because it functions to rationalize that inequality—if inequality increases, so too does the need to rationalize it through social class stereotyping. In addition, Durante and colleagues theorized that inequality produces ambivalent social class stereotyping. While the rich are perceived as more competent than the poor to justify each group’s relative wealth and status, the poor are perceived as warmer than the rich as a form of social compensation for their lower wealth and status. Consistent with this, Durante and colleagues observed nation-level income inequality to be linked to more ambivalent stereotyping of high- and low-class groups across 27 countries (Durante et al., 2013). In more unequal countries, high-status groups, including upper-class individuals, were perceived to be higher in competence but lower in warmth, whereas low-status groups, including lower-class individuals, were perceived to be lower in competence but higher in warmth. In another article, across 20 countries, participants in more unequal countries displayed a heightened tendency to perceive the rich not only as more competent than the poor, but also as less warm (Durante et al., 2017).
A final perspective suggesting links between inequality and social class stereotyping involves social comparison processes, whereby evaluations of stimuli depend upon relative comparisons (Festinger, 1954; Gerber et al., 2018). Such comparisons often lead to contrast effects, with stimuli judged as increasingly different from that with which they are compared (e.g., Higgins & Lurie, 1983; Manis & Armstrong, 1971). Thus, if individuals in a society display widely differing levels of social class, contrast effects could strengthen social class stereotypes by widening the perceived differences between those seen as high versus low in social class. Sometimes, however, assimilation effects have been observed, whereby stimuli are judged as increasingly similar to that with which they are compared (e.g., Jacowitz & Kahneman, 1995). To account for these varied effects, Mussweiler (2003) proposed the selective accessibility model (SAM), which posits that initial “holistic assessments” of the similarity between stimuli result in selective attention to differences or similarities, producing contrast or assimilation effects, respectively. This implies that whether low and high SES targets will be contrasted or assimilated with each other is a relatively open question and will depend upon initial assessments of their similarity/dissimilarity.
Testing the Effect of Socially Signaled Inequality on Social Class Stereotyping
Correlational evidence linking inequality to social class stereotyping must be interpreted with caution. Unbiased estimation of causal parameters from observational data requires assuming that there were no confounds unaccounted for and no reverse causality from outcomes to predictors (Pearl, 2009), and both of these issues are germane to the work of Durante and colleagues (2013, 2017). In terms of confounds, one potential common cause of inequality and social class stereotypes is the actions of the rich themselves. Some countries are likely more characterized by oligarchy and kleptocracy than others (Lambsdorff, 2001). Thus, countries high in such factors may become more economically unequal through the corrupt actions of the rich and citizens in such countries may also develop stronger stereotypes that the rich lack warmth. In terms of reverse causality, there are numerous pathways by which social class stereotypes might exacerbate inequality, such as by excluding the poor from educational opportunities (Batruch et al., 2017; Goudeau & Croizet, 2017) or the job market (Rivera & Tilcsik, 2016). It is therefore important to complement correlational evidence with experimental approaches.
To date, experiments manipulating inequality have taken two general forms. In one approach, participants are led to be aware (or not) of inequality, for example, through viewing charts ostensibly depicting the inequality of their home state (Côté et al., 2015). Alternatively, participants have played interactive games in which the distribution of players’ resources is manipulated (e.g., Hackel & Zaki, 2018; Nishi et al., 2015; Payne et al., 2017). Both approaches provide face-valid ways of affecting individuals’ direct awareness of inequality. However, both have limitations. For example, evidence suggests that most people are unaware of the extent of inequality within their societies (Norton & Ariely, 2011), so inducing explicit awareness of inequality may not directly map how inequality generally operates. Similarly, effects of brief, micro-level inequalities within economic games may also differ qualitatively from the effects of the more consequential and broad economic inequalities that characterize societies.
In light of these limitations, we developed a third approach to manipulating exposure to inequality. Numerous studies reveal that participants infer SES from others’ appearance (e.g., Becker et al., 2017; Gillath et al., 2012). Building on these findings, we reasoned that participants would not only perceive the relative social class of target individuals, but also the level of socioeconomic inequality among groups. Following Kraus and colleagues (2017), we reasoned that, in more unequal societies, individuals are likely to be exposed to greater socially signaled inequality. For example, in unequal San Francisco, which ranks high among U.S. cities on both homelessness (M. Henry et al., 2017) and millionaires per capita (Wealth-X, 2018), residents’ social environments are more likely to contain a combination of signals of extreme poverty and signals of extreme wealth. Granted, social class segregation may mean that relative increases in inequality do not always impact individuals’ exposure to socially signaled inequality (e.g., Reardon & Bischoff, 2011). However, our assumption is not that inequality is always associated with greater exposure to socially signaled inequality, only that it increases the likelihood of such exposure.
The Present Research
Taking this methodological approach, and guided by the stereotype content model, we conducted three experiments all using the same core procedure. In each, participants were exposed to groups of target individuals displaying varying levels of socially signaled inequality, and were asked to rate targets on perceived warmth and competence. This allowed us to investigate the effect of exposure to more or less unequal social groups on stereotypes of low-, middle-, and high-income targets. Each experiment tested confirmatory hypotheses preregistered on the Open Science Framework (OSF) and incorporated exploratory elements investigating further potential effects of exposure to inequality. 1
Development of Social-Signaling Materials
Photo Collection and Selection
We gathered hundreds of full-body photos of adult Americans, recruiting volunteers in public places and searching online. Due to their greater initial prevalence in our photos, we selected 149 images of White adults (66 females) and had each rated on perceived income and age by 61 U.S.-based adults (no other demographics were recorded) recruited through Amazon’s Mechanical Turk (MTurk). Male targets’ mean perceived incomes showed more variation than females’ (SDmale = US$27,032, SDfemale = US$12,689), so we focused on males to maximize perceived income inequality in our stimuli. Based on photos’ mean income and age ratings, we created four groups of targets, each containing 21 photos (see Figure 1). We called these groups “Unequal” (containing low-, middle-, and high-income targets), “Equal-Low,” “Equal-Middle,” and “Equal-High” (containing only low-, middle-, and high-income targets, respectively). Importantly, some targets were included in both the Unequal and each of the Equal groups, meaning these targets would be judged in both relatively unequal and equal groups. 2 Also important to note is that the unequal groups were not unequal to precisely the same extent. Based on each photo’s mean perceived incomes, we calculated Gini coefficients of each target group: Unequal = 0.29, Equal-Low = 0.09, Equal-Middle = 0.05, and Equal-High = 0.13. Each group of targets was approximately matched on average age. The photo collection protocol, as well as all studies presented below, was approved by our university’s Committee for the Protection of Human Subjects.
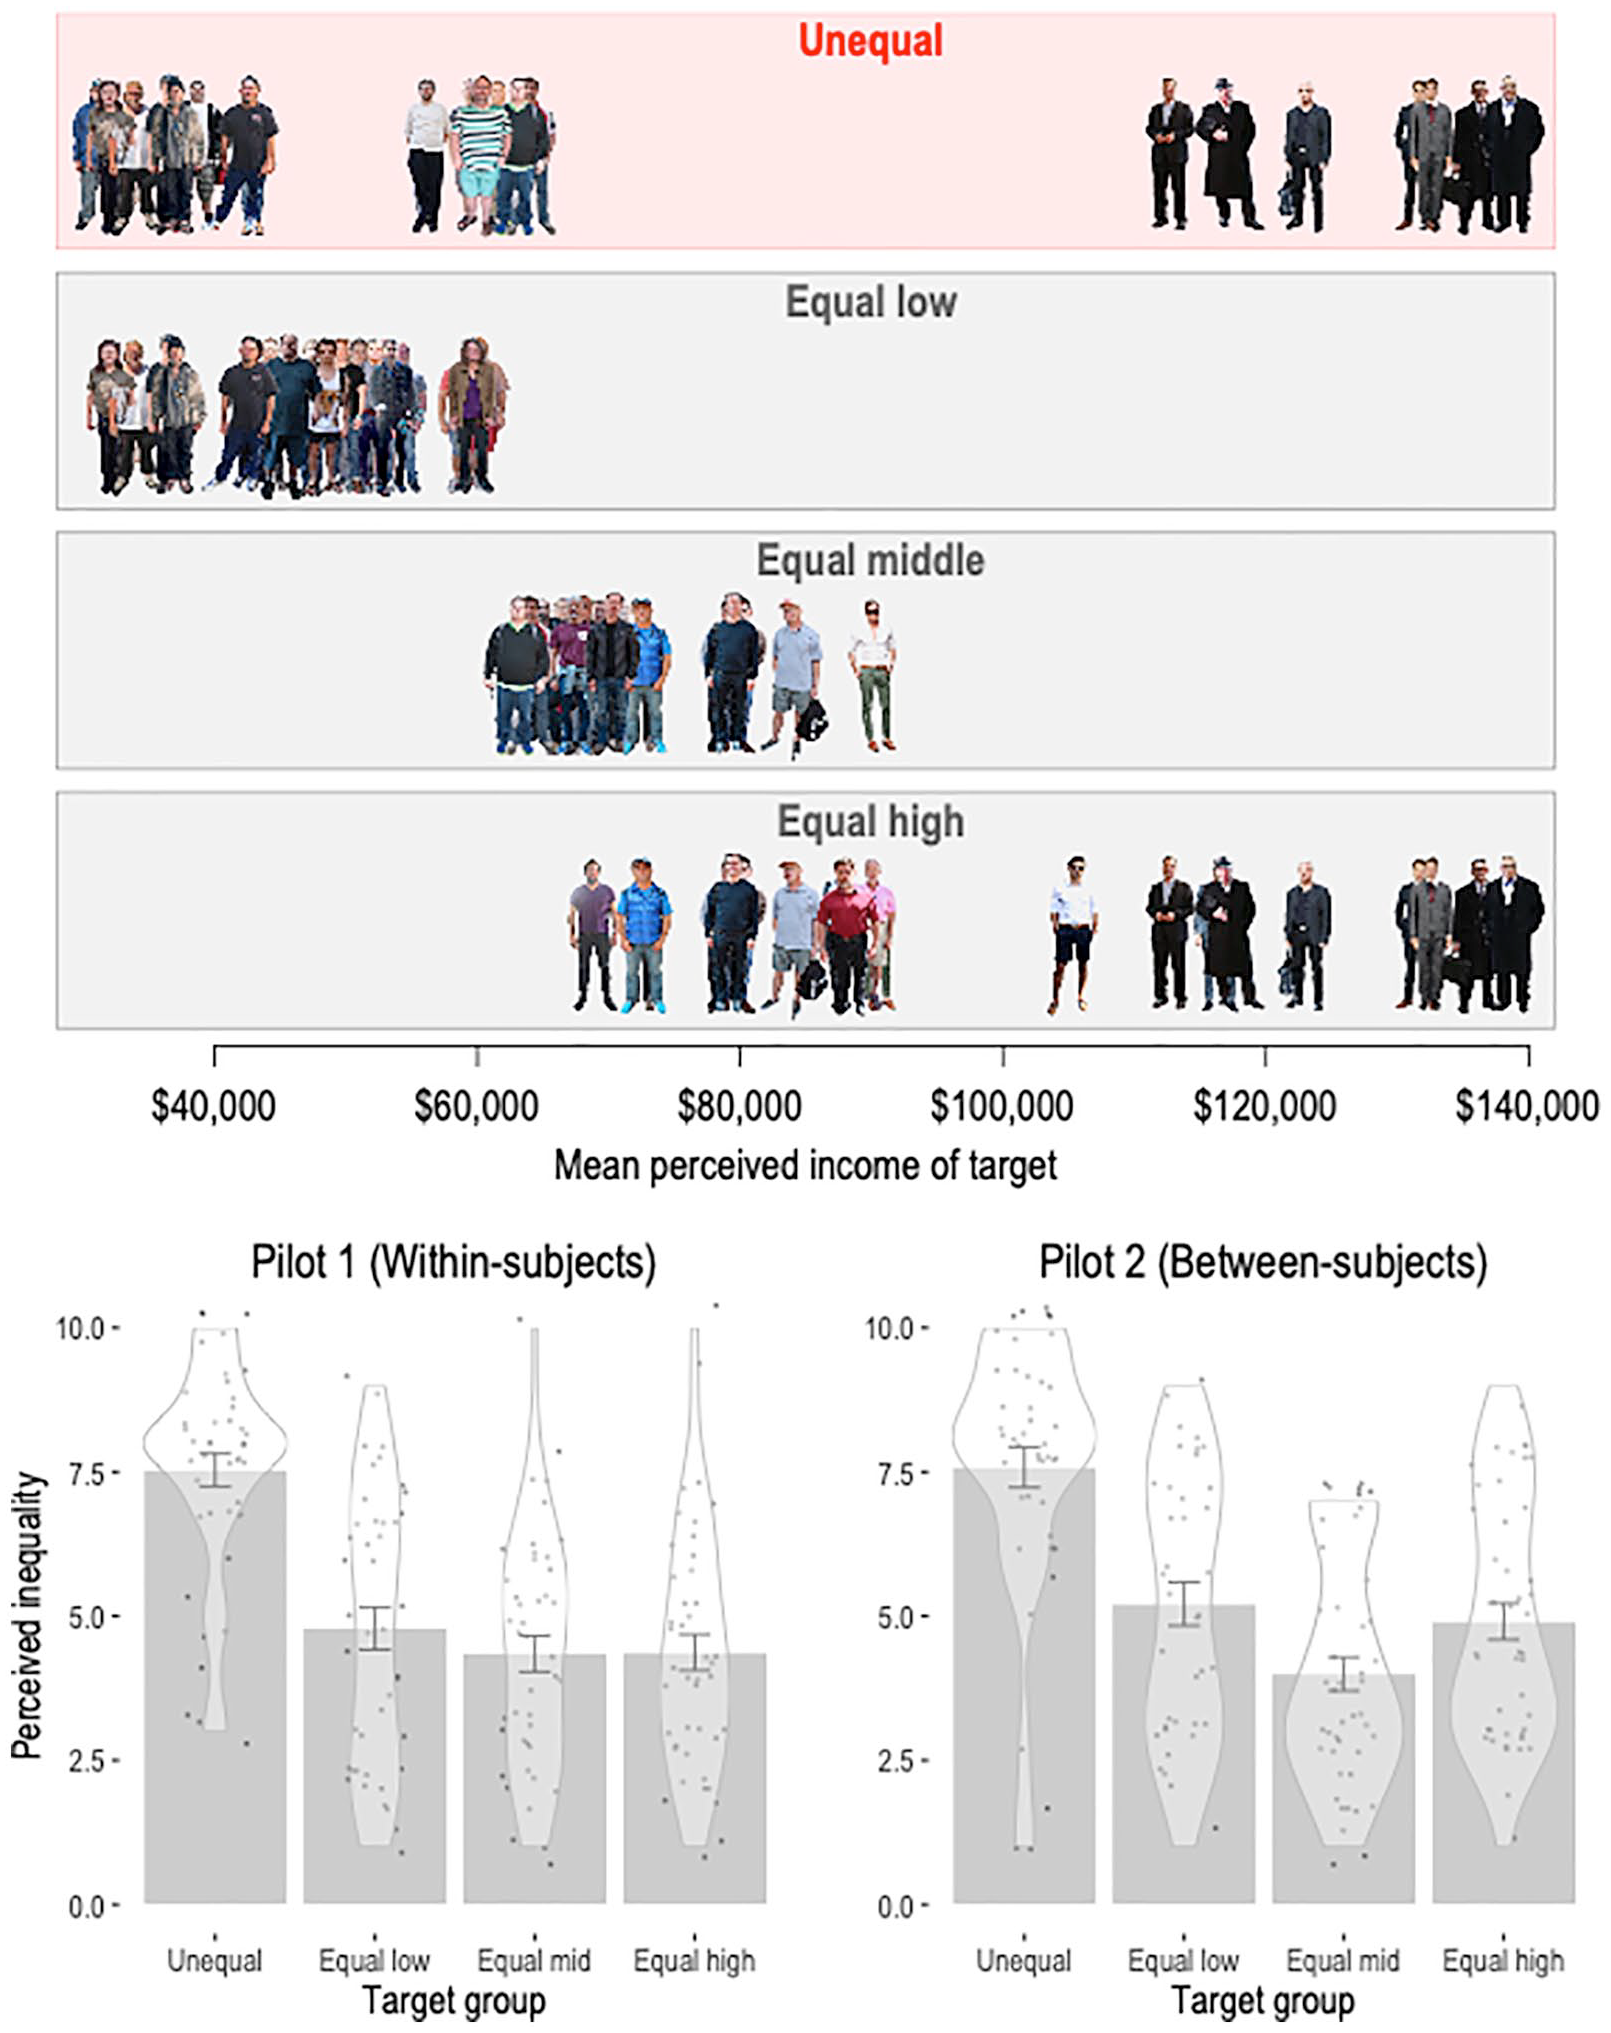
Study 1 target groups arranged by perceived income and ratings of their perceived inequality from within- and between-subject pilots.
Pilot Studies
We ran two pilots to ensure that the target groups were perceived as varying in inequality. The first used a within-subjects design; 43 MTurk participants viewed images depicting each of the four target groups in 3 × 7 grids. Participants were instructed to think of each group as a “kind of a miniature society” and to judge “how equally or unequally income is distributed in each miniature society based on how the individuals look.” Participants responded to a single item: “From 1 to 10, how unequal do you think each group is?” The second pilot mimicked this procedure but used a between-subjects design, with 169 MTurk participants rating one group each. Results suggested the manipulation functioned as intended, with the Unequal group perceived as displaying higher income inequality than each Equal group in both pilots (all p < .001, see Figure 1). For additional details on these piloting data, see Supplementary Materials.
Study 1
Study 1’s preregistration stated our interest in exploring how exposure to socially signaled inequality would affect perceptions of the warmth and competence of the targets, but it should be noted that the primary goal of Study 1 was to test the effect of socially signaled inequality on spontaneous categorization of individuals by social class, measured through a “Who Said What” task (Taylor et al., 1978). It is therefore important to note that, with the exception of the Who Said What task, all Study 1 results reported below are exploratory and their associated inferential statistics should be interpreted only with extreme caution.
Method
Participants
We recruited 474 participants through MTurk, but excluded 64 participants for failing an attention check, as preregistered. This left a sample size of 410 (189 female, Mage = 35.2, SDage = 11.1).
Procedure
Target ratings
Participants were randomly assigned to view one of four target groups and they viewed targets one by one in a randomized order while rating each on perceived warmth and competence through 0 to 100 sliders.
Who said what? task
A Who Said What? task (Taylor et al., 1978) measured spontaneous categorization of targets according to social class. This method involves presenting socioeconomically varying targets making statements and analyzing participants’ recall errors. For example, if participants display a greater tendency to make “within-class” errors (e.g., attributing statements made by a lower SES target to another lower SES target) than “between-class” errors, this is interpreted as evidence of having spontaneously cognitively grouped the targets by class. For further details of this method, see Supplementary Materials.
Demographics
Participants reported their age, gender, political orientation (using a 10-point scale ranging from 1 = completely conservative to 10 = completely liberal), yearly income, and subjective SES (using the 10-point MacArthur ladder scale; Adler et al., 2000).
Results
Who Said What? Task
We preregistered the following confirmatory hypothesis for the Who Said What? task: “We expect to find evidence that individuals who are exposed to groups of people of more heterogeneous apparent socioeconomic status will display a heightened tendency to categorize others according to their socioeconomic status.”
Participants made significantly more within-class errors on the Who Said What? task than chance, M =.53 (SD = 0.15), t(380, µ = 0.5) = 3.61, p < .001, suggesting automatic categorization of targets by social class. However, within-class errors did not significantly differ between the Unequal, Equal-Low, Equal-Middle, and Equal-High conditions, F(3, 377) = 0.30, p = .82,
Social Class Stereotypes
To assess participants’ social class stereotyping, we modeled nonlinear relationships between targets’ mean perceived incomes (from pilot ratings) and ratings of competence and warmth by fitting the following cross-classified hierarchical linear model (HLM): 3

where i indexes participants and j indexes target photos,
Model results suggested that perceptions of both traits were nonlinearly associated with targets’ perceived incomes (see Figure 2). Competence attributions were positively related to targets’ pre-rated incomes but with diminishing returns to perceived income, while warmth attributions followed an inverted U-shape, with low- and high-income targets rated less warm than middle-income targets. Based on Nakagawa’s R2 (Nakagawa et al., 2017), competence ratings were more strongly related to targets’ perceived incomes, with income and its squared term explaining 26% of variance in competence attributions compared with 6% of variance in warmth attributions. Table 1 reports full model results.

Study 1 results.
Study 1 HLM Results.

Note. HLM = hierarchical linear model.
Model comparisons for Model 1 compare its fit with a null model, including only random effects; model comparisons for Model 2 compare its fit with previous Model 1. bR2 refers to Nakagawa’s R2 (Nakagawa et al., 2017).
The Effect of Inequality on Social Class Stereotypes
To test how social class stereotyping differed as a function of socially signaled inequality, we restricted data to targets matched across both unequal and equal groups, and fitted the following HLM:
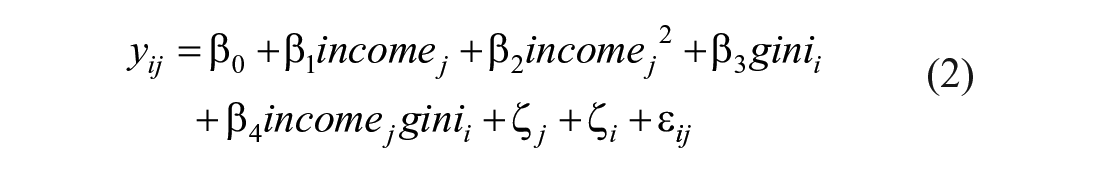
where
Competence
For competence, the interaction term between target mean income and target group Gini in Model 2 appeared robustly positive,
Warmth
For warmth, the interaction term between target mean income and target group Gini in Model 2 was also positive,
Moderator analyses
We tested whether participants’ SES (measured through a standardized composite of subjective SES and income, which correlated at r = .59) and political ideology (our 10-point liberalism/conservatism scale renamed “liberalism” due to higher scores indicating more liberal politics) moderated the observed two-way interactions between target income and target group Gini on judgments of warmth and competence. One moderating effect appeared potentially important, which was a large three-way interaction term between participants’ liberalism, target income, and target group Gini,
Discussion
Study 1 produced exploratory findings that—consistent with past research (Cuddy et al., 2009; Durante et al., 2017; Fiske et al., 2002)—higher income targets were rated as more competent than lower income targets, and middle-income targets were rated as warmer than both low- and high-income targets. Importantly, these stereotypes also appeared to be moderated by the socially signaled inequality of the groups in which targets were presented. Consistent with Durante and colleagues’ (2017) correlational findings, low-income targets were perceived as less competent when judged in more unequal target groups. However, in contrast to Durante and colleagues’ results, which were driven primarily by lower attributions of competence to the poor in more unequal nations, we found high-income targets to be perceived as more competent in more unequal target groups. Our findings regarding warmth also appeared to depart from Durante and colleagues’ findings. While they found the rich to be perceived as less warm in more unequal countries, we found high-income targets to be perceived as warmer, and low-income targets to be perceived as less warm, when viewed amid greater inequality. While exploratory, these results suggested the possibility that rather than socially signaled inequality producing ambivalent stereotypes of the rich and poor, it may in fact lead to uniformly positive perceptions of high-income individuals and uniformly negative perceptions of low-income individuals in terms of both competence and warmth.
Study 2
Study 2 sought to confirm Study 1’s exploratory findings and extend upon them in several ways. First, Study 1’s targets were all White males. In Study 2, we used photographs of targets varying in race and gender to increase the ecological validity and generalizability of its findings. Second, to explore potential downstream consequences of exposure to inequality, we measured participants’ feelings of subjective warmth toward each target, as well as other constructs related to attitudes toward inequality. Finally, Study 2 moved beyond the MTurk sample in Study 1 by collecting a large sample of in person volunteer participants.
Method
Participants
We recruited 1,456 volunteer participants from and around a large West Coast public university campus. As preregistered, we excluded participants who failed an attention check, leaving a final sample of 1,157 participants (671 female, Mage = 23.1, SDage = 8.1; 426 Asian, 360 White, 231 Latino, 52 Black, and 85 Other).
Procedure
Target photos
We selected 150 target photos of mixed race and gender, choosing 30 Black females, 30 White females, 45 Black males, and 45 White males, such that each group was equally represented by apparently low-income, middle-income, and high-income targets (e.g., among the 30 Black females, 10 were chosen as appearing low-, middle-, and high-income). These choices were initially made subjectively by our research team, but were subsequently validated by the study data (see “Manipulation checks” below).
Target group randomization
Participants were randomly assigned with varying probabilities to four conditions: Unequal (50% probability: N = 570), Equal-Low (16.7% probability: N = 206), Equal-Middle (16.7% probability: N = 180), and Equal-High (16.7% probability: N = 197). Unlike Study 1, unique groups of eight photos were randomly chosen for each participant from condition-specific photo pools. For example, participants in the Equal-Low, Equal-Middle, and Equal-High groups viewed eight photos chosen randomly from the low-income, middle-income, and high-income photos, respectively. Participants in the Unequal condition viewed eight photos chosen randomly from all 150 target photos. This procedure was designed to achieve the following goals: (a) target photos varied in terms of their perceived incomes, (b) target groups varied in terms of their level of socially signaled income inequality, and (c) each target photo was rated approximately as many times in relatively equal and unequal target groups.
Demographics
Participants reported their demographic information as in Study 1.
Target ratings
Participants first viewed their eight targets one by one without making any ratings. Following this, the same eight targets were again presented and participants rated each target on perceived warmth and competence on 0 to 100 sliders. Participants also rated targets on perceived age in 5-year intervals ranging from “less than or 15 years” to “76 years or older,” and income in US$10,000 intervals ranging from “$0-10,000” to “$200,001 or over.” Participants also completed a feeling thermometer measure regarding each target (“If 10 = ‘warmest feelings’ and 0 = ‘coldest feelings,’ how warm or cold would you feel toward this person?”; 0–10 scale).
Political/ideological items
Six items were included to measure political and ideological attitudes for exploratory purposes. Two were drawn from the System Justification Scale (SJS; Jost & Kay, 2005), two from the Multidimensional Class Consciousness Scale (MCCS; Keefer et al., 2015), and two from the Symbolic Racism Scale (SRS; P. J. Henry & Sears, 2002) for purposes unrelated to the present study. For more details see Supplementary Materials.
Hypotheses
We preregistered the following confirmatory hypotheses: 6
Results
Manipulation Checks
We measured exposure to socially signaled inequality individually for each participant by computing the unique Gini index of income inequality of their set of eight targets’ mean perceived incomes. This allowed us to account for each target group’s unique level of inequality, while still being able to treat both targets’ perceived income levels and target group inequality as randomly assigned variables. Manipulation checks indicated that targets’ mean perceived incomes aligned with our prior subjective assortment of the targets into high- (M = US$90,314, SD = US$12,351), middle- (M = US$62,174, SD = US$11,822), and low-income (M = US$47,997, SD = US$9,754) groups, with each pairwise difference significant at p < .001, and that participants’ individual Gini scores were significantly higher for participants assigned to the Unequal condition (M = 0.16, SD = 0.04) than the Equal-high (M = 0.07, SD = 0.02), Equal-middle (M = 0.09, SD = 0.04), and Equal-low conditions (M = 0.11, SD = 0.03), with each pairwise difference between Unequal and Equal groups significant at p < .001.
Confirmatory Analyses
Social class stereotypes
We again modeled social class stereotyping on the dimensions of warmth and competence through the Model 1 described above. As predicted, the targets’ mean perceived incomes were associated with both perceived competence and warmth in a nonlinear fashion, with a positive but diminishing curve for competence and an inverted U-shaped pattern for warmth (see Figure 3 and Table 2). The effect was again much stronger for competence perceptions, with Nakagawa’s R2 statistics suggesting perceived incomes and their squared term accounting for 18.4% of variance in perceived competence but just 2% of variance in perceived warmth.
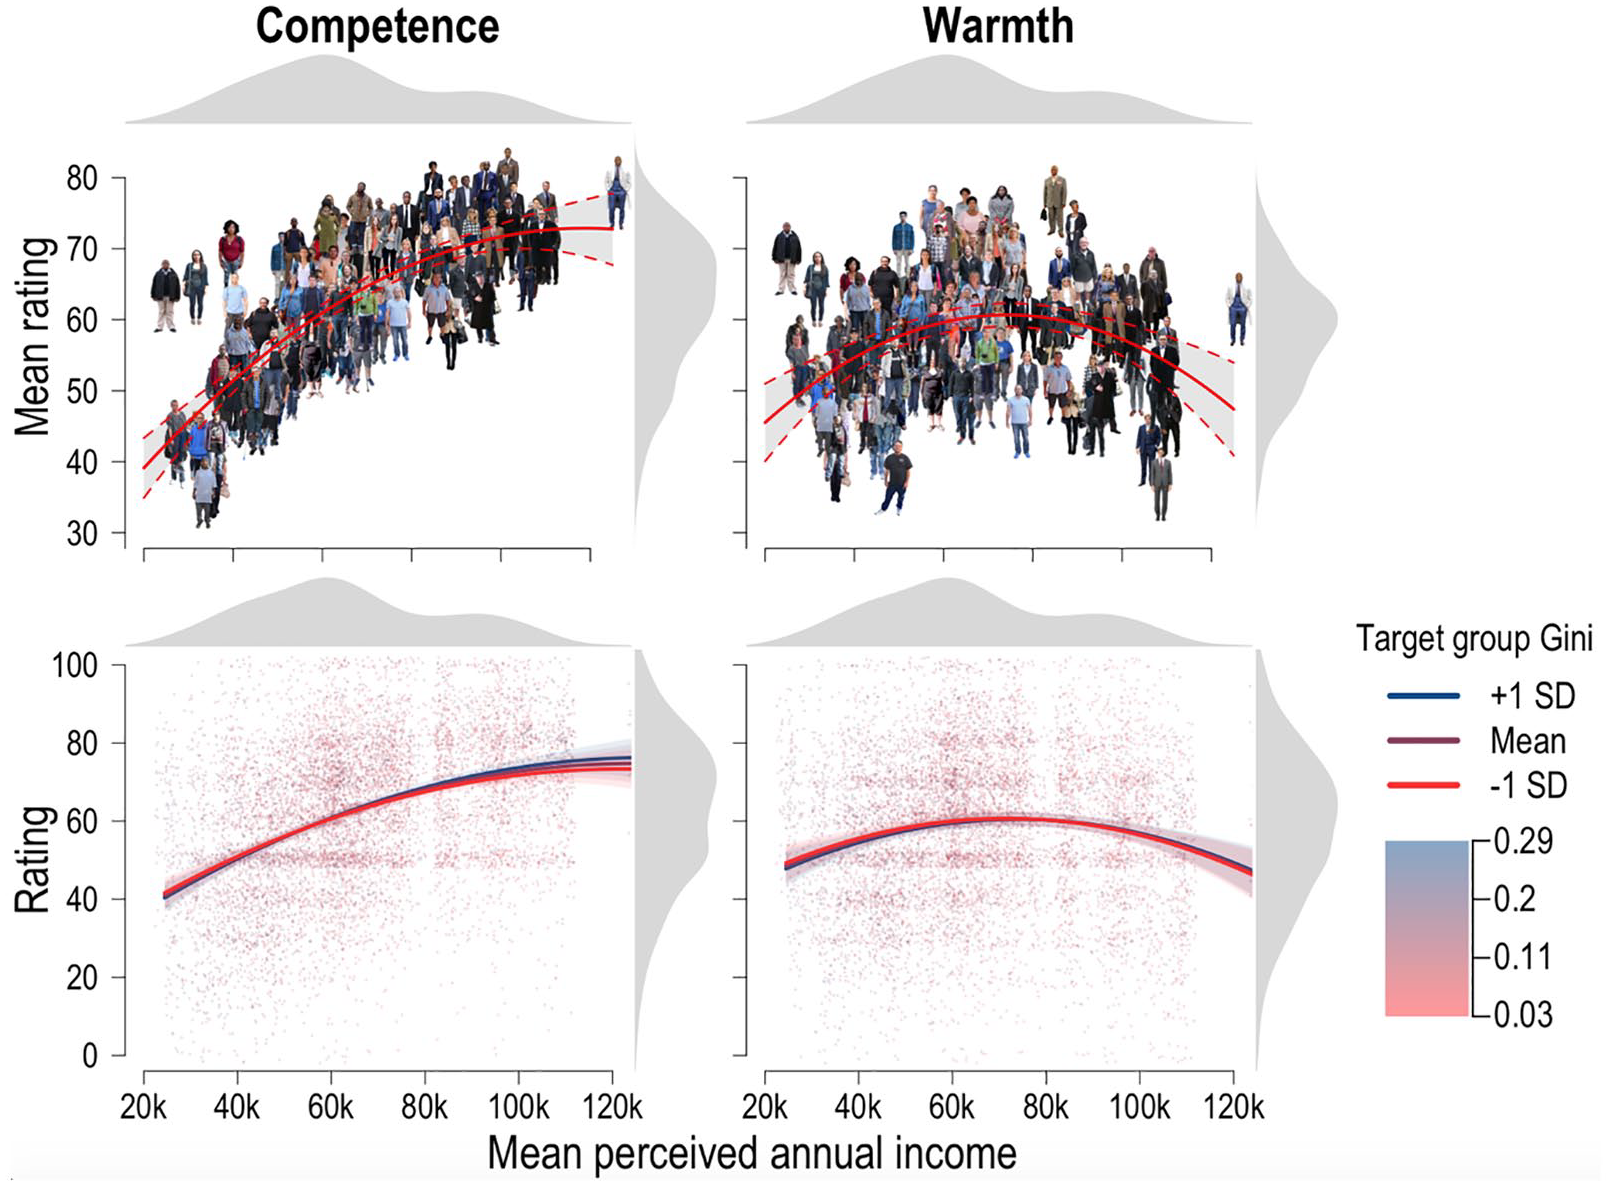
Study 2 results.
Study 2 HLM Results.
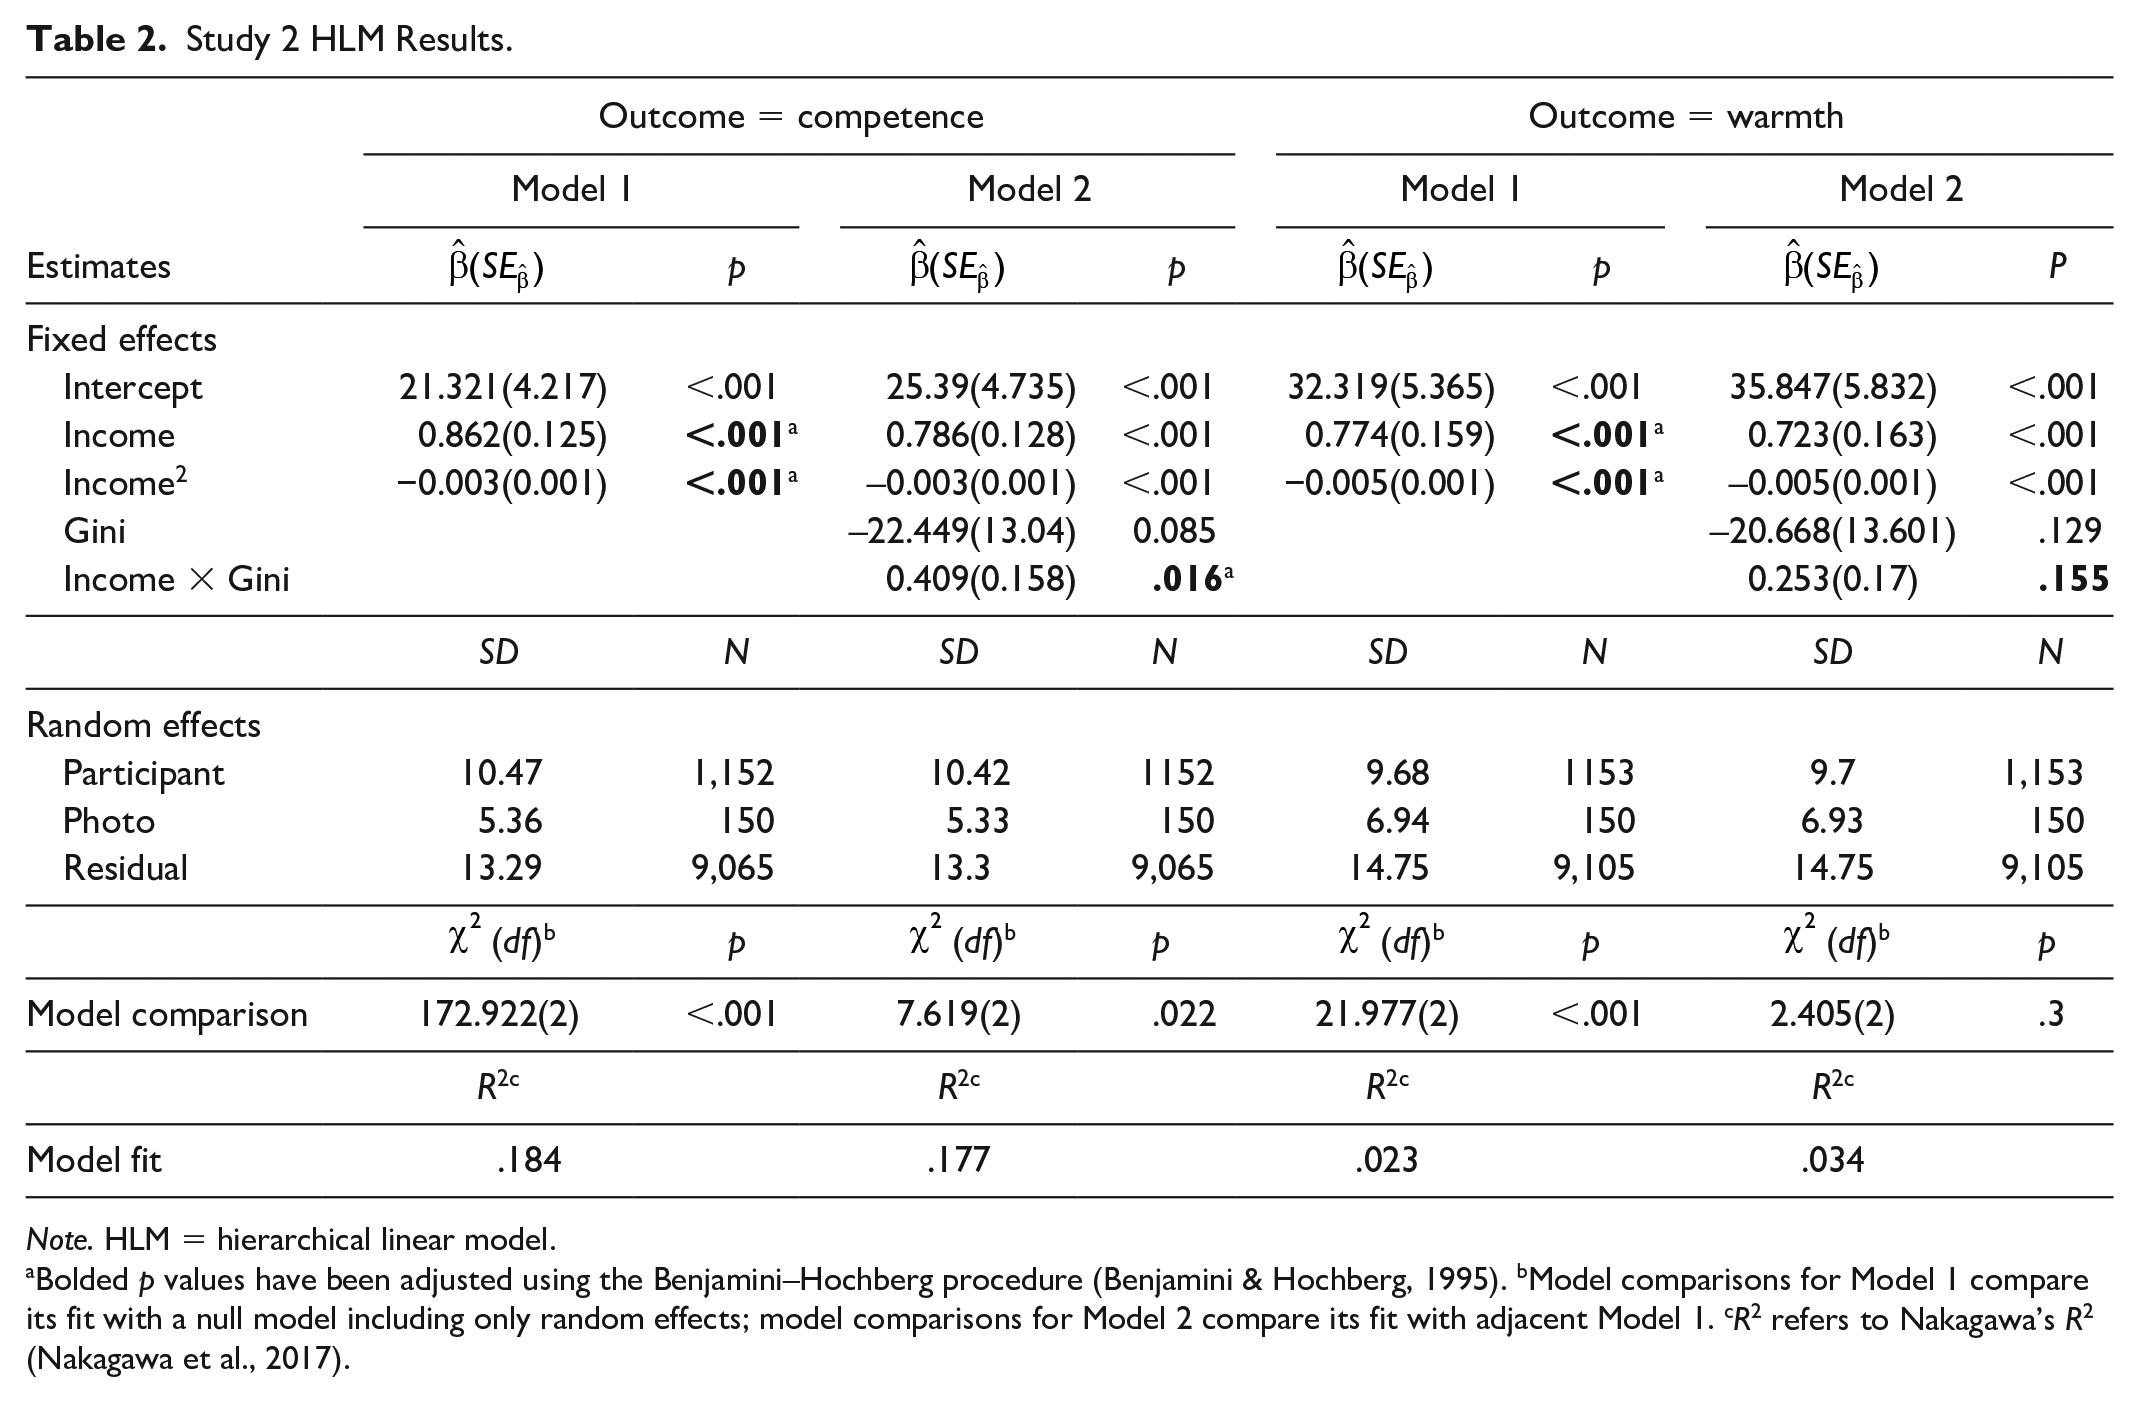
Note. HLM = hierarchical linear model.
Bolded p values have been adjusted using the Benjamini–Hochberg procedure (Benjamini & Hochberg, 1995). bModel comparisons for Model 1 compare its fit with a null model including only random effects; model comparisons for Model 2 compare its fit with adjacent Model 1. cR2 refers to Nakagawa’s R2 (Nakagawa et al., 2017).
The effect of inequality on social class stereotypes
We again modeled how the socially signaled inequality in target groups moderated social class stereotyping through the Model 2 described above.
Competence
For competence, the interaction effect between target mean income and target group Gini in Model 2 was positive and significant,
Warmth
For warmth, the interaction term between target mean income and target group Gini in Model 2 was positive but not statistically significant,
Liberalism
Unlike Study 1, participants’ liberalism did not negatively interact with target perceived income and target group inequality, with the three-way interaction term positive and nonsignificant
Adjustment for multiple comparisons
We adjusted eight key p values corresponding to our six preregistered confirmatory predictions (tests of the predicted nonlinear relationships in Hypotheses 1 and 3 required two p values each for income and income squared) using the Benjamini–Hochberg procedure (Benjamini & Hochberg, 1995). Adjustments did not alter any conclusions (see Table 2).
Exploratory analyses
Thermometer warmth and perceived income
Exploratory models tested the two-way interactions between targets’ mean perceived incomes and target group inequality predicting (a) ratings of thermometer warmth toward targets, and (b) the perceived incomes of targets. In both cases, we observed positive interaction effects, although smaller and nonsignificant for thermometer warmth,
Political/ideological items
We fit exploratory ordinary least squares (OLS) models testing for effects of socially signaled inequality on the included SJS and MCCS items. No notable effects emerged (all p > .14, all
Discussion
Study 2 provided further evidence that exposure to socially signaled inequality amplifies social class stereotyping on the dimension of competence, with high-income targets appearing more competent and low-income targets appearing less competent in more unequal judgment contexts.
Conversely, unlike Study 1, exposure to socially signaled inequality did not significantly affect social class stereotyping on the dimension of warmth. We also did not find support for the prediction that liberalism would moderate the two-way interaction between target income and target group inequality on warmth ratings.
However, despite these results, we noted that randomly assigning target groups inadvertently weakened our inequality manipulation. For example, the average Gini for participants in the Unequal condition in Study 2 was 0.16; by comparison, in Study 1, it had been 0.29. So, while we observed substantially smaller effects and null results in Study 2, this weakened manipulation of inequality lent ambiguity to these findings.
Study 2 also produced an exploratory observation that socially signaled inequality appeared to increase the perceived incomes of high-income targets and decreased the perceived incomes of low-income targets. We considered this interesting for two reasons. First, we considered that it potentially spoke to mechanism because while a heightened salience of social class or social comparisons could easily explain an effect on perceived incomes in this way, we found it much less obvious why system-justifying motivations would produce this effect, given that it creates greater perceived inequalities to be rationalized away. Second, we considered it suggestive of potential political consequences of inequality; if high-income targets appear more competent and also appear to earn more income amid greater inequality, they might also appear deserving of higher incomes, thereby reducing opposition to inequality. Study 3 investigated this possibility.
Study 3
Study 3’s methods closely mirrored those of Study 2, but with three key changes. First, we strengthened the inequality manipulation as described below. Second, we measured not only perceptions of targets’ incomes, but also perceptions of targets’ deserved incomes. To facilitate this, we displayed an occupation for each target below his or her image, reasoning that this would increase the plausibility of the task of estimating a deserved income for each target.
Method
Participants
We recruited 747 participants (421 female, 11 non-gender-conforming, Mage = 21.2, SDage = 6, 347 Asian, 206 White, 124 Latino, eight Black, and 60 Other) from and around a large west coast public university campus by approaching individuals and asking them to complete a survey using a tablet. Based on an examination of excluded participants in Study 2, we preregistered that all participants would be included in analyses.
Procedure
Target photos and occupations
We selected 60 target photos used in Study 2 (14 females, 26 Black), choosing 20 photos each from the top, middle, and lowest thirds of the distribution of photos’ mean perceived incomes. High-income targets were assigned relatively high-income occupations (e.g., lawyer, business manager), middle-income targets were assigned middle-income occupations (e.g., teacher, social worker), and low-income targets were assigned relatively low-income occupations (e.g., janitor, usher), based on income statistics from the Bureau of Labor Statistics (https://www.bls.gov/oes/tables.htm).
Target group randomization
Target group randomization followed Study 2, except that participants in the Unequal condition viewed three targets each from the low-income, middle-income, and high-income targets. Participants in the Equal-Low, Equal-Middle, and Equal-High conditions each viewed nine photos chosen randomly from the low-, middle-, and high-income targets, respectively.
Demographics
Participants reported their demographic information as in the first two studies.
Target ratings
Instructions and rating scales largely followed Study 2, but after rating apparent income, participants were also asked to rate deserved levels of income: “Based on their occupation, what do you consider an appropriate annual income for this person?” In addition, we did not measure apparent age.
Hypotheses
We preregistered seven total confirmatory hypotheses. The first four mirrored Hypotheses 1 to 4 in Experiment 2, and Hypotheses 5 to 7 were as follows:
Results
Manipulation Checks
Manipulations of targets’ perceived incomes and target group inequality functioned as anticipated. Targets’ mean perceived incomes aligned with their assortment to high- (M = US$116,092, SD = US$16,478), middle- (M = 67,411, SD = US$11,260), and low-income (M = 40,145, SD = US$4,491) groups, with each pairwise difference significant, p < .001, and participants’ individual Ginis were higher for participants assigned to the Unequal condition (M = 0.24, SD = 0.02) than the Equal-high (M = 0.07, SD = 0.02), Equal-middle (M = 0.05, SD = 0.01), and Equal-low conditions (M = 0.08, SD = 0.02), with each pairwise difference between Unequal and Equal groups significant, p < .001.
Confirmatory Analyses
Social class stereotypes
We again fit cross-classified HLMs of Forms 1 and 2 predicting competence and warmth ratings. Results showed that the predicted nonlinear relationship between targets’ mean perceived incomes and competence ratings was observed (see Figure 4), with targets’ mean perceived incomes accounting for 15.9% of variance in competence attributions (see Table 3). However, we did not observe a significant relationship between targets’ mean perceived incomes and warmth ratings. Mean perceived income and its square explained just 1.4% of variance in warmth ratings and neither mean income nor its square was significant (see Table 3).
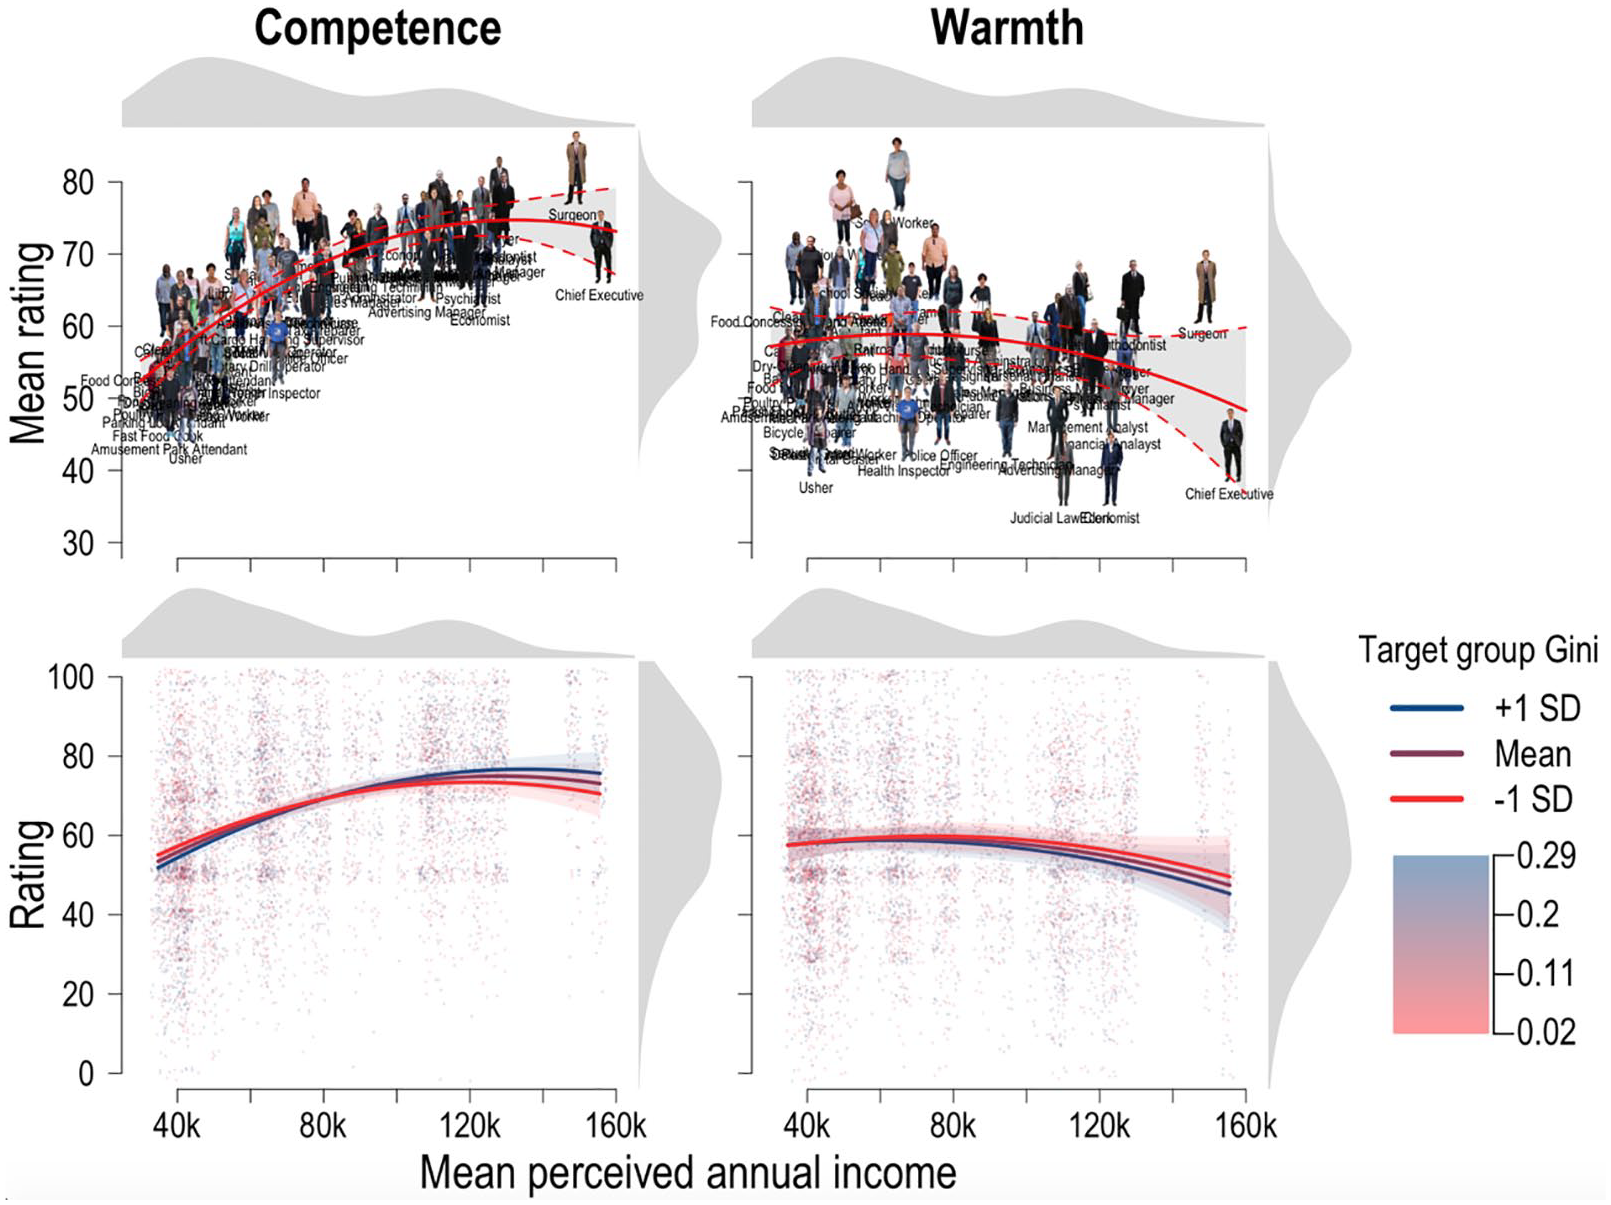
Study 3 results.
Study 3 HLM Results.
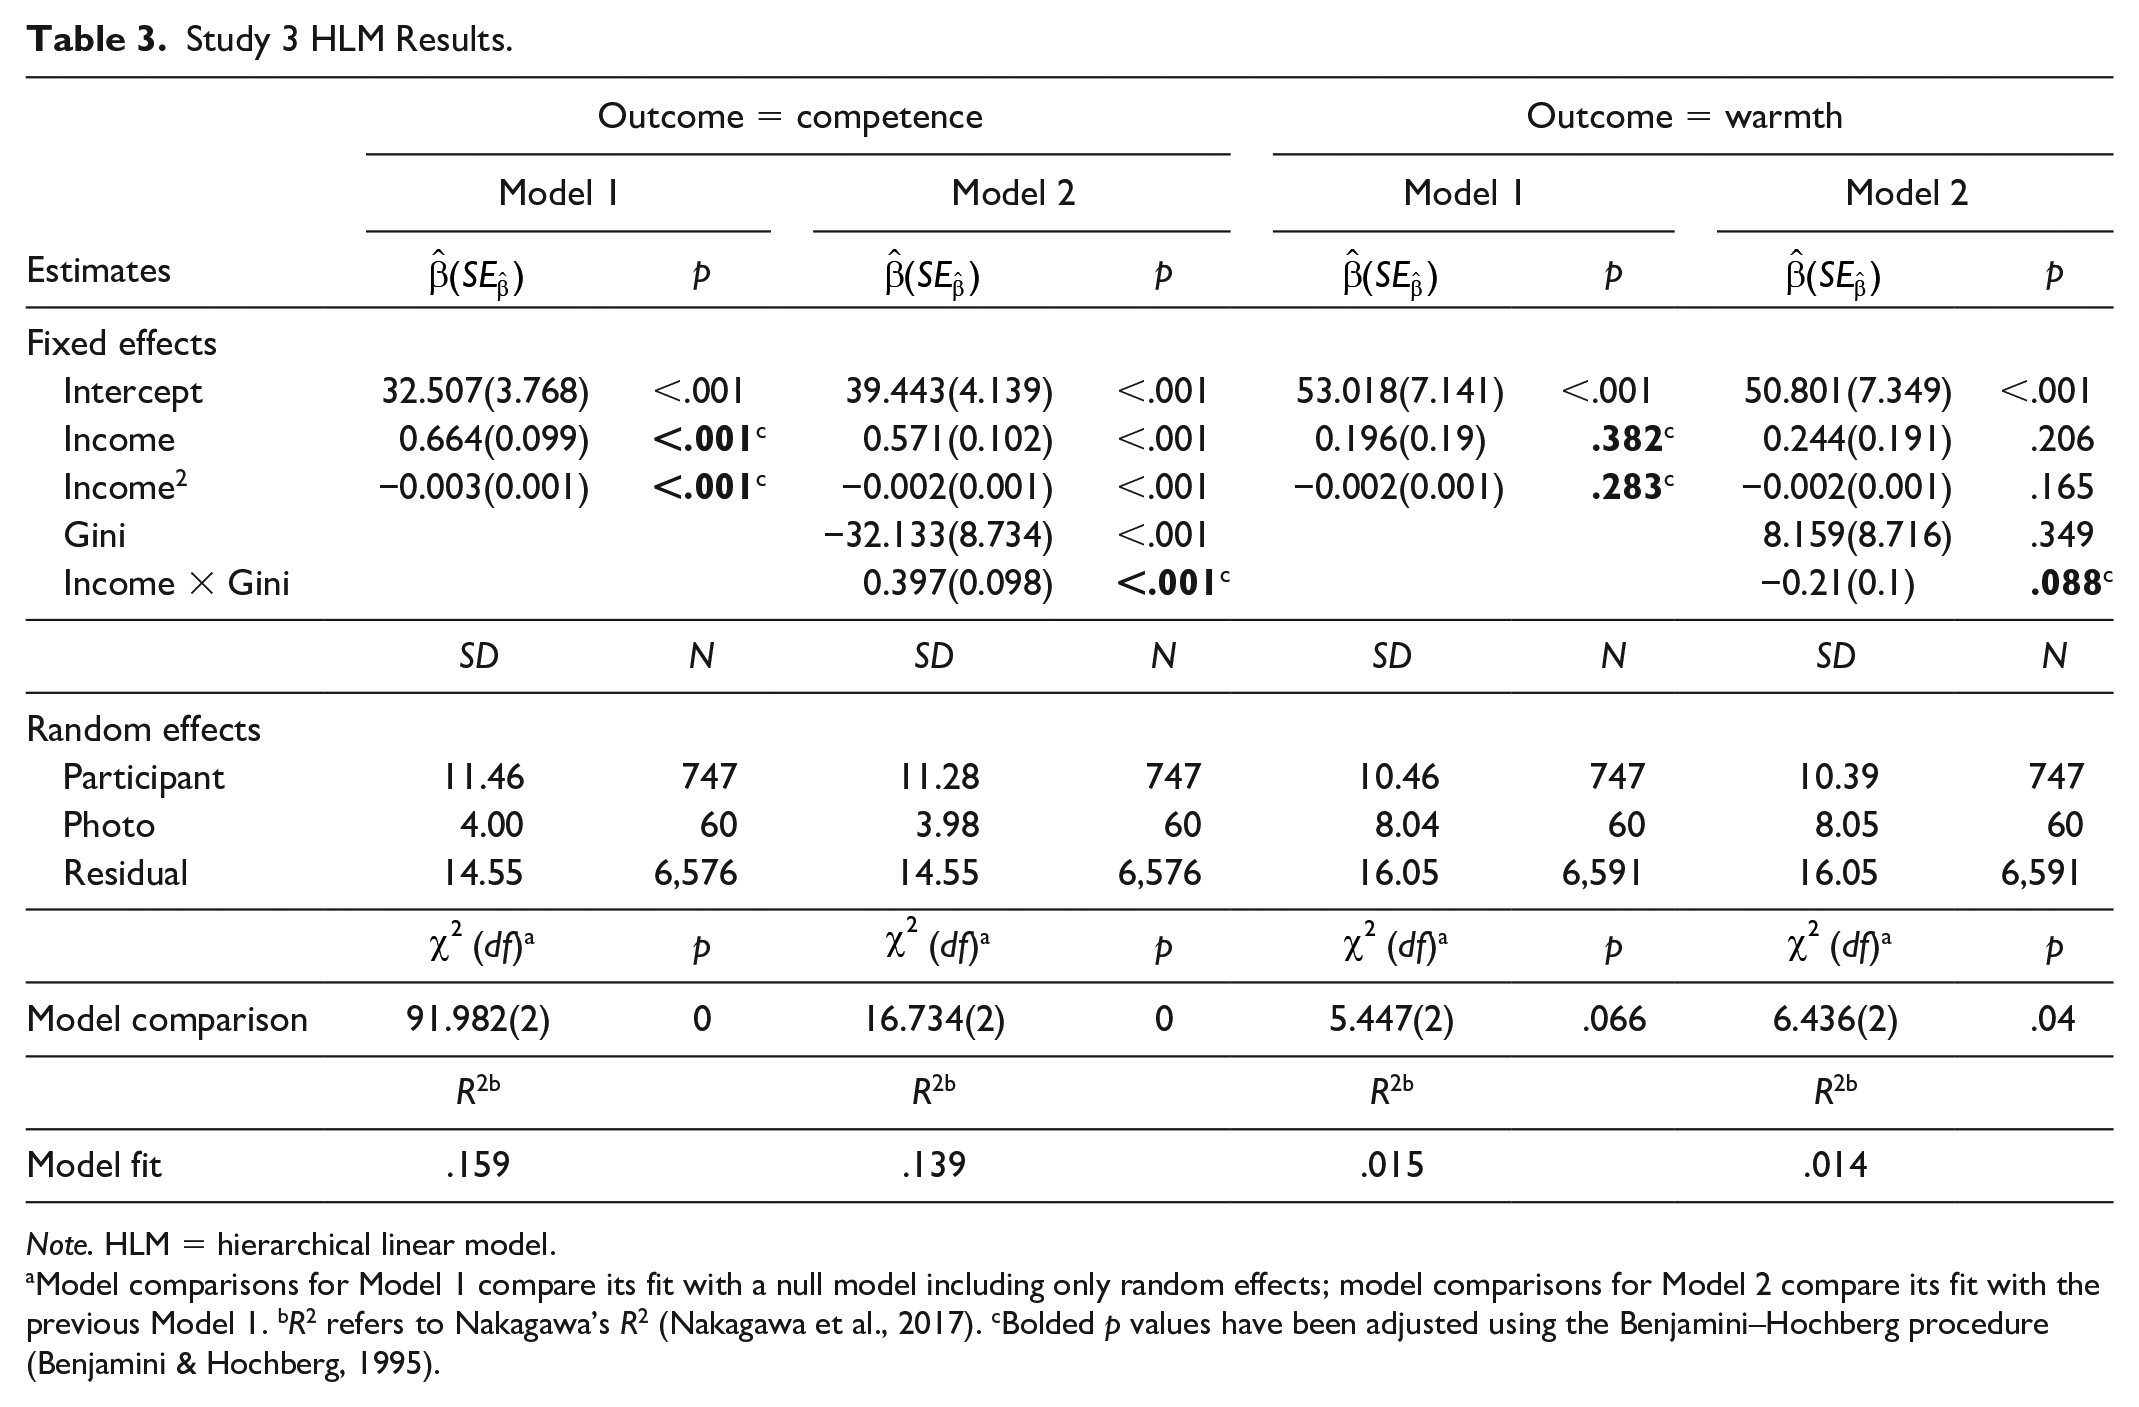
Note. HLM = hierarchical linear model.
Model comparisons for Model 1 compare its fit with a null model including only random effects; model comparisons for Model 2 compare its fit with the previous Model 1. bR2 refers to Nakagawa’s R2 (Nakagawa et al., 2017). cBolded p values have been adjusted using the Benjamini–Hochberg procedure (Benjamini & Hochberg, 1995).
The effect of inequality on social class stereotypes
Competence
For competence, the interaction effect between target mean income and target group Gini in Model 2 was positive and significant,
Warmth
For warmth, contrary to predictions, the interaction term between target mean income and target group Gini was negative and just significant prior to adjustment of p values,
Thermometer warmth
For thermometer warmth, contrary to predictions, we observed no significant nonlinear relationship between targets’ mean perceived incomes and thermometer warmth toward targets, with both mean perceived incomes and their square nonsignificant (both unadjusted ps > .11). We also observed no significant interaction term between perceived incomes and target group Gini,
Perceived incomes
For perceived incomes, contrary to predictions, we observed no significant interaction term between targets’ mean perceived incomes and target group Gini,
Adjustment for multiple comparisons
We adjusted 10 key p values corresponding to our seven preregistered confirmatory hypotheses, using the Benjamini–Hochberg procedure (tests of the predicted nonlinear relationships in Hypotheses 1, 3, and 5 required two p values each). Adjustments altered one conclusion: the interaction predicting perceived warmth became nonsignificant (see Table 2).
Exploratory analyses
Perceived deserved income
For perceived deserved incomes, we observed no notable interaction between targets’ mean perceived incomes and target group Gini,
Discussion
Study 3 replicated results from Studies 1 and 2 for the competence dimension: Amid greater socially signaled inequality, participants again attributed greater competence to higher income targets and decreased competence to lower income targets. However, contrary to Studies 1 and 2, we observed no significant overall nonlinear social class stereotyping effect on the warmth dimension and an interaction in the opposite direction to the effects observed in Studies 1 and 2 that became nonsignificant after adjustment for multiple comparisons.
This lack of a significant relationship between targets’ mean perceived incomes and attributions of warmth was surprising, given our previous results. However, the previous warmth-related results were much weaker than those of competence, suggesting that this dimension of social class stereotyping may be more unstable and varying, depending upon stimulus and context-related factors. In hindsight, we also speculate that the specific professions assigned to targets (e.g., “Chief Executive”) engendered warmth stereotypes for reasons unrelated to social class (e.g., He et al., 2019) and this may have decreased the effect of perceived incomes below a detectable level.
Other confirmatory tests found no significant moderating effect of socially signaled inequality on thermometer warmth or perceived incomes and exploratory analyses also revealed no notable interaction in predicting perceived deserved incomes. Of these results, the null for perceived incomes was particularly surprising as this effect had appeared robust in Study 2, even if exploratory. Speculatively, we considered that this may also have been caused by the assignment of occupations to photos. Compared with Study 2, in which participants rated the perceived incomes of targets simply based on their appearance, the occupations may have provided participants with a firmer reference point on which to base their judgments, making it harder to shift those judgments through experimental manipulation.
Power and Strength of Evidence
Across all three studies, one effect stands out as robust: the moderation of social class competence stereotypes by socially signaled inequality. However, given the range of effects tested within each study and our use of a relatively unique experimental paradigm and complex modeling approach, it is important to note that sample sizes (postexclusion Ns = 410, 1,157, and 747) were maximized within resource and budgetary constraints in an attempt to achieve as high a statistical power as possible, without any a priori power analyses specifically targeted at this effect. Consequently, to better understand our statistical power to detect this effect, we conducted post hoc power sensitivity analyses.
Because this effect was an exploratory finding in Study 1, we focused on Studies 2 and 3, as these were its key confirmatory tests, and estimated the power of each sample size to detect effects of different sizes using a nonparametric bootstrapping approach. This approach is explained in more detail in Supplementary Materials and essentially involves (a) making minor synthetic additions or subtractions to the outcome variable (competence ratings) that produce a new effect size
The results suggested that both Study 2 and Study 3 were well powered to detect small to medium effects (Study 2 achieved 80% power at d = 0.26, Study 3 at d = 0.31). However, in terms of observed effects, the story is more complex. The observed effect size for the competence interaction fluctuated across studies (ds = 0.74, 0.18, and 0.35). So, while Studies 2 and 3 had high power (>95%) to detect the effect sizes observed in Studies 1 and 3, both were underpowered to detect the effect observed in Study 2 (53% and 23%, respectively).
One reason why the observed effect sizes may have varied so widely is the aforementioned inadvertent weakening of the inequality manipulation in Study 2. However, another possibility is simply sampling variability, which is expected to produce inconsistent results in the presence of true effects (Lakens & Etz, 2017).
Nonetheless, Studies 2 and 3 provide robust evidence for this effect. Both studies preregistered directional predictions and both found significant evidence against the null in the predicted direction, with exact (two-tailed) p values obtained after adjustment .016 and .00017. Even if we assume power of just 50% for both tests, two successes in two tries remain 100 times more likely under the alternative than the null hypothesis (Lakens & Etz, 2017). Despite the inconsistency of the effect sizes, we therefore believe that we can confidently reject the null for the competence interaction effect.
General Discussion
Given the emergent interest within social psychology in experimentally investigating how increasing inequality shapes psychological processes and outcomes, we tested whether socially signaled economic inequality amplifies social class stereotypes. Building on past studies showing that nation-level economic inequality predicted social class stereotypes of competence and warmth (Durante et al., 2017), we exposed participants to varying levels of socially signaled inequality (Kraus et al., 2017) and observed that merely exposing individuals to groups of targets displaying greater economic inequality reliably led to increased stereotyping on the dimension of competence. Across three experiments, high-income targets were judged more competent when they appeared amid more unequal groups, and low-income targets were judged less competent when they appeared in more unequal groups. This in part aligns with correlational data regarding stereotypes of the poor in more or less unequal nations (Durante et al., 2017) and is consistent with past theorizing about the effect of income inequality (Durante et al., 2013; Kraus et al., 2017), as well as past observations of social-comparative contrast effects (Mussweiler, 2003).
This result illuminates potentially important implications of rising inequality. Increased stereotyping of the wealthy as possessing, and the poor as lacking, competence may hinder social mobility by amplifying exclusion of lower income individuals from academic (Batruch et al., 2017; Goudeau & Croizet, 2017) and employment opportunities (Lott, 2002; Rivera & Tilcsik, 2016). Similarly, although we did not find evidence of downstream effects on political beliefs, an increased association between social class and competence may also allow for increased rationalization of inequality by enhancing perceptions that the wealthy and the poor have earned their respective resources through personal merit (Starmans et al., 2017).
By contrast, we observed no consistent effects of socially signaled inequality on perceptions of targets’ warmth. However, we believe that this result may itself be theoretically important. As discussed above, one prominent school of thought in social psychology has held that inequality may create ambivalent stereotyping of the rich and poor on dimensions of warmth and competence, with stereotypes functioning as both explanations and compensations for inequality (Durante et al., 2013, 2017) Here, however, we observed a consistent and robust effect of socially signaled inequality on the dimension of competence but not on the dimension of warmth. In fact, we found social class stereotyping regarding warmth to represent a far weaker effect than social class stereotyping regarding competence in general. Together, we believe that these findings cast doubt on the notion that stereotypes of warmth play a compensatory role for increasing inequality within societies. We believe that future work should look to investigate this further.
One limitation of the present research is that while we find evidence consistent with a range of plausible mechanisms by which socially signaled inequality might amplify social class stereotyping, we cannot adjudicate between them. As discussed above, the exploratory finding of an effect on perceived incomes in Study 2 appeared difficult to explain solely by reference to Durante and colleagues’ SJT-focused theorizing, but this effect did not replicate in Study 3 and, even if veridical, does not preclude system justification motives being the primary driver of the other observed stereotyping effects.
In addition, our method makes, but does not test, the assumption that inequality is associated with an increased likelihood of exposure to socially signaled inequality. It would be interesting for future work to address this issue as the present results suggest that this may be key to understanding one mechanism by which inequality exerts effects.
Finally, although we found similar effects on the competence dimension among both an MTurk sample and an ethnically diverse sample of volunteers, our samples were predominantly Americans, so generalizability across cultures cannot be assumed. Past work has found social class stereotypes to be similar around the world (Durante et al., 2013; Fiske et al., 2007), but this does not guarantee that inequality will have similar effects across contexts (e.g., Cheung, 2016). Future work could also investigate whether individual differences or contextual factors moderate these effects.
Supplemental Material
Supplementary_Materials_PSPB_anonymized – Supplemental material for Social Class Competence Stereotypes Are Amplified by Socially Signaled Economic Inequality
Supplemental material, Supplementary_Materials_PSPB_anonymized for Social Class Competence Stereotypes Are Amplified by Socially Signaled Economic Inequality by Paul Connor, Jordan Varney, Dacher Keltner and Serena Chen in Personality and Social Psychology Bulletin
Footnotes
Acknowledgements
We thank The Tobin Project and Juan Alcazar, Shannon Ashoori, Lilia Avila, Jodi Cline, Hannah Cozad, Diego Garcia, Xinyu Hartshorn, Zhanchen Huang, Lisa John, Esther Jones, Ana Jusay, Amy Kim, Vivian Leduc, Seunghun Lee, Barbara Liao, Fabiola Martinez, Riley McDaniel, Tania Mora, Keewon Nam, Nikkolson Ngo Ang, Ruby Ortiz, Isabella Peralta, Shelby Schwerm, Karina Solis, Mireya Tellechea, Alondra Tlatelpa, Stephanie Tsou, Samantha Vega, and Lizbeth Zarate for their tireless work.
Declaration of Conflicting Interests
The author(s) declared no potential conflicts of interest with respect to the research, authorship, and/or publication of this article.
Funding
The author(s) received no financial support for the research, authorship, and/or publication of this article.
Supplemental Material
Supplemental material is available online with this article.
Notes
References
Supplementary Material
Please find the following supplemental material available below.
For Open Access articles published under a Creative Commons License, all supplemental material carries the same license as the article it is associated with.
For non-Open Access articles published, all supplemental material carries a non-exclusive license, and permission requests for re-use of supplemental material or any part of supplemental material shall be sent directly to the copyright owner as specified in the copyright notice associated with the article.