
Abstract
While officials involved in graft, bribery, extortion, nepotism, or patronage typically like keeping their deeds private, the fact that corruption can have serious effects in democracies is no secret. Numerous scholars have brought to light the impact of corruption on a range of economic and political outcomes. One outcome that has received less attention, however, is voter turnout. Do high levels of corruption push electorates to avoid the polls or to turn out in larger numbers? Though of great consequence to the corruption and voter-turnout literature, few scholars in either area have tackled this question and none has done so in a broad sample of democracies. This article engages in this endeavor through an analysis of the broadest possible sample of democratic states. Through instrumental variable regression we find that as corruption increases the percentage of voters who go to the polls decreases.
Keywords
Introduction
While officials involved in graft, bribery, extortion, nepotism, or patronage typically like keeping their deeds private, the fact that corruption can have serious consequences is no secret. Scholars of both political science and economics have brought into the limelight the numerous impacts of corruption or the ‘misuse of public office for private gains’ (Lipset and Lenz, 2002; Rose-Ackerman, 2008). Research has uncovered corruption’s impact on economic growth, stability, and trade (Huntington, 1968; Leff, 1964; Merton, 1957; Mo, 2001; Nye, 1967), inequality (Gupta et al., 2002; Li et al., 2000), investment (Mauro, 1995; Wei, 2000), interpersonal trust (Seligson, 2006), as well as citizen satisfaction with and confidence in democracy (Pharr and Putnam, 2000; Wagner et al., 2009). Despite the widespread attention paid to the predominantly negative impacts of corruption, few scholars have investigated corruption’s impact on democratic participation, particularly at the polls.
Do electorates mobilize at election time to oust (or support) corrupt officials or, rather, do they become disengaged and abstain from voting as corruption increases? While the answer to this question could help shed light on another potential outcome of corruption and an additional determinant of voter turnout, only a handful of scholars in either the corruption or turnout literature have taken up the corruption–turnout nexus at all (Kostadinova, 2003, 2009; McCann and Dominguez, 1998; Simpser, 2005). Those who have addressed the question, however, have taken a specific-country view (McCann and Dominguez, 1998), a regional focus (Kostadinova, 2003, 2009), or have examined authoritarian states and electoral fraud (Simpser, 2005). Consequently, their analyses offer only preliminary evidence about the macro-level relationship between these two variables.
The focus in this article is to test the link between corruption and turnout in democracies. There is evidence that corruption is especially disruptive in democracies because it undermines the basic principles of a free state. It is widely noted that corruption contributes to the delegitimation of the political and institutional systems within which it takes root (Rock, 2009; Sung, 2004). 1 Whether corruption also dissuades citizens from turning out in democratic elections is particularly important, because such lower participation may exacerbate legitimacy problems. In this sense, this research represents the first attempt to tap into the macro-level relationship between corruption and citizens’ participation in elections.
Equipped with a new dataset covering all democratic countries across all years for which corruption data were available, we analyze the impact of corruption on voter turnout around the world. The investigation proceeds as follows. The next two sections below define corruption and then summarize the literature on the potential impact of corruption on various developmental indicators. We then look in greater depth at the few prior studies that directly address the relationship between corruption and turnout. This is followed by an explanation of the international dataset and the statistical procedures that we adopted in this research. Next, we present the model estimates and the assessment of corruption’s impact on voter turnout. Finally, we summarize the main findings and suggest some avenues for further research.
Defining corruption
While political corruption is conventionally defined as the abuse of public office for private gain (see, for example, Shleifer and Vishny, 1993), there are some rather nuanced variations of the concept. For example, Nye (1967: 420) defines corruption as behavior that ‘deviates from the formal duties of the public role because of private – regarding (personal, close family, private clique).’ Others (for example, Philp, 1997) focus more explicitly on the public interest dimension of corruption. For example, according to Heidenheimer et al. (1989: 10), corruption occurs whenever a public officeholder is induced by monetary or other rewards to take actions in favor of whoever provided the reward and thereby damage the public interest. In this article, we follow this second, more public interest definition of corruption, and define the concept as all private misdeeds, such as excessive patronage, nepotism, secret party funding, and overtly close ties between politics and business interests.
Corruption in democracies
Corruption is not only widespread, but also very problematic in democracies, not least due to its potential economic and political effects. 2 Though early scholars (for example, Huntington, 1968; Leff, 1964; Merton, 1957; Nye, 1967) maintained that corruption facilitates social modernization in countries with slow or inefficient bureaucracies (Kawata, 2006), 3 more recent scholarship (Ades and Di Tella, 1996; Fishman and Svensson, 2000; Gupta et al., 2002; Mauro, 1997; North, 1990; Podobnik et al., 2008) highlights numerous deleterious effects of corruption. One area that may be affected most negatively is a country’s economy. Not only can governments lose significant portions of much needed revenue (as they are unable to tax money hidden as bribes) (Podobnik et al., 2008: 547), but corruption also dissipates resources that could have been used productively. Bribery, in particular, makes economic transactions ‘irrational’ when governmental jobs end up going to the highest bribe payer instead of to the lowest-paying, best-quality provider (Podobnik et al., 2008: 548) and the higher risk of bad contracts means that corruption may also provide disincentives to invest (North, 1990). 4
Perhaps even more detrimentally, corruption can corrode the institutions and foundation of democracy itself (Warren, 2004). Specifically, corruption produces an inefficient delivery of public services, and corrupt officials frequently redirect money and vital services away from a general population that is democratically entitled to them (Podobnik et al., 2008; Warren, 2004). More fundamentally, corruption, such as bribes and grafts, erodes the principal pillars of democracy when it transforms what are stated institutionalized rights and protections of citizens into ‘favors, to be repaid in kind’ (Warren, 2004: 328).
It is especially burdensome that once corruption has taken root, it is likely to spread to many domains and institutions (Rothstein, 2007). For example, as long as their colleagues and competitors do not change their own behavior, employees in the public and private sector have every reason also to accept bribes and favors (Rothstein, 2005). It is simply irrational for any single public official to be the only honest player in an unfair game that will not change (Myrdal, 1968: 409). The results of such ‘rational behavior’ are that corrupt systems become sticky; they constitute a ‘self-reinforcing’ equilibrium, whereby honest institutions are overtaken by corrupt networks and practices. In turn, this cycle will increase cynicism among the population (Rothstein and Stolle, 2008).
What is of high concern is that corruption’s deleterious effects on civic-mindedness and trust may also undermine democratic participation, an essential component of democracy (Rothstein and Eek, 2009; Rothstein and Teorell, 2008). To underline this point, Putnam asserts that civic engagement (including turnout) requires a community ‘bound together by horizontal relations of reciprocity and cooperation, not by vertical relations of authority and dependency’ and a community in which leaders are, and ‘conceive themselves to be, responsible to their fellow citizens’ (1993: 88). 5 Corruption could further undermine citizens’ attitudes toward political institutions, 6 especially among those who evaluate their society’s moral standards on the basis of public official performance (Rothstein, 2003). If local, regional, or national representatives cannot be trusted because they demand bribes and engage in discrimination, then citizens may have little to no incentive to interact with their elected officials (Wagner et al., 2009).
In such a situation, corruption can make citizens skeptical of not only those officials who engage in corruption, but most or all public servants whether or not they are guilty (Anderson and Tverdova, 2003; Warren, 2004). In this sense, corruption can compromise citizens’ satisfaction with the performance of their political system (Anderson and Tverdova, 2003) and even leach down to the roots of democracy, to decreasing citizens’ satisfaction with their trust in democratic institutions (Mishler and Rose, 2001), their confidence in the performance of democracy (Pharr and Putnam, 2000), and ultimately, their belief in the legitimacy of democratic states (Seligson, 2006). In addition, citizens might also stop considering elections as ‘instruments of democracy’ that are worth their time and effort (Powell, 2000). This is particularly troublesome, given that high voter apathy signals to politicians that they will not be publicly sanctioned for their corrupt actions (Heidenheimer and Johnston, 2002: 142). Provided with this incentive to become even more corrupt, politicians may increase their engagement in these activities (Holbrooke and Meier, 1993; Rose-Ackerman, 1978), entangling a country in a spiral of decreased citizen engagement in politics and increased corruption.
While this conjecture would suggest that corruption decreases voter turnout in democracies, to date, no study has tested at the macro-level whether this is, in fact, the case. Yet, the answer to this question not only has intrinsic and important ramifications for uncovering additional impacts of corruption, but could also advance the vast literature on voter turnout. In particular, one of the main goals of the turnout literature has been to build an aggregate-level model of conventional political involvement, so as to better understand declining turnout rates across democracies in recent years (Franklin, 2004; Weisberg and Wilcox, 2004). 7 Corruption may provide an important key to this puzzle, adding to the evidence that decreased civic engagement is perhaps, at least partially, responsible for the turnout drop-off that democracies have experienced in the past quarter of a century.
Corruption and turnout
Studies on the corruption–turnout link are currently very limited and the few that exist mostly focus on a particular region or country, particularly, new democracies. The existing literature also provides some mixed results with regard to the relative and absolute importance of corruption for turnout. There are two contradictory views that respectively see corruption as a mobilizing agent or a poison for citizens’ participation in elections. There are, in turn, two rather contradictory arguments in support of the first perspective. First, by offering selective incentives or bribes for special interests, candidates may energize supporters, disparage opponents, and win new voters. This view essentially contends that voters are bought off to participate. For example, in their study of county supervisor elections, Karahan et al. (2006) find that in those US counties where candidates promised or delivered favors and made promises to particular interests more people participated in these elections.
Second, other scholars, who also perceive corruption as a strong mobilizing agent, have a decisively different explanation for why corruption in the public sector might increase turnout. This point of view argues that citizens want clean and accountable governments (Bratton et al., 2005). This view further contends that if individuals do not find transparency and effectiveness, they might turn out in greater numbers. For example, Inman and Andrews (2010) report that Senegalese citizens faced with government corruption turn out to vote instead of either becoming willing participants in corrupt behavior or apathetic to a corrupt government. These two authors also find that regardless of their affiliation and socioeconomic background, individuals mobilize against officials perceived to be corrupt. Focusing on the USA, Johnston (1983) claims a positive correlation between corruption and turnout as well, suggesting that turnout rises if corruption becomes more rampant.
However, arguments reporting that corruption might increase turnout are in the minority. Most of the existing literature suggests a negative relationship between corruption and voter turnout. 8 Kostadinova (2009) points out that corruption may initially mobilize voters to turn out to ‘overthrow corrupt politicians’ in post-communist countries. Yet, she reports that the relationship between the two concepts becomes negative after a couple of years, as increased abuse of government and tax money leads to ‘distrust in the political process and alienation from politics.’ Kostadinova (2009) further notes that this exhaustion and disappointment experienced by a public confronting high levels of corruption, may push voters to ‘withdraw from voting’ (2003: 743). McCann and Dominguez (1998) hint at similar negative reactions to corruption, and, in particular, focus on the detrimental impact of electoral fraud on citizens’ trust in the government in Mexico. The authors conclude that ‘those who believed that voting decided how Mexico was governed were more likely to turn out to vote while those who expected elections to be fraudulent were more likely to stay at home on Election Day’ (McCann and Dominguez, 1998: 497). This argument suggests that we might find that corrupt countries that democratize see high(er) turnout at first, but then less if corruption stays high. Alternatively, it might indicate that following a ‘corrupt’ election, there will be a fall in turnout in the subsequent elections. Finally, Simpser (2005), focusing on autocracies, discovers that electoral corruption is negatively related to voter turnout and sees this low turnout as the voters’ response to their belief that elections are fraudulent.
While these analyses provide some conjectures pointing toward a negative relationship between corruption and turnout, they do not provide conclusive evidence that this relationship holds broadly. Kostadinova’s analysis covers eight post-communist countries, some of which are democracies and some of which are anocracies. These eight cases also show a lack of variation in many of the explanatory variables, including corruption, as well as the dependent variable, that is, democracy. McCann and Dominguez’s study (1998) focuses on a single election in a country (Mexico) that, at the time (the mid-1990s), had dubious democratic credentials. Finally, the large-N analysis of corruption and turnout by Simpser (2005) is restricted to mainly nondemocratic regimes and electoral fraud rather than corruption more generally.
Not only is it likely that corruption has a more severe impact in democracies (for example, it undermines democratic institutions and decreases individuals’ trust in politicians), it might be especially ominous for new(er) democracies, as it can dissolve the fledgling representativeness of those countries. In short, both from a theoretical and practical standpoint the study of the relationship between corruption and conventional participation in democracies is important. Yet, none of the existing studies adequately addresses this question. This study helps to fill this gap by examining, through instrumental regression analysis, the relationship between these two indicators based on an inclusive study that covers all democratic elections for which corruption data are available.
Measuring corruption
Several indicators of corruption exist, each differing from the others in its precise definition and method of aggregating sub-indicators: Transparency International’s Corruption Perceptions Index, Political Risk Services’ International Country Risk Guide (ICRG), and the World Bank Control of Corruption Index. Yet, despite their slightly different compilation, all three of these measures are highly correlated with each other. The correlation between the indices for the data at hand is at least .83 for all pairs of these indicators (see also Svensson, 2005: 22). 9 While we have collected all available data for all indices, we decided to use the index with the most available data points, that is, the ICRG. Although the measure takes financial corruption into account, it is more concerned with ‘day-to-day’ corruption in the form of excessive patronage, nepotism, job reservations, favor for favors, secret party funding, and suspiciously close ties between politics and business. Constructed by the ICRG researchers and based on a multitude of available sources (for example, assessment by firms and surveys of the population), the ICRG is comprehensive in that it covers more than 70 democracies for the period of 1984 to 2009. We include these ICRG data in a standard dataset on turnout, which we constructed for the period of 1972 to 2009.
Turnout and the control variables
To assess the impact of corruption on turnout among all liberal democracies, we begin with a basic model of turnout and add corruption to that baseline. While there is no single, definitive model for studying cross-national voter turnout, Blais’s model (2006) (which is derived from Jackman (1987) and Powell (1982)) is employed as a baseline. In accordance with the prior literature on turnout, only elections that are considered ‘free and fair’ (that is, that have a Freedom House score of five or less) are included in the analysis. Though derived from a dataset covering all democratic elections since 1972, the data in this study cover democratic elections between 1984 and 2009, given the lack of corruption data prior to 1984. In the following, we present and operationalize the dependent variable and the controls.
Turnout
Turnout (our dependent variable) is measured as the percentage of eligible adult citizens that cast a ballot in their country’s national legislative elections. The turnout data originate from the International Institute for Democracy and Electoral Assistance (2009) and Adam Carr’s Election Archive (2009). In those cases in which the relevant election data were not included in either of the two sites mentioned above, the missing data points were complemented with data from the parliamentary websites of the relevant countries.
Institutional factors
Three variables are included in the model as institutional factors: compulsory voting laws, electoral system type, and decisiveness of the election. The first of these variables (compulsory voting laws) is widely found to lead to higher voter turnout at election time (Blais, 2006; Franklin, 2004; Jackman, 1987). The analysis introduces a dummy variable for compulsory voting rules. To be included in the category, a state must have official sanctions for failing to vote. The electoral system type is included as the second institutional factor. Scholars (for example, Ladner and Milner, 1999; Selb, 2009) have found that proportional representation (PR) in multimember districts produces higher turnout rates than systems with single-member districts. The rationale behind this is that voters in majoritarian systems have little incentive to vote when their district is safe or undisputed (Ladner and Milner, 1999). However, in PR systems, because the number of votes approximately translates into the number of seats, voters are more likely to perceive an incentive to vote. Under PR, parties are also more likely to mobilize citizens throughout the country, as every vote they gain counts for them. This contrasts with plurality, in which parties concentrate their resources in competitive districts. To capture the impact of the electoral system type, PR systems were coded as 1 and mixed and majoritarian systems as 0. 10
As a third factor, we include a categorical variable that measures the decisiveness of the electoral race. Because of the higher stakes, more important elections should trigger higher vote shares than less important elections (Blais and Dobrzynska, 1998). In this analysis, a decisive election is one in which all of the ‘important’ seats of government are simultaneously open to be filled. In contrast, an indecisive election is one in which large numbers of seats are contested at varying times. Decisiveness is coded in accordance with the scheme developed by Blais and Dobrzynska (1998). Specifically, an election is considered maximally decisive (coded 1.0) if all major elected positions are determined in the election, 11 partially decisive (coded 0.5) if there is an alternative election cycle for the president, provincial government, or second chamber, and not decisive if more than one of the three institutions of power are elected at a time that is not simultaneous with the lower house election in our sample. 12
Socioeconomic factors and contextual factors
The model also includes a control for country size, on the basis of Blais’s report that turnout is widely found to be negatively affected in large countries (2006). 13 In this analysis, a dummy variable for small state is also included in the analysis. Following UN guidelines, we code as a small state any country with less than 2 million inhabitants. Finally, it is also important to control for the competitiveness of electoral races: close races are likely to promote participation, whereas safe electoral contests ought to be associated with lower turnout (Powell, 1986). The rationale behind this assertion is that when the margin of success between two contenders or parties is expected to be small, citizens are more likely to view their vote as decisive. Additionally, close races are likely to attract high media coverage and campaign activity, creating social pressure for citizens to participate (Fauvelle-Aymar and Abel, 2006). To measure the degree of competitiveness, we take the difference in the vote percentage between the winning party and the runner-up party. 14
Data
The final dataset includes 343 observations that we cluster in a pooled design. Due to the empirical distribution of democracies and data availability, rich industrialized countries are overrepresented in the sample (more than half of the data comes from the Organization for Economic Cooperation and Development countries, such as Germany and the USA). However, we also include more than 100 observations from newly emerging or poor democracies (for example, Namibia or Croatia) (for a complete list of countries and country years included in the analysis, please see Table A1 in the Appendix). There is also wide variation in both our dependent and independent variables of interest. Average turnout in our sample is approximately 74 percent, with a standard deviation of 14 points. Turnout ranges from 38.3 percent in the first round of Mali’s 2001 Assemblée Nationale election to 96.3 percent in Malta’s 2003 election to the Kamra tad-Deputati. Pertaining to their level of corruption, there is also considerable between-country variation. We include countries that are, worldwide, in the lowest 20th percentile (for example, Honduras during the 1997 election), as well as leaders in corruption control, such as the Nordic countries.
To gain a preliminary idea of the relationship between corruption and turnout, we graph the relationship between the two variables (see Figure 1). Our independent variable (control of corruption) is on the x-axis and measures the degree to which states contain corruption. Our dependent variable (turnout) is on the y-axis. Figure 1 highlights a positive relationship between the containment of corruption, as presented by the International Country Risk Guide, and turnout. The graph highlights that countries that are more successful in containing corruption have higher turnout at parliamentary elections. More precisely, the regression line hints that less corrupt states have around 15 percentage points higher turnouts than countries with widespread corruption. 15 However, to verify whether this correlation holds in a multivariate setting, we must construct such a model.

The Bivariate Relationship Between Corruption and Turnout
Theoretical and empirical model
Constructing the multivariate regression model that correctly captures the impact of corruption on turnout requires careful modeling procedures. First, it is necessary to test for possible endogeneity between our variable of interest (corruption) and turnout. This is necessary considering that several studies (for example, Charron and Lapuente, 2010; Montinola and Jackman, 2002) argue that there might be a reversed relationship between corruption and turnout. In particular, these analyses (for example, Bäck and Hadenius, 2008) claim that democratic practices (including citizens’ high and stable political participation) might actually curb corruption. Thus, it might well be the case that the impact of corruption on turnout is not unidirectional, but that a country’s degree of turnout also hinges on the country’s level of corruption. We use a Hausman test (1978) to examine whether, in fact, the empirical relationship goes in both directions. The results of the Hausman test highlight that the null hypothesis of exogeneity can be rejected, indicating that the reversed causation between turnout and corruption is strong enough to seriously bias the results of the ordinary least squares (OLS) estimation.
We use instrumental variable regression to address this feedback loop or reversed causation. To instrument corruption it is necessary to find regressors that are strongly correlated with corruption, but not with turnout. A country’s GDP per capita and its level of democracy fulfill these criteria. Pertaining to the first factor, that is, a country’s GDP per capita, there is a strong empirical relationship, as well as a strong statistical correlation. Empirically, scholars (for example, Pellegrini and Gerlagh, 2008: 255) have established that many variables correlated with the material wealth of a country, such as education, levels of urbanization, and better institutions, may decrease the social tolerance of corruption. Statistically, the Pearson’s correlation coefficient between corruption and GDP per capita is .48. 16 As for the second factor, prior research (for example, Stockemer, 2009) has also consistently shown that fuller or older democracies exhibit greater control of corruption than new or incomplete democracies. Statistically, there is also a strong correlation (the Pearson’s correlation is .6) between corruption and the level of democracy, as operationalized by Freedom House’s (2009) democracy scores of two to five. A country’s GDP per capita and its degree of democracy also fulfill the second criterion for instruments. While both are strongly correlated with corruption, they are only very weakly correlated with turnout (the respective correlations are .22 and .10).
We also include country fixed effects in the equation to account for possible unmodeled country heterogeneity. To stand on firm statistical ground, we compare our fixed-effects indicator with the random-effects indicator via a Hausman test (Greene, 2003). The Hausman test reveals a significant p-value, which indicates that the fixed-effects estimator is superior. For comparison purposes and robustness checks, we also add two specifications for which we do not instrument corruption, but, rather, include the indicator in its raw form in the equation. The first specification (that is, equation two) is an autoregressive (AR(1)) model with robust standard errors (this specification effectively eliminates autocorrelation and heteroskedasticity). The second model is a fixed-effect model.
Our instrumental variable regression model is computed in the following way:
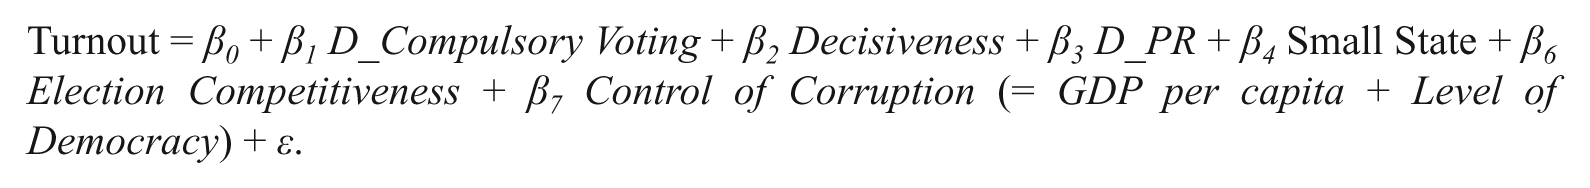
Results
As hypothesized, corruption has a statistically significant and substantially relevant negative impact on voter turnout. The instrumental variable equation (that is, Model 1 in Table 1) predicts that for every one point increase in a country’s control of corruption, turnout will increase by more than six points, if all other variables are held constant. This implies that very corrupt countries have 20–30 percentage points fewer citizens turning out at elections compared with countries with little corruption. Many country examples confirm the model’s predictions. Many states, including Luxembourg, Belgium, Germany, and Chile, are frontrunners in the fight against corruption. These same countries also have high turnout rates (generally more than 80 percent). Despite the fact that the unstandardized beta coefficients in the noninstrumental regression models are weaker in Models 2 and 3, both equations confirm the statistically significant and substantively relevant impact of corruption on voter turnout.
The Regression Models
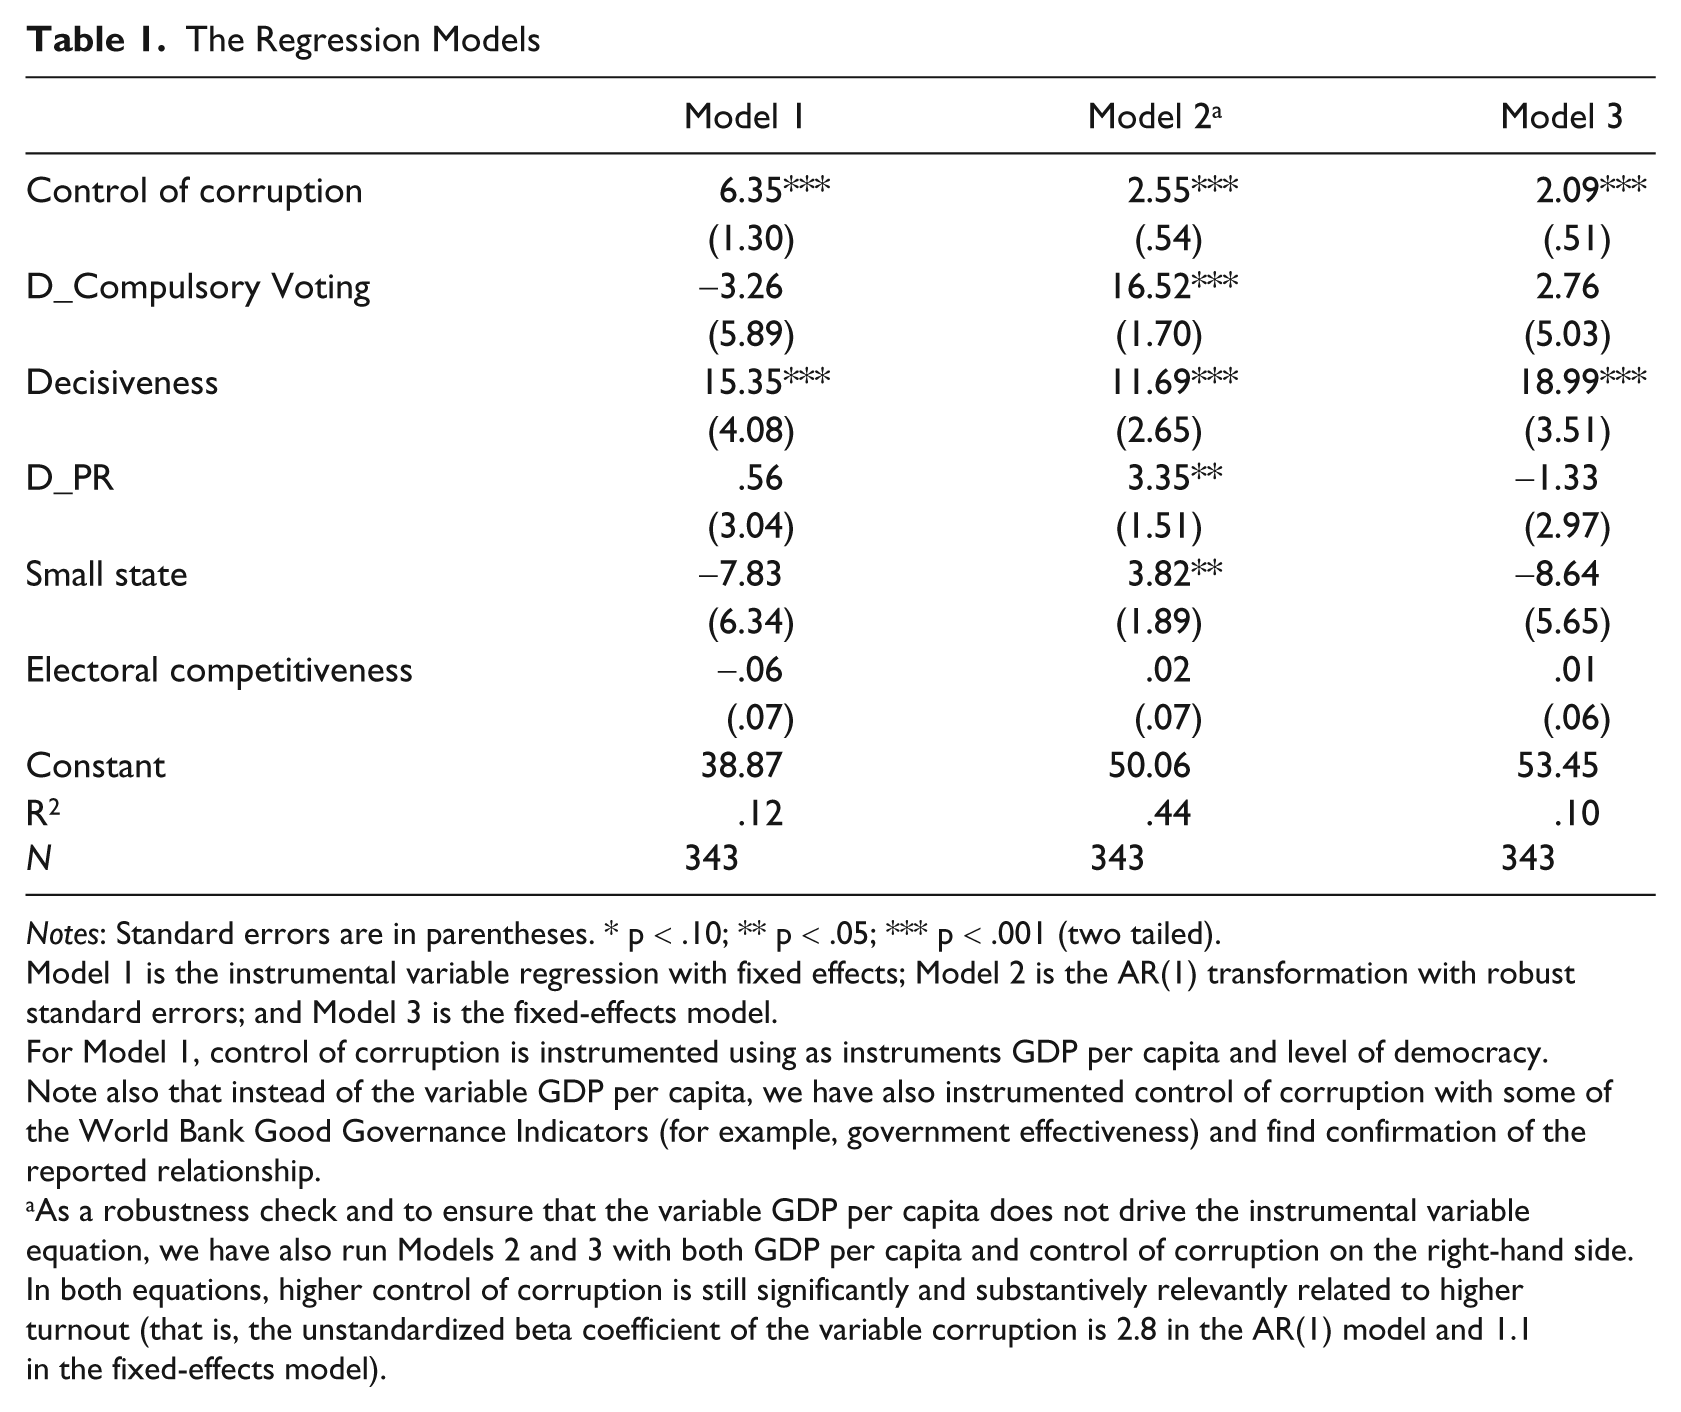
Notes: Standard errors are in parentheses. * p < .10; ** p < .05; *** p < .001 (two tailed).
Model 1 is the instrumental variable regression with fixed effects; Model 2 is the AR(1) transformation with robust standard errors; and Model 3 is the fixed-effects model.
For Model 1, control of corruption is instrumented using as instruments GDP per capita and level of democracy. Note also that instead of the variable GDP per capita, we have also instrumented control of corruption with some of the World Bank Good Governance Indicators (for example, government effectiveness) and find confirmation of the reported relationship.
As a robustness check and to ensure that the variable GDP per capita does not drive the instrumental variable equation, we have also run Models 2 and 3 with both GDP per capita and control of corruption on the right-hand side. In both equations, higher control of corruption is still significantly and substantively relevantly related to higher turnout (that is, the unstandardized beta coefficient of the variable corruption is 2.8 in the AR(1) model and 1.1 in the fixed-effects model).
The substantive implications of the findings derived from this article are multifold. First, this study adds to the list of negative consequences of corruption. Corruption not only undermines good governance, the rule of law, economic development, and moral values (see Karklins, 2005; Kaufmann and Siegelbaum, 1997; Mauro, 1995), but also hinders citizens’ participation in elections. Corruption’s negative impact on voter turnout might be both direct and indirect. It may be direct because citizens could become frustrated with a corrupt political establishment and, even more detrimentally, lose trust in their political representative(s). In such an environment, horizontal relations of reciprocity and cooperation cannot flourish (Putnam, 1993). Suspicious of politicians, potential voters may turn their backs on their representatives. The impact of corruption on turnout might also be indirect. As established elsewhere, corruption decreases good governance and economic growth (Stockemer, 2009). Confronted with poor economic and political performance, voters could become (further) alienated from politicians and stay home on election day.
More generally, corruption might be one explanation for why democracies have experienced declining voter turnout during the past 30 years or so. While corruption has been present since the dawn of politics, it has increasingly become the focus of media and public attention during the past 20 or 30 years. This amplified attention may have increased citizens’ awareness of corruption, contributing to a loss of trust in politicians or in the political system in general, or both.
For the control variables, consistent with previous research, this article finds that decisive races trigger higher turnout than less decisive races. The estimates of the four remaining factors (that is, proportional representation, the closeness of the election, the population size of a country, and compulsory voting) are not statistically significant. However, it is important that we interpret the coefficient of three out of these four factors with caution. The dummy variables for small state, PR, and compulsory voting have close to perfect collinearity with the fixed-effects estimator. This implies that the estimated impact of these variables may not be correctly represented in Models 1 and 3. In fact, as Model 2 shows, compulsory voting, in particular, is significantly and substantively related to higher participation in elections, if we relax the fixed-effects assumption (see Table 1).
Conclusion
This article is an important addition to both the corruption and turnout literatures. First, this study adds to the corruption literature in that it establishes another negative consequence of bribery, clientelism, nepotism, or illegal payments made to public agents with the goal of obtaining benefits or of avoiding costs. Corrupt practices not only hinder economic and social development, they also prevent democracies from functioning properly. Confronted with mediocre governance performance, citizens in corrupt democracies may be unwilling or unable to establish trustworthy relations with their representatives. As a result, citizens may distance themselves from the political system, preferring to stay at home on election day. Second, this article adds to the vast literature on turnout in that it introduces a new relevant variable, which future studies should include in their turnout models. The variable corruption is both statistically significant and substantively relevant in explaining and predicting voter turnout.
Future research should evaluate the impact of corruption on voter apathy in newer and growing democracies. Many (nonconsolidated) Latin American or African democracies (for example, Mexico or Mali) are characterized by high rates of corruption and relatively low voter turnout. Bribery, despotism as well as vote and seat buying might also contribute to a phenomenon which O’Donnell (1996) labels ‘delegative democracy.’ 17 In addition, in recent democracies, corruption might not only increase the gulf between citizens and policymakers, it might also create distrust between various relevant political actors and institutions. Future research should address this possible link, which will inform not only the democracy literature, but also practitioners and international organizations involved in democracy assistance efforts.
As an addition to this study, it might also be interesting to determine the impact of corruption on unconventional political participation. Frustrated with the political system, people in corrupt countries might develop apathy toward politicians and political institutions. However, it could also be the case that citizens in corrupt countries become angered and furious with conventional channels of expression and turn to more radical forms of political action such as demonstrations or boycotts. Future research could examine these two hypotheses so as to gain a more comprehensive picture of the influence of corruption on political participation.
Footnotes
Appendix
Countries and Country Years Included in the Analysis
| Country years | |||||||||||
|---|---|---|---|---|---|---|---|---|---|---|---|
| Argentina | 1985 | 1987 | 1989 | 1991 | 1993 | 1995 | 1997 | 1999 | 2003 | 2005 | 2007 |
| Australia | 1984 | 1987 | 1990 | 1993 | 1996 | 1998 | 2001 | 2007 | |||
| Austria | 1986 | 1990 | 1994 | 1995 | 1999 | 2002 | 2006 | 2008 | |||
| Bahamas | 1987 | 1992 | 1997 | 2002 | 2007 | ||||||
| Bangladesh | 1991 | ||||||||||
| Belgium | 1985 | 1987 | 1991 | 1995 | 1999 | 2003 | 2007 | ||||
| Bolivia | 1985 | 1989 | 1993 | 1997 | 2002 | ||||||
| Botswana | 1994 | 1999 | 2004 | ||||||||
| Brazil | 1994 | 1998 | 2002 | 2006 | |||||||
| Bulgaria | 1991 | 1994 | 1997 | 2001 | 2005 | ||||||
| Canada | 1984 | 1988 | 1993 | 1997 | 2000 | 2004 | 2006 | ||||
| Chile | 1993 | 1997 | 2001 | 2005 | |||||||
| Columbia | 1986 | 1991 | |||||||||
| Costa Rica | 1986 | 1990 | 1994 | 1998 | 2002 | 2006 | |||||
| Croatia | 2000 | 2003 | 2007 | ||||||||
| Cyprus | 1985 | 1991 | 1996 | 2001 | 2006 | ||||||
| Czech Republic | 1990 | 1992 | 1996 | 1998 | 2002 | 2006 | |||||
| Denmark | 1984 | 1987 | 1988 | 1990 | 1994 | 1998 | 2001 | 2005 | 2007 | ||
| Dominica | 2000 | 2005 | |||||||||
| Dominican Republic | 1986 | 1990 | 2002 | 2006 | |||||||
| Ecuador | 1984 | 1986 | 1988 | 1990 | 1998 | ||||||
| El Salvador | 1985 | 1997 | 2000 | 2003 | 2006 | ||||||
| Estonia | 1999 | 2003 | 2007 | ||||||||
| Finland | 1987 | 1991 | 1995 | 1999 | 2003 | 2007 | |||||
| France | 1986 | 1988 | 1993 | 1997 | 2002 | 2007 | |||||
| Gambia | 1992 | ||||||||||
| Germany | 1987 | 1990 | 1994 | 1998 | 2002 | 2005 | |||||
| Ghana | 2000 | 2004 | 2008 | ||||||||
| Greece | 1985 | 1989 | 1993 | 1996 | 2000 | 2004 | 2007 | ||||
| Guyana | 1997 | 2001 | |||||||||
| Honduras | 1985 | 1989 | 1997 | ||||||||
| Hungary | 1990 | 1994 | 1998 | 2002 | 2006 | ||||||
| Iceland | 1987 | 1991 | 1995 | 1999 | 2003 | 2007 | |||||
| India | 1984 | 1989 | 1996 | 1998 | 1999 | 2004 | |||||
| Ireland | 1987 | 1989 | 1992 | 1997 | 2002 | 2007 | |||||
| Israel | 1984 | 1988 | 1992 | 1996 | 1999 | 2003 | 2006 | 2009 | |||
| Italy | 1987 | 1992 | 1994 | 1996 | 2001 | 2006 | |||||
| Jamaica | 1989 | 1993 | 2002 | 2007 | |||||||
| Japan | 1986 | 1990 | 1993 | 1996 | 2000 | 2003 | 2005 | 2007 | |||
| Latvia | 2002 | 2006 | |||||||||
| Lithuania | 2000 | 2004 | 2008 | ||||||||
| Luxembourg | 1994 | 1999 | 2004 | ||||||||
| Malawi | 1994 | ||||||||||
| Malta | 1987 | 1992 | 1996 | 1998 | 2003 | 2008 | |||||
| Mexico | 2000 | 2003 | 2006 | ||||||||
| Moldova | 2005 | ||||||||||
| Mongolia | 2004 | ||||||||||
| Namibia | 1994 | 1999 | 2004 | ||||||||
| The Netherlands | 1986 | 1989 | 1994 | 1998 | 2002 | 2003 | 2006 | ||||
| New Zealand | 1984 | 1987 | 1990 | 1993 | 1996 | 1999 | 2002 | 2005 | 2008 | ||
| Norway | 1985 | 1989 | 1993 | 1997 | 2001 | 2005 | |||||
| Panama | 1994 | 1999 | |||||||||
| Peru | 1985 | 2001 | 2006 | ||||||||
| Poland | 1991 | 1993 | 1997 | 2001 | 2005 | 2007 | |||||
| Portugal | 1985 | 1987 | 1991 | 1995 | 1999 | 2002 | 2005 | ||||
| Romania | 1996 | 2000 | 2004 | 2008 | |||||||
| Slovakia | 1994 | 1998 | 2002 | 2006 | |||||||
| Slovenia | 2000 | 2004 | 2008 | ||||||||
| South Africa | 1994 | 1999 | 2004 | ||||||||
| South Korea | 1988 | 1992 | 1996 | 2000 | 2004 | 2008 | |||||
| Spain | 1986 | 1989 | 1993 | 1996 | 2000 | 2004 | 2008 | ||||
| Suriname | 2000 | 2005 | |||||||||
| Sweden | 1985 | 1988 | 1991 | 1994 | 1998 | 2002 | 2006 | ||||
| Switzerland | 1987 | 1991 | 1995 | 1999 | 2003 | 2007 | |||||
| Thailand | 2001 | ||||||||||
| Trinidad Tobago | 1986 | 1991 | 1995 | 2000 | 2001 | 2002 | 2007 | ||||
| Turkey | 1987 | 1991 | |||||||||
| United Kingdom | 1987 | 1992 | 1997 | 2001 | 2005 | ||||||
| Uruguay | 1989 | 1994 | 1999 | 2004 | |||||||
| USA | 1984 | 1986 | 1988 | 1990 | 1992 | 1994 | 1996 | 1998 | 2000 | 2002 | 2004 |
| Venezuela | 1988 | 1998 | |||||||||
| Zambia | 1991 | ||||||||||
