



Abstract
The purpose of the current study was to examine whether the relationship between childhood family income and risk of violent victimization has changed between 1988 and 2007 in Finland, as prior studies have suggested that socioeconomic differences in exposure to violence have increased during the recent decades. Existing studies have mostly relied on survey data, while such trends in hospital discharge data—a data source that covers the total population well and is not compromised by attrition or self-report bias—have not been thoroughly investigated before. The current study used register-based individual-level data from 1988-2007 (n = 283,505) to study changes in the relationship between childhood family income and victimization risk among 15- to 30-year-old Finnish men and women. We found a persisting difference in violent victimization between the top and bottom income quintiles for both men and women. While the estimates suggest that this difference has increased rather than decreased during the observation period particularly among women, this change was not statistically significant. These conclusions remain after controlling for the composition of income quintiles. Research could benefit from more extensive use of administrative hospital records in analyzing of the trends and causes of serious violence.
Introduction
It is a well-established finding that sociodemographic groups are differentially exposed to physical violence. There is a strong relationship between age and risk of violence (Truman, 2011), and interpersonal violence is one of the leading causes of death among young adults worldwide (Blum & Nelson-Mmari, 2004). Many individual-level studies (Aaltonen, Kivivuori, Martikainen, & Sirén, 2012; Harrell, 2012; Nilsson & Estrada, 2006; Thacher, 2004) show that violent victimization is inversely related to contemporaneous measures of socioeconomic status (SES) and income, and lethal violence is particularly concentrated in lower social strata (Kivivuori & Lehti, 2006). The inverse relationship seems to apply to parental SES and children’s risk of violence as well (Engström, Diderichsen, & Laflamme, 2004). However, there is less research available on temporal changes in these associations, as most studies analyzing the association between SES and interpersonal violence have used cross-sectional data.
Some cexisting studies on temporal change in SES–victimization link indicate that socioeconomic differences in exposure to physical violence have increased during the last decades, whereas others do not show clear trends. Studies by Nilsson and Estrada (2003, 2006), Levitt (1999), and Thacher (2004) have used individual-level survey data to examine trends in exposure to violence by level of income in Sweden and in the United States. Nilsson and Estrada (2006) showed that differences between high- and low-income groups in Sweden have increased during 1984-2001, and the increasing relative risk of the poor was found to be especially marked in violence resulting in medical treatment. A rare example of a register-based study on the topic, Nyberg, Schyllander, Stark Ekman, and Janson (2012) found no clear trend in the relationship between welfare recipiency and hospital care due to violence among young people in Sweden between 1990 and 2004, as differences persisted throughout the period. Mother’s low education and living with a single parent were other correlates of violence-related hospitalizations among boys aged 13 to 19. American studies (Levitt, 1999) have given mixed results, but newer analyses suggest that higher income quintiles have benefited more from the overall decrease in levels of violence according to survey-based estimates (Thacher, 2004). In an analysis of a Finnish victimization survey data, Kivivuori (2005) found evidence of increasing differences in the risk of violence by household income in adult population.
According to Finnish national statistics on police-reported violence (Statistics Finland, 2014), homicide (Kivivuori, Lehti, & Aaltonen, 2007), and victimization surveys (Sirén, Aaltonen, & Kääriäinen, 2010), the level of serious violence has remained rather stable during 1988-2007. While the national trends do not show major changes in the incidence of serious violence, such aggregate trends might mask divergent developments in different population groups. Finland witnessed a deep economic recession in the 1990s, and income differences have been growing in the 2000s. At the same time, life expectancy in the lowest income quintile has stagnated since 1990, while life expectancy in other income quintiles has grown steadily (Tarkiainen, Martikainen, Laaksonen, & Valkonen, 2010). As prior studies indicate, there are significant socioeconomic differences in violent victimization in present-day Finland (Aaltonen et al., 2012), and as these differences may have grown during the last two decades (Kivivuori et al., 2007), this issue deserves continued attention.
Research Questions
The aim of this article is to examine trends in hospitalizations among 15- to 30-year-old adolescents and young adults due to interpersonal violence in Finland during 1988-2007, and to see whether the association between family income and violent victimization has changed during that time. Prior studies have mostly used survey data to analyze violence trends. We add to prior research by conducting similar analysis with a large register-based longitudinal sample combined with data on in-patient hospital care due to interpersonal violence. While an inclusive concept of violent victimization can cover different types of verbal and physical violence of varying severity, the measure used in the current study taps into the more serious end of interpersonal physical violence resulting in severe injuries that require hospital treatment. Register-based data cover the population better than surveys and they do not suffer from recall bias or non-response. Thus, we should also reach the most disadvantaged families and individuals. The Finnish Hospital Discharge Register covers all institutions providing hospital-level care in Finland, and the coverage and accuracy of the data are considered to be good for research purposes (Sund, 2012). These data remain underused in research on violence (Estrada, 2006; Nyberg et al., 2012; Sivarajasingam, Shepherd, Matthews, & Jones, 2003) despite their many advantages.
Existing studies have mostly used current personal or household income as the measure of income. Although a contemporaneous measure of income describes the current economic situation well, selection mechanisms might confound the association between income and victimization. It is evident that violence and injuries can have a negative impact on later earnings (MacMillan, 2006). On the other hand, it is well established (Lauritsen & Laub, 2007) that criminal behavior is a major risk factor for violent victimization, and there is an overlap between offender and victim populations. If criminal behavior and sanctions have affected current income, we might indirectly measure the association between offending and victimization rather than income and victimization. To make the inference more robust for such selection effects, we focus on the association between household income in the family of origin and violent victimization among 15- to 30-year-olds. We use income as the measure for SES instead of occupation-based social class or education because its (quintile) distribution can be kept equal throughout the observation period. We further assess whether the possible change in the association of childhood family income and victimization is related to compositional changes between the income groups over time.
Data and Method
We obtained the data from the Statistics Finland Labor Market data file covering the whole Finnish population for the period 1987-2007. Due to data-protection regulations concerning living individuals, Statistics Finland provided only an 11% sample of the whole data set. To gain more statistical power, we obtained an oversample of those who died between 1988 and 2007—for whom the data-protection regulations are less strict—and thus covered 80% of all deaths in this period. To take the sampling design into account, we used sampling weights constructed from the respective sampling probabilities (i.e., those who died during the period were weighted downward by approximately 0.27 and those who survived were weighted upward by approximately 1.96). Our sample was linked to hospital discharge records and death records in the period 1988-2007, and census data from the years 1970-2007 by using personal identification codes (Permission TK-53-1519-09). From 1987 onwards, the data are updated annually, and before that data are available from the census years 1970, 1975, 1980, and 1985.
For each year in 1988-2007, we included members of the Finnish population aged 15 to 30 years on the last day of the previous year, altogether 295,507 individuals, and measured childhood predictors at the last census when the individuals were aged less than 15 years. We excluded those whose childhood circumstances could not be measured—that is, who were not resident in Finland during the latest census when they were less than 15 years of age (n = 11,956), and further excluded a small group of individuals whose information on childhood income was missing (n = 46). Furthermore, those not living with either of their parents (referred as “not living a family” in the text), that is, children in institutional or substitute care, were analyzed separately (n = 5,896).
The final sample comprised 283,505 individuals who were followed up yearly and whose follow-up times were censored at the end of each year or at date of death. The unweighted data included 2,422,449 person-years.
Measurement of Violent Victimization
Our outcome measure was the yearly number of injuries from interpersonal violence resulting in hospital care or death. Hospital care included episodes with a diagnosis of injury (International Classification of Diseases [1975, ICD9]: 800-995 [years 1988-1995]; International Classification of Diseases and Related Health Problems [1990, ICD10]: S00-T79, T90-T98 [years 1996-2007]) in which the external code indicated interpersonal violence as the cause (ICD9: E960-E969; ICD10: X85-Y09, Y87.1). Deaths due to interpersonal violence (ICD9: E960-E969, ICD10: X85-Y09, Y87.1) were included as separate events if they were not immediately preceded by a hospital care episode and thus not captured by the hospital data. As deaths due to interpersonal violence not preceded by hospital care were scarce (17% of all events), we will refer to our outcome measure as hospital care episodes for interpersonal violence.
Measurement of Childhood Income
Childhood household taxable income included incomes of all household members at the last census when the individual was less than 15 years old. Information on wages and salaries, entrepreneurial income, and other income such as pensions, unemployment benefits, and some of the other social security benefits came from the registers of the Finnish Tax Administration. We adjusted the measure for household size and composition by dividing combined income by the number of consumption units using the Organisation for Economic Cooperation and Development (OECD) -modified scale (Hagenaars, de Vos, & Zaidi, 1994). The first adult in the household counted as one consumption unit; all others above 13 as 0.5 and all below 14 as 0.3 of a unit. In the analysis, we used income quintiles with cutoff points calculated separately for each of the census years including only those living in a family and aged less than 15 years in that census year.
Measurement of Other Sociodemographic Covariates in Childhood and Early Adulthood
Childhood SES and family composition were also measured at the last census when the individual was aged less than 15 years. Childhood SES was based on information about the occupation of the head of the parental household recorded at the measurement point or searched from earlier censuses if the reference person was economically inactive. Childhood SES comprised groups of (a) upper non-manual, (b) lower non-manual, (c) manual, and (d) other. Individuals were classified into groups of childhood family composition depending on whether they had lived with (a) married parents, (b) cohabiting parents, or (c) a single parent.
Own education, age, and region of residence were measured yearly on the last day of the previous year. Own education was based on information about the highest completed qualification or degree, and was classified into groups of (a) upper secondary education or higher (at least 12 years), (b) vocational education at the secondary level (11-12 years), and (c) basic education (up to 9 years of compulsory schooling). Age was grouped into 15 to 19, 20 to 24, and 25 to 30 years old. Individual’s own region of residence comprised 21 regions following the official division of regions in Finland that largely corresponds to Finnish hospital districts.
Statistical Analysis
We first calculate annual age-adjusted victimization rates (3-year moving averages) in 1988-2007 by sex and income quintile using the sum of person-years in the whole period as the standard. In the rest of the analyses, we compared two 7-year periods from opposite ends of the 20-year study period (1988-1994 and 2001-2007) to overcome the high annual variation and relative rarity of the outcome at the population level. The chosen periods were also not affected by the change from 9th to 10th revision of ICD that resulted in severe underreporting of violence-related care episodes during 1996-1998 (Haikonen, Lunetta, Lillsunde, & Sund, 2013; Lunetta, Impinen, & Lounamaa, 2008).
Given that our outcome variable is a count of hospital care episodes (and in some cases death) per person-years, we used Poisson regression models to analyze the association between income and victimization. The results are reported as incidence rate ratios (IRR) with 95% confidence intervals. We clustered standard errors on individuals to control for within-individual correlation. As our outcome variable includes repeatedly measured events, variation between individuals in the total count of events within a period may affect the results. However, almost 90% of all events in both periods were from different individuals. We also ran the analyses with an outcome measure that captured only the first event of an individual within a period, and this change did not change the results in any significant way.
We fitted age-adjusted models with family income as the only predictor over the two periods, first with the highest income quintile in the first period as the reference, then with the highest income quintile in the second period as the reference. This enabled us to assess both absolute and relative change in victimization rates. In these models, we also included those living outside a family as their own group. They were dropped from subsequent models as the information about family of origin was missing. Compositional models include additional predictors that might explain the possible change in the association between family income and victimization. In these models, the temporal change in the association between income and interpersonal violence was tested with interactions terms for Family income quintile × Period.
Results
Trends in Hospital Discharges for Interpersonal Violence 1988-2007
Figure 1 plots yearly rates of hospital care episodes for interpersonal violence as age-adjusted 3-year moving averages between 1988 and 2007 separately for men and women. First, the effect of ICD-change (Lunetta et al., 2008) is visible during 1996-1998, where there is a clear decline in rates of violence. We believe that this is caused mostly by changes in data quality, not actual changes in incidences of violence. Excluding these years, the rates of violence are stable. When the trends are broken down by family income (Figure 1), the differences in violence rates by income quintile are visible throughout the observation period, despite substantial year-to-year variation. Young men and women from families with lower income are at an increased risk of hospital-treated injuries due to interpersonal violence.
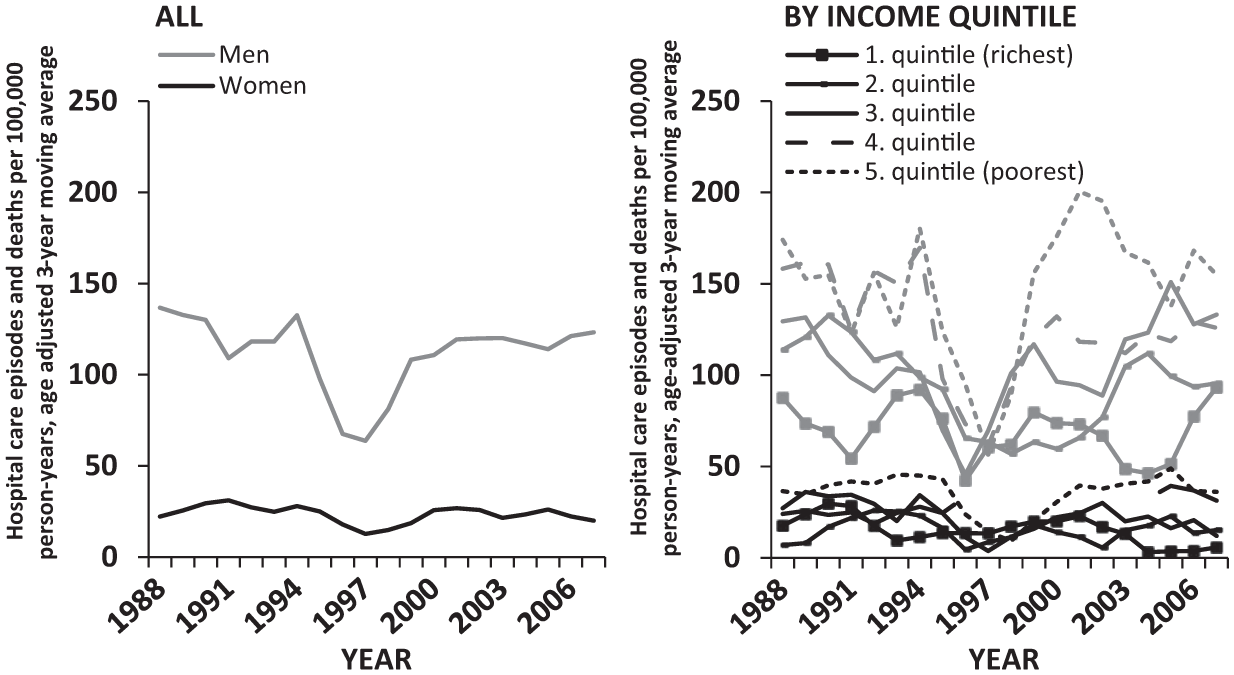
Hospital care episodes and deaths due to interpersonal violence per 100,000 person-years (age-adjusted 3-year moving averages) by year and childhood income quintile, males (gray lines) and females (black lines) aged 15 to 30 years in 1988-2007.
Poisson Regression Model 1988-1994 versus 2001-2007
The first models (Table 1) show the association between childhood income quintile and violence-related hospital care separately for men and women, using the 1988-1994 highest quintile as the reference group. In the first period, IRR in the lowest quintile is 81% higher than in the richest quintile for men. When compared with the richest quintile in the first period, the IRR of the poorest quintile in the second period is 2.07, indicating some increase. However, we can also see that the relative risk of the richest quintile dropped to 0.83 compared with the first period. When compared with richest quintile in the first period, the relative risk of poorest quintile remained the same (2.09) for women in both periods. However, the relative risk of the richest quintile in the second period is only 0.53 compared with the first period.
Age-Adjusted IRR With 95% CIs for Hospital Care and Deaths Due to Interpersonal Violence by Childhood Income Quintile in 1988-1994 and 2001-2007, Males and Females Aged 15 to 30 Years.

Note. IRR = incidence rate ratios; CI = confidence interval.
Reference group: the 1st quintile in the 1st period.
Reference group: the 1st quintile in the 2nd period.
p < .05. **p < .01. ***p < .001.
The second model shows the differences between income quintiles within the same periods. These models indicate that differences between income quintiles have grown for both men (1.81-2.51) and women (2.09-3.95). Especially for women, this change in relative differences between quintiles is related to a decreasing rate of violence in the richest quintile. The joint tests for interaction terms, however, are not significant for either men or women. We fail to find proof that the relative increase in the risk of violence between income quintiles is statistically significant in these models. Thus, while the estimates point to increasing differences between income quintiles, these changes are not large enough to be statistically significant. The only significant interaction term pertains to men not living in a family. While the living standards of the group “not living in a family” are unknown, the findings on the relative risk of this group support the claim that some divergence in the risk of violence has taken place; for men, IRR for those not living in a family increased from 3.30 to 9.29, for women from 1.59 to 5.57.
Poisson Regression Model With Compositional Effects
The prior models indicate that the rates of violent victimization diverged between opposite ends of income distribution during the 20-year observation window, although for most part this divergence did not reach statistical significance. The observed indications of slight divergence in the estimates for income might reflect changing composition of the income quintiles: If the poorest quintile now includes a greater share of individuals with other risk factors related to violent victimization, such as coming from a single-parent family, the change in the estimates of income might only reflect these changes. Next, we examine whether the composition of richest and poorest income quintiles has changed during the follow-up time and whether such changes have affected the association between income and violent victimization.
Table 2 shows the distribution of parental SES, family composition and child’s education in richest and poorest income quintiles. As expected, the quintile compositions are different: The richest quintile has a higher SES, fewer single parents, and the children have a higher education. These compositions have also changed somewhat in 1988-2007, and the between-period differences in the compositions of income quintile are statistically significant (p < .001) by all examined variables. Regarding SES, there are more upper and lower non-manual families in the poorest quintile in the second period, and fewer manual workers. The share of upper non-manual class has increased even more in the highest quintile. The changes in family composition are the clearest. The share of married parents in the poorest quintile has decreased by 15 percentage points, whereas the roughly third of children from families with the lowest income also have single parents. While there are similar changes in the richest quintile, they are much smaller in magnitude. The proportion of children with upper secondary degrees has increased in both ends of income distribution, but the proportion of children with only basic education has increased only in the poorest quintile.
Distribution of Person-Years (%) by Compositional Factors in the Richest and in the Poorest Childhood Income Quintile in 1988-1994 and 2001-2007, Males and Females Aged 15 to 30 Years.
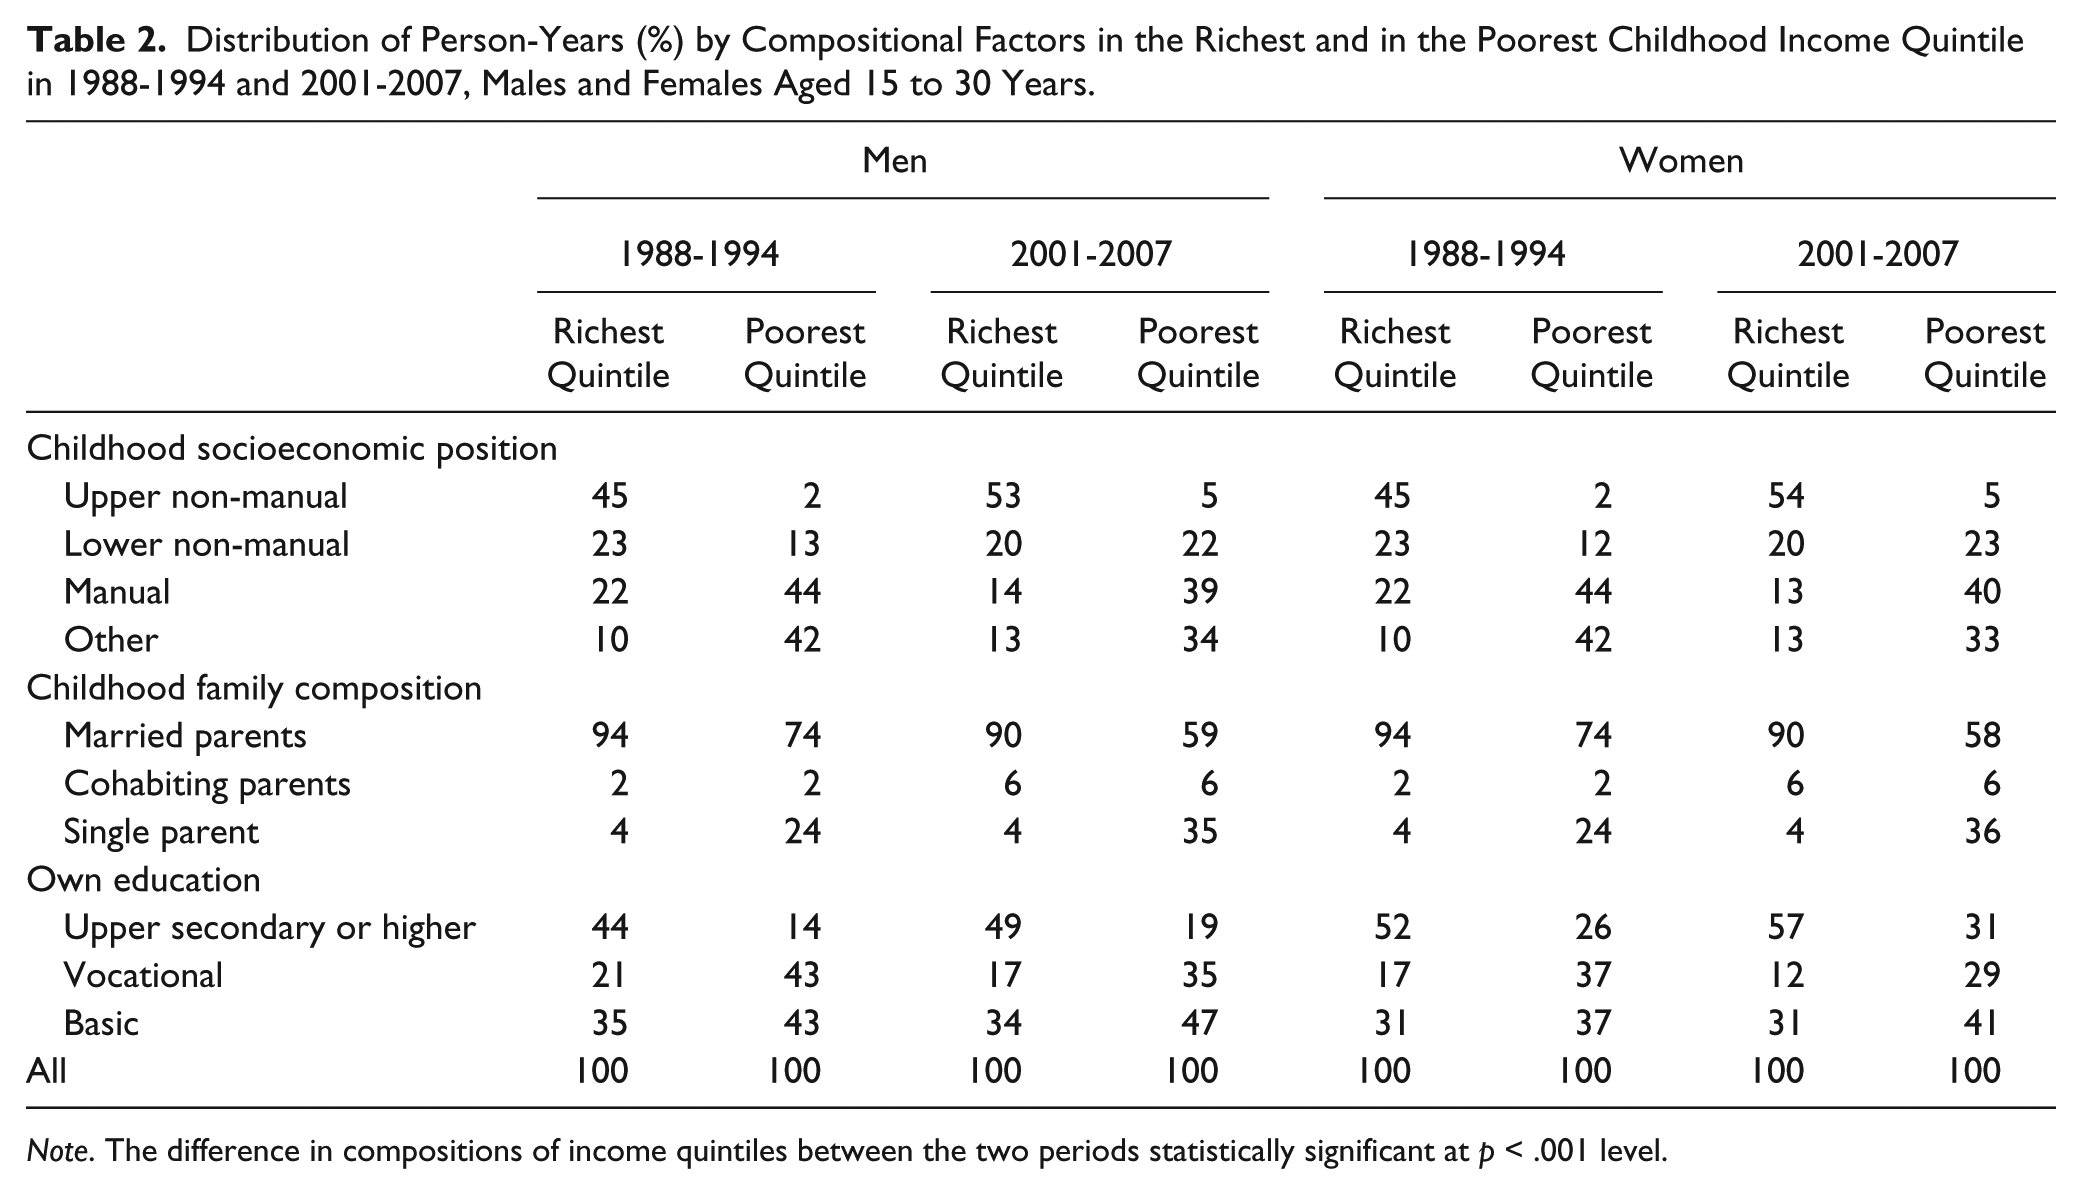
Note. The difference in compositions of income quintiles between the two periods statistically significant at p < .001 level.
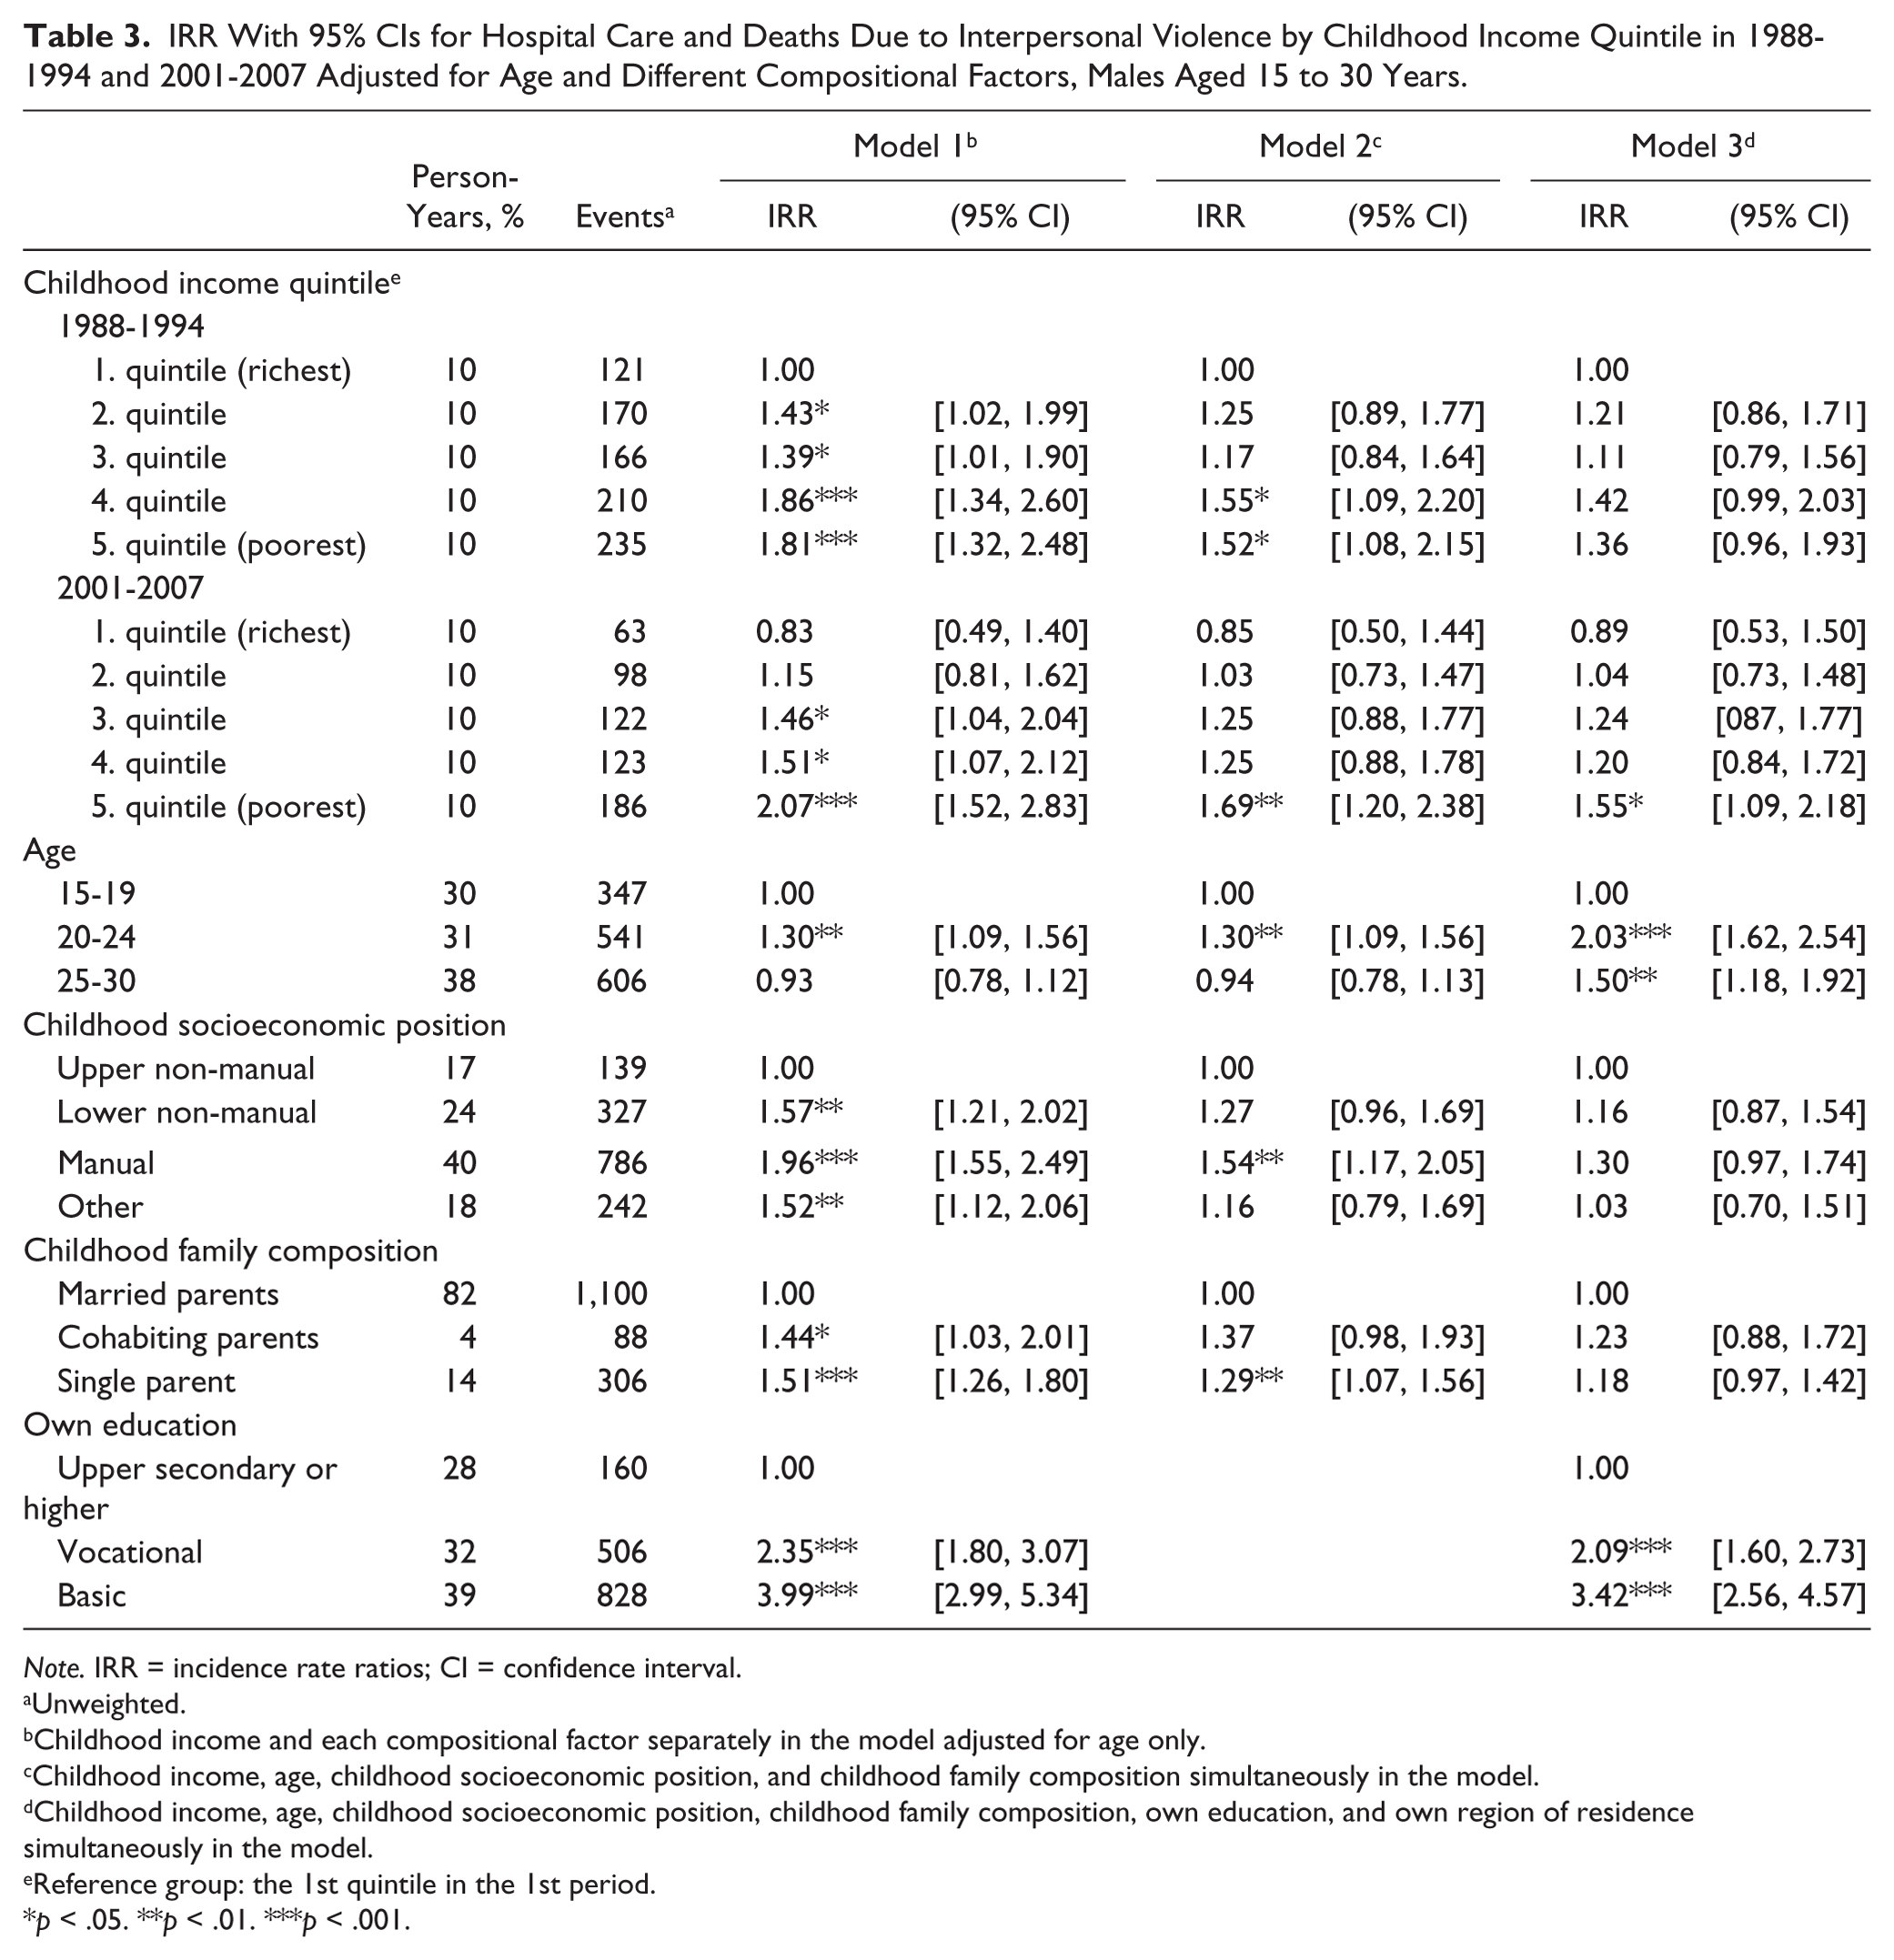
Model 1 in Table 3 shows the age-adjusted IRRs for the different compositional factors for males, Table 4 for females. Looking at the age-adjusted crude estimates in Model 1, childhood socioeconomic position, family composition, and child’s educational level predict interpersonal violence for both men and women. Children with married parents from upper non-manual households have the lowest risk of violence, whereas the association between personal educational attainment and interpersonal violence is especially strong for women (IRR 6.62, for men 3.99).
IRR With 95% CIs for Hospital Care and Deaths Due to Interpersonal Violence by Childhood Income Quintile in 1988-1994 and 2001-2007 Adjusted for Age and Different Compositional Factors, Males Aged 15 to 30 Years.
Note. IRR = incidence rate ratios; CI = confidence interval.
Unweighted.
Childhood income and each compositional factor separately in the model adjusted for age only.
Childhood income, age, childhood socioeconomic position, and childhood family composition simultaneously in the model.
Childhood income, age, childhood socioeconomic position, childhood family composition, own education, and own region of residence simultaneously in the model.
Reference group: the 1st quintile in the 1st period.
p < .05. **p < .01. ***p < .001.
IRR With 95% CIs for Hospital Care and Deaths Due to Interpersonal Violence by Childhood Income Quintile in 1988-1994 and 2001-2007 Adjusted for Age and Different Compositional Factors, Females Aged 15 to 30 Years.

Note. IRR = Incidence rate ratios; CI = confidence intervals.
Unweighted.
Childhood income and each compositional factor separately in the model adjusted for age only.
Childhood income, age, childhood socioeconomic position, and childhood family composition simultaneously in the model.
Childhood income, age, childhood socioeconomic position, childhood family composition, own education, and own region of residence simultaneously in the model.
Reference group: the 1st quintile in the 1st period.
p < .05. **p < .01. ***p < .001.
Controlling for compositional factors does not seem to matter for the conclusions made about the association between income and victimization; even though the difference between 1. and 5. quintile attenuates when controlling for compositional factors, the relative difference between highest and lowest quintiles appears larger in the later period in Model 2, as well. For males, the higher risk associated with 5. quintile remains significant in both periods, whereas for women none of the associations between income and victimization remain significant. Like before, the interaction terms between income quintile and period are not significant, and our conclusion of no meaningful temporal change in the association between income and victimization remains.
When we additionally control for education in Model 3, conclusions remain essentially similar. Given that the coefficients for family factors are attenuated when controlling for personal education, the implication is that education partly mediates the effect of family characteristics.
Discussion
Using a high-quality nationally representative register-based sample of 15- to 30-year-old adolescents and young adults from 1988-2007, we found evidence of persisting differences in the risk of violence between youth and young adults from high- and low-income families. While the parameter estimates suggest that the excess risk of violent victimization among young men and women from families in the lowest income quintile was more pronounced in 2001-2007 than in 1988-1994, this change does not reach statistical significance. While other factors related to differences between high- and low-income families may affect the risk of violence, compositional sociodemographic changes in the income quintiles did not appear to affect the association between income and violent victimization any differently between the two periods, as the relative differences between high- and low-income groups decreased similarly after adjusting for these compositional factors.
Prior survey-based estimates have suggested that there was a twofold difference between highest and lowest income quintiles in the risk of victimization in the United States at the turn of century (Thacher, 2004). Interestingly, despite using a more extreme operationalization of violence and parental income in adolescence as the key independent variable, our data suggest that these differences were of largely similar magnitude in 1988-1994 in Finland, but somewhat larger at the end of the follow-up. Although these changes are not statistically significant, the point estimates suggest that a decrease in the risk of violent victimization among those in the higher income quintiles may have taken place both in contrast to high-income women in the earlier period and low-income women in the same period. This result was supported with an additional finding indicating the relative risk of victimization of those outside families had increased statistically significantly between the two periods among men. While this group might be heterogeneous in terms of family background, it is plausible to argue that some of the most disadvantaged youths belong to this group (Kalland, Pensola, Meriläinen, & Sinkkonen, 2001).
Of the analyzed variables, having only a basic education is the strongest predictor of victimization for men and women, replicating findings from earlier studies with Finnish data (Aaltonen et al., 2012). Our findings show that children from less advantaged backgrounds are more likely to end up with lower education, which may increase their risk of violent victimization. While it is plausible that personal educational attainment is a more important and proximal predictor of risk of violence than family characteristics, it is also possible selection mechanisms (Caspi, Elder, & Bem, 1987; Savolainen et al., 2013) create a partly spurious association between education and the risk of violence.
Limitations
Like all studies on violent victimization, the current study has its limitations. Given that the data cover a relatively long period, practices in hospital care may have changed so that increasing numbers of cases are now treated in out-patient rather than in-patient care. On the other hand, the aggregate trends of serious violence observed in the current data correspond well with other measures of serious violence. Even though underreporting of external cause codes in Finnish hospital discharge data is known (Lunetta et al., 2008), it is still considered a reliable source for analyzing long-term patterns of violence and injury as long as its limitations are taken into account (Estrada, 2006; Haikonen et al., 2013).
Furthermore, it would be good to have more information about childhood living conditions of those individuals outside families, as they were shown to have the highest risk of victimization. Because in-patient hospital care for violence is a rare outcome on population level, even a large data set such as ours has relatively low power and produces rather wide confidence intervals. What is more, interpretation and significance of statistical interaction depend on the model used and whether absolute or relative differences between groups are examined. Significant interaction in (non-linear) Poisson models requires a departure from multiplicativity, whereas additive interaction is enough in a linear regression model (Kendler & Gardner, 2010). Regarding effect sizes, we would have probably witnessed stronger associations if we had measured current personal income instead of family income in the past. However, the adopted strategy provides better protection against reverse causality, as the measurement of family income precedes the measurement of violent victimization. Despite this, it is still possible that the income-victimization association is not of causal nature, but instead related to other familial risk factors (Sariaslan, Larsson, D’Onofrio, Långström, & Lichtenstein, 2014).
Given that violence remains a difficult phenomenon to measure in one superior way, keeping all the available indicators—surveys, police data, and hospital data—in the toolbox seems warranted. In addition to aggregate-level comparisons of trends in violent crime, individual-level analysis that explicitly compare different sources of data as the victimization outcome would be welcome (Aaltonen et al., 2012). These kinds of comparative studies could help make the inferences made from one data source more systematic in relation to alternative data sources. For instance, it would be interesting to know the extent of overlap between police-reported cases and hospital care, and more importantly, which victims in hospitals never reach the attention of police. As different data sources should not even be assumed to lead to the same results (e.g., because they capture violence of different types and severity) such analyses are also likely to improve our understanding of the way social factors influence victimization.
Conclusion
Prior studies on the divergence in risk of violence by SES or income have given mixed results. On balance, the available evidence (Nilsson & Estrada, 2006; Thacher, 2004) suggests increasing rather than decreasing differences between income quintiles in the United States and Nordic countries. While our study provides some support for this conclusion, the overall picture presented by this analysis is one of stability rather than change. However, if the diverging trend suggested by the yet insignificant estimates is real, the developments in Finland would seem to mirror those in the United States and in Scandinavia. More research with complementary data is needed to uncover whether such trend actually exists. In any case, our findings are consistent with a broader literature on social inequalities in health and mortality (Elo, 2009) that show consistent and persistent differences across time and place.
Regarding the macro context, it would be interesting to see whether the violence risk in income quintiles is differentially impacted by economic downturns, since Lauritsen and Heimer (2010) showed that the U.S. trends of victimization in 1973-2005 more closely followed economic conditions among non-Whites, whereas the victimization rates for Whites did not display similar concordance with economic downturns. A decrease in crime rates over the last couple of decades has been reported throughout the Western world and the causes for this drop have been debated extensively (Baumer & Wolff, 2014). There is clearly a need to better understand how different sociodemographic groups have benefited from this drop, and whether, for example, improvements in security technologies and services (Farrell, Tilley, Tseloni, & Mailley, 2011) have helped all groups equally. More studies with individual-level data are needed to answer these questions.
Even though no major divergence in the risk of violence between socioeconomic groups may have taken place, one implication of our study is that violence prevention needs to focus on disadvantaged groups that continue to have a higher risk of violence even in a relatively egalitarian Nordic context. Our study showed that parental background and person’s own level of education, obtained relatively early in the life course, are important social determinants of violent victimization. Being a victim of violence in adolescence and early adulthood may have serious long-term consequences extending beyond the direct effects of sustaining a physical injury (MacMillan, 2006). Thus, violent victimization during youth and early adulthood is likely to be one mechanism that contributes to the adverse outcomes observed for the children coming from most disadvantaged backgrounds later in life. When serious violent victimization in hard-to-reach disadvantaged populations is studied, hospital discharge data could be a valuable resource that has so far been used sparingly in victimological research.
Footnotes
Declaration of Conflicting Interests
The author(s) declared no potential conflicts of interest with respect to the research, authorship, and/or publication of this article.
Funding
The author(s) disclosed receipt of the following financial support for the research, authorship, and/or publication of this article: This study was funded by the National Research Institute of Legal Policy and the Academy of Finland.