
Abstract
This study aims to examine the linkages between renewable energy consumption (REC), nonrenewable energy consumption (NREC), carbon dioxide (CO2) emissions, and economic growth in emerging Asian countries during the period 1975–2020 using a panel augmented mean group (AMG) estimation technique. The results of the long-run coefficient elasticity show that REC, NREC, employed labor force, and capital formation contribute significantly to long-run economic growth. The research analysis also found that NREC significantly increases long-term carbon emissions while REC significantly reduces long-term carbon emissions. Moreover, gross domestic product (GDP) and GDP3 have a significant positive impact on environmental degradation while GDP2 has a significant adverse impact on environmental pollution, thus validating the N-shaped Environmental Kuznets Curve (EKC) hypothesis in selected emerging Asian economies. The country-wise AMG strategy points out that India and Bangladesh have no EKC hypothesis, China and Singapore have an inverted U-shaped EKC hypothesis and Japan and South Korea have an N-shaped EKC hypothesis. Empirical evidence from Dumitrescu and Hurlin's causality test shows a two-way causality between REC and economic growth, supporting the feedback hypothesis. Strategically, this study suggests that more renewable energy is a viable strategy to address energy security and reduce carbon emissions to protect the environment and boost future economic growth in selected emerging Asian countries.
Keywords
Introduction
Carbon dioxide (CO2) has had a massive 88% growth trend over the past decade, continuing from 25 million kilotons (MKT) in 1990 to 40.84 MKT in 2020. 1 The energy crisis and rising CO2 emissions are issues that are currently brewing. The chief culprits of global warming and environmental pollution are nonrenewable energy sources such as cold energy, oil, and natural gas.2,3 The basic premise of sustainable adjustment of total energy utilization is to construct sustainable energy through solar energy, geothermal energy, wind energy, and biomass energy.4,5 In an era of denationalization and globalization, it is clear that economic development in emerging economies is heavily dependent on energy use.6,9 Abundant renewable and nonrenewable energy sources are the main cause of job creation, industrial growth, income growth, and output growth across the economy.10,11 Many qualities of sustainable energy have been noticed, and the continuous upward trend of carbon emissions leading to rising temperatures and global ecological imbalance has made people enthusiastic about sustainable energy. Since the past decade, many researchers have contributed to the literature on sustainability, energy consumption, and economic growth, and the relationship between environmental pollution and per capita growth is the main Environmental Kuznets Curve (EKC) hypothesis. Ecological pollution escalates with economic growth until it reaches a certain threshold, a phenomenon recognized by Wawrzyniak and Doryń, 12 Ouyang et al., 13 Adedoyin, Alola and Bekun, 14 and Khan et al. 15 Pollution rises sharply as the country level develops, but begins to worsen after hitting the turning point of the Kuznit U-curve. This empirical evidence profoundly demonstrates the stable control of renewable energy use and state structures. Tang, Peng, and Xu 16 propose that the core determinant of growth is the productive and efficient use of energy consumption.
The literature presents multiple panel studies on the theme, but omits the panel studies on emerging Asian countries, Bangladesh, China, Korea, Japan, Singapore, and India. Moreover, most of the earlier research looked at the linkages of total energy consumption, rather than renewable and nonrenewable energy sources, so considering the relationship between renewable and nonrenewable energy consumption (NREC) and growth would be a distinctive contribution to the current literature. Liu, Kong, and Zhang 17 revealed that energy use and urbanization contribute to long-term environmental degradation, while economic growth reduces long-term environmental pollution in emerging Asian countries, China, Japan, Korea, Mongolia, and Russia. Likewise, another study by Chapman, Fujii, and Managi 18 explored that economic growth stimulated environmental degradation in South Korea and China, reduces environmental degradation in North Korea and Russia, and moderately increases environmental damage in Mongolia and Japan. Similarly, Nosheen, Iqbal, and Khan 19 explored the significant positive impact of economic growth and total energy use on environmental pollution in selected Asian countries (Philippines, Vietnam, Singapore, Malaysia, and Indonesia). Thus, comparing the above findings with the results to be explored in this study is the main purpose of this study. 40% of total energy use and 43% of carbon emissions are the main goals of emerging Asian countries (Bangladesh, India, South Korea, China, and Japan), and it is for these goals that this panel of countries was selected for this study. Given the continuing upward trend in the cost of imported energy, attention is gradually turning to energy consumption. Over the past 40 years, selected emerging Asian countries, notably China, South Korea, and Japan, have seen substantial increases in fossil fuel use, and these countries are often unique contributors to CO2 emissions, greenhouse gas emissions, and other sources.
On the research front, this study has three objectives, the first is to examine the correlation between renewable and NREC and economic growth. This link is expected to be observed in aggregate output reflecting economic growth dependent on renewable and nonrenewable energy sources, with increased consumption of both sources accounting for higher growth. Most of the earlier research looked at the linkages of total energy consumption, rather than renewable and nonrenewable energy sources, so considering the relationship between renewable and NREC and growth would be a distinctive contribution to the current literature. Exploring the relationship between renewable and NREC and carbon emissions is the second part of the study. Carbon emissions in selected countries are likely to worsen or intensify with the consumption of renewable and nonrenewable energy. Examining the correlation between economic growth and carbon emissions is the third part of this study. Finally, the legitimacy of the EKC assumptions for selected emerging Asian countries for the period 1975–2020 can be assessed (Figure 1).
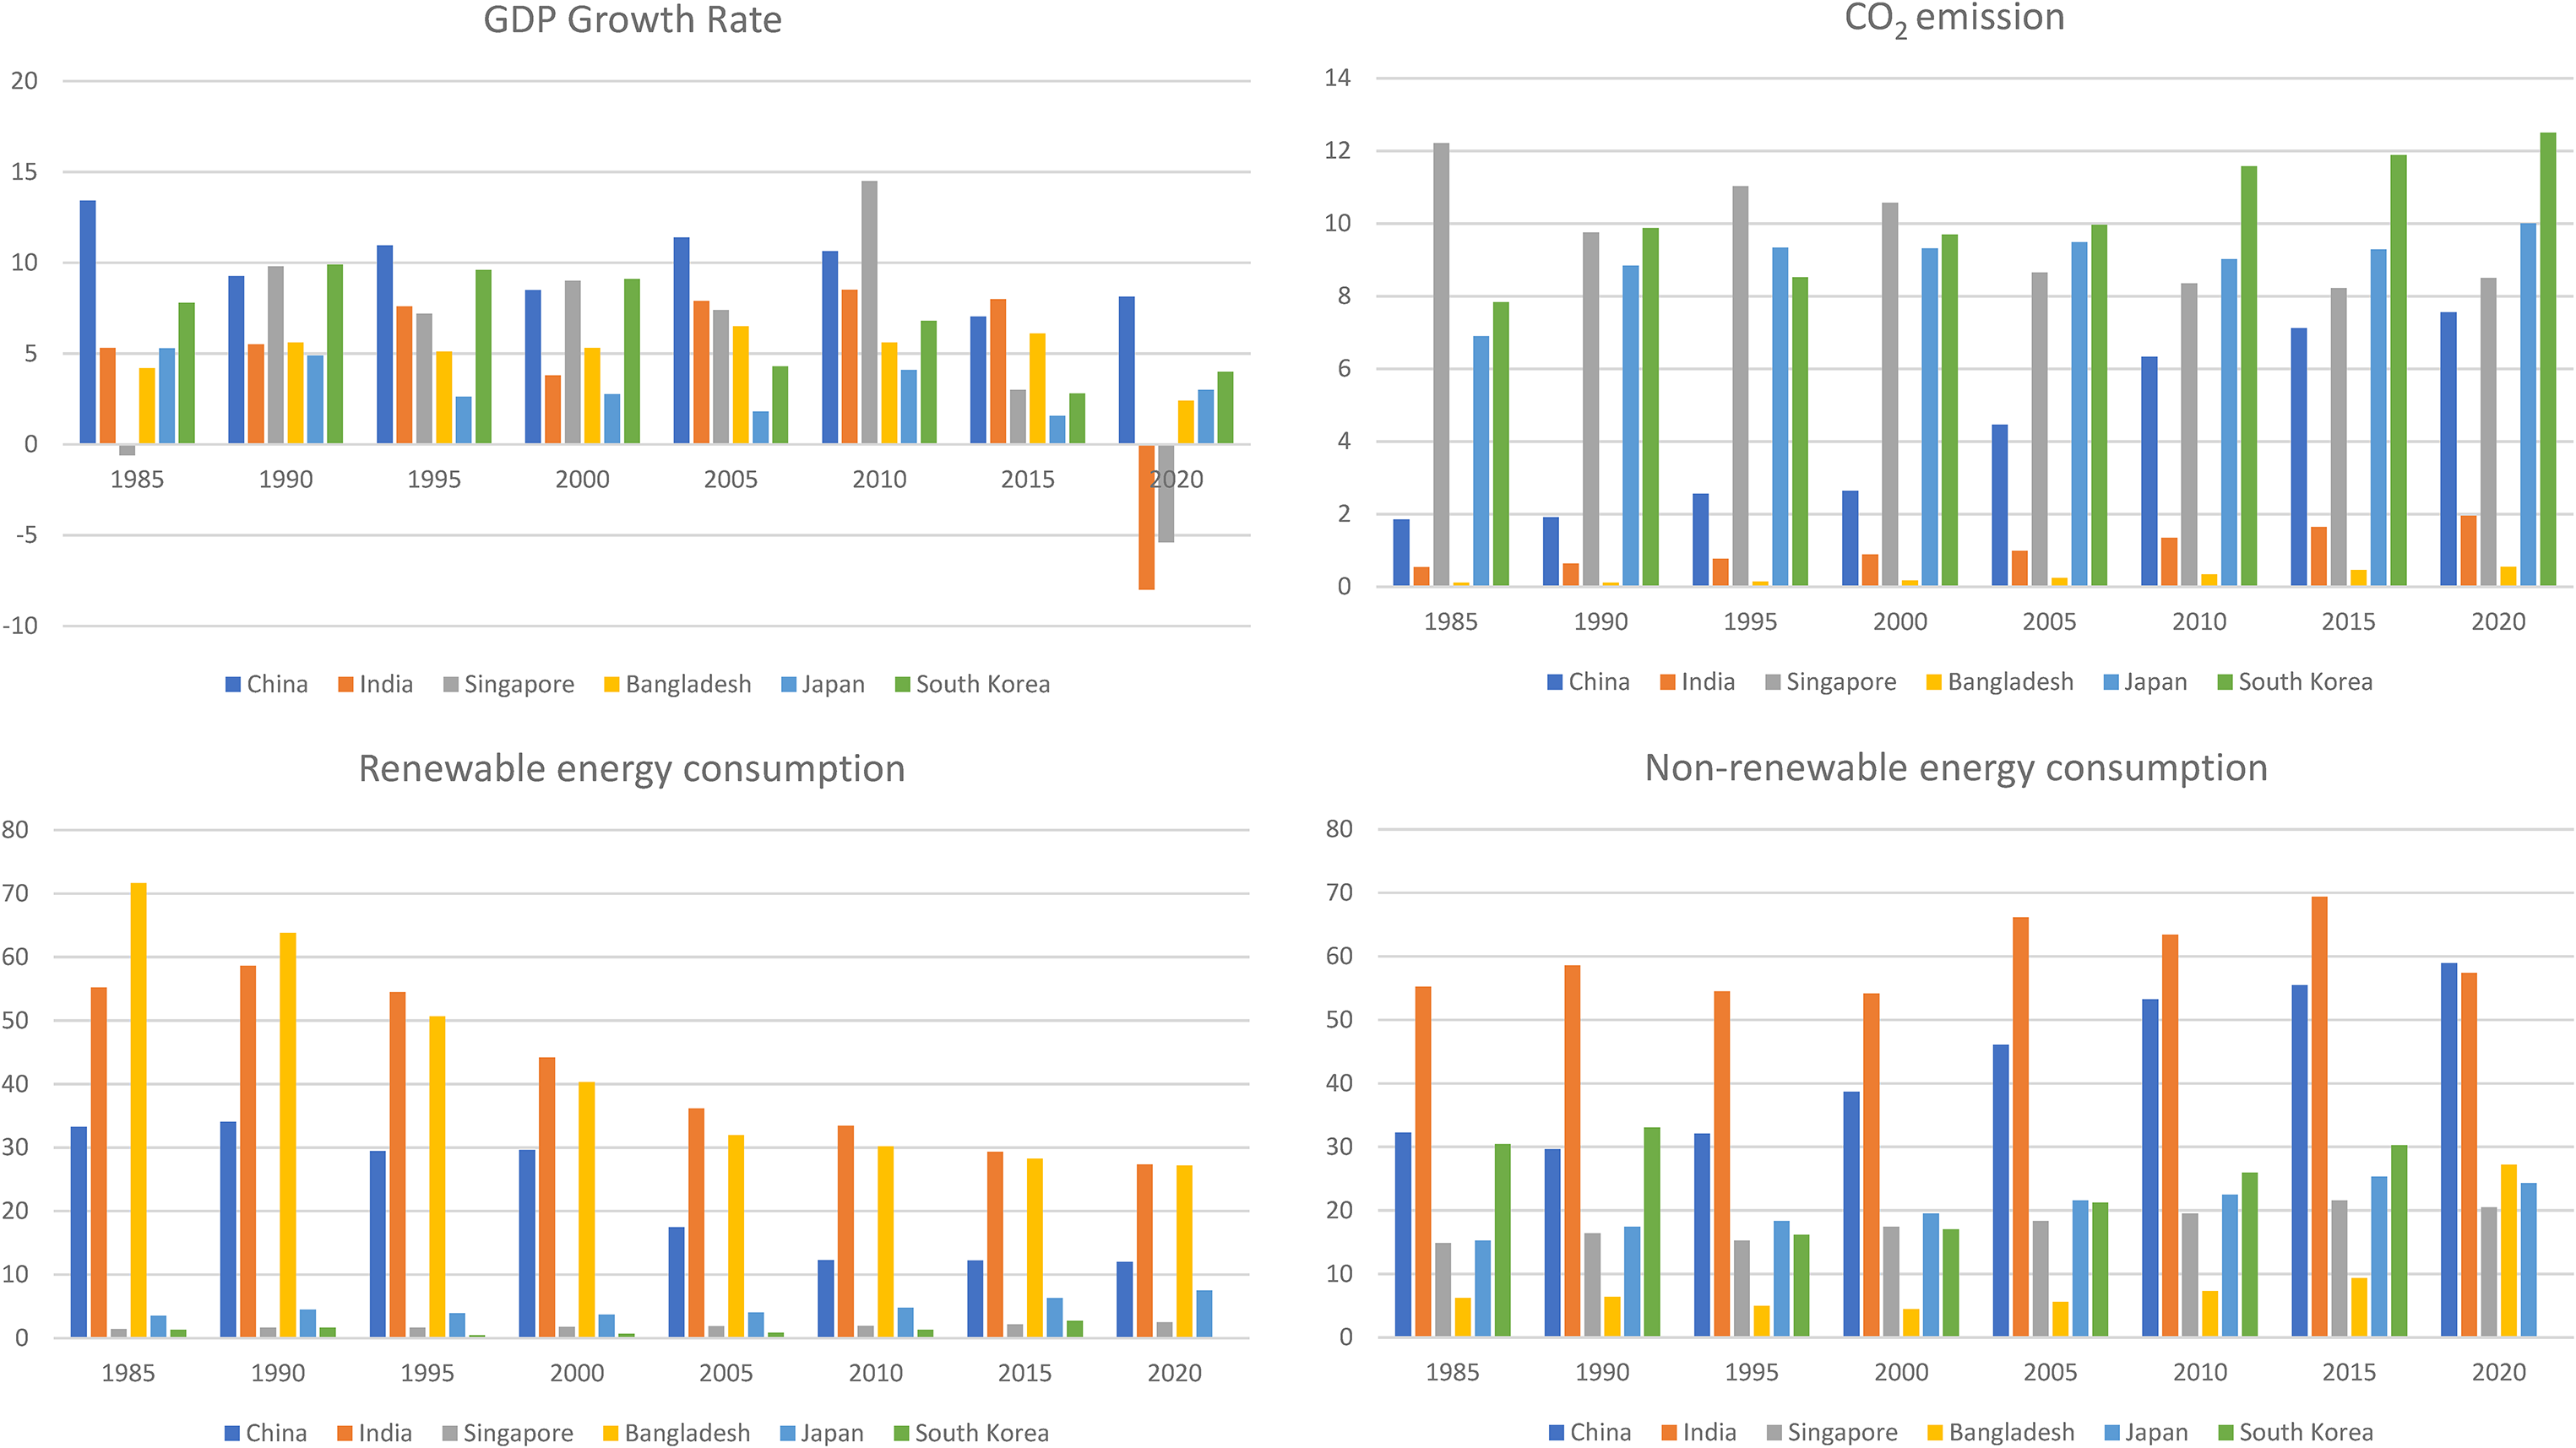
The usage of renewable energy consumption (REC), nonrenewable energy consumption (NREC), economic growth, and carbon dioxide (CO2) emission in emerging Asian countries.
Given the important scenarios for growth and renewable energy use, it is decisive to vigorously maintain the network between renewable energy use, nonrenewable energy use, and economic growth. This connotation may add to the literature on energy economics and sustainable energy futures. Therefore, the strategic contributions of the current study are highlighted as (1) Most of the earliest research looked at the link between total energy consumption, environmental pollution, and economic growth, but few identified the differential effects of renewable and NREC on growth and environment. Through the opening provided by this disaggregation, it is possible to understand the relative potential of the two energy sources in the process of growth. (ii) This will be the only study to focus on Asia's emerging countries, with the latest data providing key insights for regional policy makers. (iii) This study reports possible variable bias errors in a multivariate framework by adding the three dimensions of renewable energy, NREC, and CO2 emissions to the neoclassical production function of capital and labor. (iv) Testing the validity of the EKC hypothesis for emerging Asian countries will be the first to be examined in this study. (v) Cross-sectional correlation tests can be used to detect cross-sectional correlations in panel data variable models. Augmented mean group (AMG) estimation is the best strategy, which produces more robust results than traditional methods and overcomes the problems of cross-sectional dependence and country-specific heterogeneity. In addition, the AMG estimator can provide country-specific results, helping to achieve more full policy-oriented goals, which is the main advantage of this method. (vi) The two-way causality of the variables in this study can be explored with the Dumitrescu and Hurlin 20 panel causality test, which also addresses cross-sectional dependence.
Literature review
The real sources of energy and growth are natural resources; however, the consumption of renewable and nonrenewable energy is a fundamental factor in measuring economic growth. 21 Ambec et al. 22 publicly calls for environmental economists to investigate research on hypothesis about energy–growth relationships. Meanwhile, Bilgili, Koçak and Bulut, 23 Yilanci et al., 24 Shakeel, 25 Mighri and Ragoubi, 26 Ahmad et al., and 27,28 Doğan, Balsalobre-Lorente and Nasir 29 in their seminal work on hypothetical research on the growth–energy relationship proposed four hypotheses (growth, feedback, conservation, and neutral). The growth hypothesis refers to a one-way causal relationship from energy consumption to economic growth. From this perspective, expanding energy use broadly contributes to economic growth, leading to increased productivity and sustainable infrastructure. The second conservative assumption represents a one-way causality from economic growth to energy use, while the third feedback assumption is a two-way causality from energy use to economic growth and from economic growth to energy use. From the perspective of the feedback hypothesis, an acceleration or contraction of growth may correspond to a deterioration or promotion of energy consumption, and conversely, an increase or decrease in energy consumption corresponds to a gradual or weakening of growth prospects. Finally, the neutral hypothesis states that there is no causal relationship between energy and growth, that is, a decrease or increase in energy consumption has no significant effect on economic growth, and vice versa. Balsalobre-Lorente and Leitão 30 estimated the relationship between energy use and economic growth for 28 EU countries during 1995–2014 using panel dynamic ordinary least squares (DOLS), panel fully modified ordinary least squares (FMOLS), and fixed effects (FE). Findings support the growth hypothesis, reflecting that higher energy consumption significantly boosts economic growth in selected countries. Likewise, Topcu, Altinoz, and Aslan 31 supported the growth assumption, selecting 128 countries by income level, and using a panel vector autoregressive (PVAR) approach over the period 1980–2018. Ndlovu and Inglesi-Lotz 32 used the FMOLS strategy and data from 1996 to 2015 to uncover causal relationships between renewable energy use, nonrenewable energy use, growth, and R&D spending in BRICS (Brazil, Russia, India, China, and South Africa) economies. The findings are consistent with the growth hypothesis, suggesting a one-way causal relationship from NREC to economic growth in South Africa and Brazil. Krkošková 33 , Joshua, Uzuner and Bekun 34 are similar studies supporting the growth hypothesis.
Conservative hypothesis is the second line of research on the causal link from economic growth to energy use. Banday and Aneja 35 examine the causality between energy use and economic growth by conducting Bootstrap Dumitrescu and Hurlin panel causality tests for BRICS economies over the period 1990–2017. The analysis results show that there is a one-way causal relationship from economic growth to energy consumption in South Africa, China, Brazil, and India. Umurzakov et al. 36 examine the link between energy use and economic growth in post-communist countries using Dumitrescu and Hurlin panel Granger causality tests for the period 1995–2014. The result is consistent with conservative assumption, suggesting a causal relationship from economic growth to energy consumption. Fan and Hao 37 examine the link between foreign direct investment, renewable energy use, and economic growth in 31 Chinese provinces over the period 2000–2015. The direction of the results demonstrates a unilateral causal link from economic growth to renewable energy use, thus supporting the conservative assumption. Ahmad et al., 38 Singh and Vashishtha, 39 Munir, Lean and Smyth, 40 and Sunde 41 are similar studies supporting the conservative hypothesis.
The two-way causal relationship between energy consumption and economic growth is known as the feedback hypothesis. Chontanawat 42 selects ASEAN countries to explore the dynamic relationship between NREC and economic growth during the period 1971–2015. The results highlight a two-way causal relationship between energy consumption and economic growth in ASEAN countries, thereby supporting the feedback hypothesis. Another study by Le and Sarkodie 43 selects 45 developing economies to gain insight into energy and economic growth causality over the period 1990–2014 through the Dumitrescu and Hurlin approach. The results strongly agree with a pairwise causal relationship between energy use and growth, consistent with the feedback hypothesis. Likewise, Agboola, Bekun, and Joshua 44 examine the direction of the causal relationship between energy use and economic growth using the Toda-Yamamo modified Wald test for the period 1971–2016 in Saudi Arabia. The findings clearly demonstrate a two-way causal relationship between energy consumption and economic growth in Saudi Arabia, thereby supporting the feedback hypothesis. Peng and Wu, 45 Ahmad et al.,27,28 Banday and Aneja, 35 Saidi and Omri, 46 Syzdykova et al., 47 Adams et al., 48 Koengkan, Fuinhas and Santiago, 49 Alkhars et al., 50 Pala, 51 Rahman and Vu, and 52 Nasreen, Mbarek and Atiq-ur-Rehman 53 are the studies supporting feedback hypothesis.
The independent relationship between energy use and economic growth is called the neutral hypothesis. Krkošková (2021) selects V4 countries to reveal the link between energy consumption and real gross domestic product (GDP) during the period 2005–2019. The results of the analysis support the neutral hypothesis, showing that there is no significant relationship between energy consumption and real GDP in Poland. Li and Leung 54 examine the relationship between renewable energy use and growth in seven European countries during the period 1985–2018. The results of the analysis show that there is no causal relationship between renewable energy and economic growth in selected European countries, thus supporting the neutral hypothesis.
Vural 55 reveals the relationship between renewable energy use, nonrenewable energy use, trade, and carbon emissions in eight Saharan African countries using panel second-generation testing, over the period 1980–2014. The findings show that an increase in NREC amplifies carbon emissions, while an increase in renewable energy consumption (REC) reduces carbon emissions in selected countries. Furthermore, the analysis confirms the validity of the EKC assumptions for selected countries. Similarly, Destek and Sinha 56 tested the validity of EKC assumptions for the ecological footprint of developing countries over the period 1980–2014 using second-generation techniques. This result does not support the inverted U-shaped EKC hypothesis, but parallels the U-shaped EKC relationship between ecological footprint and economic growth in developing countries using the GMM approach. Another study by Zhang, Yang, and Jahanger 57 reveals the validity of the EKC assumption for the top 10 remittance recipient countries during the period 1990–2018, using continuously updated full correction (CUP-FM) and continuously updated bias correction (CUP-BC) method. The analysis of the study confirms that the selected countries have an inverted U-shaped EKC assumption. Jena et al. 58 assessed the validity of the EKC assumption for China, India, and Japan over the period 1980–2016 using an autoregressive distributed lag (ARDL) model. The results recorded in the analysis validated the inverted U-shaped EKC for China and the U-shaped EKC for India and Japan. Similarly, recent studies have explored the EKC hypothesis for individual and panel of countries, such as Wang et al. 59,60 tested the inverted U-shaped EKC hypothesis for China. Ali et al. 61 approved the validity of the inverted U-shaped EKC hypothesis of Pakistan, India, Malaysia, and China (PIMC), and Luo et al. 62 demonstrated the validity of the inverted U-shaped EKC assumption for China, India, and Singapore. Likewise, Isik et al. 63 explored the legitimacy of the inverted U-shaped EKC hypothesis in seven US states. Isik et al. 64 approved the presence of EKC assumptions in four of eight OECD countries.
The above literature, despite having many panel studies, ignores panel selection on the same topic in emerging Asian countries, Japan, Singapore, South Korea, Bangladesh, India, and China. Furthermore, the literature rarely identifies causal relationships among disaggregated REC, NREC, economic growth, and carbon emissions, and tests the validity of the EKC hypothesis in the proposed panel of emerging Asian countries.
Theoretical framework, model development, data sources, and methodology
With regard to the energy–growth relationship, the existing literature highlights two opposing views. The first view is that energy use is somewhat linked to the level of aggregate productivity, it is based on neoclassical growth theory, but this theory shows that economic growth depends heavily on technology, capital, and labor.65,66 Energy is a neglected input in the aggregate production function proposed by Rahman and Velayutham and Ayres and Warr.67,68 Instead, energy plays a crucial role in the production process, a second view explicitly highlighted in the literature by Bamati and Raoofi 69 and Zeqiraj, Sohag, and Soytas. 70 The key inputs that determine the growth process are energy, labor and capital.71,72 Thus, following Shah, Chughtai, and Simonetti, 73 Lu, Wu and Wan., 74 Chi, Bai and Li, 75 and Hao, Wang and Lee, 76 the Cobb–Douglas production function is augmented by simultaneously including energy, labor, and capital. The structural form of the augmented Cobb–Douglas production function is

where Y signifies total production, A denotes technology, K is capital, E represents energy, L stands for labor, μ is the error term, which comprises all other unseen indicators of production, i is used for country, and t for time period. Consistent with the above studies, the model is extended by decomposing energy (REC and NREC) and carbon emissions to determine the total production, as described in the functional form below.

The following equations were derived in log-linear form from the model presented above to determine the goals for the current study:


where GDP is an alternate for the total production, NREC stands for non-renewable energy consumption, REC represents renewable energy consumption, CO2 shows carbon dioxide emission, L denotes labor force, and K identifies gross fixed capital formation. Besides, GDP2 is GDP squared, GDP3 is GDP raised to the third power. κ0, and α0 are the models intercepts, αi, and κi are the variables model coefficients, i used for country, where t for time period. Likewise, in the proposed models, eit and εit are the error terms.
Estimates of the following parameters can be used to identify U-shaped, inverted U-shaped, or N-shaped EKC assumptions for emerging Asian countries:
If κ3 >0, κ4 < 0, the EKC for emerging countries is assumed to be an inverted U shape. If κ3<0, κ4>0, the validity of the EKC assumption for emerging countries is U-shaped. If κ3 > 0, κ4 < 0, κ5 > 0, the legitimacy of the EKCs hypothesis in emerging countries is type N.
This study aims to empirically explore the linkages between REC, NREC, carbon emissions, and economic growth in selected emerging Asian economies during the period 1970–2020. Appendix Table A1 identifies the measurements, descriptions, and data sources for the variables. REC as a percentage of total final energy consumption and total energy consumption in kilograms of oil equivalent (Mtoe) are two variables used to measure REC. REC in million tons of oil equivalent (Mtoe) can be calculated by multiplying total energy consumption in Mtoe by REC as a percentage of total energy consumption and dividing by 100. Calculation of renewable energy data in Mtoe has been done since variable data only exists as a percentage.

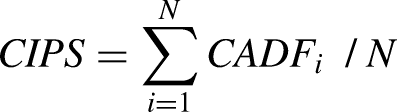
Cross-sectional dependency in panel data estimation techniques leads to biased regression analysis and inference. Thus, detecting cross-sectional dependencies in variable models of panel data is an important part of research analysis.23,40 Thus, this study applies the cross-sectional dependence test introduced by Pesaran, Ullah, and Yamagata 77 to explore cross-sectional correlation in panel data. After analyzing the initial cross-sectional dependencies, the integral properties of each variable were examined using the cross-sectional enhanced Im-Pesaran-Shin (CIPS) unit root test proposed by Pesaran. 78 Pesaran 78 modified the standard Dickey–Fuller test to take the cross-sectional country-specific data lags as the mean while taking into account cross-sectional dependencies. Pesaran assumes the following regression to estimate a single cross-section augmented Dickey–Fuller (CADF) statistic:

The null hypothesis (H0 : δi = 0 for all i) reflects that the variables in the model have a unit root while the alternative hypothesis (H1 : δi < 0) states that the variables do not have a unit root.
After determining the order of integration for each variable, this study examines the robustness of the estimated results by applying the Westerlund cointegration test, Pedroni 79,80 cointegration test, and the Kao 81 cointegration test. Pedroni 79,80 and Kao 81 cointegration tests based on Engle and Granger 82 residual-based two-step cointegration tests. The first Pedroni 79,80 residual-based cointegration tests included two-line cointegration tests, panel tests, and group tests. Panel tests include panel ADF statistic, panel PP statistic, panel v statistic, and panel rho statistic while group tests include group ADF statistic, group rho statistic, and group PP statistic. These seven statistics are derived from the following long-term model and are asymptotically separated or dispersed by the standard normal:
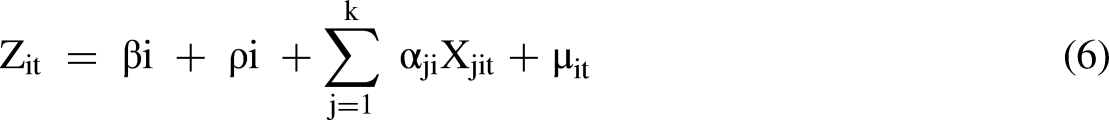
where it is assumed that the desired variables Z and X are integrated at the first derivative.
The estimated residual structure is highlighted as


Kao's cointegration technique, introduced by Kao, 81 is another test used in this study, which can give long-term cointegration results similar to Pedroni's test, and can be applied under the assumption of cross-homogeneity coefficients. Thus, the Kao and Pedroni cointegration tests are known to be the first generation of cointegration tests because these tests have the weakness of assuming cross-sectional independence, although these two cointegration tests have been widely used by various studies. These first-generation tests cannot account for the existence of cross-sectional dependence, and thus the results obtained by these tests are invalid. Hence, this study uses the second-generation Westerlund 83 cointegration test that considers the cross-sectional dependence problem.
After establishing long-term panel cointegration, panel DOLS FMOLS may be the best options for determining long-term variable elasticity, but FMOLS and DOLS strategies ignore cross-sectional dependencies. 84 Econometric models are subject to cross-sectional dependencies and country-specific heterogeneity, which can lead to biased or misleading inferences. 85 Thus, the AMG method proposed by Eberhardt and Bond 86 and Teal and Eberhardt. 87 can produce more robust results than traditional methods while overcoming these problems. The main advantage of the AMG estimator can help achieve more adequate policy-oriented goals and provide country-specific results. The AMG estimation functional form is contained in a two-stage process and can be expressed in equations (9) and (10) as follows:

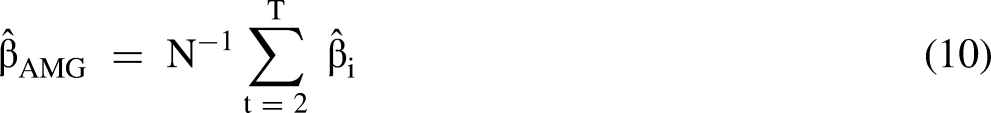
where βi is the intercept, Zit and Xit represent observed factors, and ρi is the cross-sectional coefficient estimator. gt shows the unobserved factors with heterogeneous dynamics and
Although the coefficients estimated by the AMG estimation technique indicate long-term relationships in variable series, these tests cannot detect causal relationships between variables. Thus, the Granger causality test developed by Dumitrescu and Hurlin 20 can be used to demonstrate causal relationships between variables. This test only applies when the time dimension (T) is below or above the cross-sectional dimension (N), (T > N), or (T < N). This statistical test is compelling with small sample sizes and is based on cross-sectional dependency, Monte Carlo simulation, and Wald statistics.88,89 The Dumitrescu–Hurlin test is an extended version of determining the causality of long-term panel variables and can be written as

where zi,t and xi,t are two stationary variables observations of individual i in period t. k portrays the lag length,
The null hypothesis of no causality and the alternative hypothesis to test the causality between variables are as follows:
Ho : αi = 0∀I = 1, …K H1 : αi = 0∀I = 1, …K1
αi ± 0∀I = K1 + 1, K1 + 2, …K
Here, K1 specifies the unrecognized parameter, but it satisfies the condition 0 ≤ K1 /K ˂ 1.
In any case, the ratio of K1/K is inevitably lower than 1, because if Ki = K, this means that for any panel cross-section, there is no causal relationship, so accept the null hypothesis. Conversely, when K1 = 0, this indicates causality for all individuals in the panel.
Analysis results and interpretation
First, the results of the cross-sectional dependence tests in Table 1 clearly show highly significant statistics for all tests, thereby approving the acceptance of the alternative hypothesis of cross-sectional dependence while rejecting the null hypothesis of no cross-sectional dependence in panel variables. Thus, second-generation panel variable data techniques such as the CIPS unit root test and the Westerlund cointegration test are feasible due to the acceptance of the cross-sectional correlation of the panel variables.90–93
Result of cross-sectional dependence test.
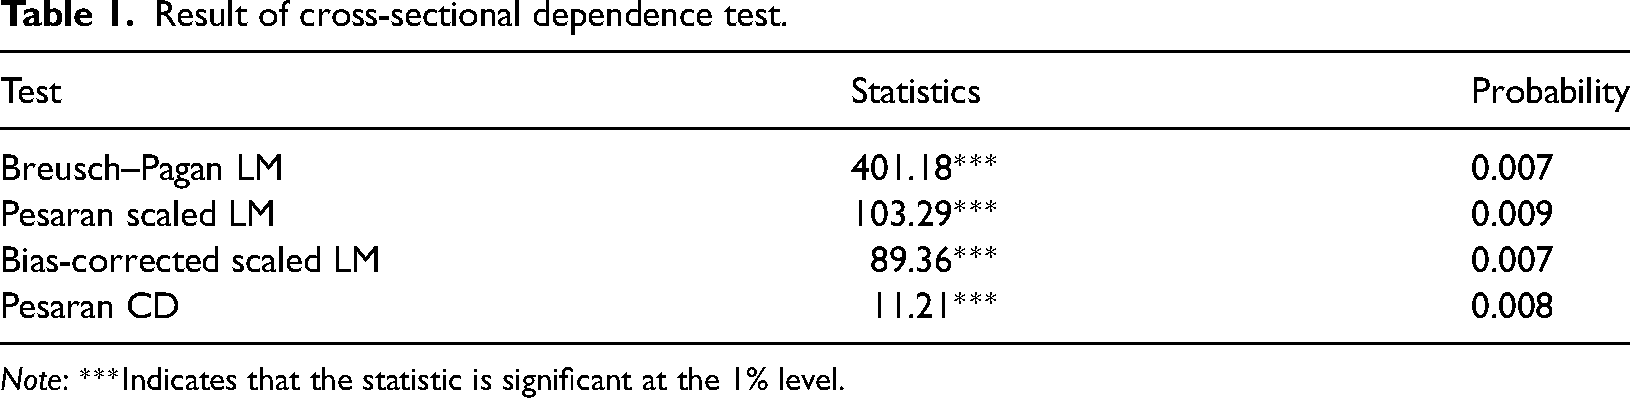
Note: ***Indicates that the statistic is significant at the 1% level.
The CIPS unit root test is more suitable for testing the stationarity level of panel variables with cross-sectional correlation. The panel variable unit root results in Table 2 confirm that, at levels, accept the null hypothesis of variables with a unit root. However, while taking the first derivative, the panel variables can be transformed into a stationary state, thereby accepting the alternative hypothesis and rejecting the null hypothesis. Cointegration relationships among the proposed model variables due to the homogeneous integral nature of all variables of I(1) can be explored.
The results of CIPS unit root test.
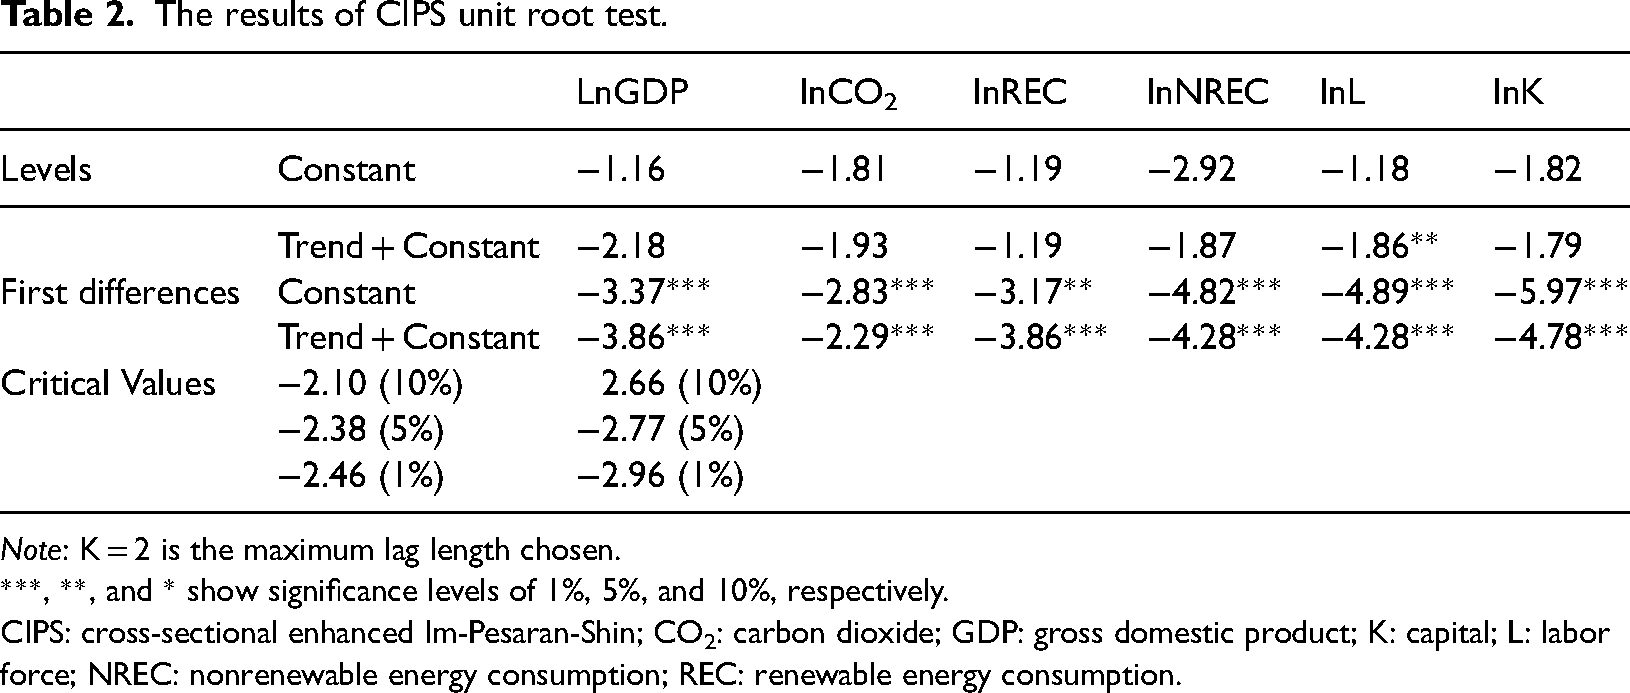
Note: K = 2 is the maximum lag length chosen.
***, **, and * show significance levels of 1%, 5%, and 10%, respectively.
CIPS: cross-sectional enhanced Im-Pesaran-Shin; CO2: carbon dioxide; GDP: gross domestic product; K: capital; L: labor force; NREC: nonrenewable energy consumption; REC: renewable energy consumption.
The descriptive statistics in Table 3 show that the average GDP of the selected countries is $1288.118 billion and illustrate the large variation in its standard deviation over the period 1975–2020. The average CO2 emissions were 11,299 million metric tons, with emissions ranging from 27,194 to 17,887 million metric tons for selected countries. The average intensities for renewable and nonrenewable energy are 3.816 and 16.189, respectively, reflecting energy use in Mtoe. The average gross fixed capital formation and employed labor force for the selected countries were $7484.291 million and $525.82.0 million, respectively. Also, the results of the Jarque–Bera test indicate that all variable data are normally distributed, as all variables have probabilities above 10%. The results of the skewness test determined that all variables were positively skewed according to their positive statistic. GDP is stretched and peaked due to its high statistics, explored through kurtosis.
Panel descriptive statistics.
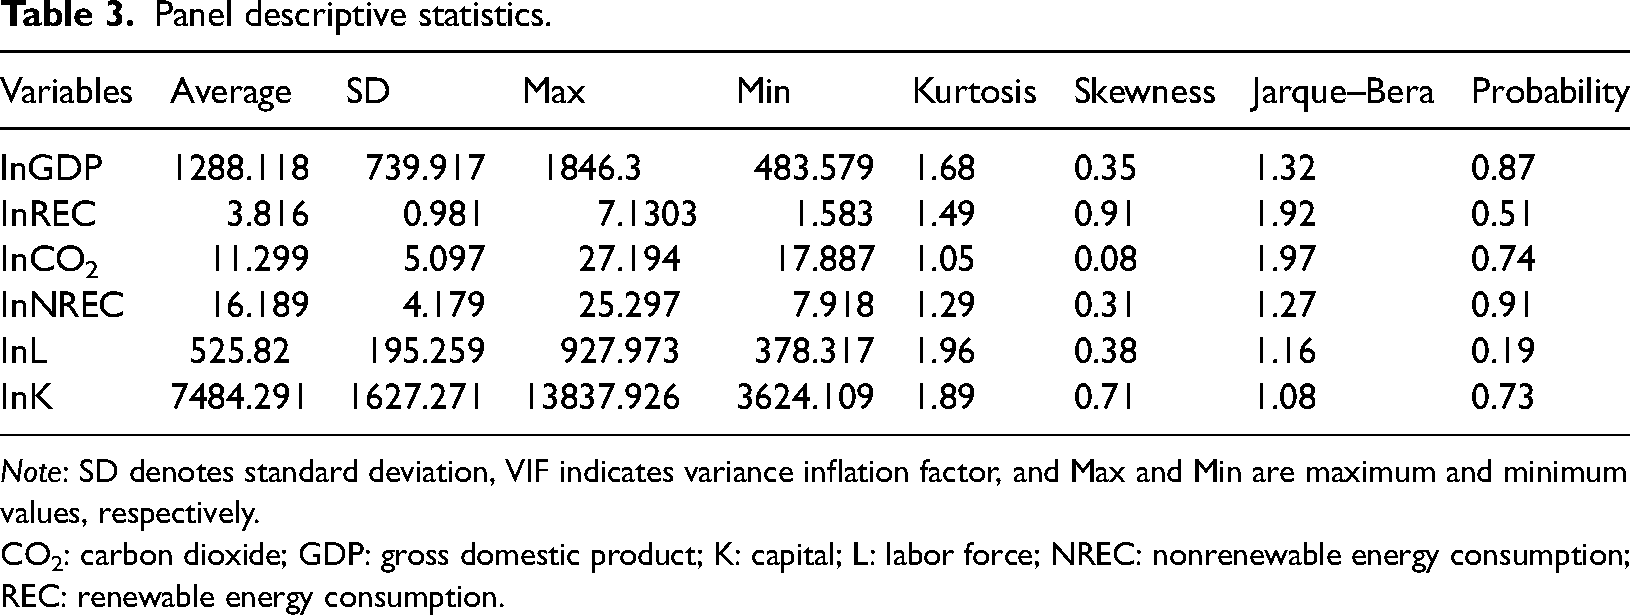
Note: SD denotes standard deviation, VIF indicates variance inflation factor, and Max and Min are maximum and minimum values, respectively.
CO2: carbon dioxide; GDP: gross domestic product; K: capital; L: labor force; NREC: nonrenewable energy consumption; REC: renewable energy consumption.
The correlation coefficients for each variable and the variance inflation factor (VIF) used to check for multicollinearity issues are shown in Table 4. The correlation matrix shows that all variables are positively correlated with GDP except labor force and REC which are negatively correlated with GDP. The VIF shows that all values of VIF are below 5, confirming the absence of multicollinearity in the model.
Correlation matrix and VIF test.
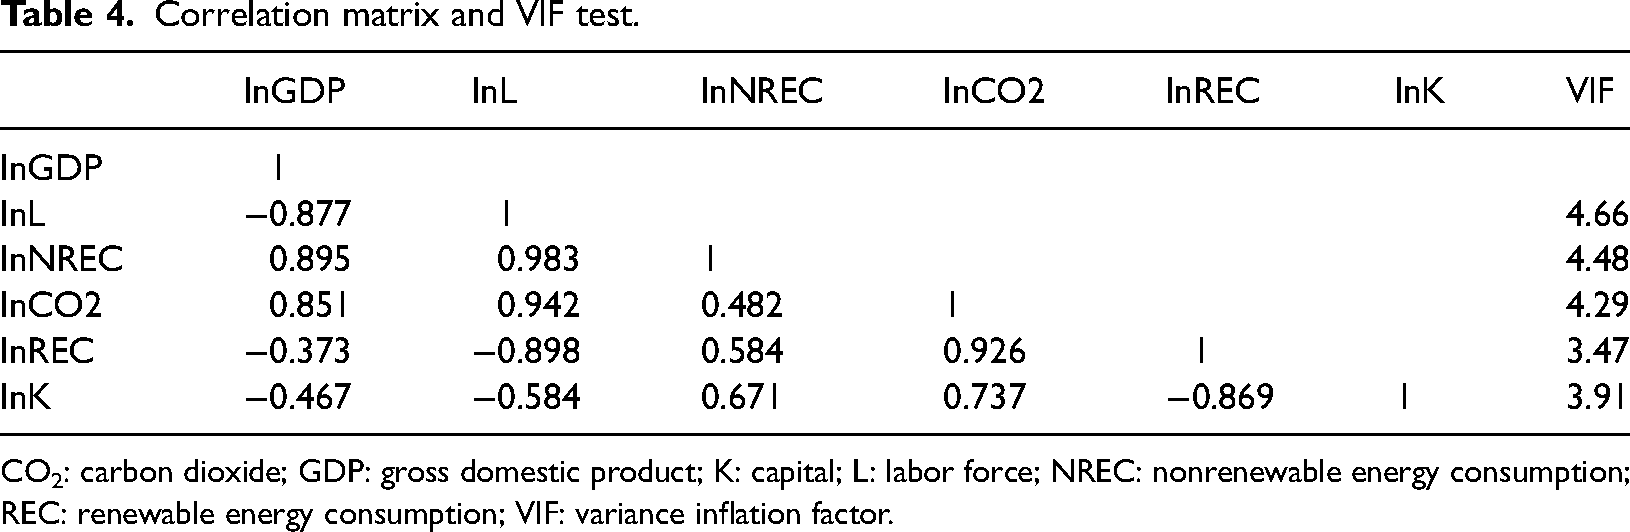
CO2: carbon dioxide; GDP: gross domestic product; K: capital; L: labor force; NREC: nonrenewable energy consumption; REC: renewable energy consumption; VIF: variance inflation factor.
The next step is to reveal the panel long-term cointegration relationship among variables through the cointegration test of Pedroni,79,80 Kao, 81 and Westerlund, 83 as shown in Table 5. Based on the Pedroni 7-panel cointegration test, the results of rejecting the null hypothesis of no cointegration include the significance of two statistics between dimensions and the significance of three statistics within dimensions. The Kao panel cointegration test also confirmed the existence of long-term cointegration through the significant ADF statistic. The Westerlund cointegration test takes into account the cross-sectional dependence of panel variables and outperforms previous first-generation cointegration tests for long-run cointegration. The Westerlund cointegration results are based on the significance of the panel cointegration statistics Pa and Pt, and the individual country group statistics Ga and Gt, supporting the existence of long-term cointegration relationships.
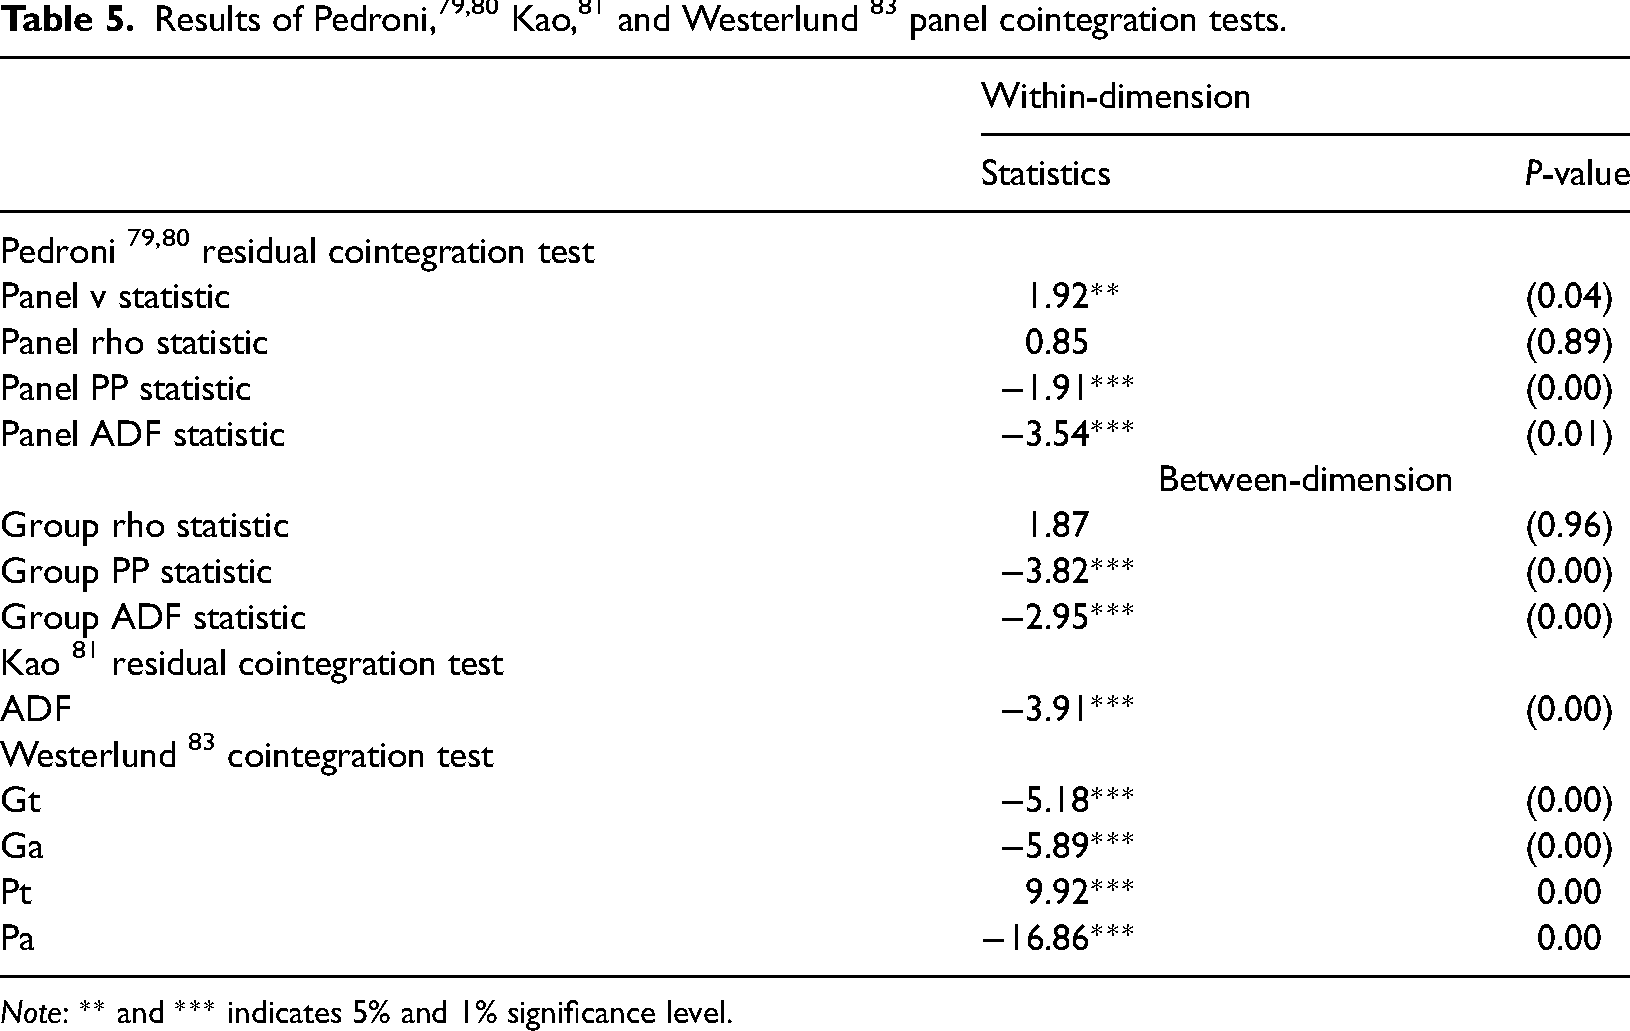
Note: ** and *** indicates 5% and 1% significance level.
Estimated parameters associated with the long-term proposed models of equations (3) and (4) are reported in Table 6. AMG's strategy of estimating variable coefficients based on the economic growth model shows that every 1% increase in employed labor force, capital accumulation, REC, and NREC can promote economic growth by 0.678%, 0.927%, 0.826%, and 0.671%, respectively. The progressive effect of capital accumulation on economic growth is very consistent with studies by Batrancea, Rathnaswamy and Batrancea, 94 Mujtaba et al., 95 Khan et al., and 96 Batrancea. 97
Estimation of long-term variable parameters by panel AMG strategy, InGDP = f (InCO2, InNREC, InREC, InL, and InK).
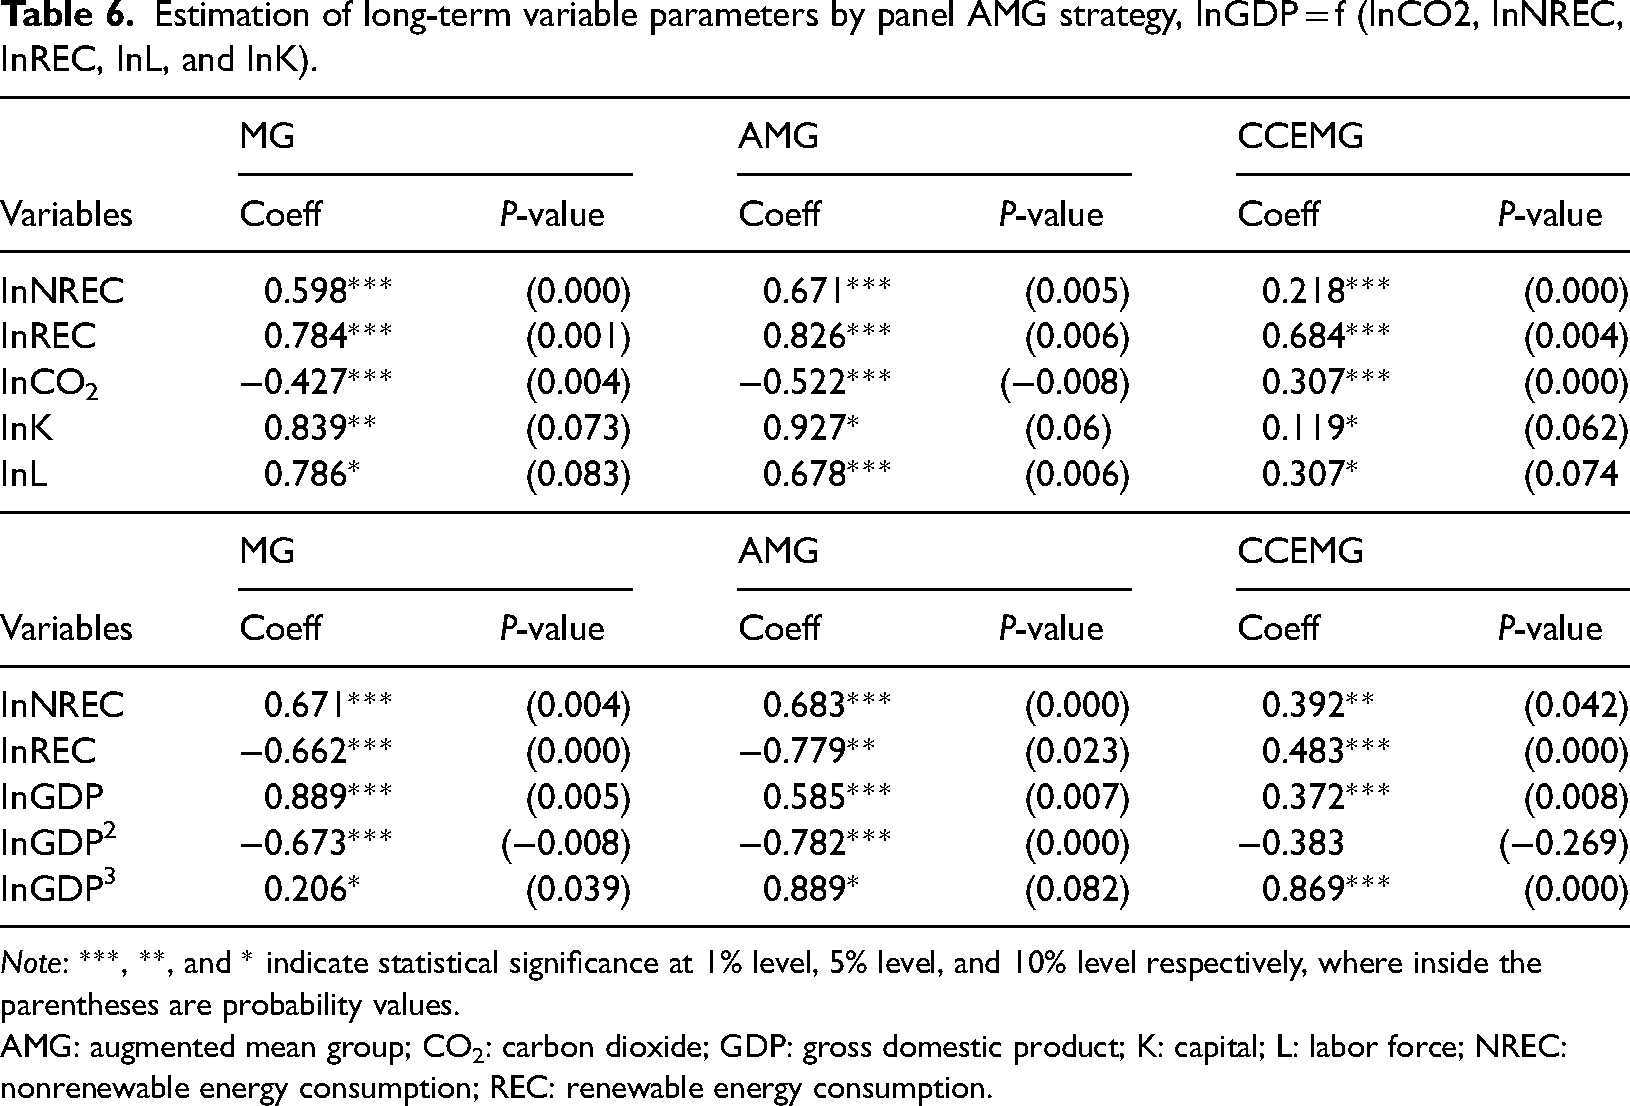
Note: ***, **, and * indicate statistical significance at 1% level, 5% level, and 10% level respectively, where inside the parentheses are probability values.
AMG: augmented mean group; CO2: carbon dioxide; GDP: gross domestic product; K: capital; L: labor force; NREC: nonrenewable energy consumption; REC: renewable energy consumption.
The CO2 emission coefficient is −0.522, reflecting that for every 1% increase in CO2 emissions, economic growth will be significantly compressed by 0.522%. The results of a significant asymptotic effect of renewable and NREC on growth are in good agreement with Mujtaba et al. 95 ; Anwar et al. 98 ; Rehman et al. 99 ; Vo 100 ; Adebayo et al. 101 ; Fang et al., and 102 ; and Stanek. 103
Based on the long-term variable coefficient elasticity of the carbon emission model, every 1% expansion in NREC can promote carbon emissions by 0.683%. Likewise, a 1% increase in REC can significantly reduce CO2 emissions by 0.779%. The negative impact of REC on carbon emissions and the positive impact of NREC on carbon emissions in the results are consistent with the research of Mujtaba et al. 95 ; Luo et al. 62 ; Adebayo et al. 101 ; Rehman et al. 99 ; Anwar et al. 98 ; Fang et al. 102 ; and Afroz and Muhibbullah. 104 In addition, the AMG strategy identified positive coefficients of GDP and GDP3 (GDP>0, GDP3 > 0) and negative coefficients of GDP2 (GDP2<0), reflecting the significant incremental impact of GDP and GDP3 on environmental pollution, while GDP2 has a significant negative impact on environmental degradation.
Thus, the results validate the N-shaped EKC hypothesis for selected emerging Asian countries. The contribution of GDP to environmental pollution suggests that production in selected countries can be expanded using more nonrenewable energy, thereby undermining environmental excellence. After the economic growth reaches a certain level, the country realizes that the use of renewable energy to increase productivity is more conducive to environmental protection. The gradual impact of the GDP cube on carbon emissions is due to the environmental conditions of trade liberalization, high demand for industrial goods in external markets, and the failure of trade agreements. Countries included in the study ignore environmentally friendly technologies and use nonrenewable energy sources to meet external demand for industrial products, resulting in environmental degradation.
AMG country-level estimated parameters are based on the economic growth models highlighted in Table 7. The results of the analysis show that capital accumulation, employed labor force, and REC significantly contribute to the long-term economic growth of South Korea, India, Bangladesh, China, Japan, and Singapore. Likewise, the consumption of nonrenewable energy has a gradual impact on the economic growth of all selected countries except Singapore. However, carbon emissions significantly reduce economic growth in all emerging economies except Japan, suggesting that the adverse effect of carbon emissions on economic growth is not significant.
Country-specific analysis results estimated by the AMG method, InGDP = f (InCO2, InNREC, InREC, InL, and InK).

Note: *, ** and ***, indicate statistical significance at 10%, 5%, and 1%, respectively, where inside the parentheses are probability values.
AMG: augmented mean group; CO2: carbon dioxide; GDP: gross domestic product; K: capital; L: labor force; NREC: nonrenewable energy consumption; REC: renewable energy consumption.
AMG's country-level estimates based on carbon emissions model show that, in all selected emerging Asian countries, GDP significantly promotes carbon emissions. However, GDP2 contributes significantly to the carbon emissions of India and Bangladesh, thus confirming that India and Bangladesh do not have EKC, but GDP2 significantly reduces the carbon emissions of China, Japan, Singapore, and South Korea. The cube of GDP has a significant adverse effect on carbon emissions in China and Singapore, thus confirming the inverted U-shaped EKC hypothesis in China and India. However, Japan and South Korea have N-type EKC hypotheses because the GDP cubes of these countries contribute significantly to carbon emissions. REC in all selected emerging economies reduces carbon emissions significantly. NREC in China, Japan, Bangladesh, India, Singapore, and South Korea significantly increases carbon emissions.
The AMG estimation technique cannot explore the causal relationship between variables, so this study adopts the newly introduced Dumitrescu and Hurlin 20 panel causality test, which has two advantages over the outdated Granger causality test Heterogeneity of causality and heterogeneity of regression models are the two dimensions of heterogeneity that Dumitrescu and Hurlin 20 panel causality test examines for Granger causality among variables. Following Koçak and Şarkguneşi, this study estimates probability values and test statistics using Monte Carlo simulations. The Dumitrescu and Hurlin 20 panel causality test results in Table 8 emphasize the two-way causality between REC and economic growth. This finding is consistent with Mukhtarov, 105 Xue et al., 106 Chen et al., 107 Wang et al.,59,60 Aslan et al., and 108 Mounir and El-houjjaji. 109
Dumitrescu–Hurlin results for panel causality between variables.
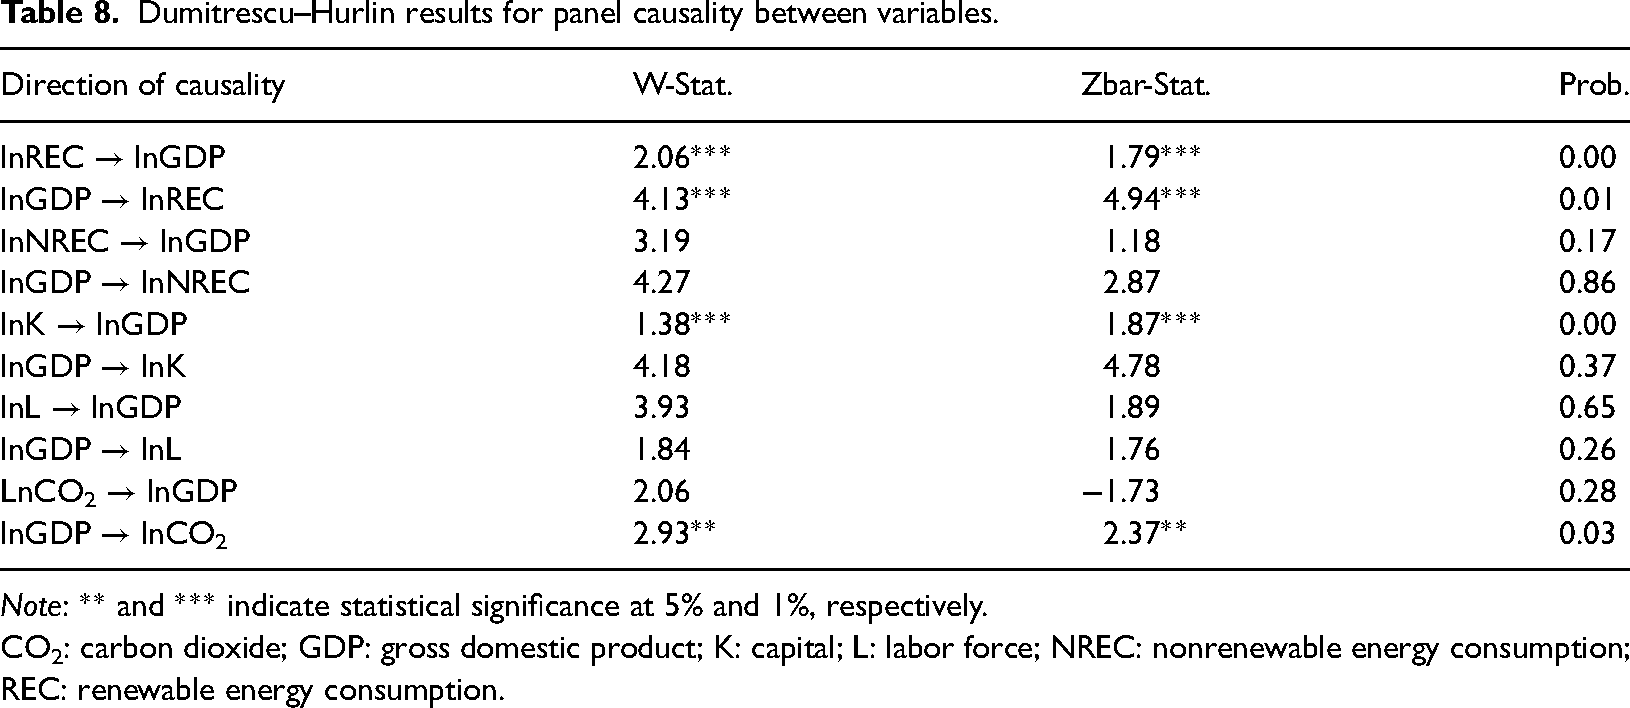
Note: ** and *** indicate statistical significance at 5% and 1%, respectively.
CO2: carbon dioxide; GDP: gross domestic product; K: capital; L: labor force; NREC: nonrenewable energy consumption; REC: renewable energy consumption.
In addition, the results also show a unilateral causality from economic growth to carbon emissions, and from capital formation to economic growth in emerging Asian countries. The results identify a unidirectional causal link from capital formation to economic growth, in good agreement with Topcu, Altinoz and Aslan and 31 Shahbaz, Song, Ahmad et al. 110 And the discovery of a one-way causal relationship from economic growth to carbon emissions is consistent with Dong, Xu and Fan, 111 El Menyari, 112 Adedoyin and Zakari, and 113 Gao and Zhang. 114
The pairwise Granger causality results for each country are reported in Table 9. The results show two-way causality between REC and economic growth in India, Japan, and Korea, and one-way causality from capital formation to economic growth in all countries. In addition, the analysis points out a unilateral link from NREC to economic growth in China, Singapore, and South Korea, from carbon emissions to economic growth in China, and from economic growth to carbon emissions in India, Bangladesh, Singapore, and South Korea.
Pairwise causality results for individual countries.
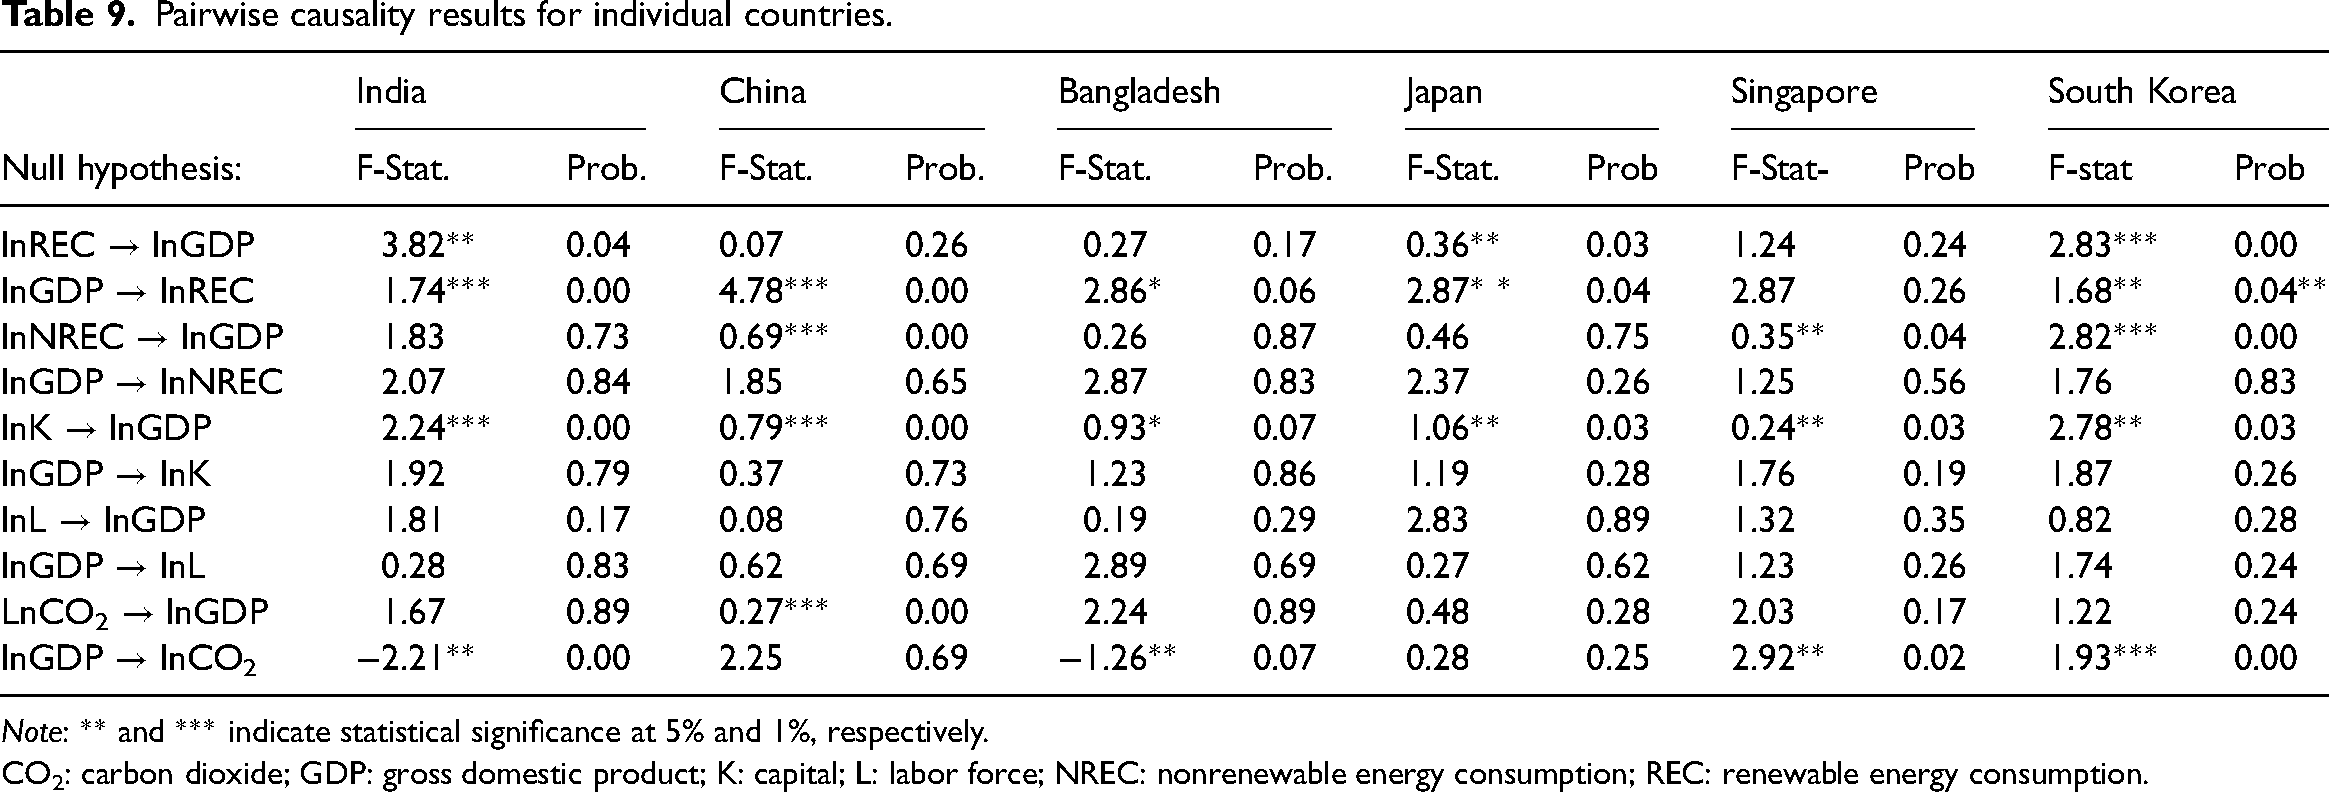
Note: ** and *** indicate statistical significance at 5% and 1%, respectively.
CO2: carbon dioxide; GDP: gross domestic product; K: capital; L: labor force; NREC: nonrenewable energy consumption; REC: renewable energy consumption.
Concluding remarks
This study examines the link between REC, NREC, economic growth, and carbon emissions in India, China, Bangladesh, Japan, Singapore, and South Korea during the period 1975–2020. This study addresses variable biases that may be missing in a multivariate framework by augmenting the Cobb–Douglas production function with the three dimensions of renewable energy, NREC, and CO2 emissions. First, the cross-sectional dependence in the panel data variable model was detected in the empirical analysis of this study. After examining preliminary cross-sectional correlations in the variable data model, the integral properties of each variable were examined by a CIPS unit root test. Unit root test results allow for exploring long-term cointegration relationships among the proposed model variables. The AMG technique was used to estimate long-run variable elasticity coefficients after establishing long-run panel cointegration. Based on the long-term parameter estimation of the economic growth model, it is determined that REC, NREC, and capital accumulation contribute significantly to long-term economic growth.
The coefficient of REC is estimated at 0.826, matching that of nonrenewable energy at only 0.671, indicating that REC has a greater impact on economic growth than nonrenewable energy. However, the impact of carbon emissions on economic growth is significantly negative.
The long-term estimation coefficient model based on carbon emissions shows that the increase in REC leads to a significant reduction in carbon emissions while the increase in NREC significantly contributes to carbon emissions. The AMG process analysis results show that the coefficient signs of GDP and GDP3 are significantly optimistic (GDP>0, GDP3>0), while GDP2 is significantly negative (GDP2<0), indicating that GDP and GDP3 promote environmental damage, while GDP2 significantly reduces environmental pollution. Thus, this result validates the N-type EKC hypothesis for specific emerging Asian countries.
AMG's country-wise estimates of parameters based on economic growth models show that capital accumulation, employed labor force, and REC make significant contributions to long-run economic growth in South Korea, India, Bangladesh, China, Japan, and Singapore. Likewise, the consumption of nonrenewable energy has a gradual impact on the economic growth of all selected countries except Singapore. However, carbon emissions significantly reduce economic growth in all emerging economies except Japan, suggesting that the adverse effect of carbon emissions on economic growth is not significant.
AMG's country-level estimates based on carbon emissions model show that, in all selected emerging Asian countries, GDP significantly promotes carbon emissions. However, GDP2 contributes significantly to the carbon emissions of India and Bangladesh, thus confirming that India and Bangladesh do not have EKC, but GDP2 significantly reduces the carbon emissions of China, Japan, Singapore, and South Korea. The cube of GDP has a significant adverse effect on carbon emissions in China and Singapore, thus confirming the inverted U-shaped EKC hypothesis in China and India. However, Japan and South Korea have N-type EKC hypotheses because the GDP cubes of these countries contribute significantly to carbon emissions. REC in all selected emerging economies reduces carbon emissions significantly. NREC in China, Japan, Bangladesh, India, Singapore, and South Korea significantly increases carbon emissions.
The Dumitrescu–Hurlin panel causality test highlights the two-way causality between REC and economic growth. The results also show a unilateral causality from economic growth to carbon emissions, and from capital formation to economic growth in emerging Asian countries. Pairwise Granger causality results for each country report two-way causality between REC and economic growth for India, Japan, and South Korea, and one-way causality between capital formation and economic growth for all countries. In addition, the analysis points out a unilateral link from NREC to economic growth in China, Singapore, and South Korea, from carbon emissions to economic growth in China, and from economic growth to carbon emissions in India, Bangladesh, Singapore, and South Korea.
Based on the above results, policy makers must emphasize the growth of renewable energy production and consumption in Asia's emerging economies as a viable alternative to overcome environmental degradation and climate change controversy without allowing economic growth. A rapid transition from nonrenewable to renewable energy is critical for energy security and sustainable economic growth. It is therefore imperative that policy makers take appropriate measures and establish the necessary public-private partnerships to facilitate and simplify market access for capital-incentive technologies and renewable energy. These incentives and ingenuity will spark sustainable economic growth in the clean and modern energy sector. With the exception of Singapore, all emerging Asian countries can boost economic growth through the use of nonrenewable energy. In order to protect the environment and promote economic growth, Singapore should gradually transition from nonrenewable energy to renewable energy as soon as possible. India and Bangladesh do not recognize the effectiveness of EKC, so it is more urgent for these countries to protect the environment by shifting economic resources from nonrenewable energy to renewable energy. Moreover, based on South Korea and Japan's N-type EKC hypothesis, these countries should not reverse transfer its economic resources from renewable energy to nonrenewable energy, but from nonrenewable energy to renewable energy in order to protect the environment.
The main weakness of the current study is the neglect of heterogeneous characteristics among the selected emerging Asian countries. Therefore, a conceivable extension of this study is to divide the entire panel of emerging Asian countries into different subsamples according to income level (i.e. low-income, middle-income, and high-income countries). Furthermore, the study can be extended to include other indicators of environmental degradation such as greenhouse gas emissions and ecological footprint.
Footnotes
Author contribution
A.A. (Ali) contributed to the conceptualization of the study, analysis, design, and conclusions; reviewed the manuscript; and approved the final submission.
Declaration of conflicting interests
The author(s) declared no potential conflicts of interest with respect to the research, authorship, and/or publication of this article.
Funding
The author(s) received no financial support for the research, authorship, and/or publication of this article.
Availability of data and material
The data that support the findings of this study are openly available in World Development Indicator page published by,
1
and is available at ![]() .
.
Appendix
Variables description and measurement.
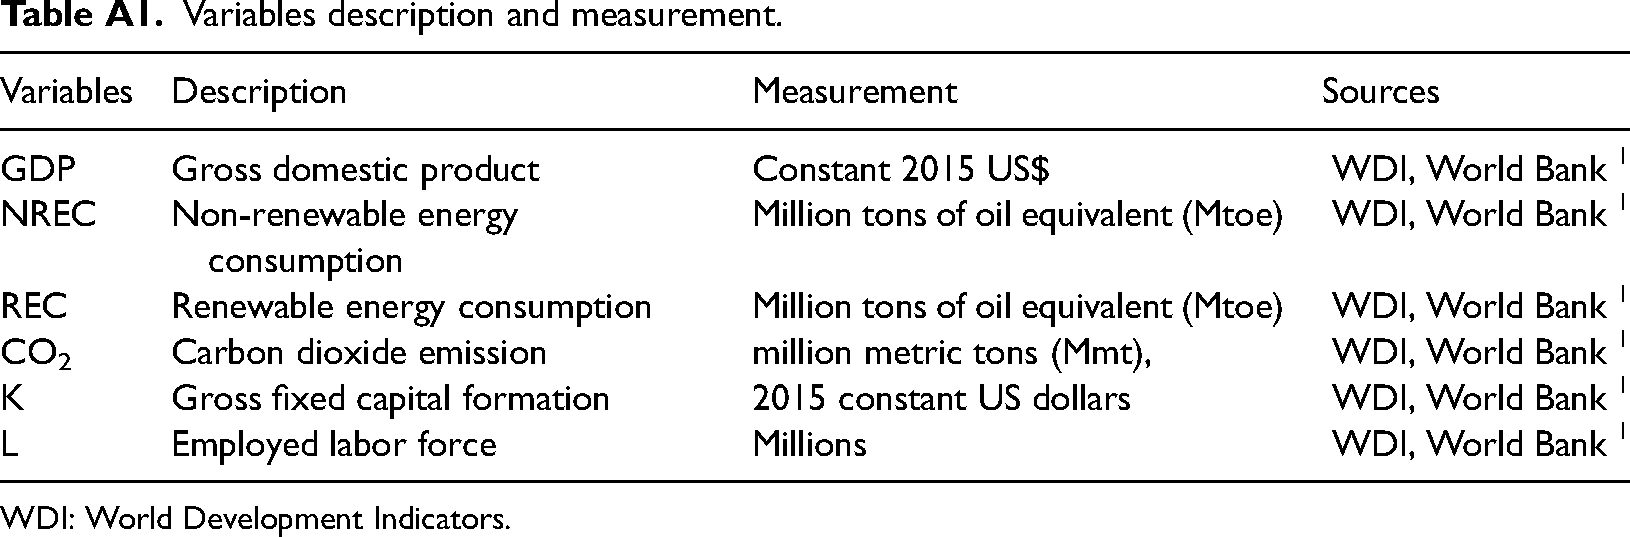
| Variables | Description | Measurement | Sources |
|---|---|---|---|
| GDP | Gross domestic product | Constant 2015 US$ | WDI, World Bank 1 |
| NREC | Non-renewable energy consumption | Million tons of oil equivalent (Mtoe) | WDI, World Bank 1 |
| REC | Renewable energy consumption | Million tons of oil equivalent (Mtoe) | WDI, World Bank 1 |
| CO2 | Carbon dioxide emission | million metric tons (Mmt), | WDI, World Bank 1 |
| K | Gross fixed capital formation | 2015 constant US dollars | WDI, World Bank 1 |
| L | Employed labor force | Millions | WDI, World Bank 1 |
WDI: World Development Indicators.