
Abstract
Notwithstanding the prevalence of multidimensional constructs in marketing research, very few reliability analyses have taken into account the multidimensional structure of their empirical data. In this article, the author argues that if a scale can be divided into two or more distinct though related dimensions, its internal consistency should be evaluated by coefficients designed for such cases. This article presents stratified alpha as a viable alternative to the common practices of computing alpha for the whole scale and averaging alpha values. It also illustrates, using D’Astous and Lévesque’s store personality scale, that the discrepancy between stratified alpha and alpha (or alpha mean) might be substantial. Thus, it would seem more scientifically sound to compute and report stratified alpha.
Keywords
Introduction
Despite some criticisms (see, e.g., Bergkviest & Rossiter, 2007; Drolet & Morrison, 2001; Rossiter, 2011), the use of multi-item scales is commonplace in conducting marketing research. To see the validity of this account, one has only to glance through the extensive marketing scales’ handbooks by Bearden, Netemeyer and Haws (2011) and Bruner, Hensel and James (2005).
Within the well-known marketing measure development literature, reliability has always been a critical issue since reliability is a necessary (although insufficient) condition for validity (Churchill, 1979; Netemeyer, Bearden & Sharma, 2003; Peter, 1979, 1981). Basically, reliability could be seen as the correlation of a scale with a hypothetical one which truly measures what it is supposed to measure (Lord & Novick, 1968, pp. 60–61). Construct validity refers to the degree to which a measure assesses the construct it is purported to measure (Peter, 1981, p. 134).
Marketing researchers often deal with more and more multifaceted constructs (e.g., store personality or service quality) and have to develop/borrow scales that tap two or more interrelated dimensions or underlying factors (i.e., multidimensional scales). Basically, a construct is said to be multidimensional (vs unidimensional) if it has statistical characteristics demonstrating that its items tap more than one (vs one) distinct though related underlying factors (Netemeyer et al., 2003, p. 9). When developing or simply using multidimensional scales, Churchill (1979, p. 69) explicitly recommends, in his extremely influential article, that ‘the reliability of the total construct would not be measured through coefficient alpha’. Churchill (1979) also tells us that the reliability of the entire scale should be gauged through what Nunnally (1967, pp. 226–235) calls ‘the formula for the reliability of linear combination of measures’ and that the author labels here, to render unto Caesar that which is Caesar’s, stratified alpha (Cronbach, 1951; Cronbach, Schönemann & McKie, 1965; Rajaratnam, Cronbach & Gleser, 1965).
Notwithstanding the prevalence of multidimensional constructs in marketing research (Bearden et al., 2011; Bruner et al., 2005) and Churchill’s (1979) early directives, one can note with dismay that—in the euphoria of scale development—very few reliability analyses have taken into account the multidimensionality of their empirical data. A sampling of articles published in recent years in highly regarded marketing journals indicates that in most cases, marketing researchers contend themselves by just reporting alpha for each dimension (e.g., Brakus, Schmitt & Zarantonello, 2009; Das, 2014; Das, Guin & Datta, 2013; Jha & Bhattacharyya, 2013; Koçak, Abimbola & Özer, 2007; Willems & Swinnen, 2011). Many other researchers lapse into the quite common and disquieting habit of computing alpha for both the dimensions and the entire scale (e.g., Richins, 2004; Sung, Choi, Ahn & Song, 2015). Few others report averages of alpha values (e.g., Smith, MacKenzie, Yang, Buchholz & Darley, 2007). Ever fewer are those who provide estimates for stratified alpha (e.g., Bearden, Money & Nevins, 2006) or another multidimensional reliability index (e.g., Finn & Kayandé, 2004). Thus, it seems that information about a very important psychometric property of multidimensional marketing constructs (i.e., reliability) is most of the time either missing or less than properly estimated (i.e., using alpha or averaging alpha values). The upshots of this are inaccurate and vacuous reliability estimates that mislead researchers and readers alike. Worse, as Lee and Hooley (2005) so aptly state, it is extremely plausible that we (i.e., marketing researchers) compute and report alpha in a mechanistic ritual without fully understanding its psychometrical and statistical underpinnings.
Within this article and consistent with Churchill (1979), the author argues that if a scale can be divided into two or more distinct yet related dimensions or sub-scales, this scale’s internal consistency must be—at least for the sake of scientific rigour—evaluated by coefficients designed for such cases. Though marketing researchers may have at their disposal a full array of reliability estimators that take into account the multidimensionality of their measures (see, e.g., Heise & Bohrnstedt, 1970; Li, Rosenthal & Rubin, 1996; McDonald, 1985, 1999; Werts, Rock, Linn & Jöreskog, 1978), the author suggests that stratified alpha could be an interesting alternative for at least two reasons. The first reason is accuracy of estimation, that is, simulation-based studies by Osburn (2000) and Kamata, Turhan and Darandari (2003) clearly designate stratified alpha as the most dependable formula for assessing the reliability of a multidimensional measure. In the former study, Osburn (2000) compares alpha to related internal consistency reliability coefficients and shows that stratified alpha is exactly equal to the true reliability (Osburn, 2000, pp. 350–352). In the latter, Kamata et al. (2003) evaluate stratified alpha against Li et al.’s (1996) maximal reliability and McDonald’s (1999) coefficient omega and point out that ‘stratified alpha appeared to be the most reliable procedure among the three alternative methods’ (Kamata et al., 2003, p. 15). The second reason that speaks in favour of stratified alpha is simplicity of calculation, that is, unlike other coefficients that involve highly sophisticated mathematical derivations, stratified alpha’s computation is well within the reach of almost every researcher. Indeed, as this investigation shows later, the three pieces of information required for finding stratified alpha could be effortlessly obtained from popular statistics packages, such as SPSS.
The primary goal of this article, therefore, is to instruct marketing researchers in stratified alpha’s significance and characteristics in an easily understandable format. This investigation complements studies by Osburn (2000), Kamata et al. (2003) and Rae (2007) as it uses real-life data rather than simulations and hypothetical data. This research is also different from a recent study by Rae (2008) as it offers a practical point of view instead of being purely theoretical (i.e., mathematical derivation).
The reminder of this report is organized around the following lines. The second section provides a brief literature review on the concepts of reliability and internal consistency. The next section deals with Cronbach’s (1951) alpha and alpha’s underlying assumptions. The fourth section focuses on stratified alpha. The fifth section reports an empirical illustration using D’Astous and Lévesque’s (2003) store personality scale. After that follows summary, recommendations, further research avenues and limitations.
Literature Review
Reliability
No discussion of reliability would be complete without evoking the classical true score model (Lord & Novick, 1968, Chapter 3) or the ‘venerable T model’ in Lumsden’s (1976, p. 254) words. Within the framework of classical test theory (CTT), an item i with observed score xi is decomposed to a true score ti and an error score ei.

For a scale comprised of k items i (i = 1, …, k), the composite observed score X is equal to its composite true score T plus composite error score E.

where X = x1 + x2 + . . . + xk, T = t1 + t2 + . . . + tk and E = e1 + e2 + . . . + ek.With this model, it is assumed that (i) the measurement error scores for a respondent are uncorrelated with that individual’s true scores; (ii) the measurement error scores are expected to sum to zero over the population of respondents; and (iii) the item error scores are mutually uncorrelated. Recall that the true score is the latent construct being measured (presuming no practice or changing motivation effects).
1
In CTT, it is also assumed that the composite observed variance

In Equation (3), CI denotes the construct of interest, SE the systematic error and RE is the random error (Streiner, 2003, p. 100). Reliability can then be defined as ‘a measure of the degree of true-score variation relative to observed score variation’ (Lord & Novick, 1968, p. 61), that is,

According to Lord and Novick (1968, p. 61), a reliability coefficient could be also defined ‘as the squared correlation between observed score[s] and true score[s]’.

It follows from Equation (5) that the smaller
Internal Consistency as a Reliability Method
Since its introduction almost more than a century ago by Charles Spearman, many definitions for the concept of reliability have been offered in the literature. Most of these definitions are either theoretical (i.e., the proportion of true score variance to total variance) or descriptions of methods of how reliability evidence is obtained. Methodologically speaking, reliability can be defined as the extent to which a sample’s patterns of responses to items are consistent or repeatable across items (i.e., internal consistency), forms of a scale intended to measure the same construct (i.e., alternate form reliability), measurement occasions (i.e., test–retest reliability) or raters (i.e., inter-rater agreement) (Helms, Henze, Sass & Mifsud, 2006, p. 632). Among reliability methods, internal consistency is by far the most widely used method for gauging the reliability of the scores on a measurement scale (Hogan, Benjamin & Brezinski, 2000). One reason for this is that it is the only reliability method that does not require two or more administrations of the scale, two or more form of the scale or two or more raters, and so can be determined with much less data collection burden than test–retest, alternate form or inter-rater reliability. In internal consistency reliability, a single scale administered to a single sample of respondents on a single occasion is utilized to judge how consistent the results are for different items for the same construct within the measure. As Charter (2003, p. 291) points out, an ‘internal consistency coefficient is a measure of the “here-and-now on-the spot” reliability’. Though several coefficients have been proposed for assessing internal consistency reliability (cf. Feldt & Charter, 2003; Osburn, 2000; Zinbarg, Revelle, Yovel & Li, 2005) and despite some calls for its replacement (most heard are those by Rossiter (2002), Bergkviest and Rossiter (2007) and Sijtsma (2009)), Cronbach’s (1951) coefficient alpha has close to an undethronable position within marketing research (Bruner & Hensel, 1993; Churchill, 1979; Duhachek, Coughlan & Iacobucci, 2005; Peterson, 1994; Voss, Stem & Fotopoulos, 2000).
Coefficient Alpha and Essential Tau-equivalency
Also known as the generalized version of Kuder and Richardson’s formula 20 (or KR-20 for short) or as the equivalent of Guttman’s third lower bound λ3, Cronbach’s (1951) coefficient alpha is usually expressed as follows (Cronbach, 1951, p. 299, Equation 2):

where k is the number of items i in the scale (i = 1, …, k),

In Equation (7), the left term tends to 1 as k increases. The denominator of the second term has two components. The first is the same as the numerator and the second is the covariance of all pairs of items i and j. Thus, the more the items covary together by comparison with the sum of their variance, the smaller the ratio, and the higher alpha will be. As such, alpha ‘represents the proportion of a scale’s total variance that is attributable to a common source—that common source being the true score of the latent construct being measured’ (Netemeyer et al., 2003, p. 49).
Alpha could also be written as follows (Cronbach, 1951, p. 304, Equation 16):

where
A great deal of additional work on the characteristics of alpha followed Cronbach’s (1951) early work. Most relevant to our discussion are those made by Novick and Lewis (1967; see also Lord & Novick, 1968, pp. 87–90) who derived, within the CTT framework,
2
the necessary and sufficient condition under which alpha is equal to the true reliability of a composite measurement (i.e.,
Some Classical Test Theory Measurement Models
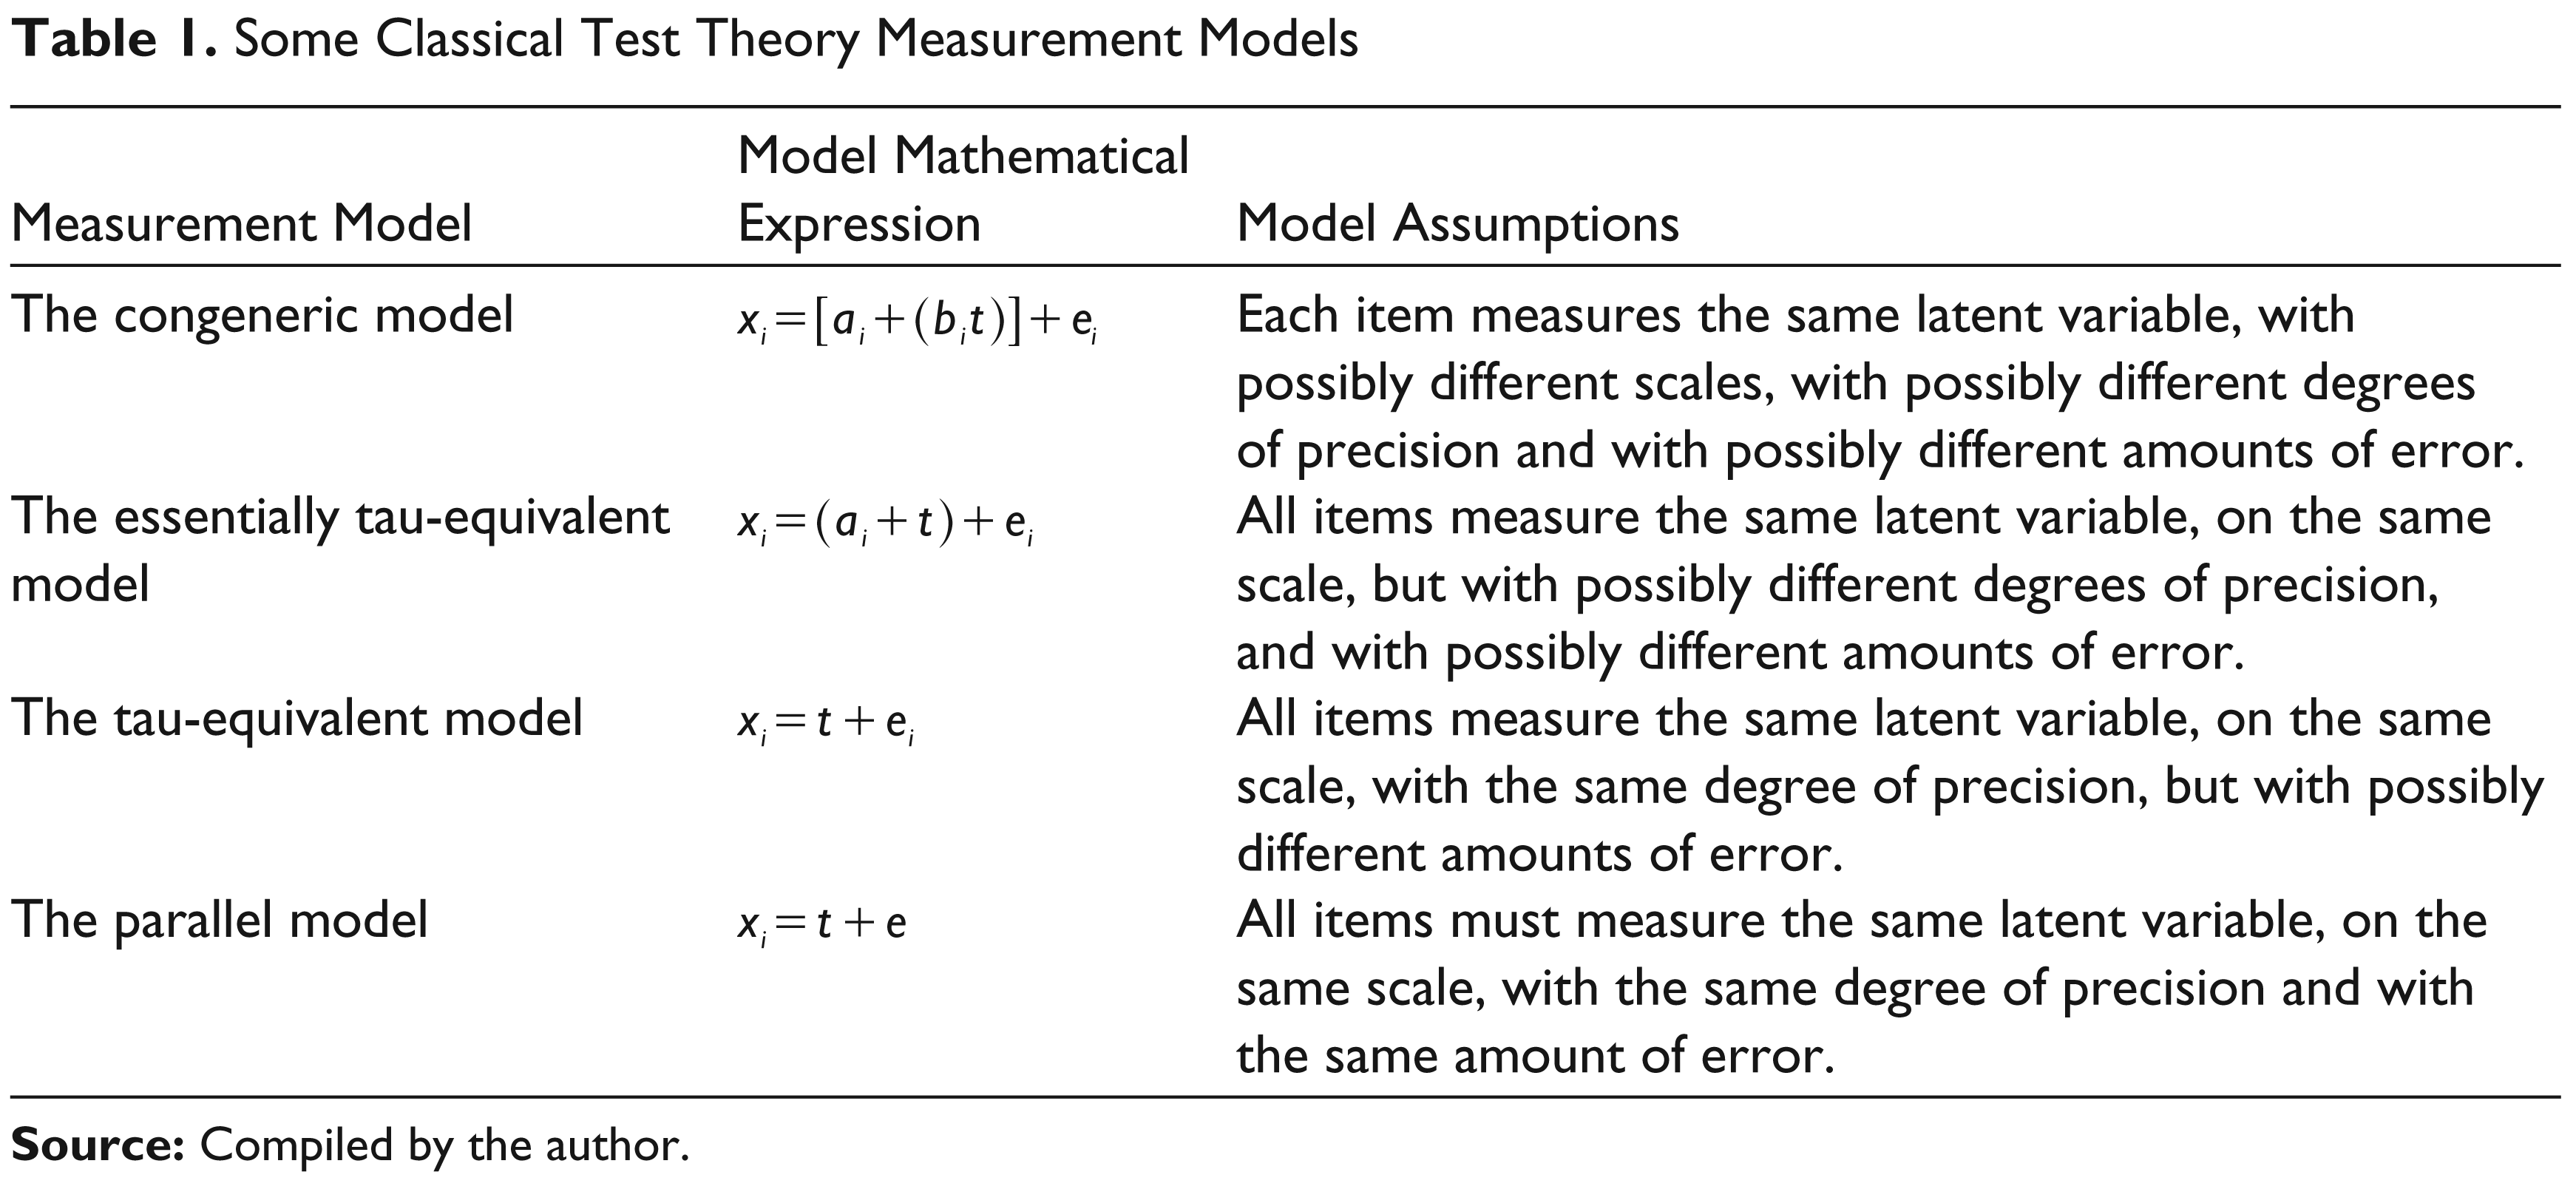
It is obvious that the congeneric, or Jöreskog’s composite reliability, model is the most general, least restrictive model for use in reliability estimation. If all multiplicative constants bi in the congeneric model are set to 1 (inferring that item true scores are measured on the same scale, or have the same standard deviation), we arrive at the essentially τ-equivalent, or Cronbach’s alpha, model. If all additive constants ai are then set to 0 (inferring that not only do item true scores have the same variance but they are also measured with the same degree of precision, or have the same mean), we arrive at the τ-equivalent model. Finally, if all error variances are set to equal one another (i.e., e1 = e2 = . . . = ek), we arrive at the parallel, or Spearman–Brown prophecy formula, model.
It is noteworthy that all these classical theory measurement models assume that all observed variables (i.e., items) measure a single latent true variable. So, alpha, which is an estimate of reliability that is based on the essentially τ-equivalent model, assumes unidimensionality rather than measuring it (Cortina, 1993; Gerbing & Anderson, 1988; Green, Lissitz & Mulaik, 1977; Lee & Hooley, 2005). If the assumption of essential τ-equivalency among items is violated such that different true scores underlie the scale items (i.e., a multidimensional construct), several studies concur that coefficient alpha provides a downwardly biased estimate of true reliability (Cronbach et al., 1965; Kamata et al., 2003; Komaroff, 1997; Raykov, 1997, 1998; Osburn, 2000; Rae, 2007, 2008). To obtain an unbiased estimator of reliability under multidimensionality, it is possible to resort to a modification of coefficient alpha that was originally proposed by Lee J. Cronbach and his colleagues (Cronbach et al., 1965; Rajaratnam et al., 1965) and which is known in psychometrics as stratified alpha.
Stratified Scales and Stratified Alpha
In psychological measurement, there are situations where a test (i.e., scale) has been constructed by clustering items into strata. The items within each stratum being concerned with a single ability (i.e., construct), a single response format (i.e., summated or Likert scale, semantic differential or dichotomous) or sharing a dependence on a specific body of material, such as a reading passage or a graph. Such strata are commonly referred to as sub-scales, sub-factors or dimensions in the marketing literature. To estimate the reliability of such a scale, Cronbach and his colleagues (Cronbach et al., 1965; Rajaratnam et al., 1965) proposed stratified alpha.
Stratified alpha (i.e., αS) could be expressed as follows (Feldt & Qualls, 1996; Kamata et al., 2003; Nunnally, 1967; Osburn, 2000; Rae, 2007, 2008; Rajaratnam et al., 1965):

or alternatively as

where s is the number of strata or sub-scales within a scale (i = 1, …, s), αi is the estimate of reliability for the ith subscale,
Using hypothetical data, Cronbach et al. (1965, pp. 306–309) were among the first researchers to demonstrate that stratified alpha could be substantially greater than alpha, especially when the sub-scales differed in terms of content and/or difficulty. Other results come from Feldt and Qualls (1996) who mathematically illustrated that the magnitude of the negative bias in alpha for multidimensional scales is directly linked to the number of sub-scales and inversely related to the number of items within sub-scales. That is, the greater the number of sub-scales or dimensions, the greater is the bias in alpha. The greater the number of items within sub-scales, the lesser the bias in alpha. Feldt and Qualls (1996) also showed that stratified alpha will always be less than alpha if the average item covariance between sub-scales is greater than the average item covariance within sub-scales. This last point was recently reinforced by Rae (2008).
The article by Osburn (2000) reports a simulation study that compares various internal consistency reliability estimates closely related to coefficient alpha. In some of the simulated data sets, the items were multidimensional rather than unidimensional. In one of these multidimensional data sets, Osburn (2000) grouped four items into two sub-scales of two items each. Results illustrate that stratified alpha equalled true reliability irrespective of whether the items were parallel, τ-equivalent or congeneric and irrespective of the degree of heterogeneity in the two-factor data (i.e., the correlation between the two factors) (see Osburn, 2000, p. 349, Table 1). By contrast, for the two-factorial data, coefficient alpha underestimated the true reliability and this underestimation worsened considerably as heterogeneity increased. In the most heterogeneous case 4 (i.e., correlation of only 0.20 between the two factors), coefficient alpha was only 0.234 as opposed to a true reliability of 0.703. Next, Osburn (2000) grouped eight items into two sub-scales of four items each. The results mirror the previous data set results. Stratified alpha precisely equalled true reliability irrespective of parallelism, τ-equivalency and congenericity among the items scores and irrespective of the degree of heterogeneity (see Osburn, 2000, p. 351, Table 2). Alpha underestimated the true reliability and this underestimation got worse considerably as heterogeneity increased. In the most heterogeneous case (i.e., correlation of only 0.20 between the two factors), coefficient alpha was only 0.204 in contrast to a true reliability of 0.613, thus demonstrating this coefficient’s inappropriateness in situations in which the assumption of unidimensionality is violated. Osburn (2000) also showed, for the two multidimensional data sets, that most of the studied reliability coefficients underestimate true reliability. Exceptions are stratified alpha and Li et al.’s (1996) maximal reliability. However, whilst stratified alpha provides a precise and accurate reliability estimate, maximal reliability overestimates true reliability.
Means and Standard Deviations for the Store Personality Scale Items
Kamata et al.’s (2003) simulation study results corroborate Osburn’s (2000) findings in the sense that coefficient alpha has shown to largely underestimate true reliability. This negative bias is more important when the correlation between sub-scales (or dimensions) is low. So, according to Kamata et al. (2003, p. 10), ‘it is not appropriate to use coefficient alpha as an estimate of the reliability of a multidimensional composite scale score, unless the correlation between dimensions is high’. Through hypothetical data and a variety of simulation models, Kamata et al. (2003) also evaluated the performance of stratified alpha against McDonald’s (1970, 1999) omega and Li et al.’s (1996) maximal reliability. Their study results showed, among other things, very small discrepancies between stratified alpha and true reliability (typically to the fourth decimal place). They came up with the conclusion that McDonald’s (1999) omega ‘provides a good estimate of true reliability, but one has to be aware that it may overestimate the true reliability’ and that ‘stratified alpha appeared to be the most reliable procedure among the three alternative methods’ (Kamata et al., 2003, p. 15).
However, according to Rae (2007, p. 182), Kamata et al.’s (2003) findings are not fully surprising for the simple reason that their simulated data sets are essentially τ-equivalent within each sub-scale. In fact, for stratified alpha to equal true reliability, Rae (2007) demonstrated that items within each sub-scale must be essentially τ-equivalent. If one or more sub-scales have items that are congeneric, then stratified alpha will always be a lower bound to reliability (i.e., stratified alpha will at its turn underestimate true reliability). Rae (2007) also introduced correlation among measurement errors into the discussion. Rae (2007) showed that if items within sub-scales are essentially τ-equivalent and errors of measurement are positively (vs negatively) correlated, stratified alpha will overestimate (vs underestimate) the true reliability to some extent. Albeit this might be seen as one stratified alpha caveat, Rae (2007, p. 183) argued that ‘[t]his is not a particular weakness of stratified alpha’ because many others reliability estimators suffer from the same drawback (cf. Lucke, 2005; Raykov, 1998).
Of all the empirical evidence reviewed above, two findings warrant special attention. The first is that, just like alpha, essentially τ-equivalent items (within each sub-scale) are actually required for stratified alpha to equal true reliability. The second is that stratified alpha is at best (i.e., in case of τ-equivalent items and uncorrelated measurement errors) a precise estimator of true reliability and at worst (i.e., in case of congeneric items with correlated measurement errors) a better lower bound to reliability than alpha for the entire scale.
Objective
This article’s main aim is to instruct marketing researchers about stratified alpha’s significance, characteristics and calculation.
Methodology
Measure
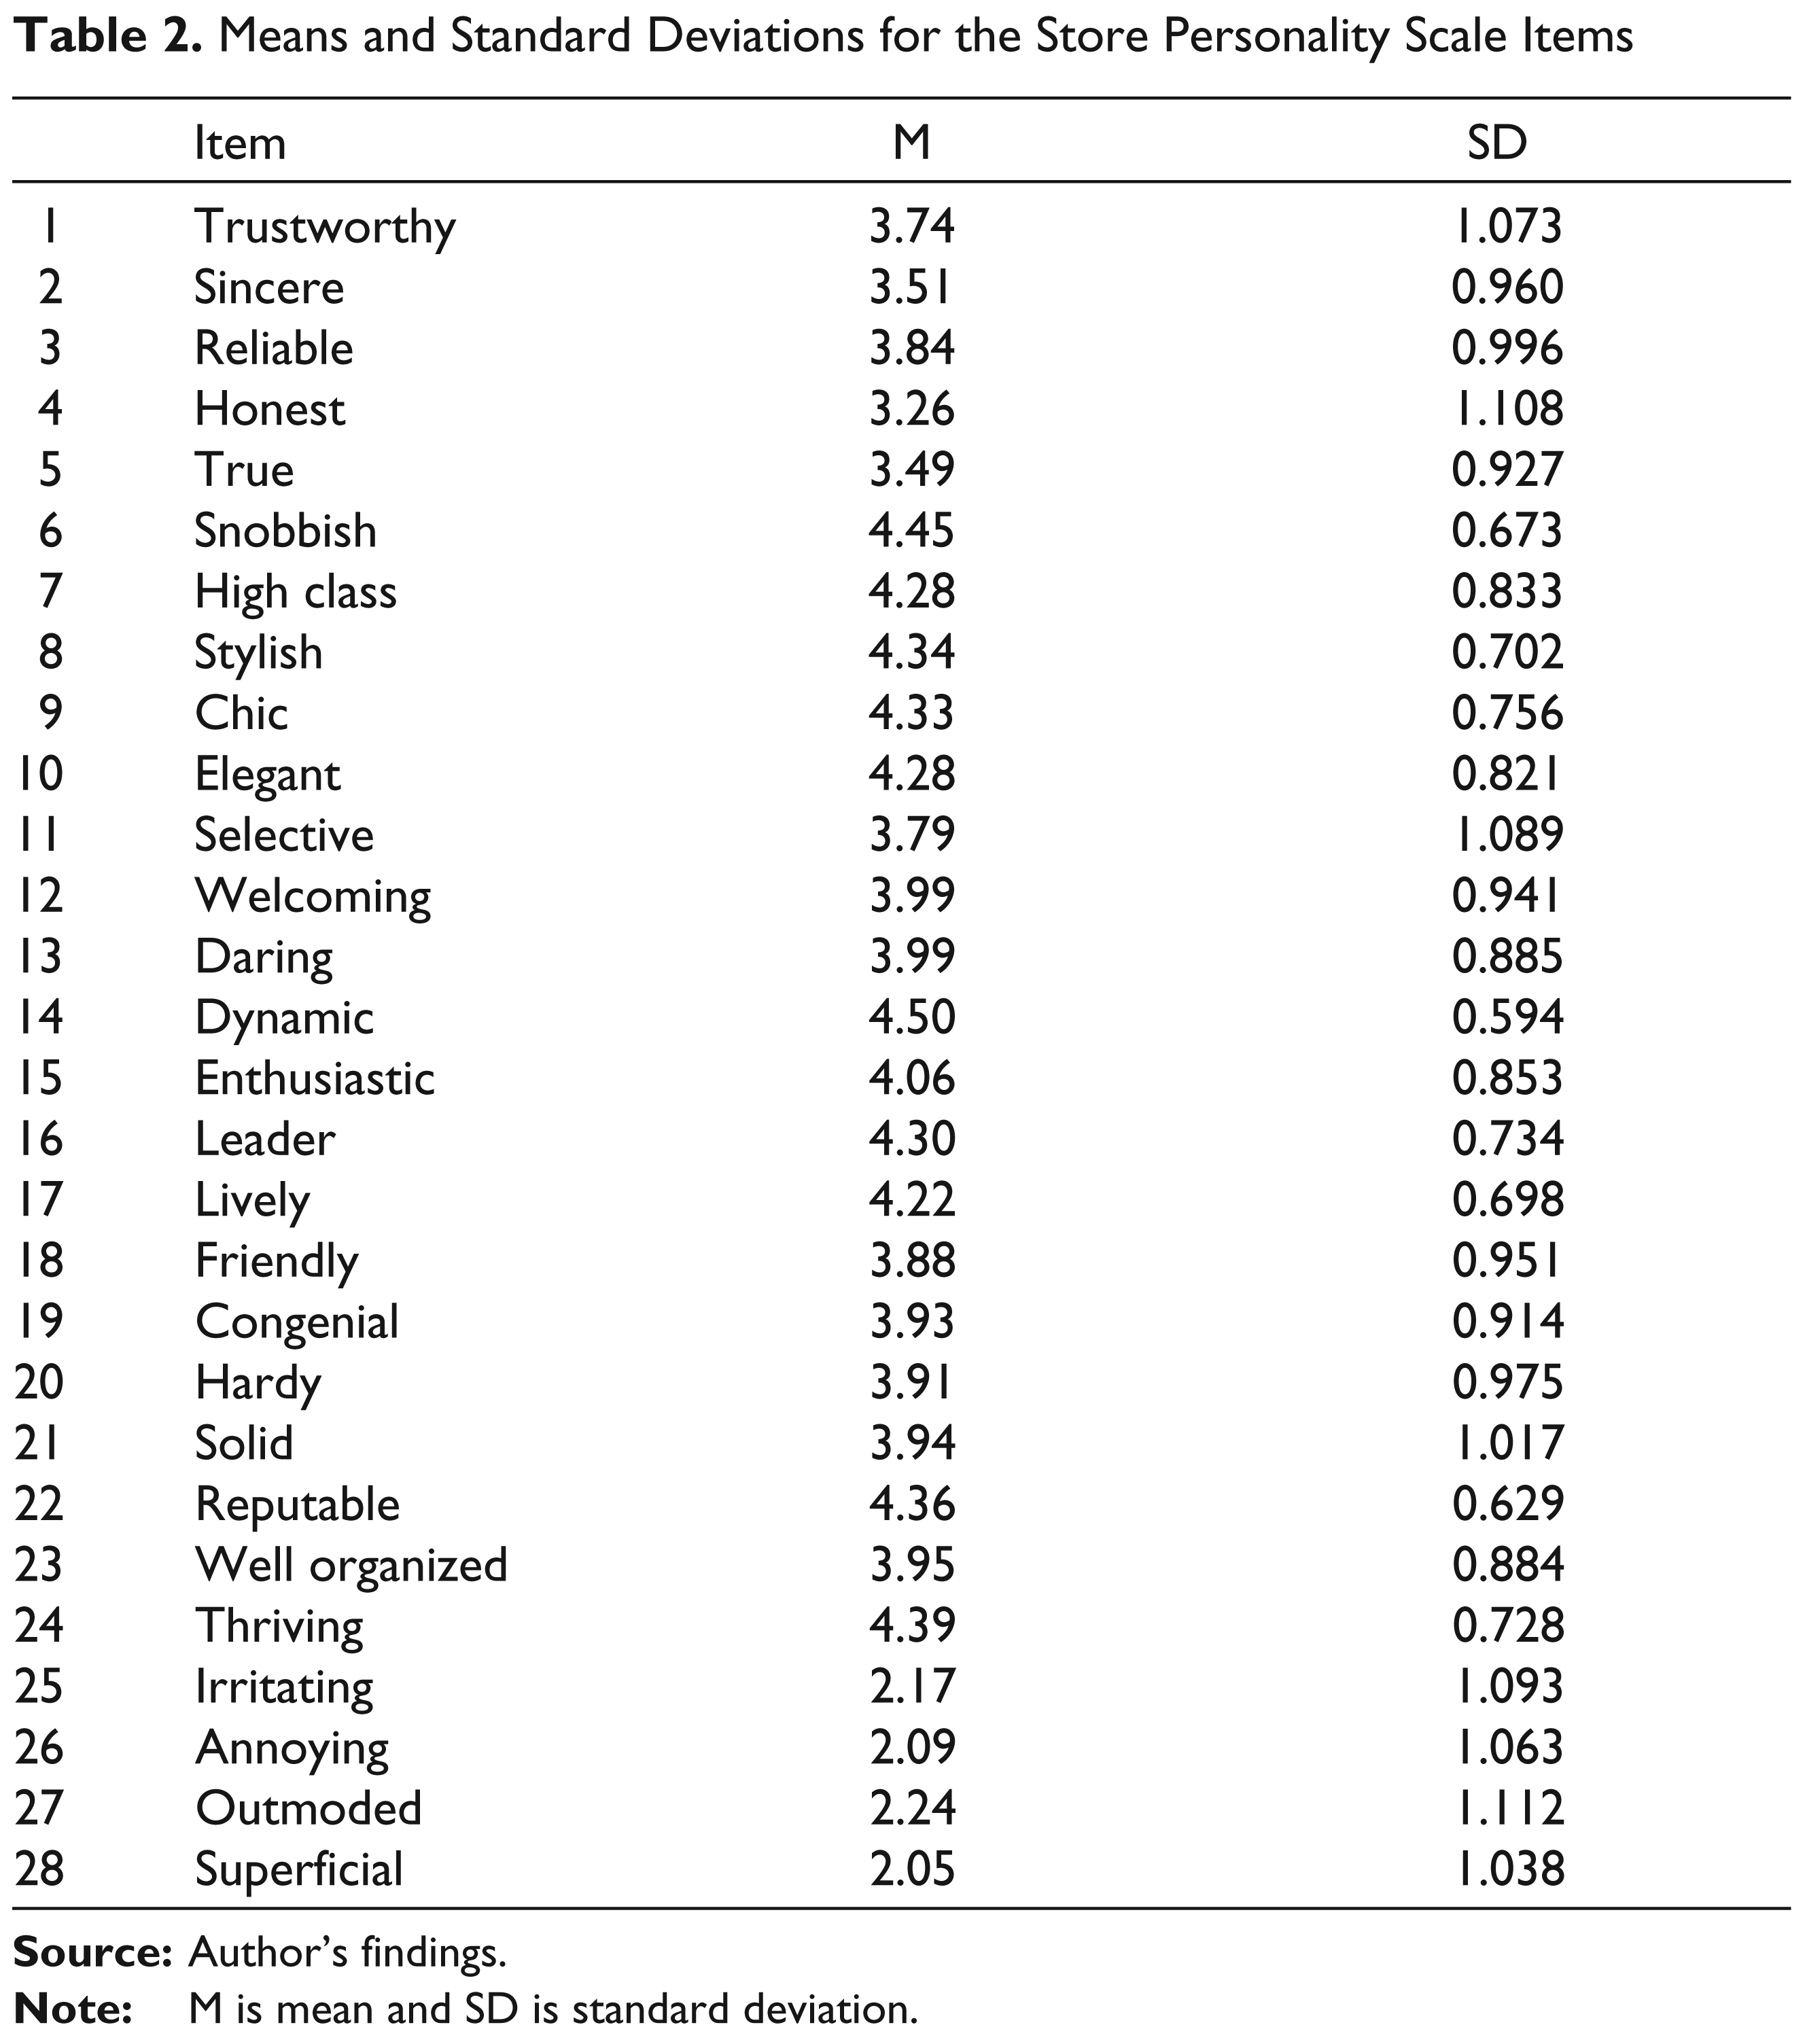
The data here analyzed were collected using a refined version of D’Astous and Lévesque’s (2003) store personality scale (i.e., 28 items). D’Astous and Lévesque’s (2003) original scale contains 34 items, with a 20-item reduced version. The refined version (i.e., 28 items) used here was obtained after reconsidering the face validity—that is, the items must reflect what they are intended to measure (Hardesty & Bearden, 2004, p. 99)—of the store personality scale. D’Astous and Lévesque (2003) define store personality as ‘the mental representation of a store on dimensions that typically capture an individual’s personality’ (p. 57). In line with the ongoing debate on the definition of brand personality (see Aaker, 1997; Azoulay & Kapferer, 2003; Geuens, Weijters & De Wulf, 2009), store personality is here conceptualized as the set of human personality traits that are both applicable and relevant to a store. Driven by face validity considerations and following Hardesty and Bearden’s (2004) recommendations, a qualitative purification process (that included expert judgements and a pretest) was conducted. First, a French version of the original 34-item store personality scale, directly taken from D’Astous, Hadj Saïd and Lévesque (2002, p. 121), was presented to three marketing academics with backgrounds in measurement and retailing. To determine whether each item should be retained for further analyses, the three ‘expert judges’ were given the above-mentioned definition of store personality and were instructed to indicate the probability of using each of the 34 items to describe a store. The items were rated with the following scale: (i) definitely probable, (ii) somewhat probable and (iii) not at all probable. Items that were not rated as probable by at least two of the three judges, such as ‘conservative’, ‘genuine’ and ‘imposing’, were dropped resulting in a 31-item solution. During a discussion group with the expert judges, the removal of these items was then debated. From this discussion group, an additional consensus emerged regarding the item ‘upscale’ that was considered as more representative of social class rather than a personality trait. Therefore, the item ‘upscale’ was discarded. Second, a pretest sample of nine adult respondents was then obtained through face-to-face interviews. The two primary purposes of this pretest were to detect ambiguous items and to determine whether there is any problem with the French version of the intended questionnaire. From the pretest respondents’ comments, the items ‘loud’ and ‘conscientious’ appeared to be extremely ambiguous. Thus, they were considered for deletion. The remaining pool of 28 items that was used for the main study data collection is presented in Table 2.
Data Collection
Data collection took place inside two retail stores (store intercepts) located in the high-/middle-class suburbs of a major city. Respondents (i.e., customers or simple visitors) were intercepted after their shopping trip at the main exit/entrance of each superstore by a trained individual. They were handed the questionnaires, instructed to think of each store as having its own personality and invited to fill in the self-administrated survey sheet. Store personality items were evaluated on a five-point bipolar scale analogous to the one adopted by D’Astous and Lévesque (2003). So, each item is an adjective with five ordered answer categories (1 = ‘not at all descriptive of the store’ to ‘5 = completely descriptive of the store’). Questionnaire filling took between 15 and 20 minutes. Over a period of 2 weeks of data collection, 200 self-administrated questionnaires were gathered from each superstore. Eight survey sheets containing missing data were discarded resulting in 392 questionnaires usable for analysis. Consistent with D’Astous and Lévesque (2003), we pooled the data collected from both stores in a single database. The total sample of 392 respondents contains more females (271) than males (121). About 58 per cent of the respondents declared to be singles. The vast majority (70.154 per cent) of the respondents were in the 25 and more age brackets. Therefore, the data to be analyzed contain the scores of 392 respondents on 28 items. Table 2 presents item means (M) and standard deviations (SD).
Analysis
Dimensionality Detection Procedures
In this study, not one but three different criteria for determining the number of factors to retain were employed. Kaiser–Guttman rule (i.e., eigenvalues grater than one), the customary factor retention criterion in marketing research, was of course the first one. However, since many studies have demonstrated that Kaiser–Guttman criterion tends to overestimate the number of factors to retain (see Patil, Singh, Mishra & Donavan, 2008; Zwick & Velicer, 1986), Horn’s parallel analysis (PA; Horn, 1965) and Velicer’s minimum average partial correlation (MAP; Velicer, 1976) were chosen as two additional dimensionality detection measures. Parallel analysis and MAP are currently presented as the most accurate criteria for determining the correct number of factors to retain (cf. Patil et al., 2008).
The exploratory factor analysis (EFA) employed here could be described as follows. Given that the author’s aim is to discover the common factors underlying the responses to the 28 items and not to reduce the data analyzed, principal axis factoring (PAF) was chosen as extraction method instead of principal component analysis. An oblique rotation (i.e., PROMAX) was preferred to an orthogonal one since few, if any, dimensions in reality are completely orthogonal especially within the same scale (Iacobucci, 1994, 2001; Preacher & MacCallum, 2003).
This more thoughtful EFA procedure was performed using SPSS 12.0. The SPSS computer codes (or syntaxes) for performing PA and MAP factor retention criteria were taken from O’Connor (2000, pp. 399–401). 5
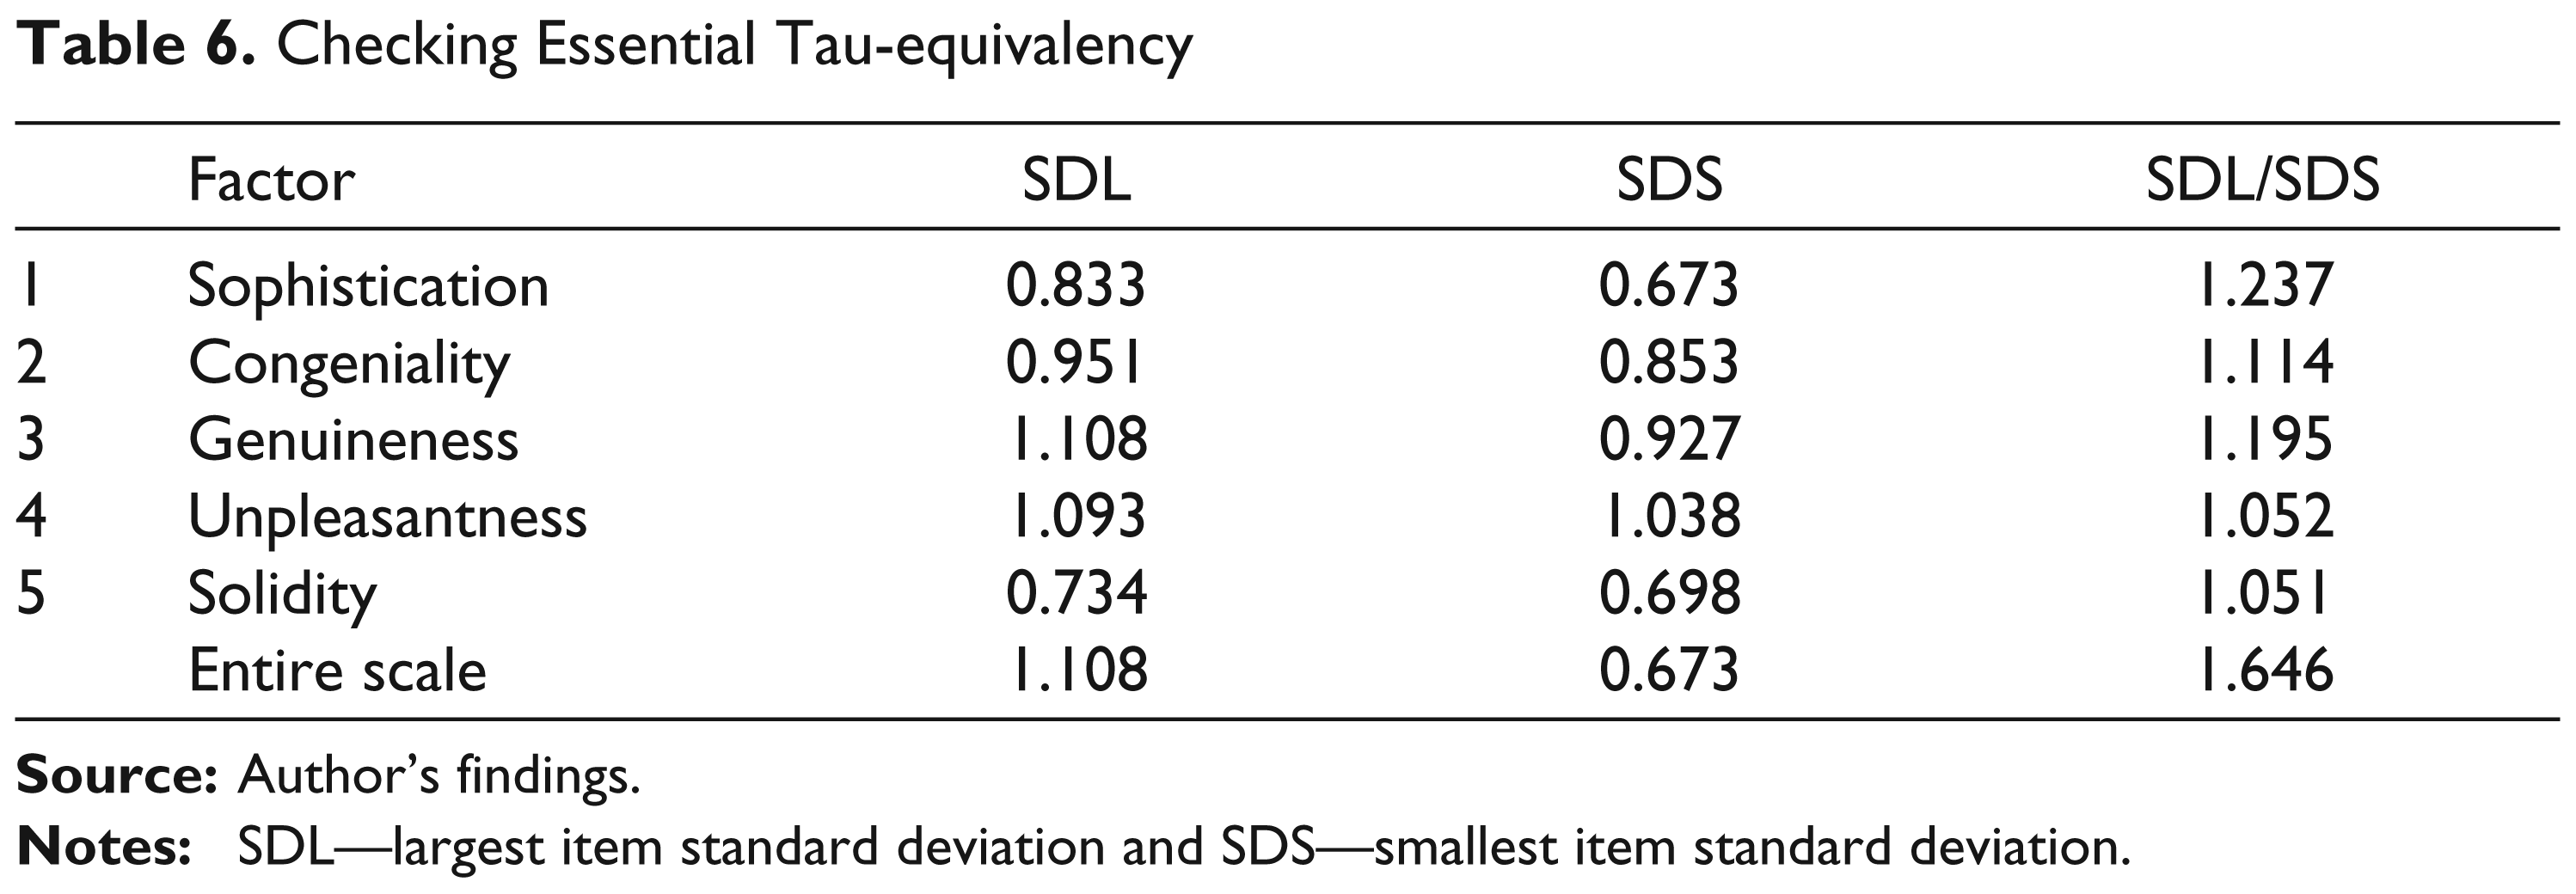
Checking Essential Tau-equivalency
Since essential τ-equivalency assumes that items are measured on the same scale (i.e., same response format), examining item SD may be of some usefulness (Graham, 2006). A very simple yet effective strategy for investigating whether the obtained data fit the assumptions of essential τ-equivalency that was described in Feldt and Charter (2003) was applied here. Feldt and Charter (2003) recommended that a researcher should examine the ratio of the largest item standard deviation (SDL) to the smallest item standard deviation (SDS). If the ratio SDL/SDS is between 1 and 1.30 (i.e., the largest SD at the item level does not exceed the smaller SD by more than 30 per cent), then alpha might be an appropriate internal consistency reliability index. Larger differences indicate that the researcher should consider other coefficients because the data do not conform to the model of essential τ-equivalence.
Results
Dimensionality
As expected, the different criteria that this study employs for determining the number of factors to retain are not completely convergent. Table 3 shows the first 10 eigenvalues from real data, their corresponding 95th percentile eigenvalues from 500 random correlation matrices and the average squared correlations for the first 10 roots. It indicates that while Kaiser–Guttman criterion suggests that at least the seven factors that exhibited eigenvalues greater than one should be retained, both PA and MAP suggest five.
Factor Retention Criteria
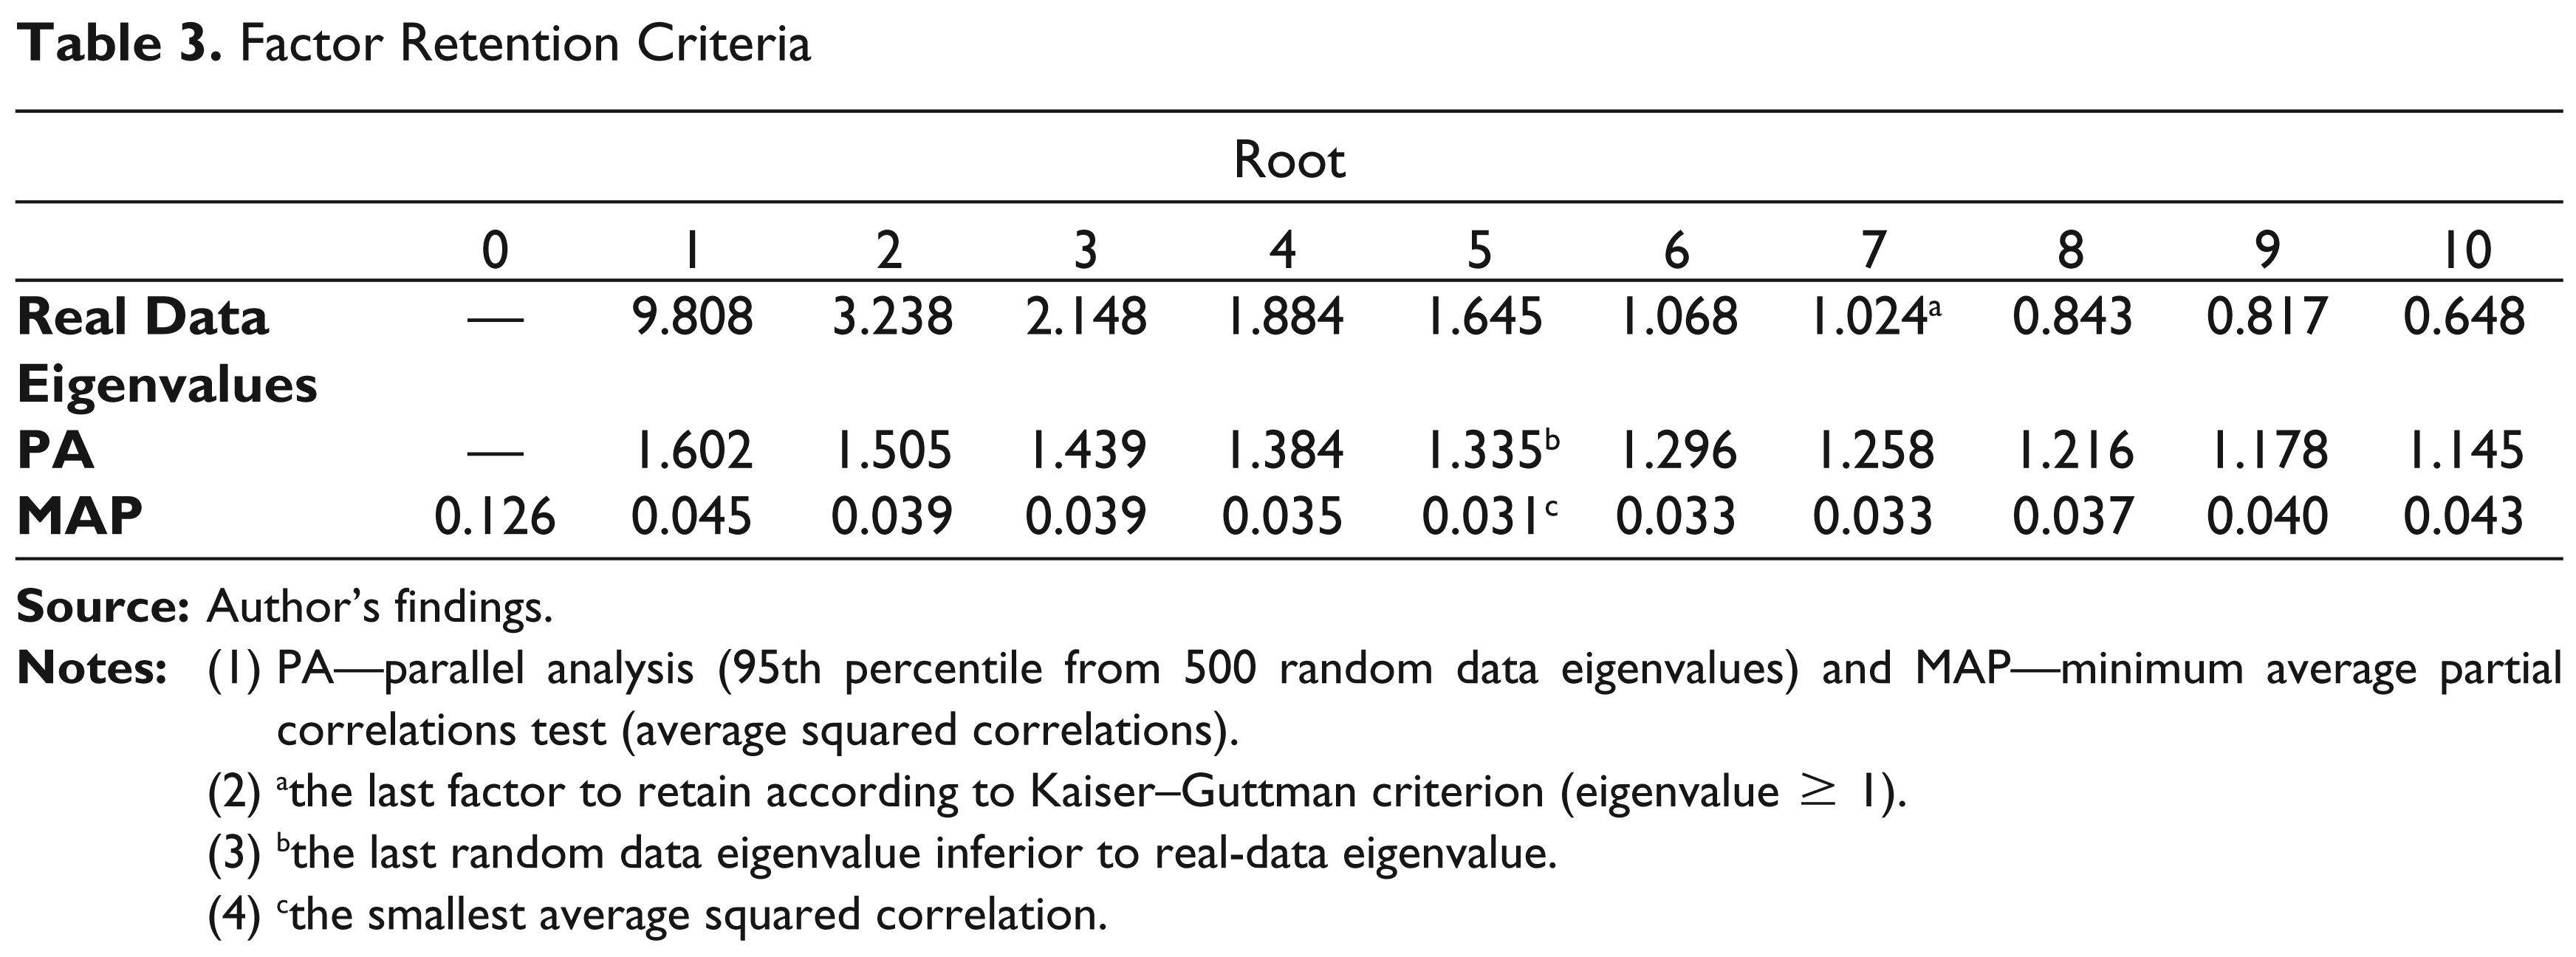
(2) athe last factor to retain according to Kaiser–Guttman criterion (eigenvalue $ 1).
(3) bthe last random data eigenvalue inferior to real-data eigenvalue.
(4) cthe smallest average squared correlation.
After presetting the number of factors to extract to five and performing an iterative purification process with a series of PAF analysis, only 20 adjectives remained. The Kaiser–Meyer–Olkin (KMO) measure of sampling adequacy yielded a value of 0.822 and the Bartlett’s test of sphericity obtained an approximated chi-square statistic of χ2 (190) = 6438.266 (p < 0.001) indicating that the data set is adequate for an EFA. The communalities and the factor loadings for the PROMAX-rotated five- factor solution are presented in Table 4. The communality estimates ranged from 0.420 to 0.906. The items loaded heavily (i.e., all factor loadings ≥ 0.50) on the five extracted factors with factor loadings ranging from 0.533 to 1.033. 6 From these results, it is clearly apparent that five factors lie behind the 20 retained items listed in Table 4. The four first factors can be interpreted as sophistication,congeniality, 7 genuineness and unpleasantness. Judging by the highest factor loadings for the items ‘leader’, ‘lively’ and ‘thriving’, the fifth factor was labelled vivaciousness.
The 20 Retained Items from PAF Analysis with PROMAX Rotation
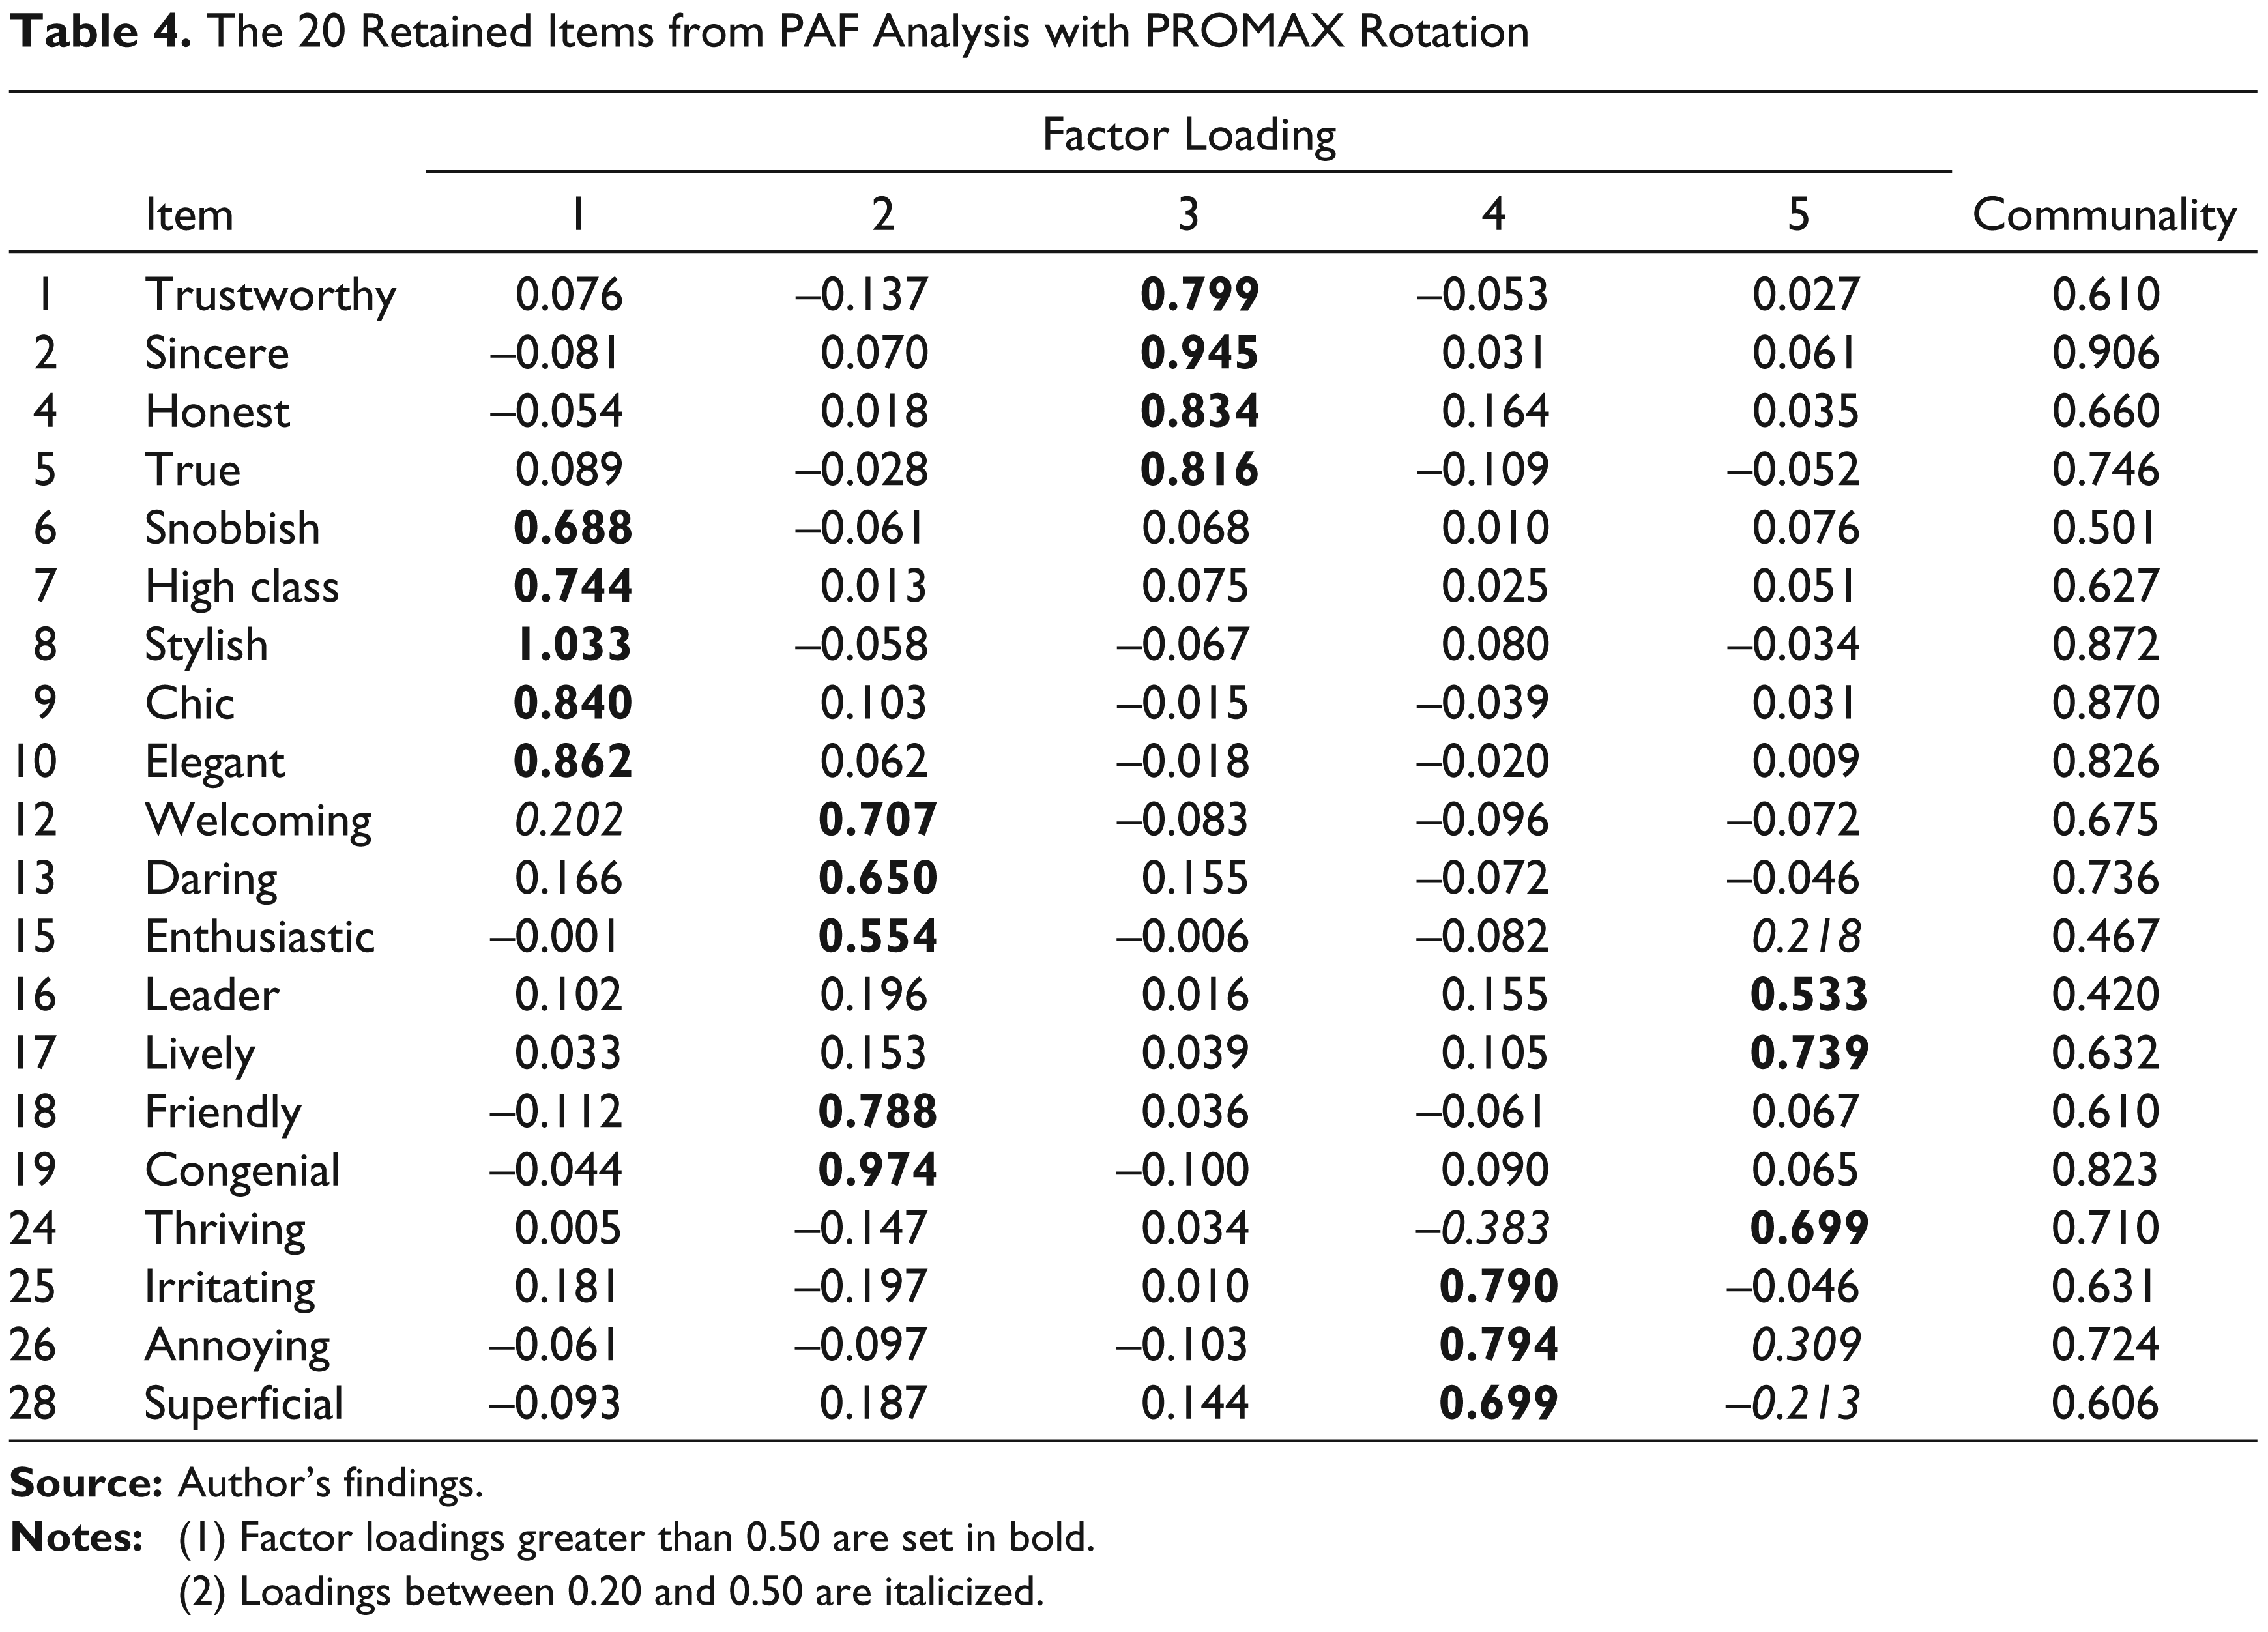
(2) Loadings between 0.20 and 0.50 are italicized.
One of the advantages associated with using oblique rotations is that factor correlations are estimated. As Table 5 reveals, the five factors were insignificantly (i.e., 0.039, not significant) to moderately (i.e., 0.60, p < 0.001) intercorrelated. As might be guessed, the unpleasantness factor was negatively correlated with the other four factors. The mean inter-factor correlation was found to be 0.337.
Factor Correlations Matrix

Essential Tau-equivalency
Results from Feldt and Charter’s (2003) procedure indicate that the assumption of essential τ- equivalence among items within each of the five sub-scales is tenable. Given that the SDL/SDS ratios for the sub-scales varied between 1.051 and 1.237 and thus below the 1.30 threshold, we could resort to alpha for gauging the internal consistency of the five sub-scales. The SDL/SDS ratio for the scale as a whole yielded a value of 1.646 indicating that alpha should not be used for estimating the internal consistency reliability of the entire scale (Table 6).
Checking Essential Tau-equivalency
Alpha Coefficients for the Sub-scales and Alpha for the Entire Scale
Using SPSS 12, the alpha coefficients for the sub-scales scores were 0.927 for sophistication, 0.891 for congeniality, 0.899 for genuineness, 0.781 for unpleasantness and 0.736 for vivaciousness (with an average of
Alpha Coefficients and Alpha for the Entire Scale
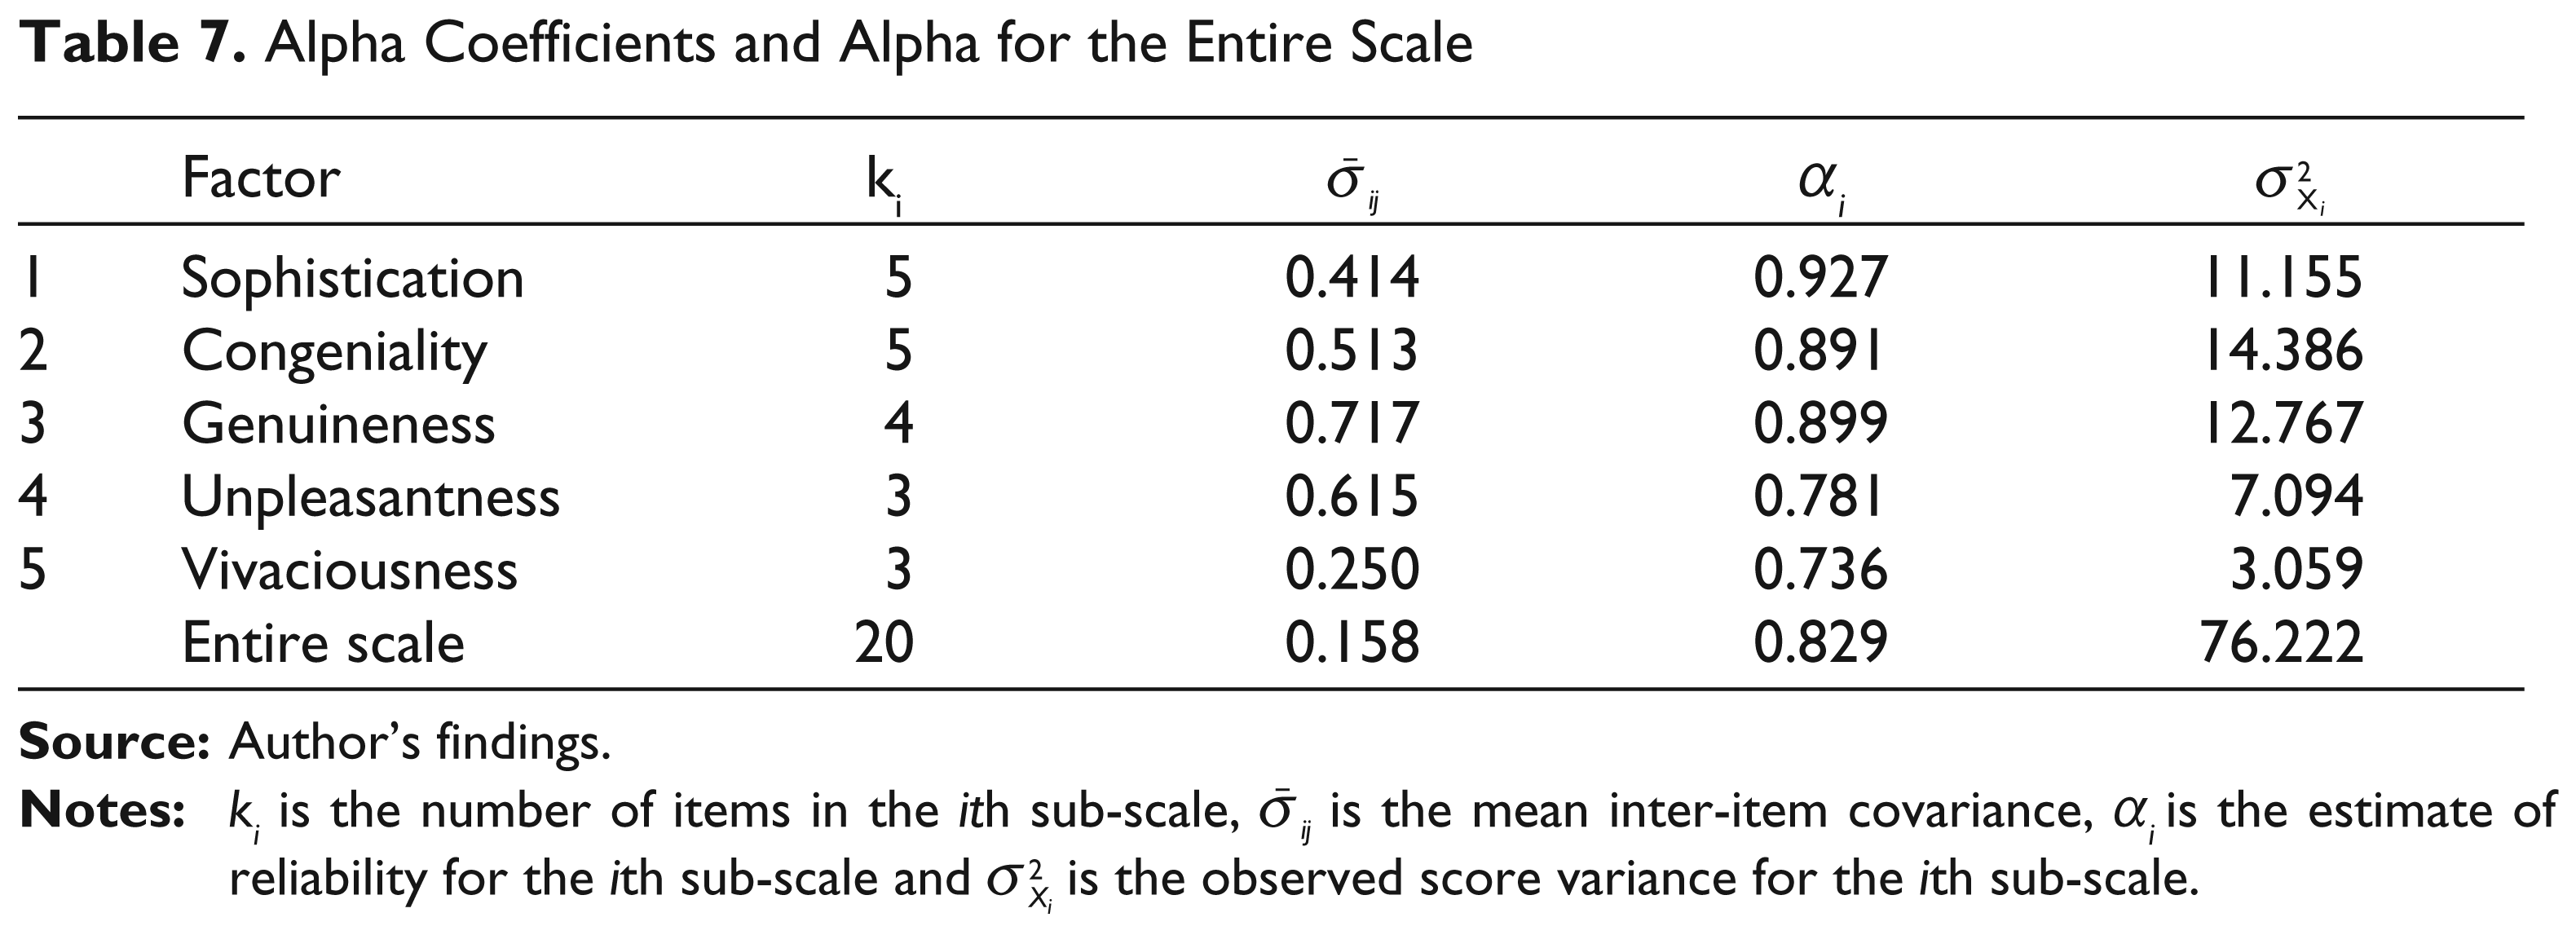
Using Equation (8), alpha for the entire store personality scale score was found to be 0.829. Such a value indicates that a scale can contain even five dimensions and still return an alpha greater than 0.80. Thus, the existence of a single underlying factor is not a prerequisite for high alpha values (Cortina, 1993; Green et al., 1977).
Stratified Alpha
Using Equation (10) and the estimates in Table 7, the value of stratified alpha is given by the following:

The ratio of stratified alpha to alpha for the entire scale score yielded a value of 1.109 indicating that stratified alpha is approximately 11 per cent higher than alpha. Hence, for this particular data set, the discrepancy between alpha and stratified alpha was substantial. The same kind of conclusion could be drawn for the ratio αS /
Other Reliability Indexes
For the sake of illustration, two additional multidimensional reliability coefficients were also computed (see Appendix A). Heise and Bohrnstedt’s (1970) omega obtained a value of Ω = 0.939 and McDonald’s (1985, p. 217, equation 7.3.9) omega was ω = 0.957. Thus, for this particular data set, stratified alpha is only 2 per cent lesser than Heise and Bohrnstedt’s (1970) Ω and 4 per cent lesser than McDonald’s (1985) Ω, that is αS < Ω < ω. This inequality displays that stratified alpha provides a fairly conservative estimate of multidimensional reliability in comparison to McDonald’s (1985) coefficient ω, a point noted by Kamata et al. (2003) in their simulation study.
Additionally, Rossiter (2002, p. 322) suggests that a minimum Revelle’s (1979) beta, β = 0.50, is required for inferring that a second-order general factor underlying the dimensions or sub-scales accounts for at least 50 per cent of the item score variance (see also Revelle, 1979, p. 68). Revelle’s beta was computed and obtained a value of β = 0.54 indicating that 54 per cent of the variance at the items level is due to a general second-order factor, that is, store personality.
Conclusion
Marketing researchers often have to deal with multidimensional constructs. When they are developing a new multidimensional scale or simply using a pre-established one, readers and especially reviewers expect them to report a reliability index. The overall message from this report is that coefficient alpha (or an average for alpha values) should not be that index. All along this article, the author speaks in praise of one coefficient (i.e., stratified alpha) which seems to be an extremely useful option when a measure possesses some degree of multidimensionality.
To curtail all misunderstandings, it must be indicated that the author has no wish to originate a blind adherence to this index. Although it may seem that the assumptions of the essentially τ-equivalent model most often correspond to the type of data that marketing researchers collect (i.e., same response format within a scale), using stratified alpha should not be pro forma but rather should reflect informed decision -making about which classical theory measurement model one’s data best fit. Researchers have to keep in mind that essential τ-equivalency among items within sub-scales is required for stratified alpha to be an unbiased estimator of reliability. If the congeneric model conforms more to the collected data, multidimensional reliability coefficients, such as those provided by Werts et al. (1978) and McDonald (1985, 1999), would probably be better alternatives to stratified alpha. As a good reliability assessment practice, researchers are here encouraged to always check whether their data are essentially τ-equivalent and to use the appropriate measurement model and index to estimate reliability.
Good statistical practice would also dictate that point estimation should be supplemented by interval estimation (Duhachek et al., 2005). Several techniques for interval estimation of alpha have been proposed and recently reviewed by Duhachek and Iacobucci (2004). Some of these methods should also be helpful for obtaining a standard error and confidence interval when estimating stratified alpha. This makes confidence interval estimation of stratified alpha a topic that should be studied in detail in future investigations.
This study has a number of limitations. The first limitation is that this article has focused squarely on a single aspect of scale development (and usage), that is, internal consistency reliability. The second limitation is that the general point argued in this article is only relevant to one kind of multidimensional constructs where the relationships flow from the first-order latent factors (or dimensions) to their indicators (i.e., items) and where these first-order factors are themselves indicators of an underlying second-order construct. This type of construct is termed—in Jarvis, MacKenzie and Podsakoff’s (2003) terminology—a reflective first-order and reflective second-order construct. A third limitation is that this study employs a single scale administered to a single sample of respondents to support its argumentation. A final limitation is that with real data, true reliability is unknown. Real data may also be vulnerable to inflated/attenuated correlation due to systematic bias.
Footnotes
Acknowledgements
The author is grateful to GBR’s anonymous referees for their extremely useful suggestions to improve the quality of the article. Usual disclaimers apply.
Heise and Bohrnstedt’s ( 1970 ) Ω
Heise and Bohrnstedt (1970) suggested Ω as a reliability index in the context of factor analysis and worked on the basis of the sample correlation matrix
where
where