
Abstract
The Career Adapt-Abilities Scale (CAAS) has become one of the most widely used questionnaires to assess career adaptability. To facilitate its integration into large surveys, in varied settings, the aim of this article was to develop a brief 12-item version, the Career Adapt-Abilities Scale–Short Form (CAAS-SF). A sample of 2,800 French- and German-speaking adults living in Switzerland completed the CAAS. On a first random subsample, a principal component analyses conducted on the CAAS-SF suggested a four-factor solution. A one-to-one association was found between these components and the subscales of the CAAS-SF. Confirmatory factor analyses, conducted on a second random subsample, confirmed the hierarchical factor structure of this short version. Based on Cheung and Rensvold’s criteria, the CAAS-SF reached measurement equivalence across linguistic and gender groups. Furthermore, the 12- and 24-item versions were strongly associated. The results supported the CAAS-SF as pertinent and economical alternative to the 24-item version.
Keywords
Introduction
Due to transformations in economy, society, and technology, the world of work—and consequently the nature of employment—has seen dramatic changes over the last two to three decades, resulting in higher labor market uncertainty and competition, employment insecurity, and fragmented career paths (Baruch & Bozionelos, 2011). In this context, new barriers interrupt professional paths across adulthood, making them more unstable and less predictable (Mercure, 2001). Professionally active individuals (or career actors) often need to repeatedly consider their current situation and future possibilities and make decisions to foster their career or take new directions (Baruch & Bozionelos, 2011). In this unstable and challenging environment, regulation skills and adaptability resources (and more specifically career adaptability) that people can activate (or reactivate) are crucial competencies for mastering unpredictable and changing tasks and demands, and private and career transitions throughout the adult life-span (Rossier, 2015). To measure career adaptability, an instrument was recently developed, the Career Adapt-Abilities Scale (CAAS; Savickas & Porfeli, 2012). However, for survey studies with large and representative samples or in applied contexts, it is important to use scales with the least possible number of items. For this reason, the aim of this contribution is to validate a brief 12-item version of the CAAS. Also, the association between the complete and brief versions of the CAAS on one hand, and the two versions of the CAAS and some criterion variables (such as occupational self-efficacy) on the other hand were tested.
Career adaptability represents a pivotal construct in career construction theory (CCT; Savickas, 1997, 2005) and reflects the constellation of individuals’ behaviors, competencies, and attitudes engaged “in fitting themselves into work that suits them” (Savickas, 2005, p. 45). This concept has been proposed by Savickas (1997) as a way to bridge the major theoretical segments composing Super’s (1990) life-span and life-space theory (i.e., life-role theory, developmental self-concept theory, and career development theory). The CCT integrates vocational personality, career adaptability, and life themes and represent, respectively, the what, how, and why of vocational behavior (Savickas, 2005). Thus, interindividual differences in career adaptability concern the “how” individuals build and develop their career. Savickas and Porfeli (2012, p. 662) define career adaptability resources as “the self-regulation strengths or capacities that a person may draw upon to solve the unfamiliar, complex and ill-defined problems presented by developmental vocational tasks, occupational transitions, and work traumas.” So, these resources contribute to develop and determine the strategies that individuals use to direct adaptive behaviors.
Savickas (2005) describes career adaptability as multidimensional and hierarchical, where a higher order general career adaptability dimension includes four career adaptabilities supporting self-regulation strategies that are concern, control, curiosity, and confidence. Concern indicates the extent to which an individual is aware of and prepares his or her own vocational future. Control reflects beliefs about personal responsibility for preparing their career and the perceived personal control over their vocational situation and future. Curiosity reflects the personal tendency and the ability to explore professional environments, for example, by exploring and learning about types of work and occupational opportunities. Finally, confidence suggests perceived self-efficacy to solve problems and the ability to successfully do the necessary to overcome obstacles encountered in professional activities (Savickas, 2005; Savickas & Porfeli, 2012).
Regarding the measure of the career adaptabilities, an international team of vocational psychologist from 18 countries adopted a multicentric approach (Duarte & Rossier, 2008) to jointly develop the CAAS. The first step was to cross-culturally specify the main aspects and dimensions of career adaptability and define a set of 25 items for each dimension. Based on several pilot studies, the number of items was reduced to 11 for each of the four dimensions. This pool of 44 items represented the CAAS research form (or CAAS 1.0). Subsequently, the research form was administered to different population of students and workers across 13 countries (e.g., Brazil, China, Italy, Switzerland, and United States). The data were analyzed to reduce the number of items for each dimension to six and to examine the hierarchical and multidimensional factor structure proposed in Savickas’ theoretical model of adaptability. The 24 selected items represent the CAAS International version (or CAAS 2.0; Porfeli & Savickas, 2012). The CAAS 2.0 demonstrated configural and metric invariance, suggesting that the instrument evaluates similarly the same constructs across countries. The internal consistency was satisfactory for the four dimensions (ranking from .74 for control to .85 for confidence) and particularly high for the adaptability total score, .92.
Recent studies showed that career adaptabilities were related to different aspects of the work and career domains, such as work engagement (Rossier, Zecca, Stauffer, Maggiori, & Dauwalder, 2012), employability skills (e.g., team work skills; de Guzman & Choi, 2013), job search self-efficacy (Guan et al., 2013), job satisfaction (Maggiori, Johnston, Krings, Massoudi, & Rossier, 2013), and work stress (Johnston, Luciano, Maggiori, Ruch, & Rossier, 2013). Furthermore, Guan and colleagues (2013) highlighted a positive relationship between career adaptabilities and future employment status. Concerning other vocational psychology construct, career adaptability was strongly related to several dimensions of vocational identity (such as in-depth career exploration and identification with career commitments; Porfeli & Savickas, 2012). Several studies also reported a relationship between personality dimensions and career adaptabilities (e.g., Rossier et al., 2012; Teixeira, Bardagi, Lassance, Magalhaes, & Duarte, 2012). Finally, the career resources were associated positively with general health, life satisfaction, and quality of life (e.g., Maggiori et al., 2013; Soresi, Nota, & Ferrari, 2012). Overall, the increasing number of studies highlights that career adaptabilities might constitute a protective factor when facing undesirable professional conditions and may represent an essential resource to successfully cope with career transitions and stressful situations, such as unemployment. More precisely, career adaptability seems to mediate the relationship between personal dispositions and contextual constraints on one hand, and vocational-, work-, and health-related outcomes on the other hand (Johnston, Luciano, et al., 2013; Maggiori et al., 2013; Rossier, 2015).
The aim of this study was to validate a brief version of the CAAS (i) to easily integrate it into large surveys in combination with a battery of others tests or in applied organizational contexts, and consequently to facilitate the implementation of the CAAS in more studies with different population and professional contexts and (ii) for career counseling and life designing practitioners to reduce administration time, and facilitate aspects of their practical work, for example, counselee follow-up (Nota & Rossier, 2015). The reduction in the number of items is hoped to preserve the excellent psychometric properties of the instrument; and for this reason, 3 items per scale seemed to be a good a priori option to consider (Byrne, 1998).
Method
Participants
The participants consisted of 2,800 French- and German-speaking adults aged between 20 and 65 years (M age= 41.2, SD = 9.4) living in Switzerland. Women represented 51.0% of the sample and German speakers 52.8%. More precisely, 2,375 participants (M age = 41.9, SD = 8.6) were a representative sample from the Swiss population aged between 25 and 55 years. These participants were contacted in the context of the first data collection wave of a longitudinal study on professional trajectories of the Swiss National Centre of Competence in Research “LIVES—Overcoming vulnerabilities” (NCCR-LIVES). To obtain younger participants, we added a convenience sample recruited from several high schools, vocational schools, and career service centers (n = 425, M age = 37.4, and SD = 12.3). This sample also included older participants.
Development of the Career Adapt-Abilities Scale–Short Form (CAAS-SF)
The CAAS-SF represents a brief version of the CAAS 2.0 of Savickas and Porfeli (2012). To reduce the total number of items to 12, a principal component analysis (PCA) with promax rotation was conducted on the 24 items of the CAAS 2.0 (N = 2,800). Examination of the scree-plot and Eigenvalues highlighted a four-factor solution coherent with the theoretical definition of career adaptability with its four career adaptabilities (Porfeli & Savickas, 2012). The Kaiser–Meyer–Olkin (KMO) value indicated an excellent sample adequacy and Bartlett’s test of sphericity was significant. All the items showed a factor loading greater than .40 on their respective factor. However, 1 item substantially loaded on more than one factor and another item loaded on the wrong dimension; these 2 items were not considered. Based on these results, we selected the 3 items with highest factor loading on each dimension. These 12 selected items constitute the CAAS-SF (see Appendix).
Measures
Career adapt-abilities scale
For this study, we used the validated French (Johnston, Broonen, et al., 2013; Rossier et al., 2012) and German (Johnston, Luciano, et al., 2013) versions of the CAAS 2.0 (Savickas & Porfeli, 2012). The 24 items of the CAAS 2.0 are equally divided into the following four subscales: concern, control, curiosity, and confidence. A global score can also be computed. Participants responded to each item using a 5-point Likert-type scale ranging from 1 = not a strength to 5 = greatest strength. The German and French versions showed excellent internal reliability for the total score, with respective values of .94 and .92. The reliabilities for the dimension scores varied between .86 and .88 for the German version, and between .75 and .86 for the French version. Regarding the brief version, the CAAS-SF contains 12 items from the CAAS 2.0 that yields a total score indicating a participant’s career adaptability. Each of the four dimensions is assessed by 3 items.
Job satisfaction inventory
We proposed a 6-item version of the JobSat Inventory of Rolland (JobSat; see Massoudi, 2009) to assess work-related satisfaction. Using a 4-point Likert-type scale, ranging from 1 = not satisfied at all to 4 = very satisfied, participants are asked to indicate their satisfaction with several aspects of their professional context (e.g., employment security and work conditions). In the present study, the reliability of this scale was of .74.
General work stress scale (GWSS)
Work-related stress was assessed with the GWSS (de Bruin & Taylor, 2005). The 9 items of this scale are scored on a 5-point Likert-type scale, ranging from 1 = never to 5 = always. In the present study, reliability was .87.
Organizational self-efficacy scale (OCCSEFF)
The perceived ability to successfully manage work-related tasks was measured using the OCCSEFF (Rigotti, Schyns, & Mohr, 2008). This 7-item scale proposed a 6-point Likert-type scale, ranging from 1 = strongly disagree to 6 = strongly agree. Reliability of this scale in this study was of .87.
Procedure
For the purpose of cross validation of the CAAS-SF, participants were randomly split in two subsamples (respectively, n = 1,407 and n = 1,393; Byrne, 2010). The two subsamples were similar with regard to gender, χ2(1) = 0.68, p > .05, and language, χ2(1) = 0.12, p > .05, distributions, and mean age, t(2798) = 1.09, p > .05. In the analyses presented in this article, language was coded 1 = German and 2 = French, gender was coded 1 = male and 2 = female, and age was measured as a continuous variable.
Analyses
The analyses were computed using the Statistical Package for Social Sciences version 21 (IBM SPSS Statistics 21, SPSS Inc., Chicago, IL) and AMOS statistical package version 19.0 (Arbuckle, 2010). First, we computed a PCA with promax rotation on the first random subsample considering the 12 items composing the CAAS-SF to verify that each item loaded on the respective factor and did not present high secondary loadings.
Second, based on the second random subsample, we performed confirmatory factor analysis (CFA), with maximum likelihood rotation, to replicate and assess the structural validity of the 12-item solution emerging from the PCA. To assess model fit, we considered multiple goodness-of-fit indices (Byrne, 2010; Kenny & McCoach, 2003), that is, χ2 per degree of freedom (χ2/df), the normed fit index (NFI), the comparative fit index (CFI), the Tucker–Lewis index (TLI), and the root mean square error of approximation (RMSEA). Generally, a model is considered to have an acceptable fit if χ2/df is equal to or lower than 5 (Bollen, 1989); while for the NFI, the CFI and the TLI values above .95 suggest a good fit (Byrne, 2010). A RMSEA below .05 indicates an adequate fit, while values between .05 and .08 reflect an acceptable fit (Browne & Cudeck, 1992).
Third, to test the measurement invariance (or measurement equivalence) across language (French vs. German) and gender (women vs. men), we realized a series of multigroup CFAs, on the total sample, adopting a “bottom-up” test procedure, from the least to the most demanding form of invariance (Davidov, Schmidt, & Schwartz, 2008). More specifically, we tested three levels of invariance: configural invariance (or equal form invariance), metric invariance, and scalar invariance (or intercept invariance). Scalar invariance is necessary to compare groups’ scores. Additional to the overall fit of each model, to assess differences in models, we used χ2 change test (Δχ2) and changes in model CFI and RMSEA fit indices (Cheung & Rensvold, 2002; Davidov et al., 2008). These indices are superior to Δχ2 because they are not affected by sample size (Cheung & Rensvold, 2002). Concerning the ΔCFI, an absolute value ranking between 0.02 and 0.01 reflects some possible differences between the models (or groups), while an absolute value of 0.01 (or smaller) suggests that the invariance hypothesis cannot be rejected. For the ΔRMSEA, currently no critical value was mentioned in the literature. However, some authors (e.g., Oreg et al., 2008) used the 0.01 threshold.
Fourth, we computed internal reliability descriptive statistics for the four dimensions and entire scale also on the total sample and we compared the scores, with reference to linguistic groups and gender, using analyses of variance (ANOVAs). Furthermore, we computed correlation analyses between, first the complete and the short versions of the CAAS and second—based on the employed sample of adults participating at the study of the NCCR-LIVES—these two versions of the CAAS and some criterion variables (i.e., occupational self-efficacy, job satisfaction, and work-related stress).
Results
Exploratory PCAs and Item Selection
Based on the first subsample (n = 1,407), we performed a PCA with promax rotation on the CAAS-SF. The scatter-plot suggested considering a four-factor solution that accounted for 73.34% of the total variance, and the first five Eigenvalues were 5.80, 1.16, 0.97, 0.87, and 0.59. The KMO value was 0.90 and the Bartlett’s test of sphericity was significant, χ2(66) = 8,376.08, p < .001. As shown in Table 1, all the items loaded substantially on to the respective factor and they did not present secondary loadings higher than 0.40.
Factor Loading of the Career Adapt-Abilities Scale–Short Form (CAAS-SF) Obtained Computing a Principal Components Analysis After a Promax Rotation.
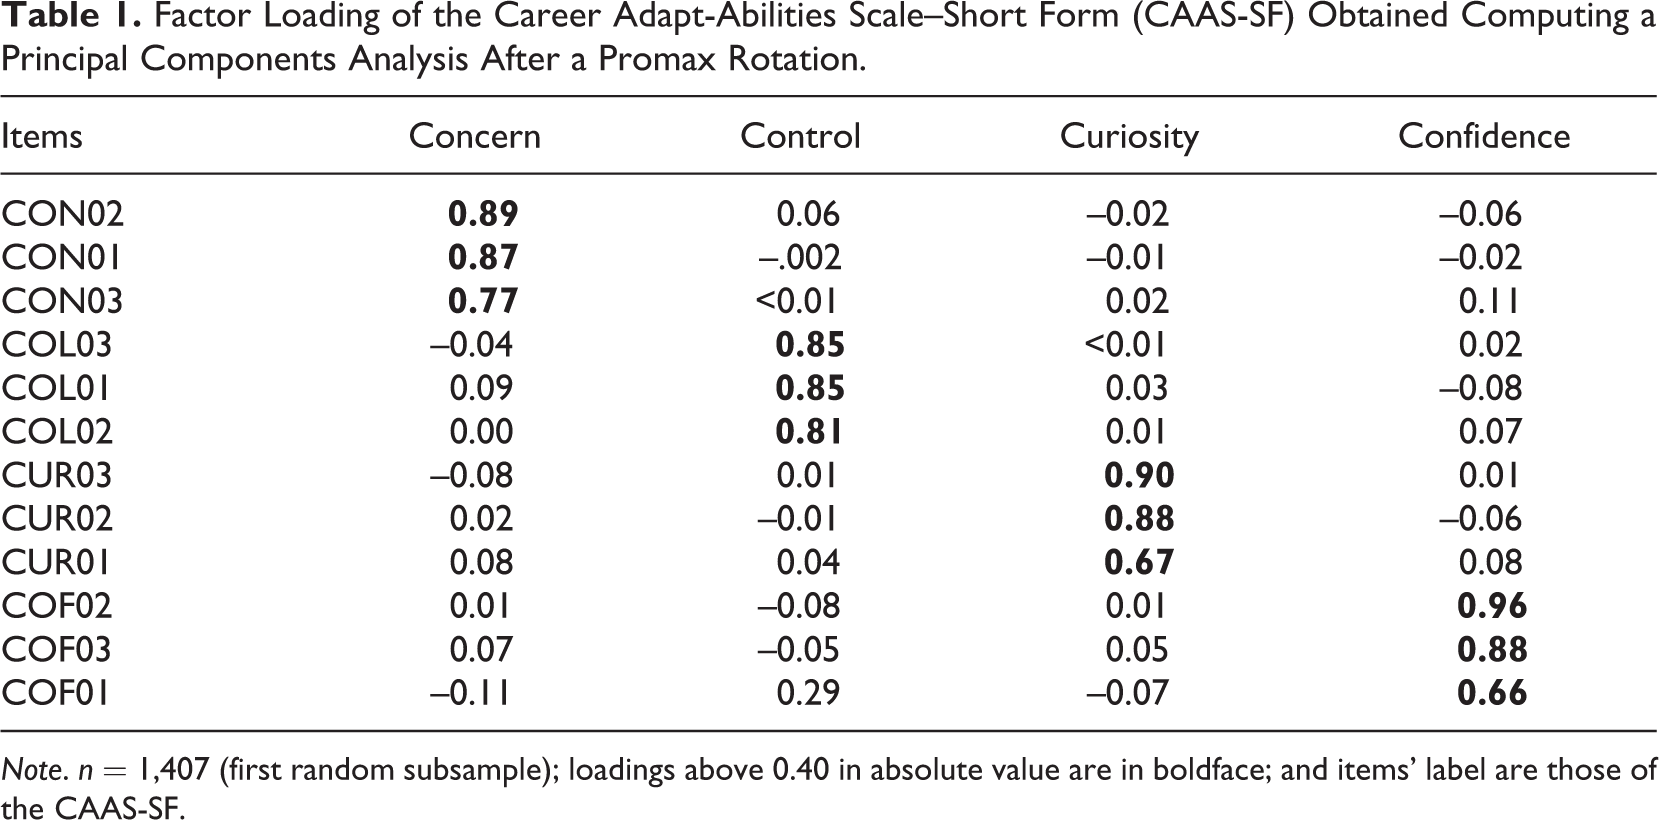
Note. n = 1,407 (first random subsample); loadings above 0.40 in absolute value are in boldface; and items’ label are those of the CAAS-SF.
Confirming the Structure of the CAAS-SF Using a CFA
Based on the second random subsample (n = 1,393), the structure underlying the CAAS-SF was examined using CFA (with maximum likelihood rotation). The tested model considered four first-order latent variables (concern, control, curiosity, and confidence) and a second-order latent construct (career adapt-ability or CAAS total score). Overall, the initial model showed a satisfactory fit with the NFI, CFI, and TLI values all above 0.95. Furthermore, the RMSEA indicated an acceptable fit. However, the χ2/df was slightly higher than 5. More specifically, χ2(50) = 333.01, χ2/df = 6.66, NFI = 0.968, CFI = 0.964, TLI = 0.953, and RMSEA = 0.064. In the following step, we considered two covariances between the errors terms associated with a modification index greater than 10. The adjusted model fitted the data very well: χ2(48) = 209.85, NFI = 0.976, CFI = 0.980, TLI = 0.972, and RMSEA = 0.049. Moreover, χ2/df decreased to 4.37. The loadings from the items to the corresponding factor varied between 0.63 and 0.94 and from the factors to career adaptability the coefficients ranged between 0.73 and 0.88 (see Figure 1).

CFA (adjusted model) based on second random subsample (n = 1,393). CFA = Confirmatory Factor Analysis.
Measurement Invariance of the CAAS-SF Across Language and Gender
Using the total sample, we tested measurement invariance of the 4-factor model (with covariances included), analyzed in the previous CFA, across French and German speakers and across gender (see Table 2). With reference to language, the configural invariance model showed satisfactory fit indices, confirming that the factor structure was similar across the two language groups. Comparable results were obtained for the metric invariance model, with a χ2/df of 4.18, a RMSEA lower than 0.04, and CFI, NFI, and TLI values higher than 0.97. Regarding the differences in fit between configural and metric models, the Δχ2 test was significant, Δχ2(8) = 25.250, p < .001. However, as indicated previously, this test suffers from some problems in determining model fit, notably with large samples. By contrast, differences in RMSEA and CFI met the limit of 0.01 and suggested no or a negligible difference between the models in terms of fit. Finally, the results for the scalar invariance model emphasized a satisfactory fit to the data. Once again, the Δχ2 test was significant. Nevertheless, the comparative fit indices, ΔCFI and ΔRMSEA, were below 0.01 and highlighted that imposition of additional constraints (i.e., factor loading to be the same across groups) did not imply a significant decrease in the model fit. Thus, the CAAS-SF seemed to reach cross-language invariance. However, when we consider the more restrictive criteria (i.e., ΔCFI ≤ 0.002) proposed by Meade, Johnson, and Braddy (2008), the model did not meet the threshold. Consequently, after inspecting the parameters, we identified two potential non-invariant values (i.e., CUR01 and CUR03). More precisely, French speakers reported a higher intercept on both items. After analyzing the contribution of each item and according to these more restrictive criteria, the curiosity subscale of the CAAS-SF does not reach full scalar invariance.
Fit Measures for Multigroup Confirmatory Factor Analysis of the Career Adapt-Abilities Scale–Short Form, Verifying Measurement Invariance Across Language Groups and Gender.

Note. NFI = normed fit index; TLI = Tucker–Lewis Index; CFI = comparative fit index; RMSEA = root mean square error of approximation.
***p < .001.
Concerning men and women, except for χ2 /df that was above 6, overall the configural invariance model showed a fit to the data that was acceptable. The RMSEA was below 5 and the NFI, TLI, and CFI values were higher than 0.95. Thus, the configural invariance of the hierarchical four-factor model was confirmed. The indices emphasized by the metric invariance model demonstrated a satisfactory model fit. The comparison between configural and metric models in terms of fit suggested negligible differences. In fact, Δχ2 test was nonsignificant, and ΔCFI and ΔRMSEA were at 0.001. Finally, for the scalar invariance, except for the χ2/df (slightly higher than 5), the model presented a good fit. Regarding the differences in fit indexes between the metric and the scalar models, the values were 0.001 and 0.003 for ΔRMSEA and ΔCFI, respectively, thus meeting the criteria of invariance. Overall, these results supported measurement invariance of the CAAS-SF structure between women and men. Nevertheless, considering the ΔCFI value for the scalar model and the Meade et al. (2008) criteria, we repeated the analyses releasing 1 item (i.e., CUR02) on which women scored higher than men. The results showed a ΔCFI of 0.001 from the metric model that supports partial scalar invariance.
Descriptive Statistics
Considering the established measurement invariance of the 12-item version (based on the thresholds proposed by Cheung & Rensvol, 2002), we compared the two linguistic groups. The results from a series of ANOVAs yielded significant differences regarding concern and curiosity dimensions. In fact, German-speaking participants reported a higher level on concern, F(1, 2798) = 4.19, p < .05, and η2 < .01 but a lower level on curiosity, F(1, 2798) = 33.11, p < .001, and η2 = .01 Although the F value was statistically significant, both effect sizes are too small to suggest any meaningful difference between the linguistic groups on concern and curiosity. Concerning gender, ANOVAs highlighted no differences between women and men. In other words, women and men showed similar mean values on total and dimensions scores of the CAAS-SF. Furthermore, the results highlighted the absence of significant differences between women and men in both linguistics groups (see Table 3). Moreover, based also on the total sample (N = 2,800), the results revealed that age was correlated with the concern, r = −.07, and control, r = .07, dimensions. However, in terms of effect size, these associations were not meaningful. Furthermore, correlational analyses showed that the corresponding dimensions in 12-item and 24-item versions were strongly associated, that is, for concern, r = .95; for control, r = .93; for curiosity, r = .93; and for confidence, r = .92. The adaptability total score of the two versions were highly correlated, r = .98, and suggested that the CAAS-SF can represent a pertinent and adequate alternative to the 24-item version. Finally, we tested the association between the two versions of the CAAS on one hand, and some professional variables on the other hand (n = 1,826). For the CAAS 2.0 (total and dimensions scores) correlation coefficient (r) ranging between .13 and .23 with job satisfaction, between −.20 and −.07 with work-related stress, and between .35 and .48 with occupational self-efficacy. For the CAAS-SF (total and dimensions scores), the coefficients varied between .13 and .20 with job satisfaction, between −.14 and −.06 with work-related stress, and between .33 and .46 with occupational self-efficacy.
Descriptive Statistics for the French and German Version of the CAAS-SF.
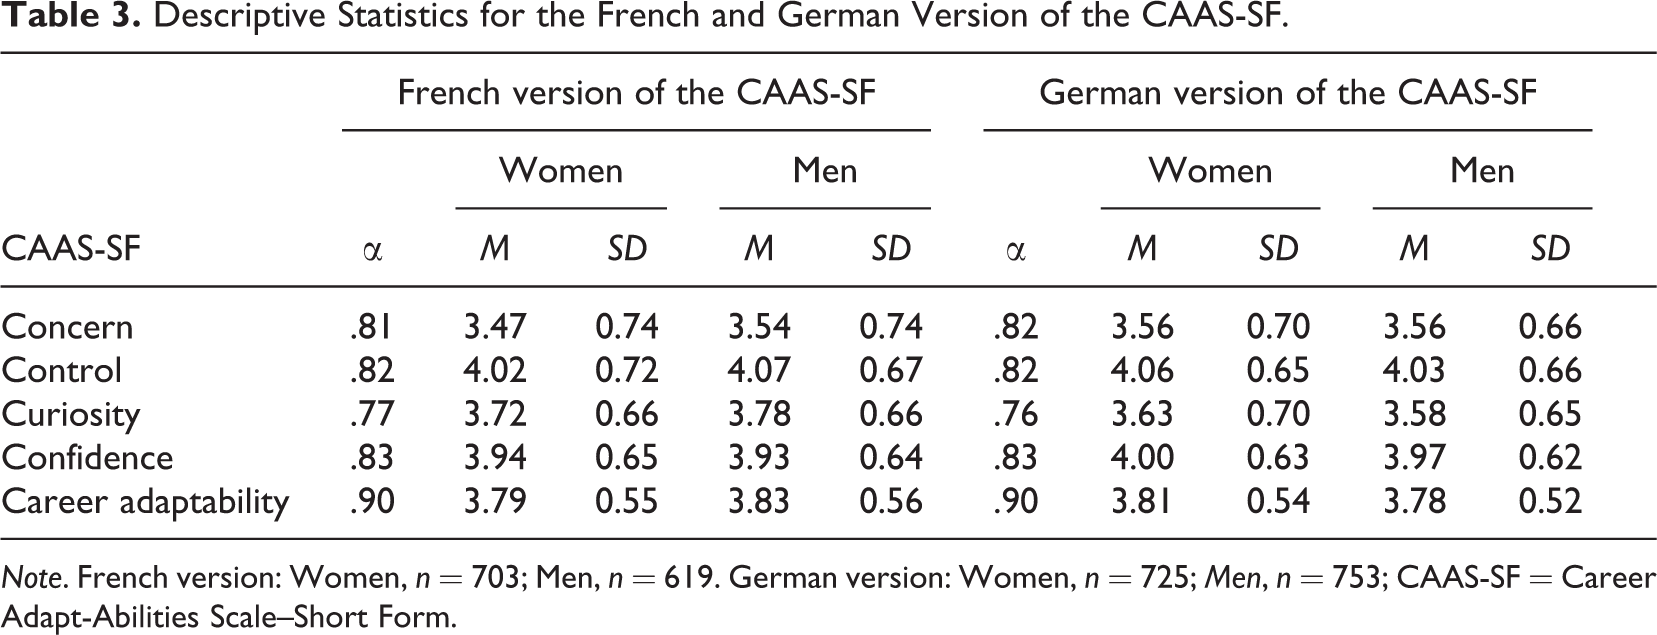
Note. French version: Women, n = 703; Men, n = 619. German version: Women, n = 725; Men, n = 753; CAAS-SF = Career Adapt-Abilities Scale–Short Form.
Discussion
Overall, although the questionnaire length was reduced by 50%, the CAAS-SF showed psychometric and structural properties close to those of the CAAS 2.0. Based on the first random subsample, PCA highlighted for the 12 items representing the CAAS-SF a four-factor solution coherent with the 24-item version and the career adaptability theoretical background (Savickas, 2005; Savickas & Porfeli, 2012). Using the second random subsample, CFAs indicated good fit indices for the adjusted hierarchical four-factor model of the 12-item version. However, even though the model fit correctly to the data, this is not sufficient to guarantee the measurement invariance of the tested model.
Measurement invariance represents a central issue for studies investigating possible differences between groups (Steinmetz, Schmidt, Tina-Booh, Wieczorek, & Schwartz, 2009). This equivalence is not only important when comparing different cultural groups but also for group comparison (e.g., gender or age groups) within the same cultural context to reliably interpret potential differences (Vandenberg & Lance, 2000). For this purpose, we conducted multigroup confirmatory analyses comparing, first the two languages and second men and women. Overall, both across French- and German-speaking participants and between women and men, the different models (i.e., configural, metric, and scalar invariances) showed acceptable to good fit to the data. The goodness-of-fit indices and the tests of differences in fit between adjacent models—based on Cheung and Rensvold’s (2002) suggestions—supported measurement invariance indicating that the resources’ latent means can be meaningfully compared and interpreted across the two subsamples. In fact, even the χ2 difference test was significant, the incremental indices (i.e., ΔCFI and ΔRMSEA) met the accepted threshold of 0.01. Furthermore, as indicated previously, the χ2 difference test can be affected by large sample sizes. Overall, the CFA results demonstrated that the four-factor structure fits in two random subsamples and meets measurement invariance in two different linguistic regions of Switzerland and between women and men. However, with a more restrictive ΔCFI threshold (0.002; see Meade, Johnson, and Braddy, 2008), we have to release 1 curiosity item for gender to meet the scalar invariance. For the linguistic groups, we have to release 2 curiosity items on the same 3-item factor to meet scalar invariance. Nevertheless, it is important to stress that overall on the total score and dimensions scores, the different subgroups showed a similar distribution, suggesting that these more restrictive threshold might be too limiting.
With regard to Cronbach’s’ α, internal consistency of the CAAS-SF was satisfactory for the dimensions’ scores and excellent for the adaptability total score. Values were by and large consistent and comparable with previous research based on the CAAS 2.0 (see Savickas & Porfeli, 2012). Moreover, with reference to the adaptability total score and the respective dimensions, the CAAS-SF and CAAS 2.0 were strongly correlated, and the two versions showed a similar pattern of relationships with other professional variables (such as job satisfaction and work-related stress). The results suggest that the shorter version can be used as a reliable alternative to the CAAS 2.0.
In further studies, it would be important to test the four-factor structure stability and the measurement invariance of the 12-item solution in additional linguistic regions or with reference to other population characteristics (such as employment status). Furthermore, despite the strong correlation with the 24-item version, future studies need to evaluate the relationship between the CAAS-SF, and professional paths and individuals’ characteristics (such as personality).
To conclude, the CAAS-SF appears to be a psychometrically sound instrument to measure adaptabilities resources. The respective scales of the CAAS 2.0 and of the CAAS-SF were strongly correlated and the 12-item version showed almost comparable reliability and measurement invariance (for instance, across gender). Thus, the CAAS-SF could represent an economical and pertinent alternative to the CAAS 2.0 to assess individuals’ career adaptability. Notably, a briefer version could be suitable in studies, such as panel surveys, where large batteries of instruments are proposed to reduce administration time and participants’ lack of motivation (Meriac, Woehr, Gorman, & Thomas, 2013) or in organizational settings, where generally participants complete the questionnaires during company time (Stöber & Joormann, 2001). Finally, due to its brevity, the CAAS-SF could be an excellent supplement for career practitioners to assess and follow-up counselees’ career adaptabilities.
Footnotes
Appendix
Acknowledgment
This publication benefited from the support of the Swiss National Centre of Competence in Research LIVES—Overcoming vulnerability: Life course perspectives, which is financed by the Swiss National Science Foundation. The authors are grateful to the Swiss National Science Foundation for its financial assistance.
Declaration of Conflicting Interests
The author(s) declared no potential conflicts of interest with respect to the research, authorship, and/or publication of this article.
Funding
The author(s) disclosed receipt of the following financial support for the research, authorship, and/or publication of this article: This publication benefited from the support of the Swiss National Centre of Competence in Research LIVES–Overcoming vulnerability: Life course perspectives, which is financed by the Swiss National Science Foundation.